
The largest beauty region grows on skincare and online sales
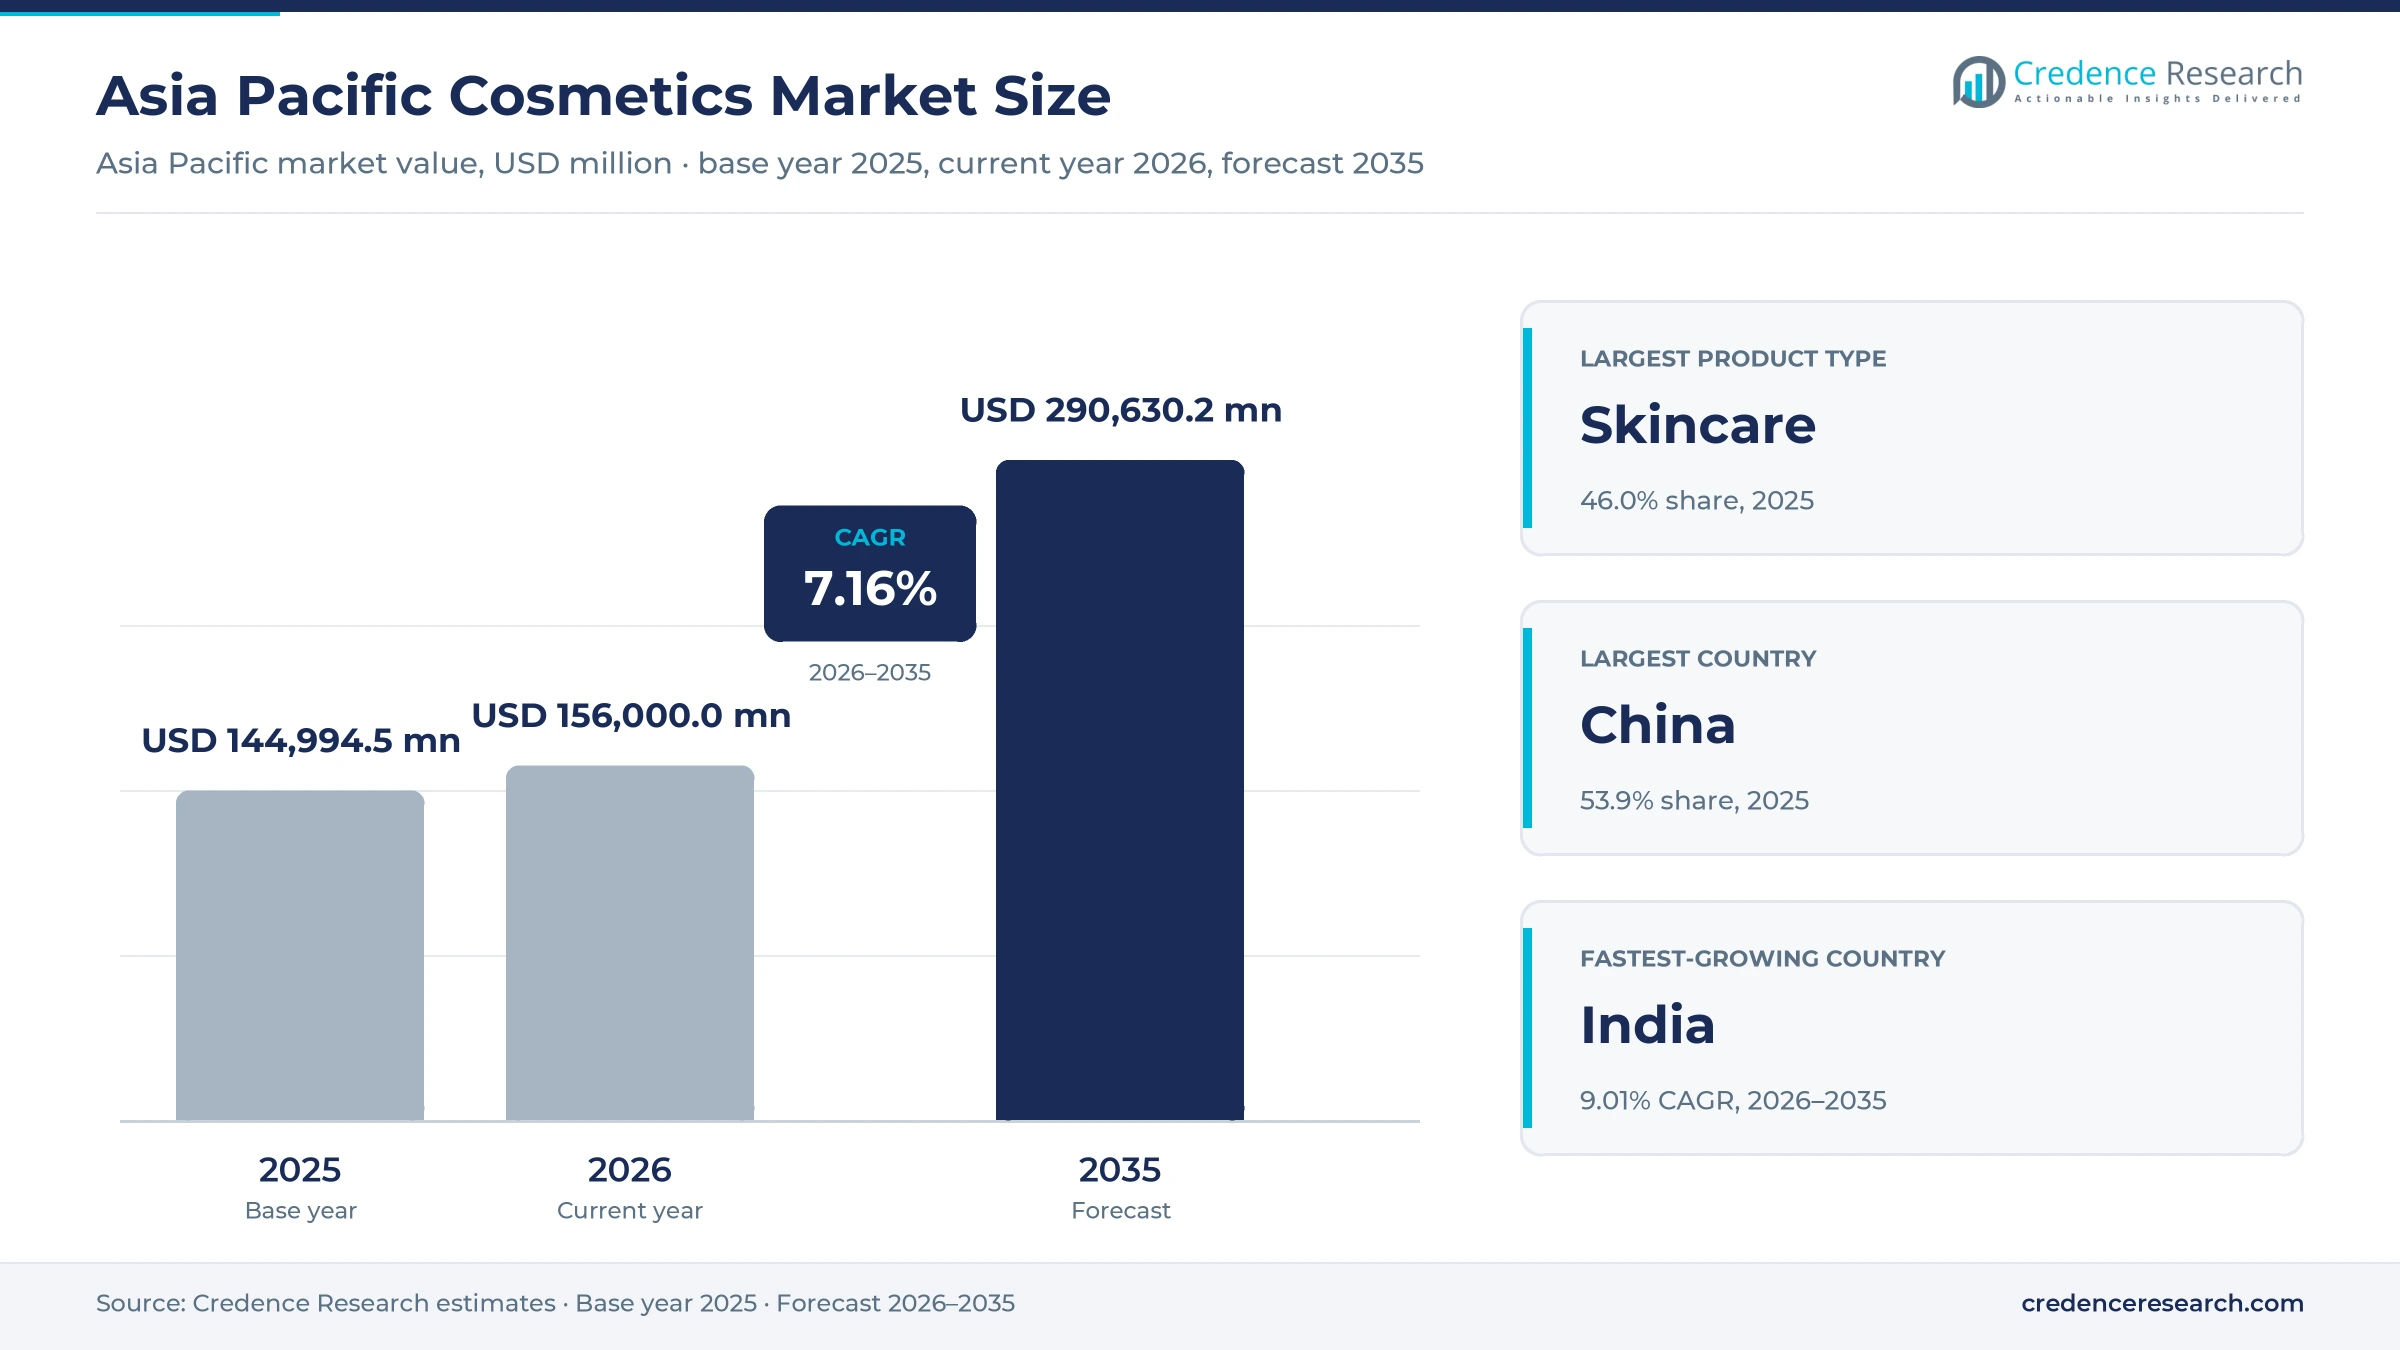
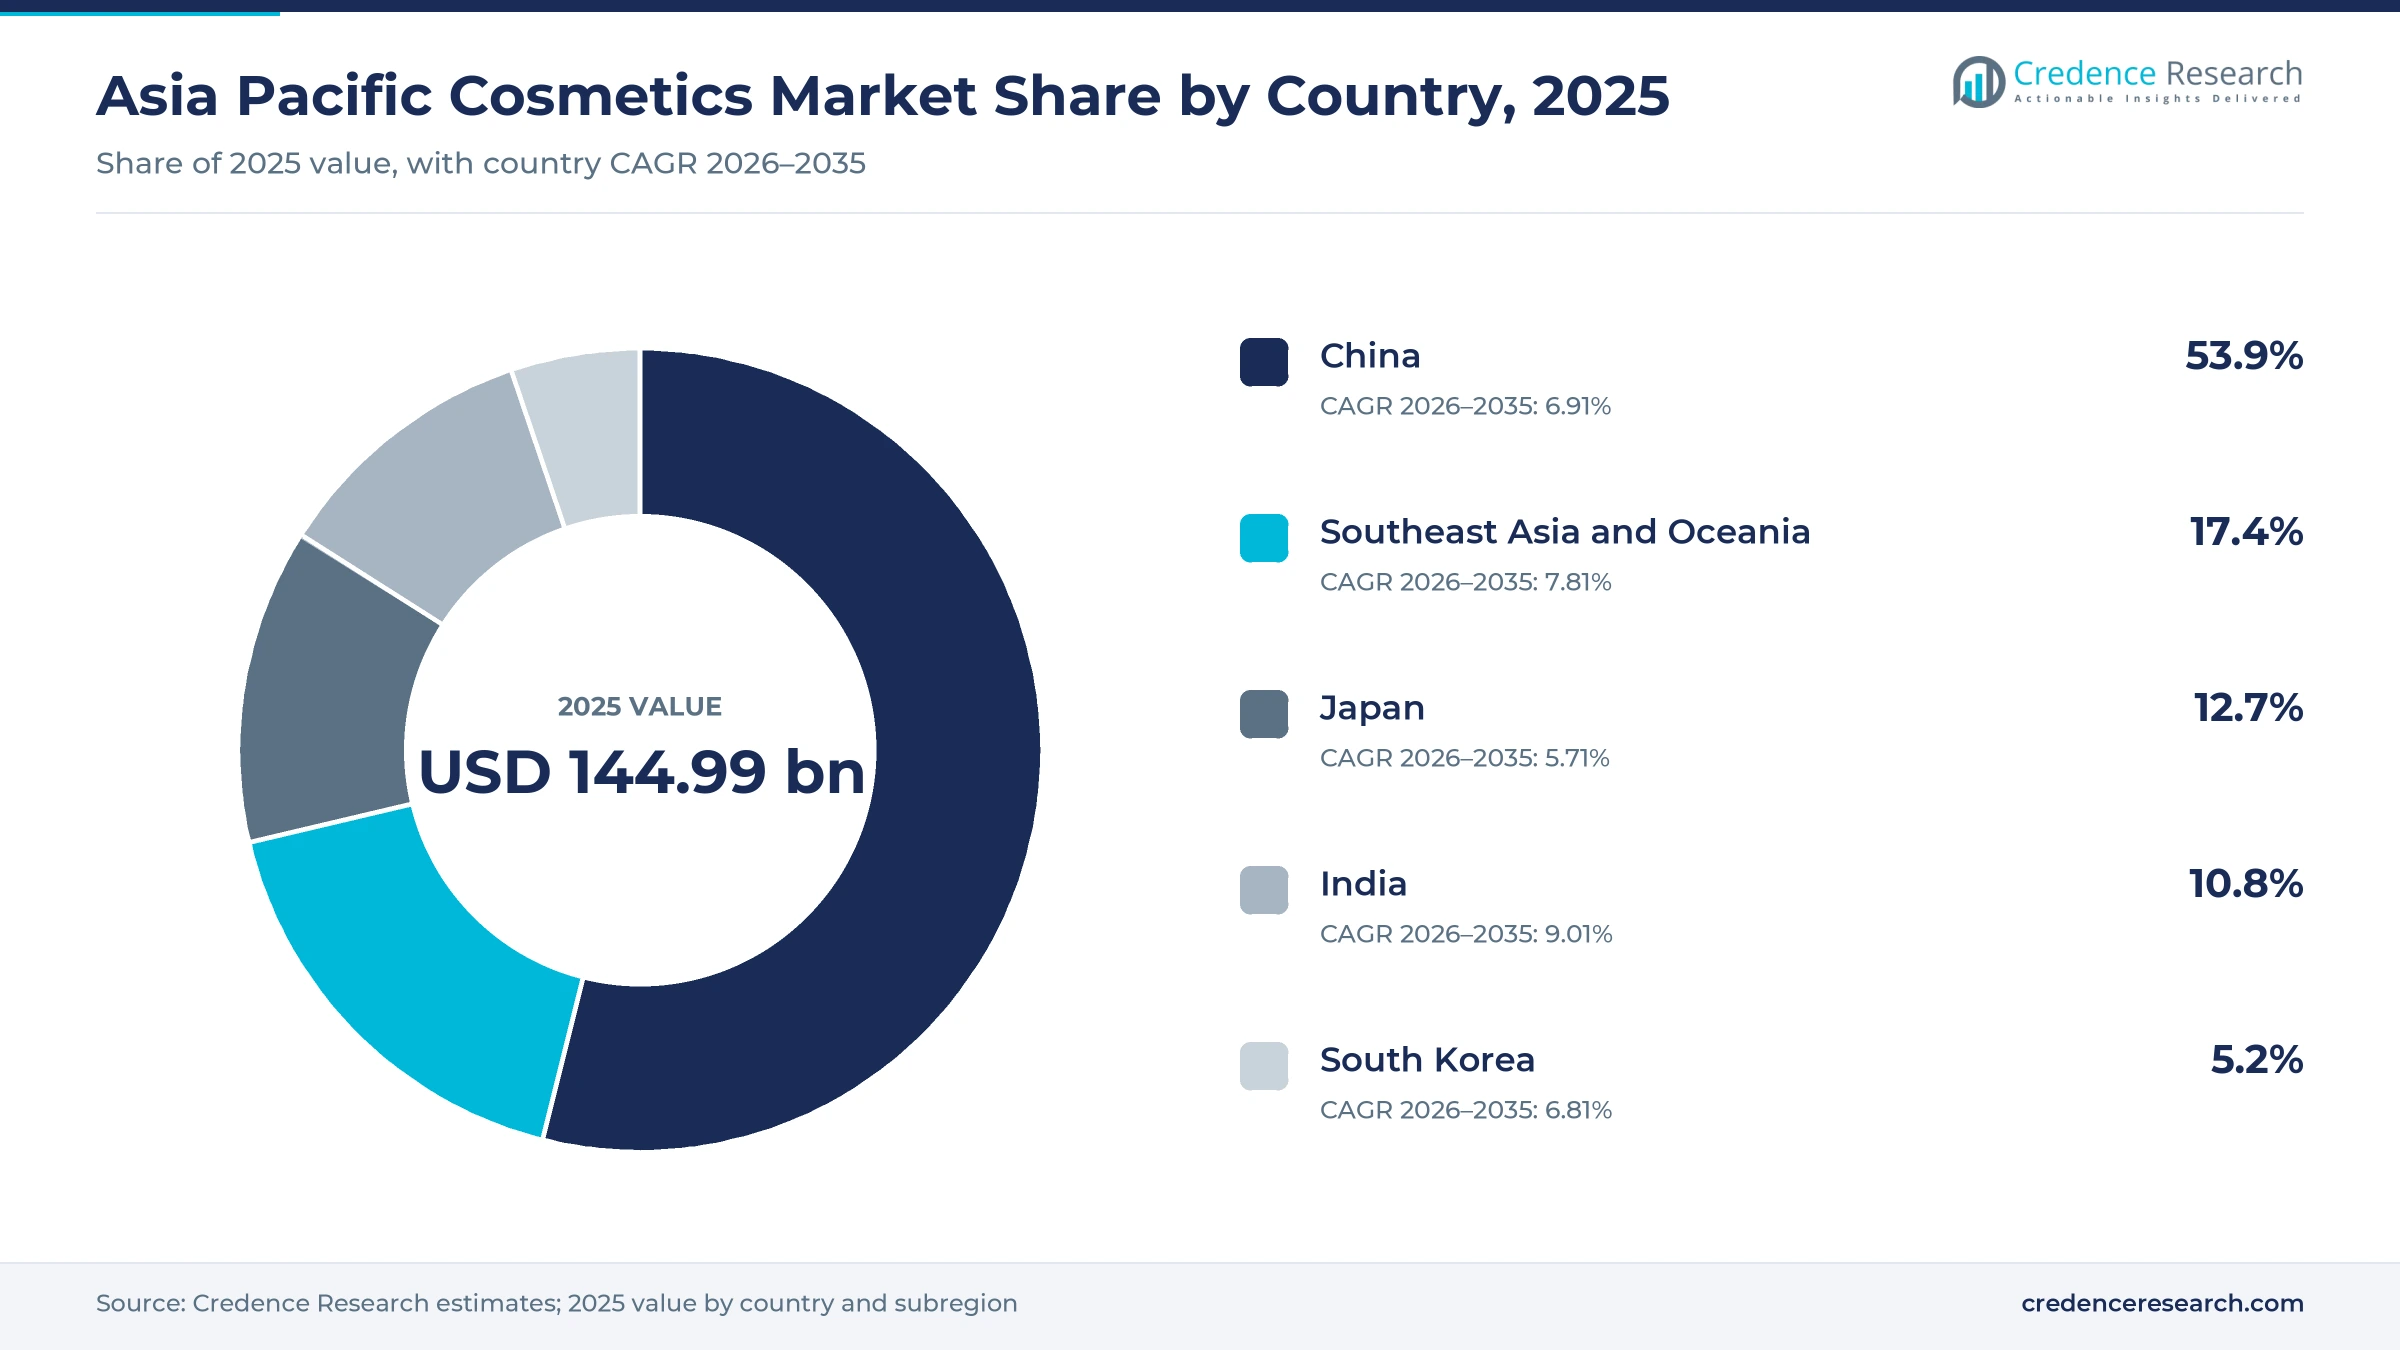
The Asia Pacific cosmetics market was valued at USD 144.99 billion in 2025 and is projected to increase from USD 156.00 billion in 2026 to USD 290.63 billion by 2035, registering a CAGR of 7.16% during 2026–2035. Demand comes from women, men, young adults and families who buy skincare, haircare, makeup, fragrances and body care for daily routines, treatment and gifting. China held the largest share, 53.9% in 2025, because its large urban population supports deep retail and online beauty networks. India is the fastest-growing country at 9.01% a year, as incomes rise and digital-first brands reach smaller cities. Policy also changed in September 2025, because India cut the goods and services tax on shampoo, hair oil and talcum powder from 18% to 5%. As a result, everyday personal care became cheaper, while premium brands kept investing in ingredient science and online stores across the region.
Which beauty and personal care sales are counted?
The estimate measures the value of skincare, haircare, color cosmetics, fragrances and deodorants and bath and body care sold in China, Japan, India, South Korea and Southeast Asia and Oceania. It counts sales to consumers through brand websites, beauty marketplaces, specialty stores, department stores, pharmacies and grocery outlets. Values are stated in USD million at current prices and are assigned to the country where the product is sold.
The estimate excludes salon and spa services, aesthetic procedures, oral care, raw ingredients and contract manufacturing fees. The value chain runs from ingredient suppliers and contract makers through brand owners, distributors and retailers to consumers who buy for daily care, treatment routines, travel and gifting.
Asia Pacific Cosmetics Market Insights
- The market was valued at USD 144.99 billion in 2025 and is projected to reach USD 290.63 billion by 2035, registering a CAGR of 7.16% during 2026–2035.
- China held 53.9% of regional value in 2025, because cosmetics retail sales there rose 5.1% to 465.3 billion yuan that year.
- Skincare led with 46.0% of 2025 value, supported by serums, sunscreens and barrier-care products bought for daily routines.
- South Korea exported a record $11.43 billion of cosmetics in 2025, up 12.3%, with shipments reaching 202 countries, according to official data.
- L'Oréal agreed on June 18, 2026 to acquire a majority stake in Innovist, owner of the Bare Anatomy and Chemist at Play brands in India.
Skincare, mass tiers and women buyers lead regional value
Why does skincare lead product value?
Based on product type, the market is categorized into skincare, haircare, color cosmetics, fragrances and deodorants and bath and body care. Skincare led with 46.0% of 2025 value, because multi-step routines built around skin care products are common across East Asia. Fragrances and Deodorants grow fastest at 7.68% a year, as younger buyers in China, India and Southeast Asia add scent to daily grooming.
How fast are masstige brands gaining?
Based on price tier, the market is categorized into mass, masstige, premium and luxury products. Mass led with 47.0% of 2025 value, because supermarkets, pharmacies and marketplaces sell most everyday items at low prices. Masstige grows fastest at 8.01% a year, as buyers trade up from mass items to science-led brands priced below luxury beauty brands.
Which customer groups buy the most?
Based on customer type, the market is categorized into women consumers, men consumers, teen and young adult consumers and family and children's care buyers. Women Consumers led with 68.0% of 2025 value, because they buy the widest range of skincare and makeup. Men Consumers grow fastest at 8.13% a year, as grooming, sunscreen and cleanser use spreads among urban men.
How do beauty products reach buyers in the region?
Based on distribution channel, the market is categorized into brand e-commerce platforms, multi-brand beauty marketplaces, specialty beauty retailers, department stores and pharmacies and grocery and convenience retail. Multi-Brand Beauty Marketplaces led with 31.0% of 2025 value, because large platforms combine broad ranges with live selling. Brand E-Commerce Platforms grow fastest at 8.28% a year, as brands sell direct and collect first-party data.
| Segment Group | Leading Sub-segment | Share, 2025 | Fastest-growing Sub-segment | CAGR, 2026–2035 |
|---|---|---|---|---|
| By Product Type | Skincare | 46.0% | Fragrances and Deodorants | 7.68% |
| By Price Tier | Mass | 47.0% | Masstige | 8.01% |
| By Customer Type | Women Consumers | 68.0% | Men Consumers | 8.13% |
| By Distribution Channel | Multi-Brand Beauty Marketplaces | 31.0% | Brand E-Commerce Platforms | 8.28% |
Request a Free Sample
Fill in your details and we'll send you a free sample report.
- Sample data tables & charts
- Research methodology
Cities, digital discovery and efficacy claims lift demand
How do dense cities expand daily beauty routines?
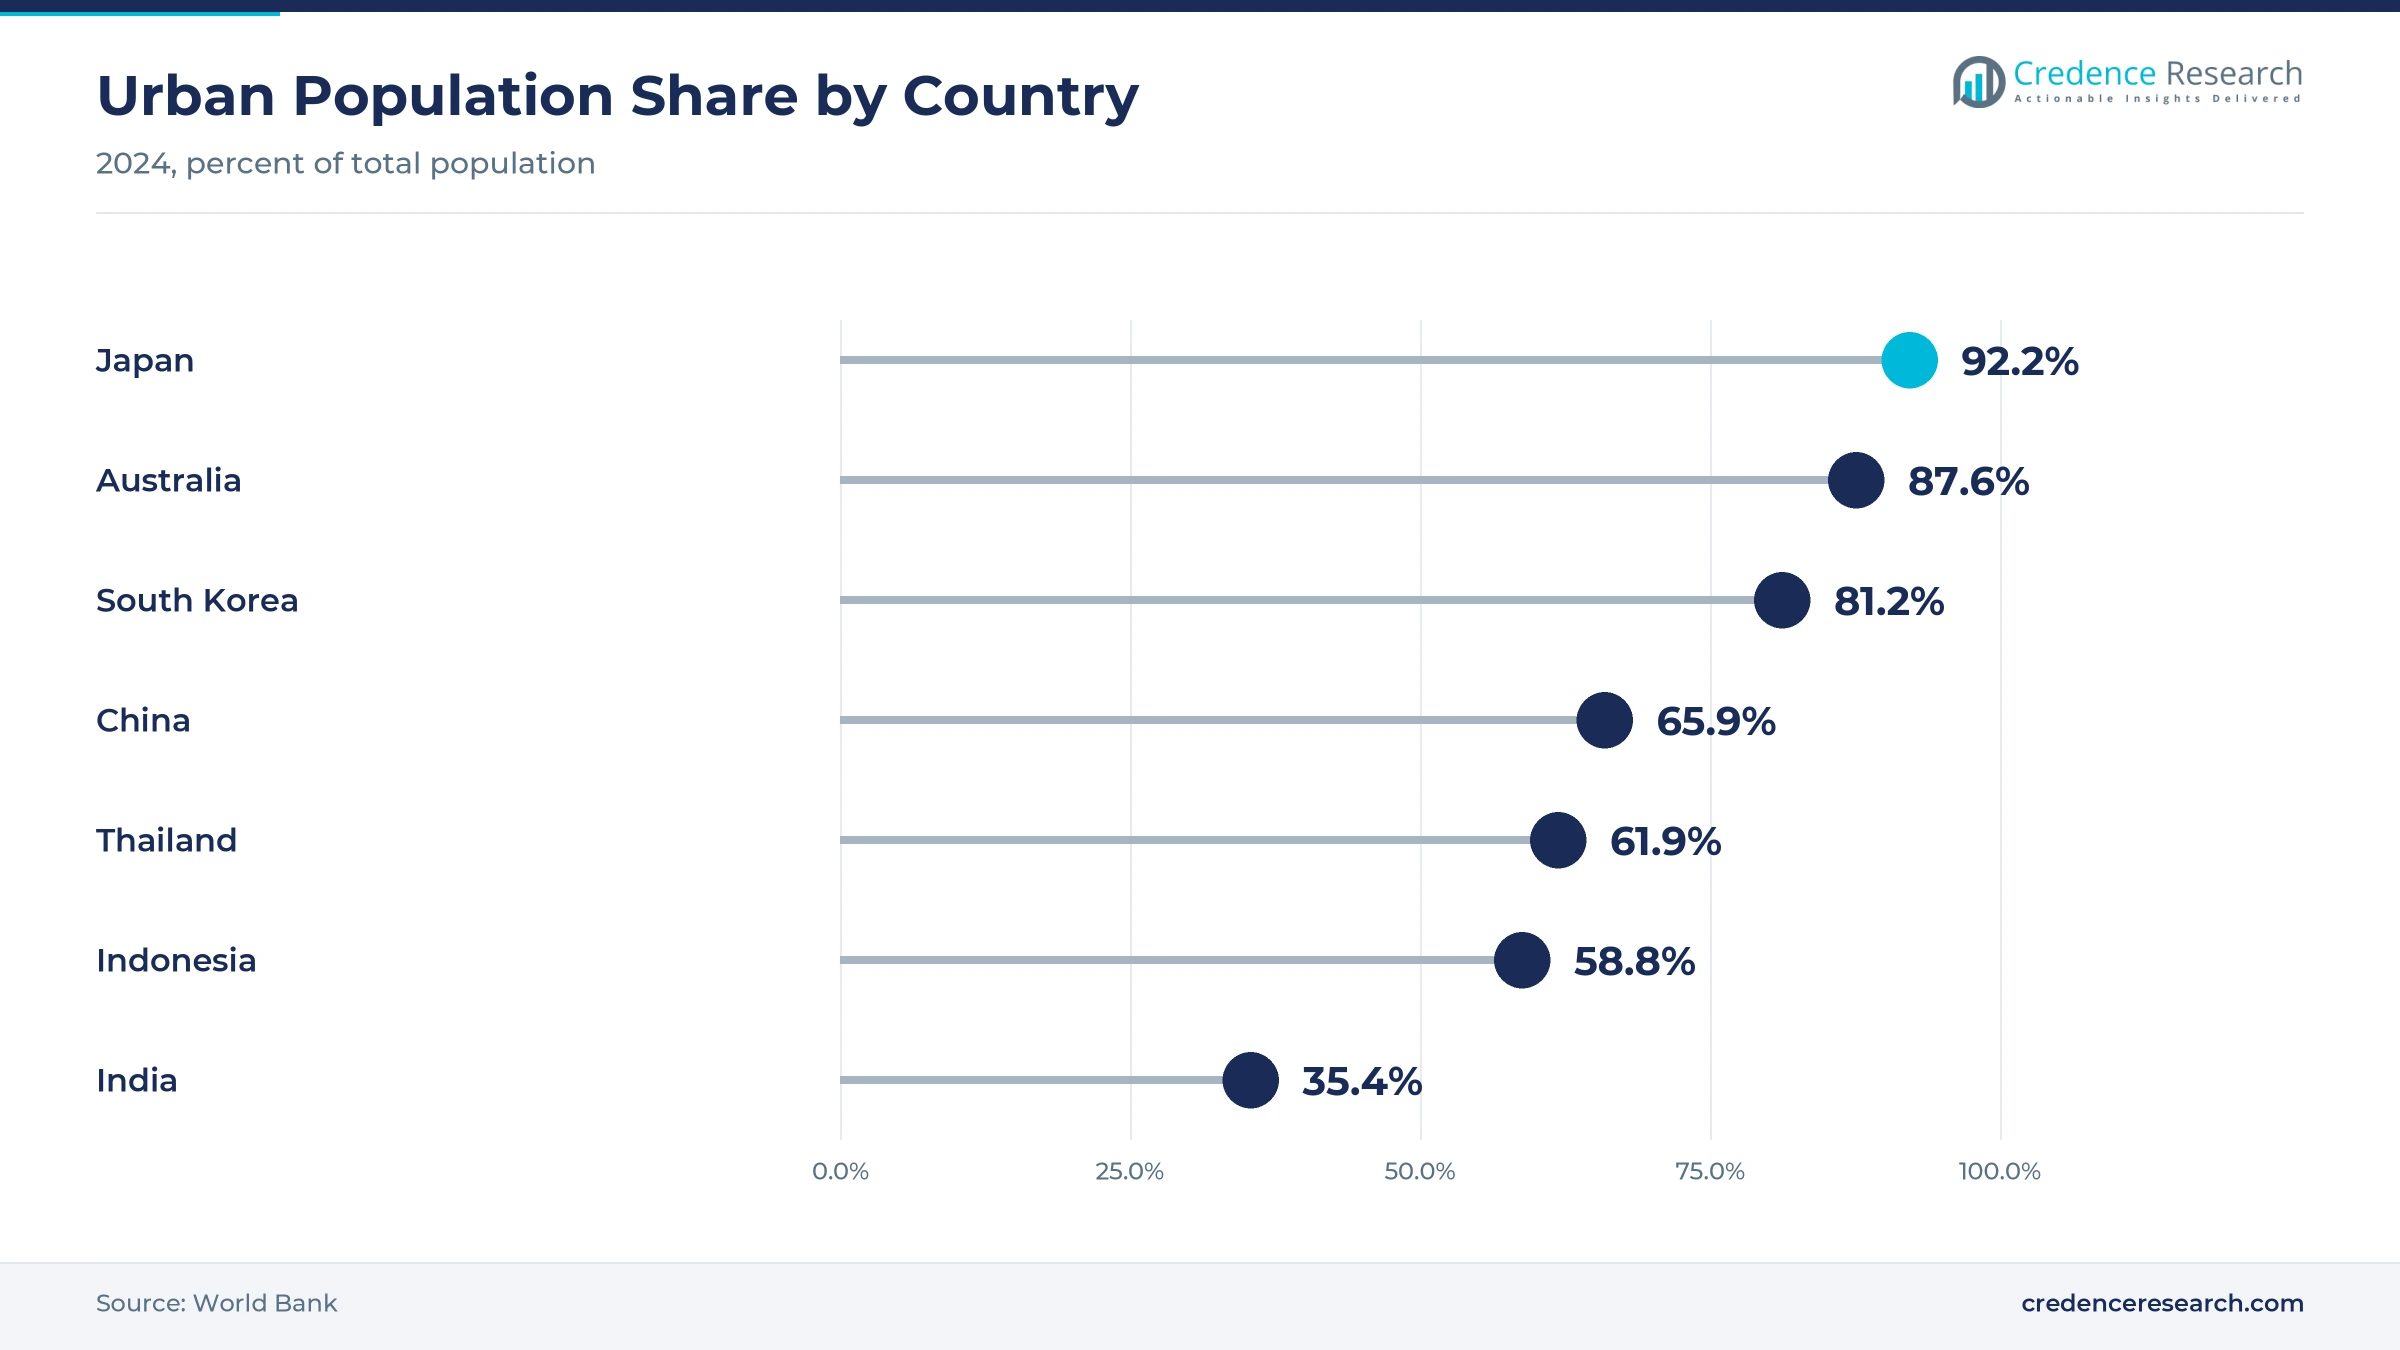
Urban consumer density drives demand, because city dwellers have more income, more retail access and longer daily routines. Japan was 92.2% urban in 2024, South Korea 81.2% and China 65.9%, according to World Bank data. China's cosmetics retail sales rose 5.1% to a record 465.3 billion yuan in 2025, as reported by Jing Daily, citing official statistics, which reversed a decline in 2024. India was only 35.4% urban in 2024, which leaves a long runway as more households move to cities. As a result, skincare holds 46.0% of 2025 value, because urban buyers layer cleansers, serums and sunscreens every day.
Why does digital discovery lift beauty spending?
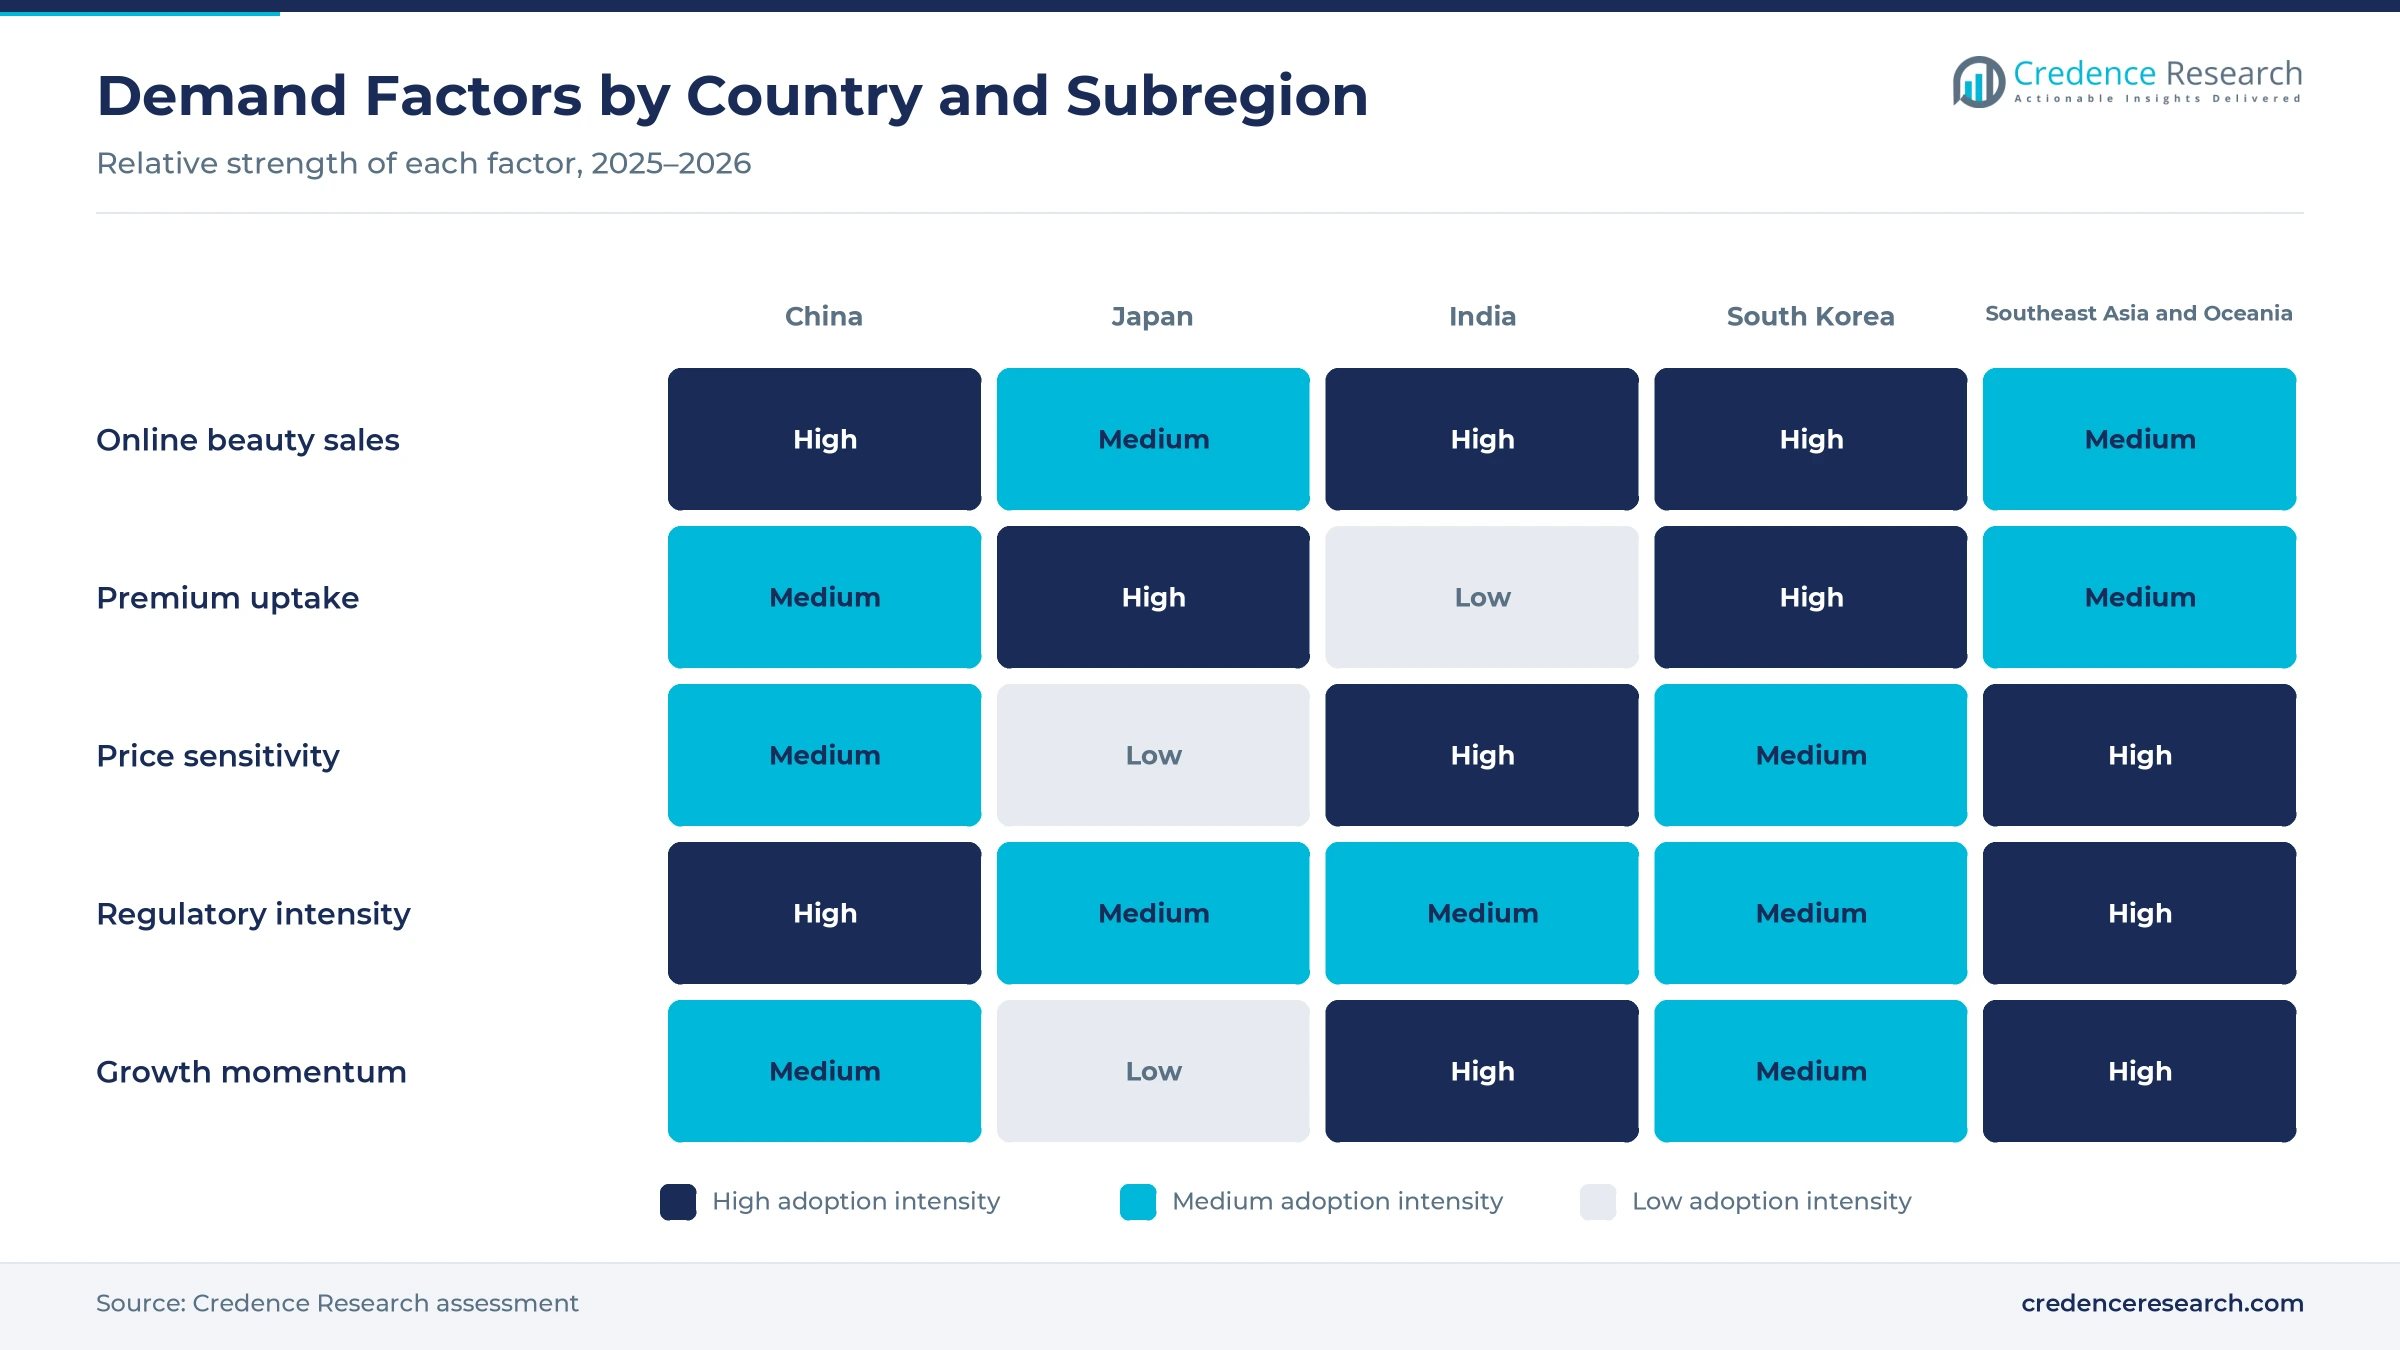
Digital beauty discovery and commerce lift demand, because social video, reviews and marketplaces let buyers compare ingredients and prices quickly. Japan's online sales of cosmetics and pharmaceuticals reached about 1.015 trillion yen in 2024, up 4.54%, with an online ratio of 8.82%, according to the Ministry of Economy, Trade and Industry. Amorepacific said on July 30, 2026 that its online and multi-brand store channels each grew at double-digit rates in South Korea. Innovist, the Indian brand house that L'Oréal agreed to buy in June 2026, sells through its own sites, e-commerce and quick commerce. Therefore, brand e-commerce platforms are the fastest-growing sales channel in the regional demand model.
How do efficacy claims push buyers toward higher tiers?
Efficacy and premium product sophistication drive value, because buyers now read ingredient lists and pay more for proven results. China's National Institutes for Food and Drug Control approved 20,162 special cosmetics registrations in 2025 and recorded 511,974 general cosmetics filings, according to its 2025 review report. The same report counted 169 new ingredient filings, which shows the pace of formula innovation. South Korea's skin care exports reached $8.54 billion in 2025, or nearly 75% of its cosmetics exports, which reflects demand for function-led formulas. In turn, masstige brands grow fastest among price tiers at 8.01% a year, as buyers trade up from mass items.
Why do lower taxes and new brands boost demand in India?
Lower taxes and new brands boost demand in India, which is the fastest-growing country market in the regional model. The GST Council cut the tax on shampoo, hair oil, talcum powder and face powder from 18% to 5% from Sept. 22, 2025, according to All India Radio. The cut made hair care and other daily items cheaper for millions of households. Nykaa ran 313 stores by March 31, 2026, after adding 26 in one quarter, and expected beauty order value growth in the late twenties percent. As a result, global and local brands are expanding shelf space and online reach in smaller Indian cities.
K-beauty exports and brand deals reshape the region
How is the rise of K-beauty exports reshaping supply?
The rise of K-beauty exports is reshaping supply, because Korean brands now compete in almost every regional market. South Korea exported a record $11.43 billion of cosmetics in 2025, up 12.3%, according to Ministry of Food and Drug Safety data. Shipments reached 202 countries, up from 172 a year earlier, and Japan bought $1.1 billion while China bought $2 billion. Amorepacific said in July 2026 that Laneige, Aestura and COSRX drove growth in Japan, while North Asia sales declined because of channel optimization. As a result, Korean skincare gains shelf space in Japan and Southeast Asia, while Chinese buyers increasingly favor domestic brands.
Why is the shift in tourist beauty spending notable?
Tourist beauty spending is shifting, because visitor flows to Japan now swing with politics and exchange rates. Japan received a record 42.7 million foreign visitors in 2025, and their spending rose 16.4% to 9.5 trillion yen, according to Japan Tourism Agency data. Shopping accounted for 2.5 trillion yen, up 6.4%, which shows that cosmetics purchases by visitors grew more slowly than total spending. Shiseido reported in May 2026 that its first-quarter sales in Japan fell 4%, as fewer Chinese tourists arrived. Therefore, Japan grows slowest in the region at 5.71% a year, and brands are shifting effort toward local buyers and online sales.
Can Southeast Asia open the next growth wave?
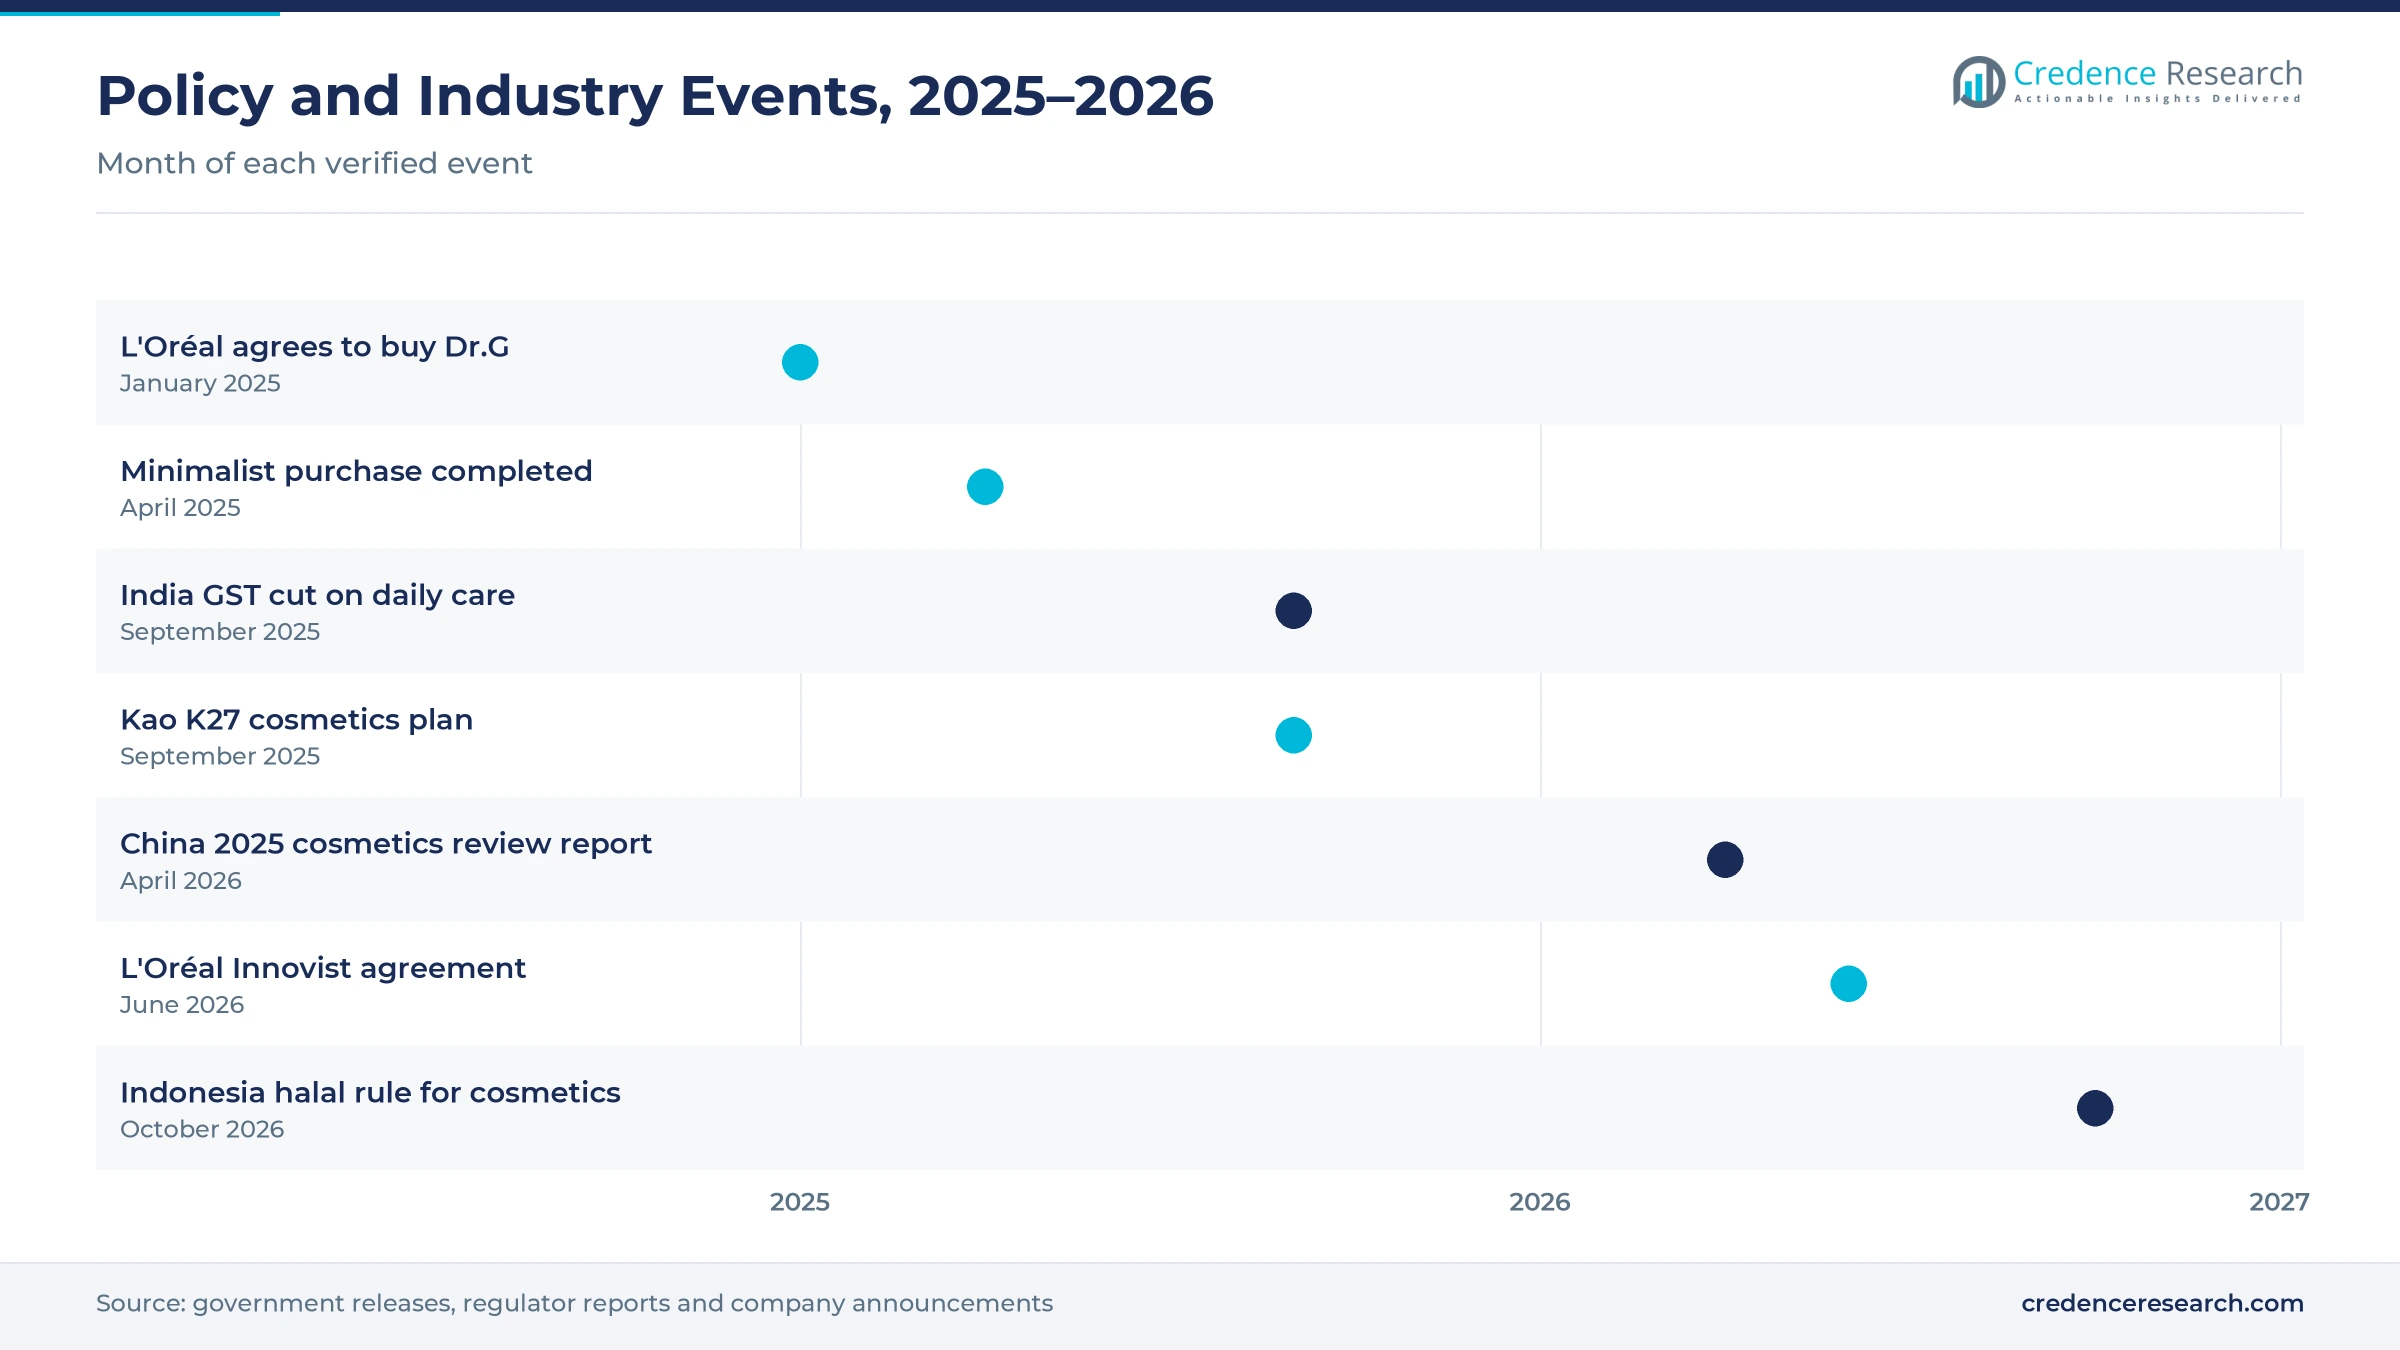
Southeast Asia and Oceania offer a clear opening, because young populations and rising city incomes support new beauty habits. The subregion held 17.4% of 2025 value and grows at 7.81% a year. Indonesia was 58.8% urban and Vietnam 38.5% urban in 2024, which leaves room for more retail reach. Kao announced in September 2025 a plan to lift Kanebo and Kate sales in Thailand by 150% by 2027, and Sofina sales in Asia outside Japan by about 50%. Indonesia also requires halal certification for cosmetics from October 2026, so certified brands can win trust with the country's large Muslim population.
Can acquisitions of digital-native brands open new value?
Acquisitions of digital-native brands open new value, because global groups want fast-growing, science-led labels with loyal online buyers. L'Oréal agreed in January 2025 to acquire Dr.G from Migros, a brand that has led Korean skincare for more than 10 years. Hindustan Unilever completed its purchase of 90.5% of Minimalist's parent company in April 2025, after announcing the deal in January 2025. L'Oréal then agreed on June 18, 2026 to acquire a majority stake in Innovist, which was founded in 2019. As a result, large groups gain new brands for brand e-commerce platforms, which grow fastest among channels at 8.28% a year.
China softness, compliance and travel swings test brands
How does softer demand in China limit growth?
Softer demand in China limits growth, because the largest country market now favors domestic brands and value buying. Shiseido said its China business declined 1.4% in the first quarter of 2026, while Amorepacific reported lower North Asia sales in July 2026. As a result, foreign brands must cut costs, rethink channels and launch products tailored to Chinese buyers. Brands can respond with local research centers, faster launches and stronger partnerships with domestic platforms.
Why do compliance rules raise launch costs?
Compliance rules raise launch costs, because each country sets its own registration, safety and labeling requirements. China requires registration or filing for every product, and Indonesia requires halal certification for cosmetics from October 2026. This means that smaller brands face long timelines before they can sell in several countries. Shared regulatory teams, early dossiers and local partners help firms spread these costs across larger product ranges and protect launch schedules.
How do travel and political swings disrupt sales?
Travel and political swings disrupt sales, because duty-free and tourist shopping depend on visitor flows that can change quickly. Shiseido lowered its 2026 expectations for Japan as fewer Chinese visitors arrived during tensions between the two countries. In turn, brands that rely on tourist counters see sharp swings in orders and stock levels. Balancing tourist sales with local and online demand reduces this risk, although it requires more marketing to domestic buyers.
Why do input and logistics costs pressure margins?
Input and logistics costs pressure margins, because packaging, oils, actives and freight make up a large part of product cost. Shiseido flagged higher logistics and raw material costs linked to the Middle East situation in May 2026. As a result, mass brands with thin margins struggle to absorb increases without raising prices. Firms can respond with regional sourcing, lighter packs and efficiency programs, such as the savings of more than 25 billion yen Shiseido expects in 2026.
China leads while India grows fastest to 2035
| Country | Value, 2025 (USD billion) | Share, 2025 | CAGR, 2026–2035 |
|---|---|---|---|
| China | 78.15 | 53.9% | 6.91% |
| Southeast Asia and Oceania | 25.23 | 17.4% | 7.81% |
| Japan | 18.41 | 12.7% | 5.71% |
| India | 15.66 | 10.8% | 9.01% |
| South Korea | 7.54 | 5.2% | 6.81% |
Why does China hold the largest share?
China held 53.9% of 2025 value and grows at 6.91% a year in the regional demand model. Its cosmetics retail sales rose 5.1% to a record 465.3 billion yuan in 2025, which reversed a decline in 2024. The country is also the main center for new formulas, with 169 new ingredient filings recorded in 2025. However, foreign brands face strong local rivals and must adapt their ranges to domestic tastes and platforms.
How does Japan balance local and tourist demand?
Japan held 12.7% of 2025 value and grows at 5.71% a year in the regional demand model. The country was 92.2% urban in 2024, so most buyers already follow mature skincare and makeup routines. Visitors spent 2.5 trillion yen on shopping in 2025, which supports drugstores and department stores in large cities. However, lower Chinese tourist numbers in 2026 push brands toward local buyers and online sales.
Why is India growing fastest in the region?
India held 10.8% of 2025 value and grows fastest at 9.01% a year in the regional demand model. The country was only 35.4% urban in 2024, which means that urban growth will bring many first-time buyers into organized retail. The tax cut of September 2025 lowered prices for shampoo, hair oil and powders, while beauty retailers and digital-first brands keep expanding into smaller cities.
How does South Korea punch above its size?
South Korea held 5.2% of 2025 value and grows at 6.81% a year in the regional demand model. Its domestic market is small, but its brands exported a record $11.43 billion of products in 2025. Amorepacific reported double-digit growth in online and multi-brand store channels at home during the second quarter of 2026.
What lifts Southeast Asia and Oceania?
Southeast Asia and Oceania held 17.4% of 2025 value and grows at 7.81% a year in the regional demand model. Indonesia, Thailand, Vietnam and the Philippines add young buyers, while Australia was 87.6% urban in 2024 and supports premium skincare demand.
Brand deals and tax and halal rules marked 2025 and 2026
| Development | Status and market relevance |
|---|---|
| In January 2025, L'Oréal agreed with Swiss retail group Migros to acquire Dr.G, a leading Korean skincare brand. | Adds a dermatologist-founded Korean skincare label to its portfolio |
| In April 2025, Hindustan Unilever completed the acquisition of 90.5% of Uprising Science, the owner of Minimalist. | Adds a science-led, digital-first skincare brand in India |
| In September 2025, India cut the GST on shampoo, hair oil, talcum powder and face powder from 18% to 5%. | Effective Sept. 22, 2025, lowering prices of daily personal care items |
| In September 2025, Kao announced its K27 cosmetics strategy with growth targets for Kanebo, Kate and Sofina in Asia. | Targets 150% sales growth for Kanebo and Kate in Thailand by 2027 |
| In June 2026, L'Oréal announced an agreement to acquire a majority stake in Innovist, an Indian personal care house of brands. | Adds Bare Anatomy and Chemist at Play, sold online and in stores |
Ingredient science and digital tools shape new launches
- New active ingredients move quickly from the lab to shelves, with 169 new ingredient filings recorded in China in 2025.
- Barrier-care and dermocosmetic formulas pair skincare with clinical testing, which supports brands such as Aestura, Dr.G and Minimalist.
- Social and live commerce tools let brands demonstrate textures and results on video, which links discovery directly to checkout.
- Refillable and lighter formats reduce material use, and makers of beauty packaging are adding pumps, refills and sachets for value-seeking buyers.
Need a Custom Version of This Report?
Tailor the scope, geography, or segments to your exact requirements.
- Custom geography or segment scope
- Direct access to our analyst team
Global groups and Asian houses compete on science and reach
Competition combines global groups with strong Asian houses that move quickly on trends and local tastes. L'Oréal is buying growth brands, agreeing to acquire Dr.G in 2025 and a majority stake in Innovist in June 2026. Unilever, through Hindustan Unilever, completed the purchase of 90.5% of Minimalist in April 2025 to strengthen premium skincare in India. Shiseido is cutting costs and plans to close its Hsinchu factory in Taiwan in the second half of 2027. Kao is expanding Kanebo, Kate and Sofina across Asia under its K27 plan. Amorepacific is growing outside Korea with Laneige, Aestura and COSRX. Procter & Gamble, The Estée Lauder Companies, LG Household & Health Care, Beiersdorf and Coty are also profiled as major suppliers. Rivals compete on ingredient science, digital marketing, retail reach and the ability to adapt formulas to local skin and hair needs.
Companies profiled and their roles in this market
| Company | Type | Role in the market |
|---|---|---|
| L'Oréal | Global beauty group | Agreed to acquire Dr.G in 2025 and a majority stake in Innovist in June 2026 |
| Unilever | Global consumer goods group | Hindustan Unilever completed the purchase of 90.5% of Minimalist in April 2025 |
| Shiseido | Japanese beauty group | Plans to close its Hsinchu factory in Taiwan in the second half of 2027 |
| Kao Corporation | Japanese consumer goods group | Launched its K27 cosmetics plan in September 2025 with Asia growth targets |
| Amorepacific Group | Korean beauty group | Reported growth in Japan led by Laneige, Aestura and COSRX in July 2026 |
Credence Research view on skincare-led growth
Credence Research's view is that Asia Pacific cosmetics value will grow on skincare, trading up and online sales rather than on more shoppers in mature cities. China remains the anchor, although domestic brands take a larger share of its growth. India and Southeast Asia add the most new buyers as cities expand and taxes on daily care fall. Korean exports and acquisitions of digital-native brands keep competition intense, while compliance rules reward firms with strong regulatory teams and local partners.
How the regional estimate was built
The report uses 2025 as the base year, with values in USD million at current prices. Market values come from the Credence Research model, and country, product type, price tier, customer type and distribution channel splits are Credence Research estimates. Inputs include World Bank data, national statistics as reported by trade press, ministry and regulator releases, company announcements and stock exchange filings. Country shares follow the client's regional split, and growth tilts reflect urbanization, tax changes and trade data. No interviews or surveys were used in preparing these estimates.
India, Southeast Asia and online channels lead to 2035
The Asia Pacific cosmetics market is expected to reach USD 290.63 billion by 2035, a 7.16% CAGR during 2026–2035, as skincare, masstige brands and online channels keep value rising. India should gain the most share, while China stays the largest country market. Southeast Asia is expected to grow faster than the regional average as cities expand. A sharp slowdown in Chinese spending, stricter rules or higher input costs would lower this outlook, while faster tax relief and income growth would raise it.
Frequently Asked Questions
How big is the Asia Pacific cosmetics market?
Which country leads regional beauty demand?
Which country grows fastest?
Which product type holds the largest share?
How large are South Korean cosmetics exports?
What tax change affected beauty products in India?
Who are the main companies in the market?
Which distribution channel grows fastest?
Table of Content
Chapter 1 Market Segmentation
- 1.1 Segmentation Framework
- 1.1.1 Product and Service Classification
- 1.1.2 Application and End-Use Classification
- 1.1.3 Technology and Solution Classification
- 1.1.4 Customer and Distribution Channel Classification
- 1.1.5 Geographic Segmentation
- 1.1.6 Market Segment Definitions and Boundaries
- 1.2 By Product Type
- 1.2.1 Skincare
- 1.2.2 Haircare
- 1.2.3 Color Cosmetics
- 1.2.4 Fragrances and Deodorants
- 1.2.5 Bath and Body Care
- 1.3 By Price Tier
- 1.3.1 Mass
- 1.3.2 Masstige
- 1.3.3 Premium
- 1.3.4 Luxury
- 1.4 By Customer Type
- 1.4.1 Women Consumers
- 1.4.2 Men Consumers
- 1.4.3 Teen and Young Adult Consumers
- 1.4.4 Family and Children's Care Buyers
- 1.5 By Country
- 1.5.1 China
- 1.5.2 Japan
- 1.5.3 India
- 1.5.4 South Korea
- 1.5.5 Southeast Asia and Oceania
Chapter 2 Introduction
- 2.1 Report Objectives and Scope
- 2.2 Product Definition and Industry Terminology
- 2.3 Market Inclusions and Exclusions
- 2.4 Research Process
- 2.4.1 Primary Research and Expert Interviews
- 2.4.2 Secondary Research and Source Review
- 2.4.3 Top-Down and Bottom-Up Estimation
- 2.4.4 Data Triangulation and Verification
- 2.5 Market Size Measurement Basis
- 2.5.1 2025: USD 144.99 billion → 2035: USD 290.63 billion
- 2.6 Historical and Forecast Reference Periods
- 2.6.1 Historical Period: 2018-2025
- 2.6.2 Base Year: 2025
- 2.6.3 Forecast Period: 2025-2035
- 2.7 Research Assumptions and Limitations
Chapter 3 Executive Summary
- 3.1 Market Snapshot and Key Findings
- 3.2 Base-Year Market Size, 2025
- 3.3 Forecast Market Size, 2035
- 3.4 Revenue and Volume Growth Outlook
- 3.5 Key Demand and Supply Indicators
- 3.6 Leading Market Segments
- 3.7 Fastest-Growing Market Opportunities
- 3.8 Regional Performance Highlights
- 3.9 Technology and Industry Transformation
- 3.10 Competitive Landscape Summary
- 3.11 Analyst View and Strategic Implications
Chapter 4 Global Asia Pacific Cosmetics Market Trends and Developments
- 4.1 Historical Industry Development, 2018-2025
- 4.2 Recent Market Trends and Developments
- 4.3 Demand and Customer Behavior Trends
- 4.4 Technology and Product Innovation
- 4.5 Artificial Intelligence, Automation and Digitalization
- 4.6 Local Manufacturing and Supply Chain Realignment
- 4.7 Industry Partnerships, Mergers and Acquisitions
- 4.8 Sustainability and Circular Economy Developments
- 4.9 Government and Private Sector Investment Trends
- 4.10 Emerging Business Models and Commercialization
- 4.11 Industry Developments and Announcements
Chapter 5 Global Asia Pacific Cosmetics Market Production, Supply and Demand Analysis
- 5.1 Demand Trend and Consumption Analysis, 2018-2025
- 5.2 Demand Forecast, 2025-2035
- 5.3 Production and Output Trend, 2018-2025
- 5.4 Production and Output Forecast, 2025-2035
- 5.5 Installed Capacity and Capacity Utilization
- 5.6 Company-Wise Production Plants and Statistics
- 5.6.1 Installed Production Capacity
- 5.6.2 Actual Production
- 5.6.3 Planned Capacity and Expansion Targets
- 5.7 Supply Chain Structure and Procurement Trends
- 5.8 Supply-Demand Gap and Bottlenecks
- 5.9 Import Dependence and Sourcing Structure
- 5.10 Contract Manufacturing and Outsourcing
- 5.11 Regional Supply and Demand Concentration
Chapter 6 Global Asia Pacific Cosmetics Market Pricing Analysis
- 6.1 Pricing Structure and Measurement
- 6.2 Historical Pricing Trends, 2018-2025
- 6.3 Pricing Outlook, 2025-2035
- 6.4 Average Selling Price and Unit Economics
- 6.5 Pricing by Product and Market Segment
- 6.6 Geographic Pricing Differences
- 6.7 Key Input, Energy, Labor and Logistics Costs
- 6.8 Contract Pricing and Purchasing Models
- 6.9 Pricing Sensitivity and Competitive Positioning
- 6.10 Price, Margin and Profitability Implications
Chapter 7 Global Asia Pacific Cosmetics Market Dynamics
- 7.1 Market Growth Drivers
- 7.1.1 Demand-Side Drivers
- 7.1.2 Technology and Innovation Drivers
- 7.1.3 Infrastructure and Investment Drivers
- 7.1.4 Regulatory and Policy Drivers
- 7.2 Market Restraints
- 7.2.1 Cost and Affordability Constraints
- 7.2.2 Technology and Adoption Barriers
- 7.2.3 Supply Chain and Operational Constraints
- 7.3 Market Challenges
- 7.3.1 Competitive Pressure and Margin Erosion
- 7.3.2 Skills, Infrastructure and Implementation Gaps
- 7.4 Emerging Market Opportunities
- 7.5 Market Dynamics Impact and Time-Horizon Assessment
Chapter 8 Global Asia Pacific Cosmetics Value Chain Analysis
- 8.1 Industry Value Chain Overview
- 8.2 Upstream Suppliers and Critical Inputs
- 8.3 Technology and Component Providers
- 8.4 Manufacturing or Service Delivery
- 8.5 Distribution, Channel Partners and Integrators
- 8.6 Downstream Applications and End Users
- 8.7 Value Addition and Profit Pools
- 8.8 Vertical Integration and Outsourcing
- 8.9 Supplier Concentration and Risk
- 8.10 Supply Chain Localization and Resilience
Chapter 9 Global Asia Pacific Cosmetics Market Regulations and Policies
- 9.1 Relevant Laws, Standards and Compliance Frameworks
- 9.2 Product, Service, Safety and Quality Requirements
- 9.3 Government Policies, Incentives and Subsidies
- 9.4 Imports, Exports and Trade Barriers
- 9.5 Public Procurement and Local Content Requirements
- 9.6 Environmental and Sustainability Compliance
- 9.7 Upcoming Policy Changes and Market Implications
Chapter 10 Global Asia Pacific Cosmetics Market Hotspots and Opportunities
- 10.1 Market Opportunity Mapping and Growth Hotspots
- 10.2 High-Growth Applications and Customer Groups
- 10.3 Underserved Markets and White-Space Opportunities
- 10.4 Emerging Technology and Product Opportunities
- 10.5 New Capacity and Investment Hotspots
- 10.6 Market Entry and Expansion Opportunities
- 10.7 Distribution and Partnership Opportunities
- 10.8 Near-Term and Long-Term Commercial Potential
- 10.9 Opportunity Attractiveness and Execution Risks
Chapter 11 Global Asia Pacific Cosmetics Market Outlook, 2025-2035
- 11.1 Market Size and Analysis
- 11.1.1 Revenue (Market Measurement: 2025: USD 144.99 billion → 2035: USD 290.63 billion)
- 11.1.2 Market Volume and Quantity Sold
- 11.1.3 Historical Market Size, 2018-2025
- 11.1.4 Base-Year Market Size, 2025
- 11.2 Market Forecast, 2025-2035
- 11.2.1 Revenue Forecast to 2035
- 11.2.2 Volume Forecast to 2035
- 11.2.3 CAGR and Year-on-Year Growth
- 11.2.4 Incremental Revenue Opportunity
- 11.3 Forecast Assumptions and Scenario Analysis
- 11.3.1 Base-Case Forecast
- 11.3.2 Optimistic and Conservative Scenarios
- 11.3.3 Technology, Pricing and Policy Sensitivities
- 11.4 Market Attractiveness and Growth Outlook
Chapter 12 Global Asia Pacific Cosmetics Market Segmentation and Outlook
- 12.1 Segmentation Summary and Market Shares, 2025
- 12.2 Largest and Fastest-Growing Segments
- 12.3 By Product Type - Market Size and Forecast, 2025-2035
- 12.3.1 Segment Definition and Scope
- 12.3.2 Historical Market Size, 2018-2025
- 12.3.3 Revenue Forecast, 2025-2035
- 12.3.4 Volume Forecast, 2025-2035
- 12.3.5 Base-Year Market Share, 2025
- 12.3.6 Segment CAGR and Growth Drivers
- 12.3.7 Subsegment Market Size and Forecast
- 12.3.7.1 Skincare
- 12.3.7.2 Haircare
- 12.3.7.3 Color Cosmetics
- 12.3.7.4 Fragrances and Deodorants
- 12.3.7.5 Bath and Body Care
- 12.3.8 Subsegment Pricing and Adoption Trends
- 12.3.9 Leading Suppliers and Competition
- 12.3.10 Regional Demand and Opportunities
- 12.4 By Price Tier - Market Size and Forecast, 2025-2035
- 12.4.1 Segment Definition and Scope
- 12.4.2 Historical Market Size, 2018-2025
- 12.4.3 Revenue Forecast, 2025-2035
- 12.4.4 Volume Forecast, 2025-2035
- 12.4.5 Base-Year Market Share, 2025
- 12.4.6 Segment CAGR and Growth Drivers
- 12.4.7 Subsegment Market Size and Forecast
- 12.4.7.1 Mass
- 12.4.7.2 Masstige
- 12.4.7.3 Premium
- 12.4.7.4 Luxury
- 12.4.8 Subsegment Pricing and Adoption Trends
- 12.4.9 Leading Suppliers and Competition
- 12.4.10 Regional Demand and Opportunities
- 12.5 By Customer Type - Market Size and Forecast, 2025-2035
- 12.5.1 Segment Definition and Scope
- 12.5.2 Historical Market Size, 2018-2025
- 12.5.3 Revenue Forecast, 2025-2035
- 12.5.4 Volume Forecast, 2025-2035
- 12.5.5 Base-Year Market Share, 2025
- 12.5.6 Segment CAGR and Growth Drivers
- 12.5.7 Subsegment Market Size and Forecast
- 12.5.7.1 Women Consumers
- 12.5.7.2 Men Consumers
- 12.5.7.3 Teen and Young Adult Consumers
- 12.5.7.4 Family and Children's Care Buyers
- 12.5.8 Subsegment Pricing and Adoption Trends
- 12.5.9 Leading Suppliers and Competition
- 12.5.10 Regional Demand and Opportunities
- 12.6 By Country - Market Size and Forecast, 2025-2035
- 12.6.1 Segment Definition and Scope
- 12.6.2 Historical Market Size, 2018-2025
- 12.6.3 Revenue Forecast, 2025-2035
- 12.6.4 Volume Forecast, 2025-2035
- 12.6.5 Base-Year Market Share, 2025
- 12.6.6 Segment CAGR and Growth Drivers
- 12.6.7 Subsegment Market Size and Forecast
- 12.6.7.1 China
- 12.6.7.2 Japan
- 12.6.7.3 India
- 12.6.7.4 South Korea
- 12.6.7.5 Southeast Asia and Oceania
- 12.6.8 Subsegment Pricing and Adoption Trends
- 12.6.9 Leading Suppliers and Competition
- 12.6.10 Regional Demand and Opportunities
- 12.7 Segment Growth Comparison
- 12.8 Segment Attractiveness and Priority Matrix
Chapter 13 Global Asia Pacific Cosmetics End-Use and Application Market Outlook
- 13.1 End-Use Industry and Customer Demand Structure
- 13.2 Leading Applications and Customer Groups
- 13.3 End-Use Market Size, Share and Forecast
- 13.4 Major End-Use Industry Deep Dives
- 13.4.1 Customer Requirements and Use Cases
- 13.4.2 Demand and Replacement Cycles
- 13.4.3 Technical and Regulatory Considerations
- 13.4.4 Purchasing and Procurement Models
- 13.4.5 Leading Vendors and Distribution Channels
- 13.4.6 Forecast and Commercial Opportunities
- 13.5 Emerging Applications and Cross-Segment Demand
- 13.6 End-Use Industry Investment Priorities
Chapter 14 Global Asia Pacific Cosmetics Geographic Market Outlook, 2025-2035
- 14.1 Regional Market Size and Share, 2025
- 14.2 Regional Market Forecast, 2025-2035
- 14.3 Regional Pricing, Production and Demand Differences
- 14.4 North America
- 14.4.1 United States
- 14.4.2 Canada
- 14.4.3 Mexico
- 14.5 Europe
- 14.5.1 Germany
- 14.5.2 France
- 14.5.3 Italy
- 14.5.4 United Kingdom
- 14.5.5 Spain
- 14.5.6 Poland
- 14.5.7 Russia
- 14.5.8 Netherlands
- 14.5.9 Belgium
- 14.5.10 Sweden
- 14.5.11 Denmark
- 14.5.12 Norway
- 14.5.13 Rest of Europe
- 14.6 Asia Pacific
- 14.6.1 China
- 14.6.2 India
- 14.6.3 Japan
- 14.6.4 South Korea
- 14.6.5 Thailand
- 14.6.6 Indonesia
- 14.6.7 Vietnam
- 14.6.8 Malaysia
- 14.6.9 Australia
- 14.6.10 Rest of Asia Pacific
- 14.7 Latin America
- 14.7.1 Brazil
- 14.7.2 Argentina
- 14.7.3 Colombia
- 14.7.4 Chile
- 14.7.5 Rest of Latin America
- 14.8 Middle East
- 14.8.1 Saudi Arabia
- 14.8.2 United Arab Emirates
- 14.8.3 Turkey
- 14.8.4 Israel
- 14.8.5 Iran
- 14.8.6 Rest of the Middle East
- 14.9 Africa
- 14.9.1 South Africa
- 14.9.2 Egypt
- 14.9.3 Nigeria
- 14.9.4 Morocco
- 14.9.5 Rest of Africa
- 14.10 Regional Investment, Policy and Supply Chain Differences
- 14.11 Regional Competitive Landscape
- 14.12 Geographic Growth Hotspots
Chapter 15 Global Asia Pacific Cosmetics Technology, Innovation and Sustainability Outlook
- 15.1 Technology Landscape and Maturity
- 15.2 Product, Process and Service Innovation
- 15.3 AI, Automation and Digital Tools in the Industry
- 15.4 Technology Adoption and Performance Benchmarking
- 15.5 Innovation Pipeline and R&D Investment
- 15.6 Patent and Intellectual Property Trends
- 15.7 Energy Efficiency and Resource Management
- 15.8 Sustainability, Recycling and Circularity
- 15.9 Technology Roadmap, 2025-2035
- 15.10 Risks of Obsolescence and Technology Substitution
Chapter 16 Global Asia Pacific Cosmetics Market Key Strategic Imperatives
- 16.1 Growth and Market Entry Priorities
- 16.2 High-Return Products and Segments
- 16.3 Pricing, Profitability and Cost Optimization
- 16.4 Technology Investment and Product Differentiation
- 16.5 Supply Chain Localization and Resilience
- 16.6 Distribution and Customer Acquisition
- 16.7 Partnership, Acquisition and Capacity Strategy
- 16.8 Regional Expansion Priorities
- 16.9 Short-, Medium- and Long-Term Actions
Chapter 17 Competition Outlook
- 17.1 Industry Competition Characteristics
- 17.2 Market Structure and Concentration
- 17.3 Market Share and Competitive Positioning, 2025
- 17.4 Company-Wise Revenue and Product Benchmarking
- 17.5 Production and Service Capacity Benchmarking
- 17.6 Technology, Pricing and Differentiation
- 17.7 Regional Footprint and Distribution Strength
- 17.8 Mergers, Acquisitions and Strategic Alliances
- 17.9 New Entrants and Competitive Threats
- 17.10 Porter's Five Forces and Industry Attractiveness
- 17.11 Competitive Outlook, 2025-2035
Chapter 18 Company Profiles
- 18.1 Company Coverage and Selection Criteria
- 18.2 L'Oréal
- 18.2.1 Business Description
- 18.2.2 Company Ownership and Geographic Presence
- 18.2.3 Product and Service Portfolio
- 18.2.4 Manufacturing and Operating Footprint
- 18.2.5 Production Capacity and Expansion Plans
- 18.2.6 Financial Performance and Investment
- 18.2.7 Market Share and Competitive Position
- 18.2.8 Technology and Innovation Capabilities
- 18.2.9 Strategic Alliances or Partnerships
- 18.2.10 Recent Developments
- 18.2.11 Growth Strategy and Outlook
- 18.3 Unilever
- 18.4 Procter & Gamble
- 18.5 The Estée Lauder Companies
- 18.6 Shiseido
- 18.7 Kao Corporation
- 18.8 Amorepacific Group
- 18.9 LG Household & Health Care
- 18.10 Beiersdorf
- 18.11 Coty
- 18.12 Other Relevant Market Participants
Note: Every listed company is profiled on the structure shown under the first company. The company list is preliminary and may change based on research findings, market developments, data availability and client requirements.
Chapter 19 Disclaimer
- 19.1 Research and Forecast Disclaimer
- 19.2 Data Source and Estimation Limitations
Note: The depth of individual sections depends on data availability for this market. Volume, capacity, trade and other unit-based metrics are included where applicable.

