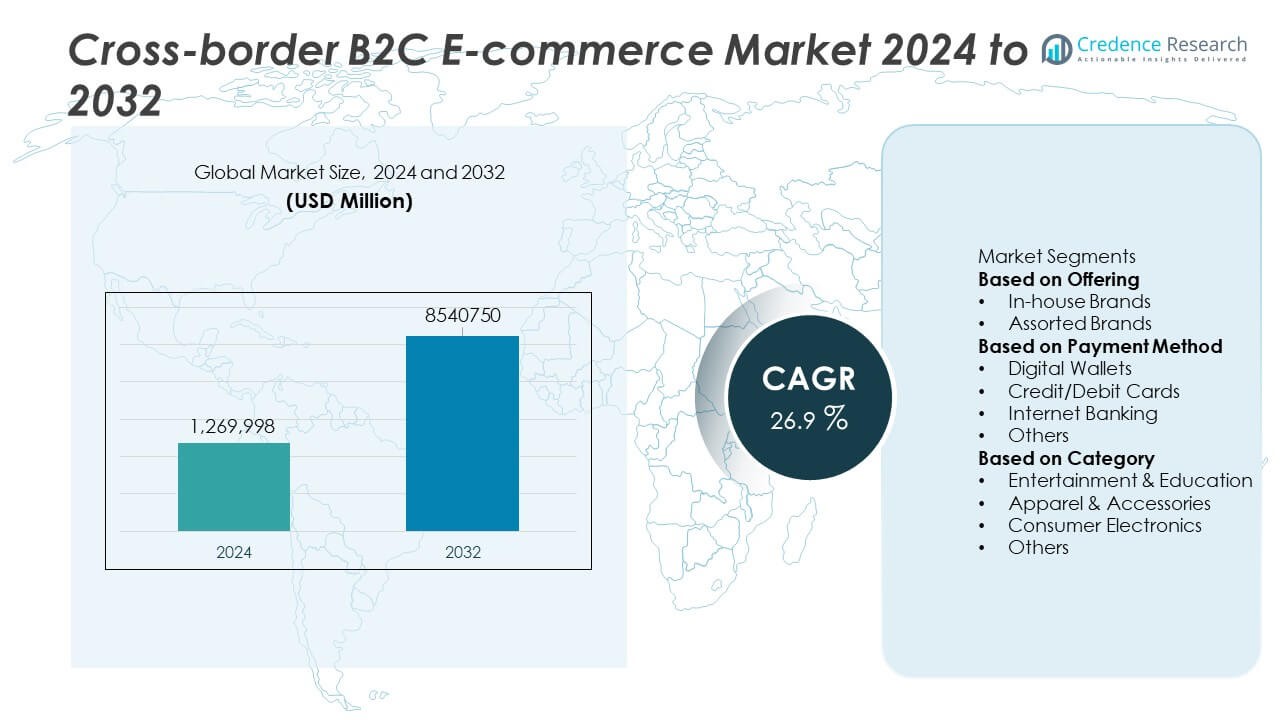
Home » Information and Communications Technology » Technology & Media » Cross-Border B2C E-Commerce Market

Cross-Border B2C E-Commerce Market By Category (Apparel and Accessories, Personal Care and Beauty, Entertainment and Education, Healthcare and Nutrition, Food and Beverage, and Others), By End Users (Adults, Teenagers/Millennials, Senior Citizens, and Others) Growth, Future Prospects & Competitive Analysis, 2016 – 2030

Price: $4999

Published: | Report ID: 15610 | Report Format : PDF

Key Highlights of the report

How are the major segments performing in the Cross-Border B2C E-Commerce market?

  • In 2022, the apparel & accessories segment accounted for the largest share of the market due to the increasing utilization of technology in B2C payments and the developing global shopping ecosystem.
  • In 2022, the digital wallets segment held a prominent share in the global cross-border B2C e-commerce market due to the introduction of international B2C payment platforms through digital wallets.
  • In 2022, the assorted brand category dominated the market growth due to the variety of merchandise the cross-border e-commerce market offers its customers.
  • In 2022, the adults’ category held the prominent market share as it helps businesses determine the consumer interactions leading to purchase.

What is the Market Size of Cross-Border B2C E-Commerce regarding value?

The global cross-border B2C e-commerce market is anticipated to grow at a substantial CAGR of 25.70% in the upcoming years. The global cross-border B2C e-commerce industry was estimated to be worth USD 789.1 billion in 2022 and was expected to be worth USD 3912.7 billion by 2028.

Design Element 2

Access crucial information at unmatched prices!

Request your free sample report today & start making informed decisions powered by Credence Research!

Download Free Sample
CTA Design Element 3

Which Region Dominated the Cross-Border B2C E-Commerce market?

In 2022, the Asia Pacific dominated the cross-border B2C e-commerce due to the large consumer base in the region. Moreover, the growing international trade relations in the area are anticipated to propel regional growth. For instance, China maintained its free trade contract with New Zealand due to its good international trade relations. This trade pact permits faster export procedures, increased market access, and enhanced tariff-free programs. Therefore, such trade pacts are affecting the industry growth during the forecast period.

How is US Market Performing in the Cross-Border B2C E-Commerce Market?

This market growth in the US is attributable to the growing demand for reasonable-cost, high-quality products. Furthermore, this region’s high Price Level Index (PLI) contributes immensely to the regional market growth as it permits customers to shop for a product at an inexpensive rate. For instance, the PLI of the US is 113, and China is 59; this permits regional shoppers to get lower expenses domestically.

How is the economy impacting the global Cross-Border B2C E-Commerce growth?

The spread of COVID-19 reflects the downfall in industry growth because of the significant disruptions in the supply chain and the temporary halt in transport across nations. The imposed trade barriers and international border closures have stopped all exports and imports, disrupting the industry development. During the outbreak, various standard carriers could not deliver packages to different regions due to the lack of commercial flights they use for logistics on lockdown restrictions. Moreover, the recession and Russia Ukraine war also disrupted the market’s economy.

 What is the competitive environment of the Cross-Border B2C E-Commerce market?

The industry can be described as competitive, characterized by various major players. Industry leaders are exploring various business strategies to broaden their market reaches, such as partnerships, mergers & acquisitions, and other strategic initiatives. For instance, in 2022, Shopify and the Chinese e-commerce business JD.com collaborated to broaden the seller’s reach. As a result, the JD Marketplace track was added to the Shopify forum, allowing merchants to set up enterprise in China in 3 weeks instead of the standard 12 months.

Executive Summary

What are the key trends in the Cross-Border B2C E-Commerce market?

  • The growing young metropolitan population and its reliance on enhanced technology for online shopping via e-commerce is the major factor driving the industry’s growth. Furthermore, the rising internet and smartphone perforation are anticipated to drive growth as most millennials use smartphones and tablets to order goods.
  • Moreover, small and medium-sized enterprises benefit from cross-border e-commerce as they continuously focus on expanding their operations globally and increasing their scalability. In addition, there would be numerous growth prospects for industrial expansion globally due to the rising digitalization across the globe. As a result, increasing digital transformation by businesses to expand across numerous public and private industries is further expected to propel market growth.

How Does Growth in Cross-Border Trading Helps in Cross-Border B2C E-Commerce Market?

Major countries are making trade relations and signing agreements on conducting cross-border trade with each other. In addition, countries are permitting other countries to sell their products in their countries, thereby growing trade. Furthermore, government bodies are also playing a major role in developing their cross-border trade routes with other countries so that the transportation of goods can improve. The development of new seaports, airways, and road infrastructure improvements will collectively contribute towards the growth of cross-border trade among various countries. Therefore, enhanced trade relations, along with government help and developing infrastructure, will provide prominent lucrative opportunities for the development of the cross-border B2C E-commerce market over the forecast period.

Which are the key investments by the Cross-Border B2C E-Commerce market players?

Major market players are undertaking various strategies to increase competition and offer enhanced services to their customers. For instance, in December 2021, the cross-border trade platform Shypmax by tech logistics platform Shiplite secured a partnership with the Netherlands-based B2C Europe. B2C Europe is part of Maersk and specializes in business-to-consumer parcel delivery services in Europe. The collaboration will enable Indian businesses to cost-effectively deliver their products to customers based in Europe, including the UK, using a single-window platform. Moreover, under the collaboration, Indian companies, especially small and medium enterprises (SMEs), direct-to-consumers (D2C), business-to-consumer (B2C), and e-commerce firms from over 27,000 pin codes, can deliver any product across European markets through Shypmax. Therefore, these strategies will further increase the cross-border B2C e-commerce market growth.

Some major players in the cross-border B2C e-commerce market are Amazon.com, Inc.; Alibaba Group Holding Limited; eBay Inc.; ASOS; Jingdong JD.com; Fruugo.com Ltd.; Veepee; Rakuten; SIA Joom (Latvia); Zalando.

What are the Major Driving Factors for the Cross-Border B2C E-Commerce Market?

Cross-border e-commerce presents a whole new market for both buyers and sellers. Online trade between B2C has many products and brands to choose from, which are not available in their own country, thus enhancing their purchase options. The sellers get a large customer base to sell their products, thus broadening their market reach to international customers. Furthermore, with the help of cross-border B2C e-commerce, several brands can sell their products to different counties even if they do not have a physical store in those countries. This, in turn, increases the brand visibility of the product as many customers get to know about the brand and use it. In addition, the customers can try new products and brands at a good price. Therefore, this is a major driving factor for the cross-border B2C E-commerce market growth.

What are the Major Risks for the Cross-Border B2C E-Commerce Market?

The chances of receiving faulty or damaged products when ordering from cross-border e-commerce websites are higher, as the product is shipped from one country to another. The products may get damaged while in transit due to mishandling as the delivery route is longer. Moreover, consumers mostly buy fragile products such as crockery, paintings, glassware and others from international sellers as they are famous for their products. However, the fear in the minds of customers about receiving the product in a broken condition discourages them from making such purchases. In addition, if the product is received in a damaged condition, it is a very time taking and costly process for the customer to return the product, as the seller may reject to return request, or it may take a lot of time for the product to reach the seller, and it also involves a huge cost to return the product, which the customer has to pay out of their pocket. Therefore, this factor limits the growth of the cross-border b2c e-commerce market.

Which is the key application in the Cross-Border B2C E-Commerce market?

The digital wallets segment is anticipated to hold a prominent market share over the forecast period. Introducing international B2C payment platforms through digital wallets will drive the segment’s growth. For instance, in 2021, HSBC bank launched a global multi-currency virtual wallet for international transactions. This allows wallet users to streamline international payments with minimal documents. Furthermore, the expansion of numerous digital wallet companies is expected to present various opportunities for the segment to grow internationally with greater financial inclusion.

Cross-Border B2C E-Commerce Market

How is the Cross-Border B2C E-Commerce market performing in regions?

North America is anticipated to witness the fastest growth in the global cross-border B2C e-commerce market during the forecast period. The fast market growth in North America can be attributed to the growing demand for high-quality goods at affordable prices. The region’s high PLI (Price Level Index) enables domestic shoppers to do cross-border B2C shopping.

What is the regulatory landscape for the cross-border B2C e-commerce market?

The regulatory framework governing e-commerce activities concerned, there are no dedicated e-commerce laws in India. Several departments and ministries of the government of India deal with various aspects of e-commerce. For example, the Ministry of Electronics and Information Technology looks after the technical aspects of e-commerce via the information technology Act, data privacy problems, etc. The Department of Consumer Affairs handles the protection of customer’s issues. The Department for promotion of Industry and Internal Trade trades with foreign investment-related matters on e-commerce. The Department of Commerce trades with the WTO discussions on e-commerce.

Shape Your Report to Specific Countries or Regions & Enjoy 30% Off!

What are the major players planning for the future of the Cross-Border B2C E-Commerce market?

Global e-commerce platforms also focus on commercial relationships and partnerships with tech-enabled cross-border payment solution providers to extend their cross-border e-commerce capabilities and solutions. For instance, in July 2022, global e-commerce players Global-e and Pitney Bowes, through a cross-border business deal, are localizing shopping portals to 200+ territories and are simplifying compliance processing. This deal is expected to bring high value to international customers and enhance the global e-commerce market.

REPORT ATTRIBUTE DETAILS
Market by Volume Yes
By Value Yes
Tornado Analysis Yes
STAR Analysis Yes
SRC Analysis Yes
Cross-Border B2C E-Commerce Market, Import-Export Data Yes (On Demand)
Cross-Border B2C E-Commerce Market Pricing Analysis Yes (On Demand)
Cross-Border B2C E-Commerce Market Segment Analysis By Category (Apparel and Accessories, Personal Care and Beauty, Entertainment and Education, Healthcare and Nutrition, Food and Beverage, and Others)

By End Users (Adults, Teenagers/Millennials, Senior Citizens, and Others)

By Offering (Assorted Brands and In-House Brands)

By Payment Method (Digital Wallets, Internet Banking, Others, and Credit/Debit Cards)

Cross-Border B2C E-Commerce Market, Regional Analysis North America (US and Canada)

Europe (Germany, UK, France, Italy, Spain, and the Rest of Europe)

Asia Pacific (China, India, Japan, South Korea, South East Asia, and Rest of Asia Pacific)

Latin America (Brazil, Mexico, and Rest of Latin America)

Middle East and Africa (GCC Countries, South Africa, and Rest of Middle East and Africa)

Cross-Border B2C E-Commerce Market Key Companies Amazon.com, Inc.; Alibaba Group Holding Limited; eBay Inc.; ASOS; Jingdong JD.com; Fruugo.com Ltd.; Veepee; Rakuten; SIA Joom (Latvia); Zalando
Cross-Border B2C E-Commerce Market Competitive Landscape Market Share Analysis

Competitive Benchmarking

Key Players Market Positioning

Geographical Presence Analysis

Major Strategies Adopted

Segmentation of Global Cross-Border B2C E-Commerce Market-

Global Cross-Border B2C E-Commerce Market – By Category

  • Apparel and Accessories
  • Personal Care and Beauty
  • Entertainment and Education
  • Healthcare and Nutrition
  • Food and Beverage
  • Others

Global Cross-Border B2C E-Commerce Market – By End User

  • Adults
  • Teenagers/Millennial
  • Senior Citizens
  • Others

Global Cross-Border B2C E-Commerce Market – By Offering

  • Assorted Brands
  • In-House Brands

Other Global Cross-Border B2C E-Commerce Market – By Payment Method

  • Digital Wallets
  • Internet Banking
  • Others
  • Credit/Debit Cards

Global Cross-Border B2C E-Commerce Market – By Region

  • North America
    • U.S.
    • Canada
  • Europe
    • Germany
    • France
    • U.K.
    • Italy
    • Spain
    • Rest of Europe
  • Asia Pacific
    • China
    • Japan
    • India
    • South Korea
    • South-east Asia
    • Rest of Asia Pacific
  • Latin America
    • Brazil
    • Mexico
    • Rest of Latin America
  • Middle East & Africa
    • GCC Countries
    • South Africa
    • Rest of Middle East and Africa

1. Preface
1.1. Report Description
1.1.1. Purpose of the Report
1.1.2. Target Audience
1.1.3. USP and Key Offerings
1.2. Research Scope
1.3. Research Methodology
1.3.1. Phase I – Secondary Research
1.3.2. Phase II – Primary Research
1.3.3. Phase III – Expert Panel Review
1.3.4. Approach Adopted
1.3.4.1. Top-Down Approach
1.3.4.2. Bottom-Up Approach
1.3.5. Assumptions
1.4. Market Introduction
1.5. Market Research Scope

2. Executive Summary
2.1. Market Snapshot: Global Cross-Border B2C E-Commerce Market
2.2. Global Cross-Border B2C E-Commerce Market, By Category
2.3. Global Cross-Border B2C E-Commerce Market, By End User
2.4. Global Cross-Border B2C E-Commerce Market, By Offering
2.5. Global Cross-Border B2C E-Commerce Market, By Payment Method
2.6. Global Cross-Border B2C E-Commerce Market, By Region

3. Market Dynamics & Factors Analysis
3.1. Introduction
3.1.1. Global Cross-Border B2C E-Commerce Market Value, 2017-2030, (US$ Bn)
3.1.2. Y-o-Y Growth Trend Analysis
3.2. Market Dynamics
3.2.1. Market Drivers
3.2.2. Market Restraints
3.2.3. Market Opportunities
3.2.4. Major Industry Challenges
3.3. Growth and Development Patterns
3.4. Investment Feasibility Analysis
3.5. Market Opportunity Analysis
3.5.1. Category
3.5.2. End User
3.5.3. Offering
3.5.4. Payment Method
3.5.5. Geography

4. Premium Insights
4.1. STAR (Situation, Task, Action, Results) Analysis
4.2. Porter’s Five Forces Analysis
4.2.1. Threat of New Entrants
4.2.2. Bargaining Power of Buyers/Consumers
4.2.3. Bargaining Power of Suppliers
4.2.4. Threat of Substitute Types
4.2.5. Intensity of Competitive Rivalry
4.3. Key Market Trends
4.3.1. Demand Side Trends
4.3.2. Supply Side Trends
4.4. Value Chain Analysis
4.5. Technology Analysis
4.6. Analysis and Recommendations
4.7. Marketing Strategy Analysis
4.7.1. Direct Marketing
4.7.2. Indirect Marketing
4.7.3. Marketing Channel Development Trend

5. Market Positioning of Key Players, 2022
5.1. Company market share of key players, 2022
5.2. Competitive Benchmarking
5.3. Market Positioning of Key Vendors
5.4. Geographical Presence Analysis
5.5. Major Strategies Adopted by Key Players
5.5.1. Key Strategies Analysis
5.5.2. Mergers and Acquisitions
5.5.3. Partnerships
5.5.4. Product Launch
5.5.5. Geographical Expansion
5.5.6. Others

6. Economic Impact Analysis
6.1. Recession Impact
6.1.1. North America
6.1.2. Europe
6.1.3. Asia Pacific
6.1.4. Latin America
6.1.5. Middle East and Africa
6.2. Ukraine-Russia War Impact
6.2.1. North America
6.2.2. Europe
6.2.3. Asia Pacific
6.2.4. Latin America
6.2.5. Middle East and Africa
6.3. COVID-19 Impact Analysis
6.3.1. North America
6.3.2. Europe
6.3.3. Asia Pacific
6.3.4. Latin America
6.3.5. Middle East and Africa

7. Global Cross-Border B2C E-Commerce Market
7.1. Global Cross-Border B2C E-Commerce Market, by Category, 2017-2030(US$ Bn)
7.1.1. Overview
7.1.2. Global Cross-Border B2C E-Commerce Market, By Category, 2022 vs 2030 (in%)
7.1.3. Global Cross-Border B2C E-Commerce Market, By Apparel and Accessories, 2017-2030 (US$ Bn)
7.1.4. Global Cross-Border B2C E-Commerce Market, By Personal Care and Beauty, 2017-2030 (US$ Bn)
7.1.5. Global Cross-Border B2C E-Commerce Market, By Entertainment and Education, 2017-2030 (US$ Bn)
7.1.6. Global Cross-Border B2C E-Commerce Market, By Healthcare and Nutrition, 2017-2030 (US$ Bn)
7.1.7. Global Cross-Border B2C E-Commerce Market, By Food and Beverage, 2017-2030 (US$ Bn)
7.1.8. Global Cross-Border B2C E-Commerce Market, By Others, 2017-2030 (US$ Bn)
7.2. Global Cross-Border B2C E-Commerce Market, by End User, 2017-2030(US$ Bn)
7.2.1. Overview
7.2.2. Global Cross-Border B2C E-Commerce Market, By End User, 2022 vs 2030 (in%)
7.2.3. Global Cross-Border B2C E-Commerce Market, By Adults, 2017-2030 (US$ Bn)
7.2.4. Global Cross-Border B2C E-Commerce Market, By Teenagers/Millennial, 2017-2030 (US$ Bn)
7.2.5. Global Cross-Border B2C E-Commerce Market, By Senior Citizens, 2017-2030 (US$ Bn)
7.2.6. Global Cross-Border B2C E-Commerce Market, By Others, 2017-2030 (US$ Bn)
7.3. Global Cross-Border B2C E-Commerce Market, by Offering, 2017-2030(US$ Bn)
7.3.1. Overview
7.3.2. Global Cross-Border B2C E-Commerce Market, By Offering, 2022 vs 2030 (in%)
7.3.3. Global Cross-Border B2C E-Commerce Market, By Assorted Brands, 2017-2030 (US$ Bn)
7.3.4. Global Cross-Border B2C E-Commerce Market, By In-House Brands, 2017-2030 (US$ Bn)
7.4. Global Cross-Border B2C E-Commerce Market, by Payment Method, 2017-2030(US$ Bn)
7.4.1. Overview
7.4.2. Global Cross-Border B2C E-Commerce Market, By Payment Method, 2022 vs 2030 (in%)
7.4.3. Global Cross-Border B2C E-Commerce Market, By Digital Wallets, 2017-2030 (US$ Bn)
7.4.4. Global Cross-Border B2C E-Commerce Market, By Internet Banking, 2017-2030 (US$ Bn)
7.4.5. Global Cross-Border B2C E-Commerce Market, By Credit/Debit Cards, 2017-2030 (US$ Bn)
7.4.6. Global Cross-Border B2C E-Commerce Market, By Others, 2017-2030 (US$ Bn)

8. North America Cross-Border B2C E-Commerce Market Analysis
8.1. North America Cross-Border B2C E-Commerce Market, by Category, 2017-2030(US$ Bn)
8.1.1. Overview
8.1.2. SRC Analysis
8.2. North America Cross-Border B2C E-Commerce Market, by End User, 2017-2030(US$ Bn)
8.2.1. Overview
8.2.2. SRC Analysis
8.3. North America Cross-Border B2C E-Commerce Market, by Offering, 2017-2030(US$ Bn)
8.3.1. Overview
8.3.2. SRC Analysis
8.4. North America Cross-Border B2C E-Commerce Market, by Payment Method, 2017-2030(US$ Bn)
8.4.1. Overview
8.4.2. SRC Analysis
8.5. North America Cross-Border B2C E-Commerce Market, by Country, 2017-2030 (US$ Bn)
8.5.1. U.S.
8.5.1.1. U.S. Cross-Border B2C E-Commerce Market Estimates and Forecast, 2017-2030 (US$ Bn)
8.5.1.2. U.S. Cross-Border B2C E-Commerce, By Category, 2017-2030 (US$ Bn)
8.5.1.3. U.S. Cross-Border B2C E-Commerce, By End User, 2017-2030 (US$ Bn)
8.5.1.4. U.S. Cross-Border B2C E-Commerce, By Offering, 2017-2030 (US$ Bn)
8.5.1.5. U.S. Cross-Border B2C E-Commerce, By Payment Method, 2017-2030 (US$ Bn)
8.5.2. Canada
8.5.2.1. Canada Cross-Border B2C E-Commerce Market Estimates and Forecast, 2017-2030 (US$ Bn)
8.5.2.2. Canada Cross-Border B2C E-Commerce, By Category, 2017-2030 (US$ Bn)
8.5.2.3. Canada Cross-Border B2C E-Commerce, By End User, 2017-2030 (US$ Bn)
8.5.2.4. Canada Cross-Border B2C E-Commerce, By Offering, 2017-2030 (US$ Bn)
8.5.2.5. Canada Cross-Border B2C E-Commerce, By Payment Method, 2017-2030 (US$ Bn)

9. Europe Cross-Border B2C E-Commerce Market Analysis
9.1. Europe Cross-Border B2C E-Commerce Market, by Category, 2017-2030(US$ Bn)
9.1.1. Overview
9.1.2. SRC Analysis
9.2. Europe Cross-Border B2C E-Commerce Market, by End User, 2017-2030(US$ Bn)
9.2.1. Overview
9.2.2. SRC Analysis
9.3. Europe Cross-Border B2C E-Commerce Market, by Offering, 2017-2030(US$ Bn)
9.3.1. Overview
9.3.2. SRC Analysis
9.4. Europe Cross-Border B2C E-Commerce Market, by Payment Method, 2017-2030(US$ Bn)
9.4.1. Overview
9.4.2. SRC Analysis
9.5. Europe Cross-Border B2C E-Commerce Market, by Country, 2017-2030 (US$ Bn)
9.5.1. Germany
9.5.1.1. Germany Cross-Border B2C E-Commerce Market Estimates and Forecast, 2017-2030 (US$ Bn)
9.5.1.2. Germany Cross-Border B2C E-Commerce, By Category, 2017-2030 (US$ Bn)
9.5.1.3. Germany Cross-Border B2C E-Commerce, By End User, 2017-2030 (US$ Bn)
9.5.1.4. Germany Cross-Border B2C E-Commerce, By Offering, 2017-2030 (US$ Bn)
9.5.1.5. Germany Cross-Border B2C E-Commerce, By Payment Method, 2017-2030 (US$ Bn)
9.5.2. France
9.5.2.1. France Cross-Border B2C E-Commerce Market Estimates and Forecast, 2017-2030 (US$ Bn)
9.5.2.2. France Cross-Border B2C E-Commerce, By Category, 2017-2030 (US$ Bn)
9.5.2.3. France Cross-Border B2C E-Commerce, By End User, 2017-2030 (US$ Bn)
9.5.2.4. France Cross-Border B2C E-Commerce, By Offering, 2017-2030 (US$ Bn)
9.5.2.5. France Cross-Border B2C E-Commerce, By Payment Method, 2017-2030 (US$ Bn)
9.5.3. UK
9.5.3.1. UK Cross-Border B2C E-Commerce Market Estimates and Forecast, 2017-2030 (US$ Bn)
9.5.3.2. UK Cross-Border B2C E-Commerce, By Category, 2017-2030 (US$ Bn)
9.5.3.3. UK Cross-Border B2C E-Commerce, By End User, 2017-2030 (US$ Bn)
9.5.3.4. UK Cross-Border B2C E-Commerce, By Offering, 2017-2030 (US$ Bn)
9.5.3.5. UK Cross-Border B2C E-Commerce, By Payment Method, 2017-2030 (US$ Bn)
9.5.4. Italy
9.5.4.1. Italy Cross-Border B2C E-Commerce Market Estimates and Forecast, 2017-2030 (US$ Bn)
9.5.4.2. Italy Cross-Border B2C E-Commerce, By Category, 2017-2030 (US$ Bn)
9.5.4.3. Italy Cross-Border B2C E-Commerce, By End User, 2017-2030 (US$ Bn)
9.5.4.4. Italy Cross-Border B2C E-Commerce, By Offering, 2017-2030 (US$ Bn)
9.5.4.5. Italy Cross-Border B2C E-Commerce, By Payment Method, 2017-2030 (US$ Bn)
9.5.5. Spain
9.5.5.1. Spain Cross-Border B2C E-Commerce Market Estimates and Forecast, 2017-2030 (US$ Bn)
9.5.5.2. Spain Cross-Border B2C E-Commerce, By Category, 2017-2030 (US$ Bn)
9.5.5.3. Spain Cross-Border B2C E-Commerce, By End User, 2017-2030 (US$ Bn)
9.5.5.4. Spain Cross-Border B2C E-Commerce, By Offering, 2017-2030 (US$ Bn)
9.5.5.5. Spain Cross-Border B2C E-Commerce, By Payment Method, 2017-2030 (US$ Bn)
9.5.6. Rest of Europe
9.5.6.1. Rest of Europe Cross-Border B2C E-Commerce Market Estimates and Forecast, 2017-2030 (US$ Bn)
9.5.6.2. Rest of Europe Cross-Border B2C E-Commerce, By Category, 2017-2030 (US$ Bn)
9.5.6.3. Rest of Europe Cross-Border B2C E-Commerce, By End User, 2017-2030 (US$ Bn)
9.5.6.4. Rest of Europe Cross-Border B2C E-Commerce, By Offering, 2017-2030 (US$ Bn)
9.5.6.5. Rest of Europe Cross-Border B2C E-Commerce, By Payment Method, 2017-2030 (US$ Bn)

10. Asia Pacific Cross-Border B2C E-Commerce Market Analysis
10.1. Asia Pacific Cross-Border B2C E-Commerce Market, by Category, 2017-2030(US$ Bn)
10.1.1. Overview
10.1.2. SRC Analysis
10.2. Asia Pacific Cross-Border B2C E-Commerce Market, by Offering, 2017-2030(US$ Bn)
10.2.1. Overview
10.2.2. SRC Analysis
10.3. Asia Pacific Cross-Border B2C E-Commerce Market, by Payment Method, 2017-2030(US$ Bn)
10.3.1. Overview
10.3.2. SRC Analysis
10.4. Asia Pacific Cross-Border B2C E-Commerce Market, by End User, 2017-2030(US$ Bn)
10.4.1. Overview
10.4.2. SRC Analysis
10.5. Asia Pacific Cross-Border B2C E-Commerce Market, by Country, 2017-2030 (US$ Bn)
10.5.1. China
10.5.1.1. China Cross-Border B2C E-Commerce Market Estimates and Forecast, 2017-2030 (US$ Bn)
10.5.1.2. China Cross-Border B2C E-Commerce, By Category, 2017-2030 (US$ Bn)
10.5.1.3. China Cross-Border B2C E-Commerce, By Offering, 2017-2030 (US$ Bn)
10.5.1.4. China Cross-Border B2C E-Commerce, By Payment Method, 2017-2030 (US$ Bn)
10.5.1.5. China Cross-Border B2C E-Commerce, By End User, 2017-2030 (US$ Bn)
10.5.2. Japan
10.5.2.1. Japan Cross-Border B2C E-Commerce Market Estimates and Forecast, 2017-2030 (US$ Bn)
10.5.2.2. Japan Cross-Border B2C E-Commerce, By Category, 2017-2030 (US$ Bn)
10.5.2.3. Japan Cross-Border B2C E-Commerce, By Offering, 2017-2030 (US$ Bn)
10.5.2.4. Japan Cross-Border B2C E-Commerce, By Payment Method, 2017-2030 (US$ Bn)
10.5.2.5. Japan Cross-Border B2C E-Commerce, By End User, 2017-2030 (US$ Bn)
10.5.3. India
10.5.3.1. India Cross-Border B2C E-Commerce Market Estimates and Forecast, 2017-2030 (US$ Bn)
10.5.3.2. India Cross-Border B2C E-Commerce, By Category, 2017-2030 (US$ Bn)
10.5.3.3. India Cross-Border B2C E-Commerce, By Offering, 2017-2030 (US$ Bn)
10.5.3.4. India Cross-Border B2C E-Commerce, By Payment Method, 2017-2030 (US$ Bn)
10.5.3.5. India Cross-Border B2C E-Commerce, By End User, 2017-2030 (US$ Bn)
10.5.4. South Korea
10.5.4.1. South Korea Cross-Border B2C E-Commerce Market Estimates and Forecast, 2017-2030 (US$ Bn)
10.5.4.2. South Korea Cross-Border B2C E-Commerce, By Category, 2017-2030 (US$ Bn)
10.5.4.3. South Korea Cross-Border B2C E-Commerce, By End User, 2017-2030 (US$ Bn)
10.5.4.4. South Korea Cross-Border B2C E-Commerce, By Offering, 2017-2030 (US$ Bn)
10.5.4.5. South Korea Cross-Border B2C E-Commerce, By Payment Method, 2017-2030 (US$ Bn)
10.5.5. South-East Asia
10.5.5.1. South-East Asia Cross-Border B2C E-Commerce Market Estimates and Forecast, 2017-2030 (US$ Bn)
10.5.5.2. South-East Asia Cross-Border B2C E-Commerce, By Category, 2017-2030 (US$ Bn)
10.5.5.3. South-East Asia Cross-Border B2C E-Commerce, By Offering, 2017-2030 (US$ Bn)
10.5.5.4. South-East Asia Cross-Border B2C E-Commerce, By Payment Method, 2017-2030 (US$ Bn)
10.5.5.5. South-East Asia Cross-Border B2C E-Commerce, By End User, 2017-2030 (US$ Bn)
10.5.6. Rest of Asia Pacific
10.5.6.1. Rest of Asia Pacific Cross-Border B2C E-Commerce Market Estimates and Forecast, 2017-2030 (US$ Bn)
10.5.6.2. Rest of Asia Pacific Cross-Border B2C E-Commerce, By Category, 2017-2030 (US$ Bn)
10.5.6.3. Rest of Asia Pacific Cross-Border B2C E-Commerce, By Offering, 2017-2030 (US$ Bn)
10.5.6.4. Rest of Asia Pacific Cross-Border B2C E-Commerce, By Payment Method, 2017-2030 (US$ Bn)
10.5.6.5. Rest of Asia Pacific Cross-Border B2C E-Commerce, By End User, 2017-2030 (US$ Bn)

11. Latin America Cross-Border B2C E-Commerce Market Analysis
11.1. Latin America Cross-Border B2C E-Commerce Market, by Category, 2017-2030(US$ Bn)
11.1.1. Overview
11.1.2. SRC Analysis
11.2. Latin America Cross-Border B2C E-Commerce Market, by Offering, 2017-2030(US$ Bn)
11.2.1. Overview
11.2.2. SRC Analysis
11.3. Latin America Cross-Border B2C E-Commerce Market, by Payment Method, 2017-2030(US$ Bn)
11.3.1. Overview
11.3.2. SRC Analysis
11.4. Latin America Cross-Border B2C E-Commerce Market, by End User, 2017-2030(US$ Bn)
11.4.1. Overview
11.4.2. SRC Analysis
11.5. Latin America Cross-Border B2C E-Commerce Market, by Country, 2017-2030 (US$ Bn)
11.5.1. Brazil
11.5.1.1. Brazil Cross-Border B2C E-Commerce Market Estimates and Forecast, 2017-2030 (US$ Bn)
11.5.1.2. Brazil Cross-Border B2C E-Commerce, By Category, 2017-2030 (US$ Bn)
11.5.1.3. Brazil Cross-Border B2C E-Commerce, By End User, 2017-2030 (US$ Bn)
11.5.1.4. Brazil Cross-Border B2C E-Commerce, By Offering, 2017-2030 (US$ Bn)
11.5.1.5. Brazil Cross-Border B2C E-Commerce, By Payment Method, 2017-2030 (US$ Bn)
11.5.2. Mexico
11.5.2.1. Mexico Cross-Border B2C E-Commerce Market Estimates and Forecast, 2017-2030 (US$ Bn)
11.5.2.2. Mexico Cross-Border B2C E-Commerce, By Category, 2017-2030 (US$ Bn)
11.5.2.3. Mexico Cross-Border B2C E-Commerce, By Offering, 2017-2030 (US$ Bn)
11.5.2.4. Mexico Cross-Border B2C E-Commerce, By Payment Method, 2017-2030 (US$ Bn)
11.5.2.5. Mexico Cross-Border B2C E-Commerce, By End User, 2017-2030 (US$ Bn)
11.5.3. Rest of Latin America
11.5.3.1. Rest of Latin America Cross-Border B2C E-Commerce Market Estimates and Forecast, 2017-2030 (US$ Bn)
11.5.3.2. Rest of Latin America Cross-Border B2C E-Commerce, By Category, 2017-2030 (US$ Bn)
11.5.3.3. Rest of Latin America Cross-Border B2C E-Commerce, By Offering, 2017-2030 (US$ Bn)
11.5.3.4. Rest of Latin America Cross-Border B2C E-Commerce, By Payment Method, 2017-2030 (US$ Bn)
11.5.3.5. Rest of Latin America Cross-Border B2C E-Commerce, By End User, 2017-2030 (US$ Bn)

12. Middle East and Africa Cross-Border B2C E-Commerce Market Analysis
12.1. Middle East and Africa Cross-Border B2C E-Commerce Market, by Category, 2017-2030(US$ Bn)
12.1.1. Overview
12.1.2. SRC Analysis
12.2. Middle East and Africa Cross-Border B2C E-Commerce Market, by Offering, 2017-2030(US$ Bn)
12.2.1. Overview
12.2.2. SRC Analysis
12.3. Middle East and Africa Cross-Border B2C E-Commerce Market, by Payment Method, 2017-2030(US$ Bn)
12.3.1. Overview
12.3.2. SRC Analysis
12.4. Middle East and Africa Cross-Border B2C E-Commerce Market, by End User, 2017-2030(US$ Bn)
12.4.1. Overview
12.4.2. SRC Analysis
12.5. Middle East and Africa Cross-Border B2C E-Commerce Market, by Country, 2017-2030 (US$ Bn)
12.5.1. GCC Countries
12.5.1.1. GCC Countries il Cross-Border B2C E-Commerce Market Estimates and Forecast, 2017-2030 (US$ Bn)
12.5.1.2. GCC Countries Cross-Border B2C E-Commerce, By Category, 2017-2030 (US$ Bn)
12.5.1.3. GCC Countries Cross-Border B2C E-Commerce, By Offering, 2017-2030 (US$ Bn)
12.5.1.4. GCC Countries Cross-Border B2C E-Commerce, By Payment Method, 2017-2030 (US$ Bn)
12.5.1.5. GCC Countries Cross-Border B2C E-Commerce, By End User, 2017-2030 (US$ Bn)
12.5.2. South Africa
12.5.2.1. South Africa Cross-Border B2C E-Commerce Market Estimates and Forecast, 2017-2030 (US$ Bn)
12.5.2.2. South Africa Cross-Border B2C E-Commerce, By Category, 2017-2030 (US$ Bn)
12.5.2.3. South Africa Cross-Border B2C E-Commerce, By Offering, 2017-2030 (US$ Bn)
12.5.2.4. South Africa Cross-Border B2C E-Commerce, By Payment Method, 2017-2030 (US$ Bn)
12.5.2.5. South Africa Cross-Border B2C E-Commerce, By End User, 2017-2030 (US$ Bn)
12.5.3. Rest of Middle East and Africa
12.5.3.1. Rest of Middle East and Africa Cross-Border B2C E-Commerce Market Estimates and Forecast, 2017-2030 (US$ Bn)
12.5.3.2. Rest of Middle East and Africa Cross-Border B2C E-Commerce, By Category, 2017-2030 (US$ Bn)
12.5.3.3. Rest of Middle East and Africa Cross-Border B2C E-Commerce, By End User, 2017-2030 (US$ Bn)
12.5.3.4. Rest of Middle East and Africa Cross-Border B2C E-Commerce, By Offering, 2017-2030 (US$ Bn)
12.5.3.5. Rest of Middle East and Africa Cross-Border B2C E-Commerce, By Payment Method, 2017-2030 (US$ Bn)

13. Company Profiles
13.1. Amazon.com Inc.
13.1.1. Company Overview
13.1.2. Products/Services Portfolio
13.1.3. Geographical Presence
13.1.4. Financial Summary
13.1.4.1. Market Revenue and Net Profit (2019-2022)
13.1.4.2. Business Segment Revenue Analysis
13.1.4.3. Geographical Revenue Analysis
13.2. Etsy Inc
13.3. eBay Inc
13.4. Alibaba Group
13.5. Wish Inc
13.6. Vee Pee
13.7. Cnova
13.8. Asos Plc
13.9. Fruugo
13.10. JD.com (Jing Dong)
13.11. Apple Inc
13.12. DHL Group
13.13. Box Me
13.14. Pay pal
13.15. Asia Commerce
13.16. Sing Post
13.17. Shipping Cart
13.18. Anchanto
13.19. SIA Joom (Latvia)
13.20. Zalando

List of Figures
FIG. 1 Global Cross-Border B2C E-Commerce Market: Research Methodology
FIG. 2 Market Size Estimation – Top Down & Bottom up Approach
FIG. 3 Global Cross-Border B2C E-Commerce Market Segmentation
FIG. 4 Global Cross-Border B2C E-Commerce Market, by Category, 2022 (US$ Bn)
FIG. 5 Global Cross-Border B2C E-Commerce Market, by End User, 2022 (US$ Bn)
FIG. 6 Global Cross-Border B2C E-Commerce Market, by Offering Type, 2022 (US$ Bn)
FIG. 7 Global Cross-Border B2C E-Commerce Market, by Payment Method, 2022 (US$ Bn)
FIG. 8 Global Cross-Border B2C E-Commerce Market, by Geography, 2022 (US$ Bn)
FIG. 9 Attractive Investment Proposition, by Category, 2022
FIG. 10 Attractive Investment Proposition, by End User, 2022
FIG. 11 Attractive Investment Proposition, by Offering Type, 2022
FIG. 12 Attractive Investment Proposition, by Payment Method, 2022
FIG. 13 Attractive Investment Proposition, by Geography, 2022
FIG. 14 Global Market Share Analysis of Key Cross-Border B2C E-Commerce Market Manufacturers, 2022
FIG. 15 Global Market Positioning of Key Cross-Border B2C E-Commerce Market Manufacturers, 2022
FIG. 16 Global Cross-Border B2C E-Commerce Market Value Contribution, By Category, 2022 & 2030 (Value %)
FIG. 17 Global Cross-Border B2C E-Commerce Market, by Apparel and Accessories, Value, 2017-2030 (US$ Bn)
FIG. 18 Global Cross-Border B2C E-Commerce Market, by Personal Care and Beauty, Value, 2017-2030 (US$ Bn)
FIG. 19 Global Cross-Border B2C E-Commerce Market, by Entertainment and Education, Value, 2017-2030 (US$ Bn)
FIG. 20 Global Cross-Border B2C E-Commerce Market, by Healthcare and Nutrition, Value, 2017-2030 (US$ Bn)
FIG. 21 Global Cross-Border B2C E-Commerce Market, by Food and Beverage, Value, 2017-2030 (US$ Bn)
FIG. 22 Global Cross-Border B2C E-Commerce Market, by Others, Value, 2017-2030 (US$ Bn)
FIG. 23 Global Cross-Border B2C E-Commerce Market Value Contribution, By End User, 2022 & 2030 (Value %)
FIG. 24 Global Cross-Border B2C E-Commerce Market, by Adults, Value, 2017-2030 (US$ Bn)
FIG. 25 Global Cross-Border B2C E-Commerce Market, by Teenagers/Millennial, Value, 2017-2030 (US$ Bn)
FIG. 26 Global Cross-Border B2C E-Commerce Market, by Senior Citizens, Value, 2017-2030 (US$ Bn)
FIG. 27 Global Cross-Border B2C E-Commerce Market, by Others, Value, 2017-2030 (US$ Bn)
FIG. 28 Global Cross-Border B2C E-Commerce Market Value Contribution, By Offering, 2022 & 2030 (Value %)
FIG. 29 Global Cross-Border B2C E-Commerce Market, by Assorted Brands, Value, 2017-2030 (US$ Bn)
FIG. 30 Global Cross-Border B2C E-Commerce Market, by In-House Brands, Value, 2017-2030 (US$ Bn)
FIG. 31 Global Cross-Border B2C E-Commerce Market Value Contribution, By Payment Method, 2022 & 2030 (Value %)
FIG. 32 Global Cross-Border B2C E-Commerce Market, by Digital Wallets, Value, 2017-2030 (US$ Bn)
FIG. 33 Global Cross-Border B2C E-Commerce Market, by Internet Banking, Value, 2017-2030 (US$ Bn)
FIG. 34 Global Cross-Border B2C E-Commerce Market, Credit/Debit Cards, Value, 2017-2030 (US$ Bn)
FIG. 35 Global Cross-Border B2C E-Commerce Market, Others, Value, 2017-2030 (US$ Bn)
FIG. 36 U.S. Cross-Border B2C E-Commerce Market, 2017-2030 (US$ Bn)
FIG. 37 Canada Cross-Border B2C E-Commerce Market, 2017-2030 (US$ Bn)
FIG. 38 Germany Cross-Border B2C E-Commerce Market, 2017-2030 (US$ Bn)
FIG. 39 France Cross-Border B2C E-Commerce Market, 2017-2030 (US$ Bn)
FIG. 40 U.K. Cross-Border B2C E-Commerce Market, 2017-2030 (US$ Bn)
FIG. 41 Italy Cross-Border B2C E-Commerce Market, 2017-2030 (US$ Bn)
FIG. 42 Spain Cross-Border B2C E-Commerce Market, 2017-2030 (US$ Bn)
FIG. 43 Rest of Europe Cross-Border B2C E-Commerce Market, 2017-2030 (US$ Bn)
FIG. 44 China Cross-Border B2C E-Commerce Market, 2017-2030 (US$ Bn)
FIG. 45 Japan Cross-Border B2C E-Commerce Market, 2017-2030 (US$ Bn)
FIG. 46 India Cross-Border B2C E-Commerce Market, 2017-2030 (US$ Bn)
FIG. 47 South Korea Cross-Border B2C E-Commerce Market, 2017-2030 (US$ Bn)
FIG. 48 Southeast Asia Cross-Border B2C E-Commerce Market, 2017-2030 (US$ Bn)
FIG. 49 Rest of Asia Pacific Cross-Border B2C E-Commerce Market, 2017-2030 (US$ Bn)
FIG. 50 Latin America Cross-Border B2C E-Commerce Market, 2017-2030 (US$ Bn)
FIG. 51 Brazil Cross-Border B2C E-Commerce Market, 2017-2030 (US$ Bn)
FIG. 52 Mexico Cross-Border B2C E-Commerce Market, 2017-2030 (US$ Bn)
FIG. 53 Rest of Latin America Cross-Border B2C E-Commerce Market, 2017-2030 (US$ Bn)
FIG. 54 Middle East & Africa Cross-Border B2C E-Commerce Market, 2017-2030 (US$ Bn)
FIG. 55 GCC Countries Cross-Border B2C E-Commerce Market, 2017-2030 (US$ Bn)
FIG. 56 South Africa Cross-Border B2C E-Commerce Market, 2017-2030 (US$ Bn)
FIG. 57 Rest of Middle East and Africa Cross-Border B2C E-Commerce Market, 2017-2030 (US$ Bn)

List of Tables
TABLE 1 Market Snapshot: Global Cross-Border B2C E-Commerce Market
TABLE 2 Global Cross-Border B2C E-Commerce Market, by Competitive Benchmarking, 2022
TABLE 3 Global Cross-Border B2C E-Commerce Market, by Geographical Presence Analysis, 2022
TABLE 4 Global Cross-Border B2C E-Commerce Market, by Key Strategies Analysis, 2022
TABLE 5 Global Cross-Border B2C E-Commerce Market, by Category, 2017-2030 (US$ Bn)
TABLE 6 Global Cross-Border B2C E-Commerce Market, by Offering, 2017-2030 (US$ Bn)
TABLE 7 Global Cross-Border B2C E-Commerce Market, by Payment Method, 2017-2030 (US$ Bn)
TABLE 8 Global Cross-Border B2C E-Commerce Market, by End User, 2017-2030 (US$ Bn)
TABLE 9 Global Cross-Border B2C E-Commerce Market, by Geography, 2017-2030 (US$ Bn)
TABLE 10 North America Cross-Border B2C E-Commerce Market, by Category, 2017-2030 (US$ Bn)
TABLE 11 North America Cross-Border B2C E-Commerce Market, by End User, 2017-2030 (US$ Bn)
TABLE 12 North America Cross-Border B2C E-Commerce Market, by Offering, 2017-2030 (US$ Bn)
TABLE 13 North America Cross-Border B2C E-Commerce Market, by Payment Method, 2017-2030 (US$ Bn)
TABLE 14 North America Cross-Border B2C E-Commerce Market, by Country, 2017-2030 (US$ Bn)
TABLE 15 US Cross-Border B2C E-Commerce Market, by Category, 2017-2030 (US$ Bn)
TABLE 16 US Cross-Border B2C E-Commerce Market, by End User, 2017-2030 (US$ Bn)
TABLE 17 US Cross-Border B2C E-Commerce Market, by Offering, 2017-2030 (US$ Bn)
TABLE 18 US Cross-Border B2C E-Commerce Market, by Payment Method, 2017-2030 (US$ Bn)
TABLE 19 Canada Cross-Border B2C E-Commerce Market, by Category, 2017-2030 (US$ Bn)
TABLE 20 Canada Cross-Border B2C E-Commerce Market, by End User, 2017-2030 (US$ Bn)
TABLE 21 Canada Cross-Border B2C E-Commerce Market, by Offering, 2017-2030 (US$ Bn)
TABLE 22 Canada Cross-Border B2C E-Commerce Market, by Payment Method, 2017-2030 (US$ Bn)
TABLE 23 Europe Cross-Border B2C E-Commerce Market, by Category, 2017-2030 (US$ Bn)
TABLE 24 Europe Cross-Border B2C E-Commerce Market, by Offering, 2017-2030 (US$ Bn)
TABLE 25 Europe Cross-Border B2C E-Commerce Market, by Payment Method, 2017-2030 (US$ Bn)
TABLE 26 Europe Cross-Border B2C E-Commerce Market, by End User, 2017-2030 (US$ Bn)
TABLE 27 Europe Cross-Border B2C E-Commerce Market, by Country, 2017-2030 (US$ Bn)
TABLE 28 Germany Cross-Border B2C E-Commerce Market, by Category, 2017-2030 (US$ Bn)
TABLE 29 Germany Cross-Border B2C E-Commerce Market, by Offering, 2017-2030 (US$ Bn)
TABLE 30 Germany Cross-Border B2C E-Commerce Market, by Payment Method, 2017-2030 (US$ Bn)
TABLE 31 Germany Cross-Border B2C E-Commerce Market, by End User, 2017-2030 (US$ Bn)
TABLE 32 France Cross-Border B2C E-Commerce Market, by Category, 2017-2030 (US$ Bn)
TABLE 33 France Cross-Border B2C E-Commerce Market, by Offering, 2017-2030 (US$ Bn)
TABLE 34 France Cross-Border B2C E-Commerce Market, by Payment Method, 2017-2030 (US$ Bn)
TABLE 35 France Cross-Border B2C E-Commerce Market, by End User, 2017-2030 (US$ Bn)
TABLE 36 UK Cross-Border B2C E-Commerce Market, by Category, 2017-2030 (US$ Bn)
TABLE 37 UK Cross-Border B2C E-Commerce Market, by End User, 2017-2030 (US$ Bn)
TABLE 38 UK Cross-Border B2C E-Commerce Market, by Offering, 2017-2030 (US$ Bn)
TABLE 39 UK Cross-Border B2C E-Commerce Market, by Payment Method, 2017-2030 (US$ Bn)
TABLE 40 Italy Cross-Border B2C E-Commerce Market, by Category, 2017-2030 (US$ Bn)
TABLE 41 Italy Cross-Border B2C E-Commerce Market, by End User, 2017-2030 (US$ Bn)
TABLE 42 Italy Cross-Border B2C E-Commerce Market, by Offering, 2017-2030 (US$ Bn)
TABLE 43 Italy Cross-Border B2C E-Commerce Market, by Payment Method, 2017-2030 (US$ Bn)
TABLE 44 Spain Cross-Border B2C E-Commerce Market, by Category, 2017-2030 (US$ Bn)
TABLE 45 Spain Cross-Border B2C E-Commerce Market, by End User, 2017-2030 (US$ Bn)
TABLE 46 Spain Cross-Border B2C E-Commerce Market, by Offering, 2017-2030 (US$ Bn)
TABLE 47 Spain Cross-Border B2C E-Commerce Market, by Payment Method, 2017-2030 (US$ Bn)
TABLE 48 Rest of Europe Cross-Border B2C E-Commerce Market, by Category, 2017-2030 (US$ Bn)
TABLE 49 Rest of Europe Cross-Border B2C E-Commerce Market, by End User, 2017-2030 (US$ Bn)
TABLE 50 Rest of Europe Cross-Border B2C E-Commerce Market, by Offering, 2017-2030 (US$ Bn)
TABLE 51 Rest of Europe Cross-Border B2C E-Commerce Market, by Payment Method, 2017-2030 (US$ Bn)
TABLE 52 Asia Pacific Cross-Border B2C E-Commerce Market, by Category, 2017-2030 (US$ Bn)
TABLE 53 Asia Pacific Cross-Border B2C E-Commerce Market, by End User, 2017-2030 (US$ Bn)
TABLE 54 Asia Pacific Cross-Border B2C E-Commerce Market, by Offering, 2017-2030 (US$ Bn)
TABLE 55 Asia Pacific Cross-Border B2C E-Commerce Market, by Payment Method, 2017-2030 (US$ Bn)
TABLE 56 Asia Pacific Cross-Border B2C E-Commerce Market, by Country, 2017-2030 (US$ Bn)
TABLE 57 China Cross-Border B2C E-Commerce Market, by Category, 2017-2030 (US$ Bn)
TABLE 58 China Cross-Border B2C E-Commerce Market, by End User, 2017-2030 (US$ Bn)
TABLE 59 China Cross-Border B2C E-Commerce Market, by Offering, 2017-2030 (US$ Bn)
TABLE 60 China Cross-Border B2C E-Commerce Market, by Payment Method, 2017-2030 (US$ Bn)
TABLE 61 Japan Cross-Border B2C E-Commerce Market, by Category, 2017-2030 (US$ Bn)
TABLE 62 Japan Cross-Border B2C E-Commerce Market, by End User, 2017-2030 (US$ Bn)
TABLE 63 Japan Cross-Border B2C E-Commerce Market, by Offering, 2017-2030 (US$ Bn)
TABLE 64 Japan Cross-Border B2C E-Commerce Market, by Payment Method, 2017-2030 (US$ Bn)
TABLE 65 India Cross-Border B2C E-Commerce Market, by Category, 2017-2030 (US$ Bn)
TABLE 66 India Cross-Border B2C E-Commerce Market, by End User, 2017-2030 (US$ Bn)
TABLE 67 India Cross-Border B2C E-Commerce Market, by Offering, 2017-2030 (US$ Bn)
TABLE 68 India Cross-Border B2C E-Commerce Market, by Payment Method, 2017-2030 (US$ Bn)
TABLE 69 South Korea Cross-Border B2C E-Commerce Market, by Category, 2017-2030 (US$ Bn)
TABLE 70 South Korea Cross-Border B2C E-Commerce Market, by End User, 2017-2030 (US$ Bn)
TABLE 71 South Korea Cross-Border B2C E-Commerce Market, by Offering, 2017-2030 (US$ Bn)
TABLE 72 South Korea Cross-Border B2C E-Commerce Market, by Payment Method, 2017-2030 (US$ Bn)
TABLE 73 South East Asia Cross-Border B2C E-Commerce Market, by Category, 2017-2030 (US$ Bn)
TABLE 74 South East Asia Cross-Border B2C E-Commerce Market, by End User, 2017-2030 (US$ Bn)
TABLE 75 South East Asia Cross-Border B2C E-Commerce Market, by Offering, 2017-2030 (US$ Bn)
TABLE 76 South East Asia Cross-Border B2C E-Commerce Market, by Payment Method, 2017-2030 (US$ Bn)
TABLE 77 Rest of Asia Pacific Cross-Border B2C E-Commerce Market, by Category, 2017-2030 (US$ Bn)
TABLE 78 Rest of Asia Pacific Cross-Border B2C E-Commerce Market, by End User, 2017-2030 (US$ Bn)
TABLE 79 Rest of Asia Pacific Cross-Border B2C E-Commerce Market, by Offering, 2017-2030 (US$ Bn)
TABLE 80 Rest of Asia Pacific Cross-Border B2C E-Commerce Market, by Payment Method, 2017-2030 (US$ Bn)
TABLE 81 Latin America Cross-Border B2C E-Commerce Market, by Category, 2017-2030 (US$ Bn)
TABLE 82 Latin America Cross-Border B2C E-Commerce Market, by End User, 2017-2030 (US$ Bn)
TABLE 83 Latin America Cross-Border B2C E-Commerce Market, by Offering, 2017-2030 (US$ Bn)
TABLE 84 Latin America Cross-Border B2C E-Commerce Market, by Payment Method, 2017-2030 (US$ Bn)
TABLE 85 Latin America Cross-Border B2C E-Commerce Market, by Country, 2017-2030 (US$ Bn)
TABLE 86 Brazil Cross-Border B2C E-Commerce Market, by Category, 2017-2030 (US$ Bn)
TABLE 87 Brazil Cross-Border B2C E-Commerce Market, by End User, 2017-2030 (US$ Bn)
TABLE 88 Brazil Cross-Border B2C E-Commerce Market, by Offering, 2017-2030 (US$ Bn)
TABLE 89 Brazil Cross-Border B2C E-Commerce Market, by Payment Method, 2017-2030 (US$ Bn)
TABLE 90 Mexico Cross-Border B2C E-Commerce Market, by Category, 2017-2030 (US$ Bn)
TABLE 91 Mexico Cross-Border B2C E-Commerce Market, by End User, 2017-2030 (US$ Bn)
TABLE 92 Mexico Cross-Border B2C E-Commerce Market, by Offering, 2017-2030 (US$ Bn)
TABLE 93 Mexico Cross-Border B2C E-Commerce Market, by Payment Method, 2017-2030 (US$ Bn)
TABLE 94 Mexico Cross-Border B2C E-Commerce Market, by End User, 2017-2030 (US$ Bn)
TABLE 95 Rest of Latin America Cross-Border B2C E-Commerce Market, by Category, 2017-2030 (US$ Bn)
TABLE 96 Rest of Latin America Cross-Border B2C E-Commerce Market, by Offering, 2017-2030 (US$ Bn)
TABLE 97 Rest of Latin America Cross-Border B2C E-Commerce Market, by Payment Method, 2017-2030 (US$ Bn)
TABLE 98 Rest of Latin America Cross-Border B2C E-Commerce Market, by End User, 2017-2030 (US$ Bn)
TABLE 99 Middle East and Africa Cross-Border B2C E-Commerce Market, by Category, 2017-2030 (US$ Bn)
TABLE 100 Middle East and Africa Cross-Border B2C E-Commerce Market, by Offering, 2017-2030 (US$ Bn)
TABLE 101 Middle East and Africa Cross-Border B2C E-Commerce Market, by Payment Method, 2017-2030 (US$ Bn)
TABLE 102 Middle East and Africa Cross-Border B2C E-Commerce Market, by End User, 2017-2030 (US$ Bn)
TABLE 103 Middle East and Africa Cross-Border B2C E-Commerce Market, by Country, 2017-2030 (US$ Bn)
TABLE 104 GCC Countries Cross-Border B2C E-Commerce Market, by Category, 2017-2030 (US$ Bn)
TABLE 105 GCC Countries Cross-Border B2C E-Commerce Market, by Offering, 2017-2030 (US$ Bn)
TABLE 106 GCC Countries Cross-Border B2C E-Commerce Market, by Payment Method, 2017-2030 (US$ Bn)
TABLE 107 GCC Countries Cross-Border B2C E-Commerce Market, by End User, 2017-2030 (US$ Bn)
TABLE 108 South Africa Cross-Border B2C E-Commerce Market, by Category, 2017-2030 (US$ Bn)
TABLE 109 South Africa Cross-Border B2C E-Commerce Market, by Offering, 2017-2030 (US$ Bn)
TABLE 110 South Africa Cross-Border B2C E-Commerce Market, by Payment Method, 2017-2030 (US$ Bn)
TABLE 111 South Africa Cross-Border B2C E-Commerce Market, by End User, 2017-2030 (US$ Bn)
TABLE 112 Rest of Middle East and Africa Cross-Border B2C E-Commerce Market, by Category, 2017-2030 (US$ Bn)
TABLE 113 Rest of Middle East and Africa Cross-Border B2C E-Commerce Market, by End User, 2017-2030 (US$ Bn)
TABLE 114 Rest of Middle East and Africa Cross-Border B2C E-Commerce Market, by Offering, 2017-2030 (US$ Bn)
TABLE 115 Rest of Middle East and Africa Cross-Border B2C E-Commerce Market, by Payment Method, 2017-2030 (US$ Bn)

Frequently asked questions

How does COVID-19 Impact the global cross-border B2C e-commerce market?

The spread of the COVID-19 virus has highlighted the need for flexible cross-border e-commerce transactions. Therefore, with the outbreak, it has become necessary for B2C brands to implement effective multichannel strategies to aid these cross-border e-commerce activities.

Which is the leading region of the market for cross-border B2C e-commerce?

Asia-Pacific accounted for the most heightened share in the global cross-border B2C e-commerce market.

What are the key drivers for the growth of the cross-border B2C e-commerce market?

The rising adoption of digital solutions for the cross-border e-commerce market coexists with a recurring obstacle for vendors as they have to deal with fraudulent activities and cyber threats that drive the cross-border B2C e-commerce market.

Which is the major segment in the cross-border B2C e-commerce market by category?

The apparel and accessories segment had a major global market share in 2022.

Which is the major segment in the cross-border B2C e-commerce market by the end user?

The adult segment had a major share in the global market.

Which is the major segment in the cross-border B2C e-commerce market by offering?

The assorted brands segment had a major share of the global market in 2022.

Which is the major segment in the cross-border B2C e-commerce market by payment method?

The digital wallets segment had a major share in the global market.

LiDAR Market

Published:
Report ID: 12346

Digital Intraoral Sensor and Consumable Market

Published:
Report ID: 35017

Digital Photo Frame Market

Published:
Report ID: 34914

Gift Cards Market

Published:
Report ID: 6518

Cooling Towers Market

Published:
Report ID: 4381

Virtual Reality (VR) Market

Published:
Report ID: 11345

Identity And Access Management (IAM) Market

Published:
Report ID: 6005

Smart Grid Managed Services Market

Published:
Report ID: 10208

Picture Archiving and Communication Systems (PACS) Market

Published:
Report ID: 9676

Chatbots Market

Published:
Report ID: 3733

Over-the-Top (OTT) Market

Published:
Report ID: 8377

Enterprise Video Market

Published:
Report ID: 5414

Purchase Options

$2999
Delivery Format: Excel.
$4999
Designed for the individual purchaser.
$6999
Users located at a single corporate site or regional office.
$7999
Allowed for unlimited sharing globally within one company.
Smallform of Sample request

Have a question?

User Profile

Don’t settle for less – trust Mitul to help you find the best solution.

Report delivery within 24 to 48 hours

– Other Info –

What people say?-

User Review

I am very impressed with the information in this report. The author clearly did their research when they came up with this product and it has already given me a lot of ideas.

Jana Schmidt
CEDAR CX Technologies

– Connect with us –

Phone

+91 6232 49 3207


support

24/7 Research Support


sales@credenceresearch.com

– Research Methodology –

Going beyond the basics: advanced techniques in research methodology

– Trusted By –

Pepshi, LG, Nestle
Motorola, Honeywell, Johnson and johnson
LG Chem, SIEMENS, Pfizer
Unilever, Samsonite, QIAGEN