
Market Overview:
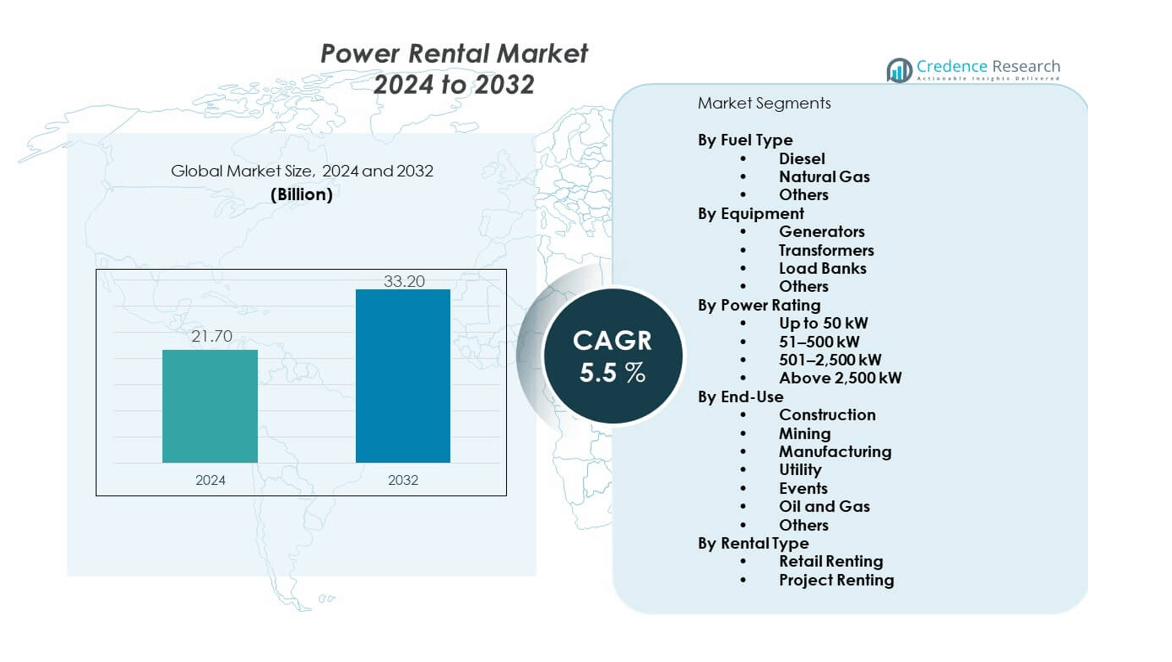
The Power Rental Market is projected to grow from USD 21.7 billion in 2024 to USD 33.2 billion by 2032, registering a compound annual growth rate (CAGR) of 5.5% during the forecast period.
| REPORT ATTRIBUTE | DETAILS |
|---|---|
| Historical Period | 2020-2023 |
| Base Year | 2024 |
| Forecast Period | 2025-2032 |
| Power Rental Market Size 2024 | USD 21.7 billion |
| Power Rental Market, CAGR | 5.5% |
| Power Rental Market Size 2032 | USD 33.2 billion |
Growing energy demand, coupled with rapid urbanization and industrialization, drives adoption of rental power solutions. Industries prefer flexible rental services to reduce upfront capital expenditure while meeting short-term or seasonal requirements. The surge in natural disasters and unexpected outages highlights the need for backup solutions, increasing reliance on rental generators and mobile power systems. Furthermore, strict emission regulations are encouraging companies to rent fuel-efficient and eco-friendly units, creating opportunities for service providers to expand advanced fleets.
Regionally, North America leads the Power Rental Market due to aging grid infrastructure, frequent weather disruptions, and strong demand from oil and gas industries. Europe follows with increased focus on renewable integration and temporary backup solutions to stabilize grids. Asia-Pacific is expected to witness the fastest growth, driven by large-scale construction activities, rapid industrial expansion, and power deficits in countries like India and China. Emerging regions in Latin America, the Middle East, and Africa are also growing, supported by investments in mining, infrastructure projects, and expanding electrification efforts.
Market Insights:
- The Power Rental Market was valued at USD 21.7 billion in 2024 and is projected to reach USD 33.2 billion by 2032, expanding at a CAGR of 5.5% during the forecast period.
- Growing demand from infrastructure development, construction projects, and industrial expansion is driving the adoption of temporary power solutions across multiple sectors.
- Increasing frequency of power outages and grid instability is boosting reliance on rental generators and backup systems.
- High operational costs and fluctuating fuel prices act as key restraints, challenging providers to maintain cost-effective and sustainable services.
- North America dominates the market, supported by aging grids, weather disruptions, and strong oil and gas industry demand.
- Asia-Pacific is set to register the fastest growth, driven by rapid industrialization, urbanization, and rising electrification in emerging economies.
- Europe continues to grow steadily, backed by strict emission regulations and greater adoption of hybrid rental power solutions.
Market Drivers:
Rising Infrastructure Development and Growing Industrialization Fueling Demand for Temporary Power Solutions:
The Power rental market benefits from large-scale infrastructure projects and expanding industrial bases worldwide. Construction sites often require temporary power to operate heavy machinery and tools, especially in regions where electricity grid access is limited. Industries rely on rental solutions to ensure uninterrupted operations during expansion or renovation phases. The growing demand for mining, oil, and gas projects adds further traction. Seasonal industries also turn to rental services to meet fluctuating energy requirements. This flexibility strengthens the appeal of rental power solutions. It reduces the need for capital investment in permanent facilities. The market thrives by addressing short-term and large-scale power needs with reliability.
- For instance, Aggreko operates one of the largest fleets of rental generators globally, recently expanding its rental capacity with 500kVA generators to support demanding infrastructure projects, offering tailored power solutions for critical construction and mining operations with remote deployment capabilities.
Increasing Frequency of Power Outages and Grid Instability Driving Need for Backup Solutions:
Frequent outages and unstable grid networks are significant drivers for the Power rental market. Extreme weather conditions, aging infrastructure, and rising energy consumption cause instability in many regions. Businesses cannot afford downtime and invest in backup solutions to ensure continuity. Rental services provide an efficient and immediate option during emergencies. Events and critical facilities, such as hospitals, also depend on reliable rental equipment. It creates opportunities for providers to deploy advanced systems with high efficiency. The rising number of natural disasters intensifies this demand further. Power rental ensures fast restoration and uninterrupted operations when grids fail.
- For instance, APR Energy’s modular power plants are designed for rapid deployment in emergency and disaster scenarios globally, providing scalable and efficient power generation within days. They feature high reliability for critical backup needs in hospitals and disaster zones, supporting grid stability during outages.
Cost-Effectiveness and Capital Expenditure Savings Encouraging Industrial Adoption of Rental Power:
The Power rental market is supported by the cost advantages it offers to industries. Companies avoid large upfront capital expenditure by choosing rental solutions for temporary or seasonal use. It provides financial flexibility while ensuring energy requirements are met without long-term commitments. Small businesses and startups also benefit from affordable rental options. Industries with fluctuating operations prefer rentals to maintain cost efficiency. The model reduces risks associated with investing in permanent infrastructure that may remain idle. It improves budget management while enabling access to modern equipment. This driver underlines how rental power aligns with business strategies that value flexibility and cost control.
Growing Focus on Cleaner Technologies and Compliance with Emission Standards Enhancing Rental Adoption:
Environmental concerns and emission standards strongly influence the Power rental market. Governments and regulatory bodies mandate cleaner technologies to reduce environmental impact. Rental companies invest in eco-friendly, fuel-efficient units to comply with these rules. Industries choose these solutions to meet sustainability goals without bearing full ownership costs. It allows businesses to maintain operations while adhering to green practices. Renewable hybrid systems are also being integrated into rental fleets. It enhances reliability and reduces reliance on diesel-based generators. This trend drives demand for advanced and compliant power rental offerings across global markets.
Market Trends:
Integration of Digital Monitoring Systems and IoT Platforms Transforming Rental Power Operations:
Digitalization is reshaping the Power rental market with advanced monitoring solutions. IoT platforms enable remote tracking of fuel usage, load performance, and maintenance needs. These systems allow providers to optimize fleet management and reduce downtime. Customers benefit from enhanced transparency and efficiency in service delivery. Predictive analytics supports proactive maintenance, extending equipment lifespan. It helps companies lower operational costs while ensuring uninterrupted supply. The adoption of smart technologies strengthens customer confidence in rental services. This trend is transforming the industry into a data-driven and technology-enabled sector.
- For instance, Shenton Group integrated IoT-enabled remote monitoring systems across its fleet of rental generators, allowing real-time analytics for fuel consumption and maintenance alerts, reducing unexpected downtimes by 15% and improving operational efficiency.
Expansion of Hybrid Rental Power Solutions Combining Renewable Energy and Conventional Sources:
Hybrid systems are gaining popularity in the Power rental market. Combining solar, wind, or battery storage with diesel or gas generators creates reliable and cleaner power sources. Industries adopt these hybrid units to reduce fuel costs and emissions. Rental companies invest in hybrid solutions to meet sustainability demands from clients. It ensures flexibility while balancing renewable intermittency with stable generation. Events, construction projects, and remote sites increasingly choose hybrid rentals. The trend enhances resilience against fuel price fluctuations. It represents a significant shift toward sustainable and efficient rental power solutions.
- For instance, RenEnergy Group, now part of Aggreko, specializes in hybrid solar and battery storage rental systems, supporting commercial and industrial clients with renewable-backed power, integrating seamlessly with conventional generators to ensure consistent performance in varying operational conditions.
Growing Demand for Mobile and Modular Rental Equipment Across Temporary and Remote Applications:
The Power rental market is seeing rising demand for mobile and modular units. These solutions provide quick deployment for events, disaster relief, or remote operations. Portable generators and scalable modules enable flexibility in meeting varying loads. Industries prefer modular systems that can expand with operational needs. Rental providers design equipment that offers easy transport and setup. It saves time and reduces logistic challenges for businesses. The trend caters to sectors where immediate access to reliable power is critical. Mobile and modular solutions are shaping customer expectations for speed and convenience.
Increasing Role of Long-Term Rental Contracts and Strategic Partnerships in Strengthening Market Stability:
The Power rental market is witnessing growth in long-term contracts. Companies secure rental services for extended periods to ensure consistent supply. It provides financial predictability and operational stability for both clients and providers. Strategic partnerships between rental firms and industries are strengthening. These collaborations guarantee customized solutions for complex requirements. Rental companies gain recurring revenue, while clients enjoy reliable access to advanced equipment. It aligns with trends in industries such as oil, gas, and mining that require long-term energy solutions. This trend underlines the market’s shift from short-term fixes to structured service models.
Market Challenges Analysis:
Fluctuating Fuel Prices and Dependence on Non-Renewable Sources Creating Cost and Sustainability Pressures:
The Power rental market faces challenges from fluctuating fuel prices. Volatility in oil and gas markets directly impacts operational costs for rental providers and clients. High dependence on diesel-based systems raises sustainability concerns. It pressures companies to explore alternatives while managing rising costs. Adopting cleaner technologies requires significant investment, straining smaller providers. Customers also demand eco-friendly solutions, pushing rental firms to modernize fleets rapidly. Meeting these requirements while keeping services affordable is complex. Balancing cost efficiency and sustainability remains one of the most pressing challenges for the industry.
Regulatory Compliance and Competitive Intensity Limiting Profit Margins for Rental Providers Globally:
The Power rental market is challenged by strict environmental and safety regulations. Compliance demands upgrades in technology and constant monitoring of emissions. Providers face additional expenses to maintain regulatory alignment. At the same time, the industry is highly competitive with several global and regional players. Price wars reduce margins, especially in emerging economies. It forces companies to differentiate through service quality and technology innovation. Small providers find it difficult to sustain operations under these conditions. Intense competition and regulatory complexity create barriers for long-term profitability and growth.
Market Opportunities:
Expansion of Renewable Integration and Hybrid Rental Solutions Offering Sustainable Growth Prospects:
The Power rental market presents opportunities in renewable and hybrid solutions. Industries seek to balance cost savings with sustainability goals. Rental providers offering solar, wind, or battery-supported systems gain a competitive edge. It allows clients to reduce fuel consumption and emissions while maintaining reliability. Hybrid solutions also appeal to regions with unstable grids or limited fuel access. Companies can capitalize on this opportunity by expanding green rental fleets. The trend supports global sustainability agendas and strengthens long-term adoption of rental power services.
Increasing Electrification in Emerging Regions Creating Demand for Temporary and Flexible Power Services:
Emerging economies provide strong opportunities for the Power rental market. Rapid urbanization, industrial expansion, and rural electrification projects require temporary power. Many regions still face unstable or incomplete grid networks. Rental services bridge these gaps by offering flexible and immediate solutions. Industries and governments invest in rental units to support infrastructure and community projects. It positions rental power as a critical enabler of development. Providers expanding into these markets can capture growing demand. This opportunity strengthens both global reach and regional impact for power rental solutions.
Market Segmentation Analysis:
By Fuel Type
Diesel dominates the Power rental market because of its high efficiency, robust performance, and wide availability. It remains the preferred choice for heavy-duty applications across industries. Natural gas is steadily gaining share, supported by lower emissions and compliance with sustainability policies. Other fuels cater to specialized needs where conventional sources are not viable.
- For instance, Caterpillar Inc. has introduced a modular generator lineup with natural gas options featuring 10-15% better emission compliance and 8% improved fuel efficiency compared to traditional diesel models, meeting stringent environmental regulations for industrial applications.
By Equipment
Generators hold the largest market share, driven by their versatility in construction, utilities, and event applications. Transformers and load banks serve critical roles in power testing, balancing, and grid support. Other equipment types, including ancillary systems, enhance operational reliability. The variety of equipment ensures solutions meet sector-specific demands effectively.
By Power Rating
The 51–500 kW segment leads due to strong adoption in construction projects, events, and medium-sized industries. The 501–2,500 kW range supports manufacturing and larger industrial setups. Units above 2,500 kW are primarily deployed in oil, gas, and utility-scale projects. Lower capacity systems up to 50 kW remain relevant for events, telecom, and small-scale applications.
By End-Use
Construction and oil and gas sectors are the largest consumers, requiring continuous and flexible energy. Utilities and manufacturing rely on rentals for backup and peak load management. Mining, events, and other industries also contribute notable demand. The adoption reflects both operational continuity and short-term project requirements.
By Rental Type
Project renting dominates, serving large-scale industrial and infrastructure activities. It provides long-term stability and cost-effectiveness for companies. Retail renting supports smaller businesses and individuals with short-term needs, ensuring broader accessibility. This balance reflects the adaptability of rental models across diverse client bases.
By Additional End-Users
Telecom, data centers, and healthcare facilities increasingly depend on rental solutions for critical power backup. Offshore and marine sectors adopt these systems to ensure operational safety in remote environments. Growth in these categories highlights the expanding scope of temporary power beyond traditional industries.
Segmentation:
By Fuel Type
- Diesel
- Natural Gas
- Others
By Equipment
- Generators
- Transformers
- Load Banks
- Others
By Power Rating
- Up to 50 kW
- 51–500 kW
- 501–2,500 kW
- Above 2,500 kW
By End-Use
- Construction
- Mining
- Manufacturing
- Utility
- Events
- Oil and Gas
- Others
By Rental Type
- Retail Renting
- Project Renting
- North America
- U.S.
- Canada
- Mexico
- Europe
- Germany
- France
- U.K.
- Italy
- Spain
- Rest of Europe
- Asia Pacific
- China
- Japan
- India
- South Korea
- South-east Asia
- Rest of Asia Pacific
- Latin America
- Brazil
- Argentina
- Rest of Latin America
- Middle East & Africa
- GCC Countries
- South Africa
- Rest of the Middle East and Africa
Regional Analysis:
North America Leading with Strong Market Share
North America holds the largest share of the Power rental market, accounting for nearly 35% of global revenue. The region benefits from high demand across oil and gas, construction, and utilities. Frequent weather-related disruptions and an aging grid infrastructure further drive adoption of rental power solutions. Companies rely on temporary systems to maintain operations during outages and emergencies. It also gains support from long-term rental contracts in energy-intensive industries. The strong presence of leading rental providers strengthens regional dominance and enhances customer accessibility to advanced fleets.
Europe Driven by Emission Regulations and Hybrid Solutions
Europe captures about 25% of the Power rental market, supported by strict environmental regulations and the growing shift toward hybrid rental systems. Industries in the region adopt cleaner technologies to comply with emission targets and sustainability goals. Events, commercial activities, and public infrastructure projects are key consumers of temporary power. It benefits from the integration of renewable energy sources into rental fleets. Providers are focusing on mobile and modular systems to meet diverse needs. The regulatory landscape ensures consistent demand for compliant and eco-friendly rental services.
Asia-Pacific Emerging as Fastest-Growing Market
Asia-Pacific accounts for nearly 30% of the Power rental market and is projected to record the highest growth rate. Large-scale industrialization, rapid urbanization, and rising electrification projects create significant opportunities. Countries such as China and India face growing energy demand, coupled with grid instability in rural and remote areas. Rental power is adopted to bridge these gaps and ensure uninterrupted supply. It is increasingly used in infrastructure projects, events, and disaster management. Expanding investment in mining and manufacturing also accelerates the market’s expansion in this region.
Key Player Analysis:
- Aggreko (UK)
- Caterpillar Inc. (US)
- Cummins Inc. (US)
- United Rentals, Inc. (US)
- Kohler-SDMO
- Atlas Copco
- APR Energy
- FG Wilson
- Global Power Supply
- Jassim Transport & Stevedoring Co. K.S.C.C.
- Modern Hiring Service
- Newburn Power Rental Ltd
- NIDS GROUP
- ProPower Rental
- Pump Power Rental
- Shenton Group
- Sudhir Power Ltd.
- Herc Rentals
- Sunbelt Rentals
- The Hertz Corporation
- Generac Power Systems
- Ashtead Group plc
Competitive Analysis:
The Power rental market is highly competitive with global and regional players striving for leadership. Aggreko, Caterpillar, Cummins, and United Rentals maintain dominance through expansive fleets, strong brand presence, and global distribution networks. Regional players such as Sudhir Power and Modern Hiring Service strengthen competition by offering localized solutions and cost-effective services. It demonstrates high rivalry as companies differentiate through technology upgrades, fuel-efficient systems, and hybrid rental solutions. Strategic partnerships and long-term contracts with end-use industries further enhance competitive positioning. The market also sees continuous investment in eco-friendly equipment to align with emission regulations. Competitive dynamics reflect a blend of multinational leaders and agile regional providers creating diverse service options.
Recent Developments:
- In June 2025, Aggreko expanded its Greener Upgrades portfolio by introducing three new gas generators with power ratings of 350 kW, 1500 kW, and a 1500 kW Rapid Deploy model. These additions enhance Aggreko's lineup of efficient and lower-emission modular power solutions, designed to help customers achieve performance goals while reducing energy costs and emissions. The new models are suited for various applications from urban developments to remote operations and are part of Aggreko’s Greener Power Packages, which include expert services and remote monitoring capabilities to ensure operational efficiency and reliability.
- In August 2023, Cummins Inc. entered into an expanded strategic partnership with Chevron USA to leverage complementary positions in hydrogen, natural gas, and other lower carbon fuel value chains. This collaboration aims to boost the commercial adoption of renewable and alternative fuels across North America, facilitating Cummins' Destination Zero strategy and expanding lower carbon intensity fuel options for industrial and transportation markets.
- United Rentals announced strong specialty rental growth continuing into 2025, alongside new technological innovations like the ProBox OnDemand-a Bluetooth-enabled automated tool tracking system designed to improve tool availability and reduce losses on worksites. The company also raised its full-year guidance for revenue and increased planned share repurchases by $400 million, reflecting confidence in ongoing demand across construction, industrial sectors, and major infrastructure projects.
Market Concentration & Characteristics:
The Power rental market shows moderate to high concentration with key multinational players holding significant global shares. It is shaped by large-scale providers with strong technical capabilities and diverse rental fleets. Regional firms add competitiveness by focusing on cost efficiency and localized demand. It is characterized by recurring contracts, strong reliance on industrial sectors, and increasing adoption of digital monitoring systems. Hybrid and eco-friendly rental solutions are defining features of the current market structure. Competitive intensity continues to rise with both established and emerging players adapting to evolving energy and sustainability needs.
Report Coverage:
The research report offers an in-depth analysis based on fuel type, equipment, power rating, end-use, rental type, and additional end-users. It details leading market players, providing an overview of their business, product offerings, investments, revenue streams, and key applications. Additionally, the report includes insights into the competitive environment, SWOT analysis, current market trends, as well as the primary drivers and constraints. Furthermore, it discusses various factors that have driven market expansion in recent years. The report also explores market dynamics, regulatory scenarios, and technological advancements that are shaping the industry. It assesses the impact of external factors and global economic changes on market growth. Lastly, it provides strategic recommendations for new entrants and established companies to navigate the complexities of the market.
Future Outlook:
- Growing demand for hybrid power rental solutions integrating renewables and traditional sources.
- Expansion of digital monitoring and IoT technologies in rental operations.
- Rising investments in emission-compliant rental fleets by major providers.
- Increased adoption in emerging economies with unstable grid infrastructure.
- Growth in long-term rental contracts across oil and gas and utilities.
- Rising need for temporary power in data centers and telecom sectors.
- Accelerated demand for mobile and modular rental equipment for remote sites.
- Market growth supported by disaster recovery and emergency backup needs.
- Regional expansion by global leaders through partnerships and acquisitions.
- Strong focus on sustainability driving innovation in eco-friendly rental systems.

Request a Free Sample
Fill in your details and we'll send you a free sample report.
- Sample data tables & charts
- Research methodology
Market Dynamics
Infrastructure Development and Industrialization
Large-scale infrastructure projects and expanding industrial bases require temporary power solutions, especially in regions with limited grid access. Construction, mining, and oil & gas sectors rely on rental power to ensure operational continuity and flexibility during project execution.
Grid Instability and Power Outages
Frequent power outages and aging grid infrastructure in many regions drive demand for backup rental generators and mobile power systems. Businesses and critical facilities depend on rental solutions to maintain operations during emergencies and grid failures.
Cost-Effectiveness and Capital Expenditure Savings
Rental power solutions allow companies to avoid significant upfront investments in permanent power infrastructure, offering financial flexibility and scalability for short-term or fluctuating energy needs. This is particularly attractive for seasonal industries and small businesses.
Stringent Emission Regulations and Cleaner Technologies
Tightening emission standards and sustainability goals are pushing rental providers to offer fuel-efficient and eco-friendly equipment, including hybrid and renewable-integrated systems. This shift enables clients to meet regulatory requirements and environmental targets without owning the latest technology.
Technological Advancements and Digitalization
The integration of IoT, remote monitoring, and predictive analytics in rental fleets enhances operational efficiency, reduces downtime, and provides customers with greater transparency. These innovations are transforming the market into a more data-driven and responsive industry.
Need a Custom Version of This Report?
Tailor the scope, geography, or segments to your exact requirements.
- Custom geography or segment scope
- Direct access to our analyst team
Frequently Asked Questions
What is the current market size for Power rental market, and what is its projected size in 2032?
Which Power rental market segment held the largest share in 2024?
What are the primary factors fueling the growth of the Power rental market?
Who are the leading companies in the Power rental market?
Table of Content
Chapter 1 Market Segmentation
- 1.1 Segmentation Framework
- 1.1.1 Product and Service Classification
- 1.1.2 Application and End-Use Classification
- 1.1.3 Technology and Solution Classification
- 1.1.4 Customer and Distribution Channel Classification
- 1.1.5 Geographic Segmentation
- 1.1.6 Market Segment Definitions and Boundaries
- 1.2 By End-Use
- 1.2.1 Construction
- 1.2.2 Mining
- 1.2.3 Manufacturing
- 1.2.4 Utility
- 1.2.5 Events
- 1.2.6 Oil and Gas
- 1.2.7 Others
- 1.3 By Equipment
- 1.3.1 Generators
- 1.3.2 Transformers
- 1.3.3 Load Banks
- 1.3.4 Others
- 1.4 By Fuel Type
- 1.4.1 Diesel
- 1.4.2 Natural Gas
- 1.4.3 Others
- 1.5 By Power Rating
- 1.5.1 Up to 50 kW
- 1.5.2 51–500 kW
- 1.5.3 501–2,500 kW
- 1.5.4 Above 2,500 kW
Chapter 2 Introduction
- 2.1 Report Objectives and Scope
- 2.2 Product Definition and Industry Terminology
- 2.3 Market Inclusions and Exclusions
- 2.4 Research Process
- 2.4.1 Primary Research and Expert Interviews
- 2.4.2 Secondary Research and Source Review
- 2.4.3 Top-Down and Bottom-Up Estimation
- 2.4.4 Data Triangulation and Verification
- 2.5 Market Size Measurement Basis
- 2.5.1 2024: USD 21.7 billion → 2032: USD 33.2 billion
- 2.6 Historical and Forecast Reference Periods
- 2.6.1 Base Year: 2024
- 2.6.2 Forecast Period: 2024-2032
- 2.7 Research Assumptions and Limitations
Chapter 3 Executive Summary
- 3.1 Market Snapshot and Key Findings
- 3.2 Base-Year Market Size, 2024
- 3.3 Forecast Market Size, 2032
- 3.4 Revenue and Volume Growth Outlook
- 3.5 Key Demand and Supply Indicators
- 3.6 Leading Market Segments
- 3.7 Fastest-Growing Market Opportunities
- 3.8 Regional Performance Highlights
- 3.9 Technology and Industry Transformation
- 3.10 Competitive Landscape Summary
- 3.11 Analyst View and Strategic Implications
Chapter 4 Global Power Rental Market Trends and Developments
- 4.1 Historical Industry Development
- 4.2 Recent Market Trends and Developments
- 4.3 Demand and Customer Behavior Trends
- 4.4 Technology and Product Innovation
- 4.5 Artificial Intelligence, Automation and Digitalization
- 4.6 Local Manufacturing and Supply Chain Realignment
- 4.7 Industry Partnerships, Mergers and Acquisitions
- 4.8 Sustainability and Circular Economy Developments
- 4.9 Government and Private Sector Investment Trends
- 4.10 Emerging Business Models and Commercialization
- 4.11 Industry Developments and Announcements
Chapter 5 Global Power Rental Market Production, Supply and Demand Analysis
- 5.1 Demand Trend and Consumption Analysis
- 5.2 Demand Forecast, 2024-2032
- 5.3 Production and Output Trend
- 5.4 Production and Output Forecast, 2024-2032
- 5.5 Installed Capacity and Capacity Utilization
- 5.6 Company-Wise Production Plants and Statistics
- 5.6.1 Installed Production Capacity
- 5.6.2 Actual Production
- 5.6.3 Planned Capacity and Expansion Targets
- 5.7 Supply Chain Structure and Procurement Trends
- 5.8 Supply-Demand Gap and Bottlenecks
- 5.9 Import Dependence and Sourcing Structure
- 5.10 Contract Manufacturing and Outsourcing
- 5.11 Regional Supply and Demand Concentration
Chapter 6 Global Power Rental Market Pricing Analysis
- 6.1 Pricing Structure and Measurement
- 6.2 Historical Pricing Trends
- 6.3 Pricing Outlook, 2024-2032
- 6.4 Average Selling Price and Unit Economics
- 6.5 Pricing by Product and Market Segment
- 6.6 Geographic Pricing Differences
- 6.7 Key Input, Energy, Labor and Logistics Costs
- 6.8 Contract Pricing and Purchasing Models
- 6.9 Pricing Sensitivity and Competitive Positioning
- 6.10 Price, Margin and Profitability Implications
Chapter 7 Global Power Rental Market Dynamics
- 7.1 Market Growth Drivers
- 7.1.1 Demand-Side Drivers
- 7.1.2 Technology and Innovation Drivers
- 7.1.3 Infrastructure and Investment Drivers
- 7.1.4 Regulatory and Policy Drivers
- 7.2 Market Restraints
- 7.2.1 Cost and Affordability Constraints
- 7.2.2 Technology and Adoption Barriers
- 7.2.3 Supply Chain and Operational Constraints
- 7.3 Market Challenges
- 7.3.1 Competitive Pressure and Margin Erosion
- 7.3.2 Skills, Infrastructure and Implementation Gaps
- 7.4 Emerging Market Opportunities
- 7.5 Market Dynamics Impact and Time-Horizon Assessment
Chapter 8 Global Power Rental Value Chain Analysis
- 8.1 Industry Value Chain Overview
- 8.2 Upstream Suppliers and Critical Inputs
- 8.3 Technology and Component Providers
- 8.4 Manufacturing or Service Delivery
- 8.5 Distribution, Channel Partners and Integrators
- 8.6 Downstream Applications and End Users
- 8.7 Value Addition and Profit Pools
- 8.8 Vertical Integration and Outsourcing
- 8.9 Supplier Concentration and Risk
- 8.10 Supply Chain Localization and Resilience
Chapter 9 Global Power Rental Market Regulations and Policies
- 9.1 Relevant Laws, Standards and Compliance Frameworks
- 9.2 Product, Service, Safety and Quality Requirements
- 9.3 Government Policies, Incentives and Subsidies
- 9.4 Imports, Exports and Trade Barriers
- 9.5 Public Procurement and Local Content Requirements
- 9.6 Environmental and Sustainability Compliance
- 9.7 Upcoming Policy Changes and Market Implications
Chapter 10 Global Power Rental Market Hotspots and Opportunities
- 10.1 Market Opportunity Mapping and Growth Hotspots
- 10.2 High-Growth Applications and Customer Groups
- 10.3 Underserved Markets and White-Space Opportunities
- 10.4 Emerging Technology and Product Opportunities
- 10.5 New Capacity and Investment Hotspots
- 10.6 Market Entry and Expansion Opportunities
- 10.7 Distribution and Partnership Opportunities
- 10.8 Near-Term and Long-Term Commercial Potential
- 10.9 Opportunity Attractiveness and Execution Risks
Chapter 11 Global Power Rental Market Outlook, 2024-2032
- 11.1 Market Size and Analysis
- 11.1.1 Revenue (Market Measurement: 2024: USD 21.7 billion → 2032: USD 33.2 billion)
- 11.1.2 Market Volume and Quantity Sold
- 11.1.3 Historical Market Size
- 11.1.4 Base-Year Market Size, 2024
- 11.2 Market Forecast, 2024-2032
- 11.2.1 Revenue Forecast to 2032
- 11.2.2 Volume Forecast to 2032
- 11.2.3 CAGR and Year-on-Year Growth
- 11.2.4 Incremental Revenue Opportunity
- 11.3 Forecast Assumptions and Scenario Analysis
- 11.3.1 Base-Case Forecast
- 11.3.2 Optimistic and Conservative Scenarios
- 11.3.3 Technology, Pricing and Policy Sensitivities
- 11.4 Market Attractiveness and Growth Outlook
Chapter 12 Global Power Rental Market Segmentation and Outlook
- 12.1 Segmentation Summary and Market Shares, 2024
- 12.2 Largest and Fastest-Growing Segments
- 12.3 By End-Use - Market Size and Forecast, 2024-2032
- 12.3.1 Segment Definition and Scope
- 12.3.2 Historical Market Size
- 12.3.3 Revenue Forecast, 2024-2032
- 12.3.4 Volume Forecast, 2024-2032
- 12.3.5 Base-Year Market Share, 2024
- 12.3.6 Segment CAGR and Growth Drivers
- 12.3.7 Subsegment Market Size and Forecast
- 12.3.7.1 Construction
- 12.3.7.2 Mining
- 12.3.7.3 Manufacturing
- 12.3.7.4 Utility
- 12.3.7.5 Events
- 12.3.7.6 Oil and Gas
- 12.3.7.7 Others
- 12.3.8 Subsegment Pricing and Adoption Trends
- 12.3.9 Leading Suppliers and Competition
- 12.3.10 Regional Demand and Opportunities
- 12.4 By Equipment - Market Size and Forecast, 2024-2032
- 12.4.1 Segment Definition and Scope
- 12.4.2 Historical Market Size
- 12.4.3 Revenue Forecast, 2024-2032
- 12.4.4 Volume Forecast, 2024-2032
- 12.4.5 Base-Year Market Share, 2024
- 12.4.6 Segment CAGR and Growth Drivers
- 12.4.7 Subsegment Market Size and Forecast
- 12.4.7.1 Generators
- 12.4.7.2 Transformers
- 12.4.7.3 Load Banks
- 12.4.7.4 Others
- 12.4.8 Subsegment Pricing and Adoption Trends
- 12.4.9 Leading Suppliers and Competition
- 12.4.10 Regional Demand and Opportunities
- 12.5 By Fuel Type - Market Size and Forecast, 2024-2032
- 12.5.1 Segment Definition and Scope
- 12.5.2 Historical Market Size
- 12.5.3 Revenue Forecast, 2024-2032
- 12.5.4 Volume Forecast, 2024-2032
- 12.5.5 Base-Year Market Share, 2024
- 12.5.6 Segment CAGR and Growth Drivers
- 12.5.7 Subsegment Market Size and Forecast
- 12.5.7.1 Diesel
- 12.5.7.2 Natural Gas
- 12.5.7.3 Others
- 12.5.8 Subsegment Pricing and Adoption Trends
- 12.5.9 Leading Suppliers and Competition
- 12.5.10 Regional Demand and Opportunities
- 12.6 By Power Rating - Market Size and Forecast, 2024-2032
- 12.6.1 Segment Definition and Scope
- 12.6.2 Historical Market Size
- 12.6.3 Revenue Forecast, 2024-2032
- 12.6.4 Volume Forecast, 2024-2032
- 12.6.5 Base-Year Market Share, 2024
- 12.6.6 Segment CAGR and Growth Drivers
- 12.6.7 Subsegment Market Size and Forecast
- 12.6.7.1 Up to 50 kW
- 12.6.7.2 51–500 kW
- 12.6.7.3 501–2,500 kW
- 12.6.7.4 Above 2,500 kW
- 12.6.8 Subsegment Pricing and Adoption Trends
- 12.6.9 Leading Suppliers and Competition
- 12.6.10 Regional Demand and Opportunities
- 12.7 Segment Growth Comparison
- 12.8 Segment Attractiveness and Priority Matrix
Chapter 13 Global Power Rental End-Use and Application Market Outlook
- 13.1 End-Use Industry and Customer Demand Structure
- 13.2 Leading Applications and Customer Groups
- 13.3 End-Use Market Size, Share and Forecast
- 13.4 Major End-Use Industry Deep Dives
- 13.4.1 Customer Requirements and Use Cases
- 13.4.2 Demand and Replacement Cycles
- 13.4.3 Technical and Regulatory Considerations
- 13.4.4 Purchasing and Procurement Models
- 13.4.5 Leading Vendors and Distribution Channels
- 13.4.6 Forecast and Commercial Opportunities
- 13.5 Emerging Applications and Cross-Segment Demand
- 13.6 End-Use Industry Investment Priorities
Chapter 14 Global Power Rental Geographic Market Outlook, 2024-2032
- 14.1 Regional Market Size and Share, 2024
- 14.2 Regional Market Forecast, 2024-2032
- 14.3 Regional Pricing, Production and Demand Differences
- 14.4 North America
- 14.4.1 United States
- 14.4.2 Canada
- 14.4.3 Mexico
- 14.5 Europe
- 14.5.1 Germany
- 14.5.2 France
- 14.5.3 Italy
- 14.5.4 United Kingdom
- 14.5.5 Spain
- 14.5.6 Poland
- 14.5.7 Russia
- 14.5.8 Netherlands
- 14.5.9 Belgium
- 14.5.10 Sweden
- 14.5.11 Denmark
- 14.5.12 Norway
- 14.5.13 Rest of Europe
- 14.6 Asia Pacific
- 14.6.1 China
- 14.6.2 India
- 14.6.3 Japan
- 14.6.4 South Korea
- 14.6.5 Thailand
- 14.6.6 Indonesia
- 14.6.7 Vietnam
- 14.6.8 Malaysia
- 14.6.9 Australia
- 14.6.10 Rest of Asia Pacific
- 14.7 Latin America
- 14.7.1 Brazil
- 14.7.2 Argentina
- 14.7.3 Colombia
- 14.7.4 Chile
- 14.7.5 Rest of Latin America
- 14.8 Middle East
- 14.8.1 Saudi Arabia
- 14.8.2 United Arab Emirates
- 14.8.3 Turkey
- 14.8.4 Israel
- 14.8.5 Iran
- 14.8.6 Rest of the Middle East
- 14.9 Africa
- 14.9.1 South Africa
- 14.9.2 Egypt
- 14.9.3 Nigeria
- 14.9.4 Morocco
- 14.9.5 Rest of Africa
- 14.10 Regional Investment, Policy and Supply Chain Differences
- 14.11 Regional Competitive Landscape
- 14.12 Geographic Growth Hotspots
Chapter 15 Global Power Rental Technology, Innovation and Sustainability Outlook
- 15.1 Technology Landscape and Maturity
- 15.2 Product, Process and Service Innovation
- 15.3 AI, Automation and Digital Tools in the Industry
- 15.4 Technology Adoption and Performance Benchmarking
- 15.5 Innovation Pipeline and R&D Investment
- 15.6 Patent and Intellectual Property Trends
- 15.7 Energy Efficiency and Resource Management
- 15.8 Sustainability, Recycling and Circularity
- 15.9 Technology Roadmap, 2024-2032
- 15.10 Risks of Obsolescence and Technology Substitution
Chapter 16 Global Power Rental Market Key Strategic Imperatives
- 16.1 Growth and Market Entry Priorities
- 16.2 High-Return Products and Segments
- 16.3 Pricing, Profitability and Cost Optimization
- 16.4 Technology Investment and Product Differentiation
- 16.5 Supply Chain Localization and Resilience
- 16.6 Distribution and Customer Acquisition
- 16.7 Partnership, Acquisition and Capacity Strategy
- 16.8 Regional Expansion Priorities
- 16.9 Short-, Medium- and Long-Term Actions
Chapter 17 Competition Outlook
- 17.1 Industry Competition Characteristics
- 17.2 Market Structure and Concentration
- 17.3 Market Share and Competitive Positioning, 2024
- 17.4 Company-Wise Revenue and Product Benchmarking
- 17.5 Production and Service Capacity Benchmarking
- 17.6 Technology, Pricing and Differentiation
- 17.7 Regional Footprint and Distribution Strength
- 17.8 Mergers, Acquisitions and Strategic Alliances
- 17.9 New Entrants and Competitive Threats
- 17.10 Porter's Five Forces and Industry Attractiveness
- 17.11 Competitive Outlook, 2024-2032
Chapter 18 Company Profiles
- 18.1 Company Coverage and Selection Criteria
- 18.2 Aggreko
- 18.2.1 Business Description
- 18.2.2 Company Ownership and Geographic Presence
- 18.2.3 Product and Service Portfolio
- 18.2.4 Manufacturing and Operating Footprint
- 18.2.5 Production Capacity and Expansion Plans
- 18.2.6 Financial Performance and Investment
- 18.2.7 Market Share and Competitive Position
- 18.2.8 Technology and Innovation Capabilities
- 18.2.9 Strategic Alliances or Partnerships
- 18.2.10 Recent Developments
- 18.2.11 Growth Strategy and Outlook
- 18.3 Caterpillar Inc.
- 18.4 Cummins Inc.
- 18.5 United Rentals, Inc.
- 18.6 Kohler-SDMO
- 18.7 Atlas Copco
- 18.8 APR Energy
- 18.9 FG Wilson
- 18.10 Sunbelt Rentals
- 18.11 Generac Power Systems
- 18.12 Other Relevant Market Participants
Note: Every listed company is profiled on the structure shown under the first company. The company list is preliminary and may change based on research findings, market developments, data availability and client requirements.
Chapter 19 Disclaimer
- 19.1 Research and Forecast Disclaimer
- 19.2 Data Source and Estimation Limitations
Note: The depth of individual sections depends on data availability for this market. Volume, capacity, trade and other unit-based metrics are included where applicable.

