
Recycled PET (r-PET) Market Overview:
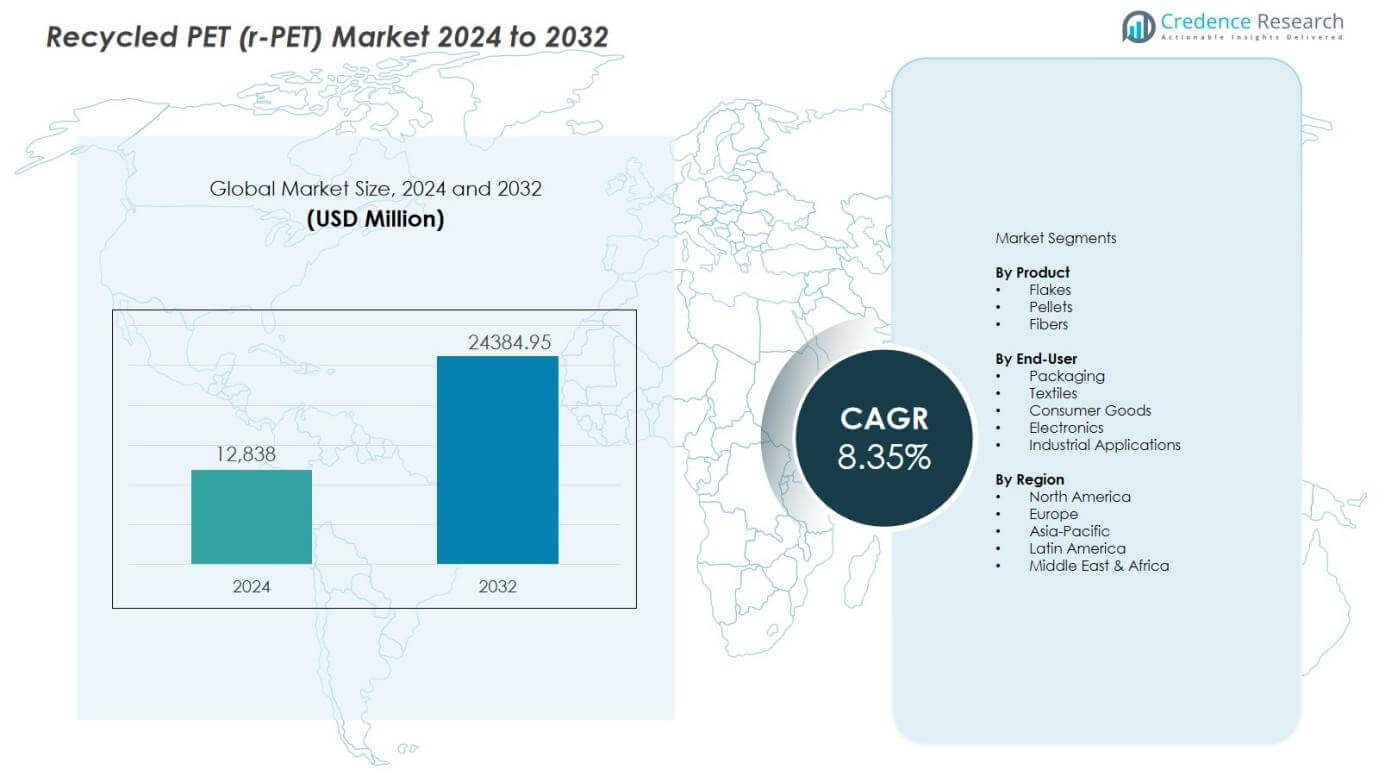
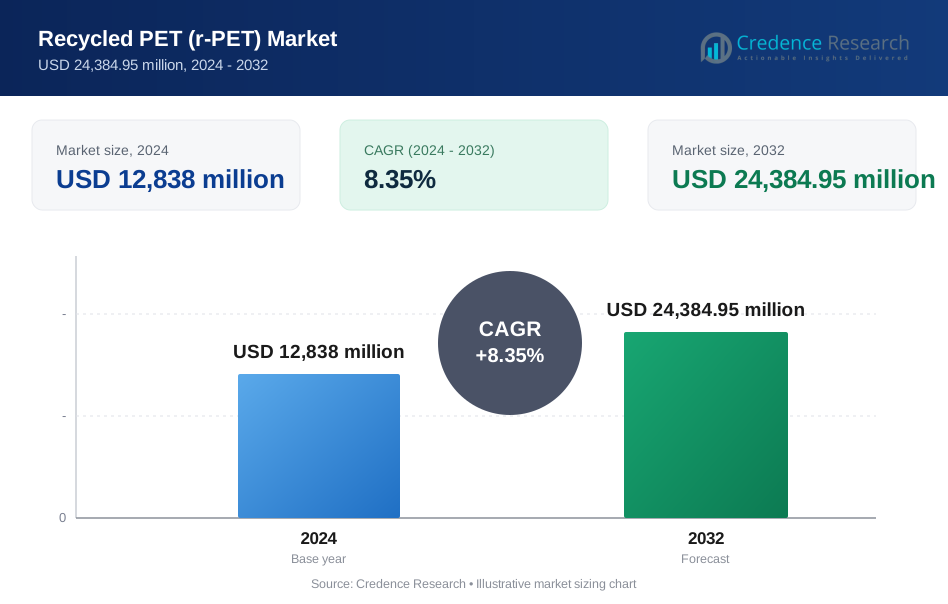
The Recycled PET (r-PET) Market size was valued at USD 12,838 million in 2024 and is anticipated to reach USD 24384.95 million by 2032, at a CAGR of 8.35 % during the forecast period.
| REPORT ATTRIBUTE | DETAILS |
|---|---|
| Historical Period | 2020-2024 |
| Base Year | 2025 |
| Forecast Period | 2026-2032 |
| Recycled PET (r-PET) Market Size 2024 | USD 12,838 million |
| Recycled PET (r-PET) Market, CAGR | 8.35% |
| Recycled PET (r-PET) Market Size 2032 | USD 24384.95 million |
Recycled PET (r-PET) Market Insights:
- Europe (38%), North America (27%), and Asia-Pacific (24%) represent the top three regional shares, supported by strong collection infrastructure in Europe, brand-led demand and capacity investments in North America, and large-scale packaging consumption in Asia-Pacific.
- Asia-Pacific, holding nearly 24% share, remains the fastest-growing region due to policy reforms, rising urban consumption, expanding recycling capacity in China and India, and increasing export demand for certified r-PET pellets.
- By product, flakes account for about 46% share due to flexibility and cost efficiency, while pellets contribute nearly 41%, supported by rising demand for food-grade and bottle-to-bottle applications.
- By end-user, packaging dominates with around 52% share, followed by textiles at approximately 31%, reflecting strong recycled-content mandates in packaging and sustained demand from apparel and fiber manufacturers.
Recycled PET (r-PET) Market Drivers:
Regulatory mandates and binding recycled-content requirements across packaging sectors
The Recycled PET (r-PET) Market benefits from firm regulatory mandates that set minimum recycled-content thresholds for beverage bottles and rigid packaging. Governments enforce extended producer responsibility frameworks that raise compliance costs for virgin plastics. It positions recycled polymers as a compliant and scalable alternative. Policy clarity improves long-term demand visibility and supports capital deployment across recycling value chains.
- For instance, Coca-Cola achieved 50% r-PET content in its European beverage bottles by 2025 under EU Packaging and Packaging Waste Regulation compliance, scaling production to 20 billion units annually.
Brand sustainability commitments and measurable carbon reduction targets
The Recycled PET (r-PET) Market gains momentum from brand owners that commit to science-based emissions targets and circular packaging roadmaps. Corporate procurement teams prioritize materials with verified life-cycle benefits. It delivers lower energy intensity and reduced greenhouse gas profiles compared with virgin PET. Public disclosure and investor scrutiny reinforce sustained offtake agreements.
- For Instance, The Coca-Cola Company achieved 28% recycled material content across its total global packaging portfolio, with its recycled PET (rPET) plastic specifically reaching 18% globally-though major bottling partners like Coca-Cola HBC reached 24% rPET in the same period.
Advances in recycling technologies and food-grade quality assurance
The Recycled PET (r-PET) Market advances through technology upgrades that raise yield, purity, and consistency. Mechanical upgrades enhance sorting accuracy, while chemical pathways address color and contaminant limits. It expands eligibility for direct food-contact applications under strict safety standards. Reliable quality supports broader use across bottles, trays, and fibers.
Consumer preference shifts toward circular and traceable packaging choices
The Recycled PET (r-PET) Market draws demand from consumers who favor circular products with transparent sourcing claims. Retailers respond by standardizing recycled content across private labels. It strengthens shelf differentiation without sacrificing performance. Price parity improves adoption as collection systems mature and supply scales.
Recycled PET (r-PET) Market Trends:
Rapid scale-up of food-grade r-PET capacity and closed-loop bottle initiatives
The Recycled PET (r-PET) Market shows a clear trend toward rapid expansion of food-grade capacity aligned with closed-loop bottle programs. Brand owners secure long-term supply through offtake contracts that support new plants and upgrades. It reflects tighter collaboration across collectors, recyclers, and converters to stabilize quality and volumes. Deposit return schemes improve feedstock purity and recovery rates. Advanced decontamination protocols enable consistent compliance with food-contact standards. Producers favor standardized flakes and pellets to simplify qualification across filling lines. Premium pricing narrows as yields rise and logistics optimize.
- For instance, ALPLA expanded its PET Recycling Team plant in Radomsko, Poland, by adding a third extrusion line. This increased annual food-grade r-PET pellet production from 30,000 tonnes to 54,000 tonnes.
Shift toward chemical recycling integration and traceability-led procurement
The Recycled PET (r-PET) Market trends toward integration of chemical recycling alongside mechanical routes to address color, multilayer, and contaminated streams. Operators deploy depolymerization to deliver near-virgin quality outputs. It broadens application scope across clear bottles, specialty films, and high-clarity trays. Digital traceability gains traction through batch-level certification and chain-of-custody systems. Procurement teams adopt verified content claims to meet audit and disclosure needs. Investments target regional hubs to reduce transport intensity. Partnerships with waste managers secure diversified feedstock access.
- For instance, Carbios employs enzymatic depolymerization, breaking down PET in 10 hours to produce monomers for new bottles with 97% purity levels.
Recycled PET (r-PET) Market Challenges Analysis:
Feedstock availability constraints and quality variability across collection systems
The Recycled PET (r-PET) Market faces persistent constraints tied to uneven bottle collection rates and fragmented sorting infrastructure. Regional differences in deposit schemes create volatility in bale supply. It experiences quality swings due to contamination, color mix, and label residues. Competition with textile and strapping uses tightens access to clear PET. Seasonal consumption patterns add volume risk for recyclers. Price sensitivity rises when virgin PET weakens. Contract structures struggle to balance risk across the chain.
Cost pressures, certification hurdles, and scalability limits for advanced processes
The Recycled PET (r-PET) Market encounters cost pressure from energy, logistics, and compliance requirements. Food-contact certification demands rigorous testing and documentation. It extends timelines and raises working capital needs. Chemical routes face high capex and uncertain economics at scale. Market acceptance depends on consistent claims verification. Financing remains selective amid margin volatility.
Recycled PET (r-PET) Market Opportunities:
Expansion of closed-loop packaging systems and premium brand partnerships
The Recycled PET (r-PET) Market presents strong opportunity through expansion of closed-loop packaging systems led by global beverage and FMCG brands. Long-term offtake contracts support capacity buildout and price stability. It enables recyclers to invest in high-purity sorting and pelletizing assets. Brand partnerships accelerate adoption across bottles, trays, and thermoforms. Standardized specifications reduce qualification cycles. Retail mandates amplify demand for certified recycled content. Margin uplift follows from assured volumes and quality premiums.
Growth in advanced recycling, traceability platforms, and regional capacity hubs
The Recycled PET (r-PET) Market offers opportunity via advanced recycling that converts complex streams into food-grade outputs. It widens feedstock access beyond clear bottles. Digital traceability platforms strengthen audit readiness and content verification. Regional hubs cut transport costs and emissions. Policy incentives improve project bankability. Emerging markets unlock scale through infrastructure upgrades.
Recycled PET (r-PET) Market Segmentation Analysis:
By Product
The Recycled PET (r-PET) Market shows clear differentiation by product across flakes, pellets, and fibers. Flakes dominate feedstock trade due to flexibility across converters and lower processing steps. It suits bottle-to-bottle and sheet extrusion when purity meets specifications. Pellets gain share in food-contact and high-clarity applications because they offer consistent IV, color control, and process stability. Fibers serve textiles and nonwovens, where tolerance for color variation remains higher. Product choice reflects end-use compliance needs, cost targets, and line compatibility.
- For instance, Far Eastern New Century (FENC) processes r-PET flakes into feedstock with viscosity tolerance of ±0.02 dl/g for premium applications.
By End-User
The Recycled PET (r-PET) Market demand concentrates among packaging, textiles, consumer goods, and industrial users. Beverage and food packaging leads due to recycled-content mandates and brand commitments, with strong pull for food-grade pellets. It relies on assured supply and certification to protect brand risk. Textiles follow, driven by apparel sustainability claims and large volume absorption. Consumer goods and electronics use r-PET for housings and components where performance parity matters. Industrial straps and sheets provide steady offtake tied to logistics and construction cycles.
- For Instance, Coca-Cola had distributed over 35 billion of its first-generation PlantBottle™ packages-containing up to 30% plant-based material-across nearly 40 countries.
Segmentations:
By Product
- Flakes
- Pellets
- Fibers
By End-User
- Packaging
- Textiles
- Consumer Goods
- Electronics
- Industrial Applications
By Region
- North America
- U.S.
- Canada
- Mexico
- Europe
- Germany
- France
- U.K.
- Italy
- Spain
- Rest of Europe
- Asia Pacific
- China
- Japan
- India
- South Korea
- South-east Asia
- Rest of Asia Pacific
- Latin America
- Brazil
- Argentina
- Rest of Latin America
- Middle East & Africa
- GCC Countries
- South Africa
- Rest of the Middle East and Africa
Regional Analysis:
Europe anchored by binding recycled-content targets and mature collection systems
The Recycled PET (r-PET) Market in Europe leads due to binding recycled-content targets across beverage packaging. High deposit-return coverage supports strong bottle recovery and feedstock purity. It benefits from harmonized standards that speed food-contact approvals. Brand owners lock supply through long-term offtake contracts. Capacity upgrades focus on high-clarity pellets for bottle-to-bottle use. Price premiums persist where compliance risk remains high. Policy certainty sustains capital flow across the region.
North America driven by brand pledges and rapid capacity expansion
The Recycled PET (r-PET) Market in North America advances on the back of brand pledges and private-label mandates. Collection rates improve through state programs and retailer partnerships. It relies on investments in sorting automation and decontamination to lift yields. Chemical routes attract interest for hard-to-recycle streams. Logistics optimization supports regional hubs near demand centers. Contract pricing adapts to virgin PET cycles. Certification rigor shapes procurement decisions.
Asia-Pacific momentum from scale, policy reform, and infrastructure buildout
The Recycled PET (r-PET) Market in Asia-Pacific records the fastest growth with rising packaging demand. Policy reform strengthens collection and compliance across major economies. It gains scale through new plants near urban consumption centers. Export markets favor certified pellets with traceability. Cost discipline remains critical amid price-sensitive buyers. Latin America and the Middle East & Africa show early momentum through pilot programs. Public–private models support infrastructure growth.
Key Player Analysis:
- Placon
- Clear Path Recycling LLC
- Verdeco Recycling, Inc.
- Indorama Ventures Public Ltd.
- Zhejiang Anshun Pettechs Fibre Co., Ltd.
- PolyQuest
- Evergreen Plastics, Inc.
- Phoenix Technologies
- Libolon
- Biffa
Competitive Analysis:
The Recycled PET (r-PET) Market features a competitive landscape shaped by integrated recyclers, packaging converters, and chemical technology providers. Large players leverage scale, collection partnerships, and food-grade certifications to secure long-term offtake contracts with global brands. It rewards operators that deliver consistent quality, traceability, and reliable volumes across cycles. Mid-sized specialists compete through regional proximity, flexible specifications, and rapid qualification with local converters. Technology leadership differentiates firms that deploy advanced sorting, decontamination, and depolymerization to unlock higher-value streams. Vertical integration across collection, processing, and pelletizing strengthens margins and supply security. Contract structures balance price exposure against virgin PET volatility. Capital access favors projects with policy support and brand-backed demand. Competitive pressure intensifies on cost control, energy efficiency, and compliance rigor, while partnerships and joint ventures accelerate capacity expansion and market reach.
Recent Developments:
- In March 2025, Placon launched the new Dip Cup Container Line, a sustainable thermoformed food packaging innovation using rPET materials.
- In June 2025, Alpek Polyester announced the closure of Clear Path Recycling's Fayetteville, NC facility, with operations ceasing by July 31, 2025.
Report Coverage:
The research report offers an in-depth analysis based on Product, End-User and Region. It details leading Market players, providing an overview of their business, product offerings, investments, revenue streams, and key applications. Additionally, the report includes insights into the competitive environment, SWOT analysis, current Market trends, as well as the primary drivers and constraints. Furthermore, it discusses various factors that have driven Market expansion in recent years. The report also explores Market dynamics, regulatory scenarios, and technological advancements that are shaping the industry. It assesses the impact of external factors and global economic changes on Market growth. Lastly, it provides strategic recommendations for new entrants and established companies to navigate the complexities of the Market.
Future Outlook:
- The Recycled PET (r-PET) Market will advance through wider adoption of mandatory recycled-content policies across packaging value chains, strengthening long-term demand certainty and procurement discipline.
- Producers will prioritize food-grade capacity expansion supported by long-term offtake agreements with beverage, food, and personal care brands.
- Technology upgrades will improve yield, color control, and contaminant removal, raising confidence in bottle-to-bottle and tray-to-tray applications.
- Chemical recycling will complement mechanical routes by unlocking complex and colored feedstocks that remain underutilized today.
- Digital traceability and certification systems will become standard requirements for audits, disclosures, and brand claims verification.
- Regional recycling hubs will gain prominence to lower transport intensity, stabilize supply, and align capacity with consumption centers.
- Feedstock competition will persist, encouraging tighter integration across collection, sorting, and conversion stages.
- Cost discipline and energy efficiency will shape investment decisions, particularly in price-sensitive regions.
- Retailer private labels will accelerate standardized recycled content across portfolios, lifting baseline demand.
- Public–private partnerships will expand infrastructure in emerging economies, improving recovery rates and quality consistency.
Request a Free Sample
Fill in your details and we'll send you a free sample report.
- Sample data tables & charts
- Research methodology
Need a Custom Version of This Report?
Tailor the scope, geography, or segments to your exact requirements.
- Custom geography or segment scope
- Direct access to our analyst team
Frequently Asked Questions
What is the current market size of the Recycled PET (r-PET) Market, and what is its projected value by 2032?
What growth rate is expected for the Recycled PET (r-PET) Market during the forecast period?
Which product segment holds the largest share in the Recycled PET (r-PET) Market?
What are the key factors driving growth in the Recycled PET (r-PET) Market?
Who are the leading players operating in the Recycled PET (r-PET) Market?
Which region dominated the Recycled PET (r-PET) Market in 2024?
Table of Content
Chapter 1 Market Segmentation
- 1.1 Segmentation Framework
- 1.1.1 Product and Service Classification
- 1.1.2 Application and End-Use Classification
- 1.1.3 Technology and Solution Classification
- 1.1.4 Customer and Distribution Channel Classification
- 1.1.5 Geographic Segmentation
- 1.1.6 Market Segment Definitions and Boundaries
Chapter 2 Introduction
- 2.1 Report Objectives and Scope
- 2.2 Product Definition and Industry Terminology
- 2.3 Market Inclusions and Exclusions
- 2.4 Research Process
- 2.4.1 Primary Research and Expert Interviews
- 2.4.2 Secondary Research and Source Review
- 2.4.3 Top-Down and Bottom-Up Estimation
- 2.4.4 Data Triangulation and Verification
- 2.5 Market Size Measurement Basis
- 2.5.1 2024: USD 12,838 million → 2032: USD 24,384.95 million
- 2.6 Historical and Forecast Reference Periods
- 2.6.1 Base Year: 2024
- 2.6.2 Forecast Period: 2024-2032
- 2.7 Research Assumptions and Limitations
Chapter 3 Executive Summary
- 3.1 Market Snapshot and Key Findings
- 3.2 Base-Year Market Size, 2024
- 3.3 Forecast Market Size, 2032
- 3.4 Revenue and Volume Growth Outlook
- 3.5 Key Demand and Supply Indicators
- 3.6 Leading Market Segments
- 3.7 Fastest-Growing Market Opportunities
- 3.8 Regional Performance Highlights
- 3.9 Technology and Industry Transformation
- 3.10 Competitive Landscape Summary
- 3.11 Analyst View and Strategic Implications
Chapter 4 Global Recycled PET (r-PET) Market Trends and Developments
- 4.1 Historical Industry Development
- 4.2 Recent Market Trends and Developments
- 4.3 Demand and Customer Behavior Trends
- 4.4 Technology and Product Innovation
- 4.5 Artificial Intelligence, Automation and Digitalization
- 4.6 Local Manufacturing and Supply Chain Realignment
- 4.7 Industry Partnerships, Mergers and Acquisitions
- 4.8 Sustainability and Circular Economy Developments
- 4.9 Government and Private Sector Investment Trends
- 4.10 Emerging Business Models and Commercialization
- 4.11 Industry Developments and Announcements
Chapter 5 Global Recycled PET (r-PET) Market Production, Supply and Demand Analysis
- 5.1 Demand Trend and Consumption Analysis
- 5.2 Demand Forecast, 2024-2032
- 5.3 Production and Output Trend
- 5.4 Production and Output Forecast, 2024-2032
- 5.5 Installed Capacity and Capacity Utilization
- 5.6 Company-Wise Production Plants and Statistics
- 5.6.1 Installed Production Capacity
- 5.6.2 Actual Production
- 5.6.3 Planned Capacity and Expansion Targets
- 5.7 Supply Chain Structure and Procurement Trends
- 5.8 Supply-Demand Gap and Bottlenecks
- 5.9 Import Dependence and Sourcing Structure
- 5.10 Contract Manufacturing and Outsourcing
- 5.11 Regional Supply and Demand Concentration
Chapter 6 Global Recycled PET (r-PET) Market Pricing Analysis
- 6.1 Pricing Structure and Measurement
- 6.2 Historical Pricing Trends
- 6.3 Pricing Outlook, 2024-2032
- 6.4 Average Selling Price and Unit Economics
- 6.5 Pricing by Product and Market Segment
- 6.6 Geographic Pricing Differences
- 6.7 Key Input, Energy, Labor and Logistics Costs
- 6.8 Contract Pricing and Purchasing Models
- 6.9 Pricing Sensitivity and Competitive Positioning
- 6.10 Price, Margin and Profitability Implications
Chapter 7 Global Recycled PET (r-PET) Market Dynamics
- 7.1 Market Growth Drivers
- 7.1.1 Demand-Side Drivers
- 7.1.2 Technology and Innovation Drivers
- 7.1.3 Infrastructure and Investment Drivers
- 7.1.4 Regulatory and Policy Drivers
- 7.2 Market Restraints
- 7.2.1 Cost and Affordability Constraints
- 7.2.2 Technology and Adoption Barriers
- 7.2.3 Supply Chain and Operational Constraints
- 7.3 Market Challenges
- 7.3.1 Competitive Pressure and Margin Erosion
- 7.3.2 Skills, Infrastructure and Implementation Gaps
- 7.4 Emerging Market Opportunities
- 7.5 Market Dynamics Impact and Time-Horizon Assessment
Chapter 8 Global Recycled PET (r-PET) Value Chain Analysis
- 8.1 Industry Value Chain Overview
- 8.2 Upstream Suppliers and Critical Inputs
- 8.3 Technology and Component Providers
- 8.4 Manufacturing or Service Delivery
- 8.5 Distribution, Channel Partners and Integrators
- 8.6 Downstream Applications and End Users
- 8.7 Value Addition and Profit Pools
- 8.8 Vertical Integration and Outsourcing
- 8.9 Supplier Concentration and Risk
- 8.10 Supply Chain Localization and Resilience
Chapter 9 Global Recycled PET (r-PET) Market Regulations and Policies
- 9.1 Relevant Laws, Standards and Compliance Frameworks
- 9.2 Product, Service, Safety and Quality Requirements
- 9.3 Government Policies, Incentives and Subsidies
- 9.4 Imports, Exports and Trade Barriers
- 9.5 Public Procurement and Local Content Requirements
- 9.6 Environmental and Sustainability Compliance
- 9.7 Upcoming Policy Changes and Market Implications
Chapter 10 Global Recycled PET (r-PET) Market Hotspots and Opportunities
- 10.1 Market Opportunity Mapping and Growth Hotspots
- 10.2 High-Growth Applications and Customer Groups
- 10.3 Underserved Markets and White-Space Opportunities
- 10.4 Emerging Technology and Product Opportunities
- 10.5 New Capacity and Investment Hotspots
- 10.6 Market Entry and Expansion Opportunities
- 10.7 Distribution and Partnership Opportunities
- 10.8 Near-Term and Long-Term Commercial Potential
- 10.9 Opportunity Attractiveness and Execution Risks
Chapter 11 Global Recycled PET (r-PET) Market Outlook, 2024-2032
- 11.1 Market Size and Analysis
- 11.1.1 Revenue (Market Measurement: 2024: USD 12,838 million → 2032: USD 24,384.95 million)
- 11.1.2 Market Volume and Quantity Sold
- 11.1.3 Historical Market Size
- 11.1.4 Base-Year Market Size, 2024
- 11.2 Market Forecast, 2024-2032
- 11.2.1 Revenue Forecast to 2032
- 11.2.2 Volume Forecast to 2032
- 11.2.3 CAGR and Year-on-Year Growth
- 11.2.4 Incremental Revenue Opportunity
- 11.3 Forecast Assumptions and Scenario Analysis
- 11.3.1 Base-Case Forecast
- 11.3.2 Optimistic and Conservative Scenarios
- 11.3.3 Technology, Pricing and Policy Sensitivities
- 11.4 Market Attractiveness and Growth Outlook
Chapter 12 Global Recycled PET (r-PET) Market Segmentation and Outlook
- 12.1 Segmentation Summary and Market Shares, 2024
- 12.2 Largest and Fastest-Growing Segments
- 12.3 Segment Growth Comparison
- 12.4 Segment Attractiveness and Priority Matrix
Chapter 13 Global Recycled PET (r-PET) Geographic Market Outlook, 2024-2032
- 13.1 Regional Market Size and Share, 2024
- 13.2 Regional Market Forecast, 2024-2032
- 13.3 Regional Pricing, Production and Demand Differences
- 13.4 North America
- 13.4.1 United States
- 13.4.2 Canada
- 13.4.3 Mexico
- 13.5 Europe
- 13.5.1 Germany
- 13.5.2 France
- 13.5.3 Italy
- 13.5.4 United Kingdom
- 13.5.5 Spain
- 13.5.6 Poland
- 13.5.7 Russia
- 13.5.8 Netherlands
- 13.5.9 Belgium
- 13.5.10 Sweden
- 13.5.11 Denmark
- 13.5.12 Norway
- 13.5.13 Rest of Europe
- 13.6 Asia Pacific
- 13.6.1 China
- 13.6.2 India
- 13.6.3 Japan
- 13.6.4 South Korea
- 13.6.5 Thailand
- 13.6.6 Indonesia
- 13.6.7 Vietnam
- 13.6.8 Malaysia
- 13.6.9 Australia
- 13.6.10 Rest of Asia Pacific
- 13.7 Latin America
- 13.7.1 Brazil
- 13.7.2 Argentina
- 13.7.3 Colombia
- 13.7.4 Chile
- 13.7.5 Rest of Latin America
- 13.8 Middle East
- 13.8.1 Saudi Arabia
- 13.8.2 United Arab Emirates
- 13.8.3 Turkey
- 13.8.4 Israel
- 13.8.5 Iran
- 13.8.6 Rest of the Middle East
- 13.9 Africa
- 13.9.1 South Africa
- 13.9.2 Egypt
- 13.9.3 Nigeria
- 13.9.4 Morocco
- 13.9.5 Rest of Africa
- 13.10 Regional Investment, Policy and Supply Chain Differences
- 13.11 Regional Competitive Landscape
- 13.12 Geographic Growth Hotspots
Chapter 14 Global Recycled PET (r-PET) Technology, Innovation and Sustainability Outlook
- 14.1 Technology Landscape and Maturity
- 14.2 Product, Process and Service Innovation
- 14.3 AI, Automation and Digital Tools in the Industry
- 14.4 Technology Adoption and Performance Benchmarking
- 14.5 Innovation Pipeline and R&D Investment
- 14.6 Patent and Intellectual Property Trends
- 14.7 Energy Efficiency and Resource Management
- 14.8 Sustainability, Recycling and Circularity
- 14.9 Technology Roadmap, 2024-2032
- 14.10 Risks of Obsolescence and Technology Substitution
Chapter 15 Global Recycled PET (r-PET) Market Key Strategic Imperatives
- 15.1 Growth and Market Entry Priorities
- 15.2 High-Return Products and Segments
- 15.3 Pricing, Profitability and Cost Optimization
- 15.4 Technology Investment and Product Differentiation
- 15.5 Supply Chain Localization and Resilience
- 15.6 Distribution and Customer Acquisition
- 15.7 Partnership, Acquisition and Capacity Strategy
- 15.8 Regional Expansion Priorities
- 15.9 Short-, Medium- and Long-Term Actions
Chapter 16 Competition Outlook
- 16.1 Industry Competition Characteristics
- 16.2 Market Structure and Concentration
- 16.3 Market Share and Competitive Positioning, 2024
- 16.4 Company-Wise Revenue and Product Benchmarking
- 16.5 Production and Service Capacity Benchmarking
- 16.6 Technology, Pricing and Differentiation
- 16.7 Regional Footprint and Distribution Strength
- 16.8 Mergers, Acquisitions and Strategic Alliances
- 16.9 New Entrants and Competitive Threats
- 16.10 Porter's Five Forces and Industry Attractiveness
- 16.11 Competitive Outlook, 2024-2032
Chapter 17 Company Profiles
- 17.1 Company Coverage and Selection Criteria
- 17.2 Leading Market Participants – Standard Profile Structure
- 17.2.1 Business Description
- 17.2.2 Company Ownership and Geographic Presence
- 17.2.3 Product and Service Portfolio
- 17.2.4 Manufacturing and Operating Footprint
- 17.2.5 Production Capacity and Expansion Plans
- 17.2.6 Financial Performance and Investment
- 17.2.7 Market Share and Competitive Position
- 17.2.8 Technology and Innovation Capabilities
- 17.2.9 Strategic Alliances or Partnerships
- 17.2.10 Recent Developments
- 17.2.11 Growth Strategy and Outlook
- 17.3 Other Relevant Market Participants
Note: Every listed company is profiled on the structure shown under the first company. The company list is preliminary and may change based on research findings, market developments, data availability and client requirements.
Chapter 18 Disclaimer
- 18.1 Research and Forecast Disclaimer
- 18.2 Data Source and Estimation Limitations
Note: The depth of individual sections depends on data availability for this market. Volume, capacity, trade and other unit-based metrics are included where applicable.
