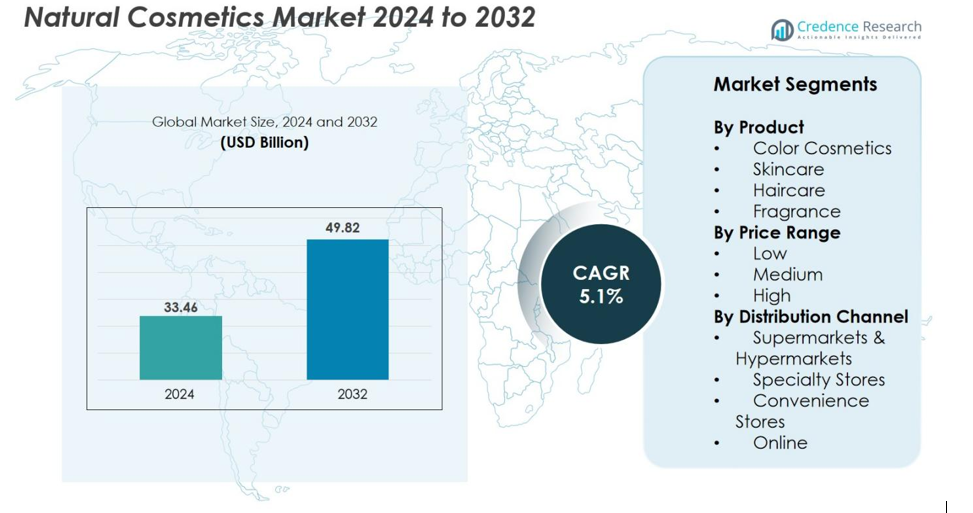
Home » Consumer Goods » Natural Cosmetics Market

Natural Cosmetics Market By Product (Skin Care, Hair Care, Fragrance, Color Cosmetic) By Distribution Channel (Supermarkets/Hypermarkets, Specialty Stores, Convenience Stores, Online)-Growth, Future Prospects & Competitive Analysis, 2016 – 2030

Price: $4999

Published: | Report ID: 18185 | Report Format : PDF

Key Highlights of the Report

The global natural cosmetics market is segmented by product, distribution channel, and region. Skincare products dominate the global market, accounting for the largest share in terms of value, followed by hair care, color cosmetics, and other product categories. Online distribution channels are gaining traction, with e-commerce platforms witnessing substantial growth, with North America as the dominating region.

The global natural cosmetics market is expanding rapidly, owing to factors such as rising consumer awareness and demand for clean and sustainable beauty products, a growing preference for organic and natural ingredients, a growing focus on wellness and health, and the influence of social media and digital platforms in promoting natural beauty trends. However, the market has several constraints that may limit its expansion, including regulatory issues connected to ingredient sourcing and labeling, strong competition from synthetic cosmetics, limited availability of raw materials, and the requirement for stringent quality control procedures.

On the other hand, there are opportunities for growth in the global natural cosmetics market, such as expanding distribution channels and online sales, increasing consumer awareness of the benefits of natural cosmetics, and the potential for product innovation and development of new formulations to meet diverse consumer needs.

Market Overview

The global natural cosmetics market has witnessed rapid growth in recent years and is estimated to grow at a CAGR of 5.5% between 2023 and 2030. The market was valued at USD 37.2 billion in 2022 and is expected to reach USD 54.11 billion in 2030.

Design Element 2

Access crucial information at unmatched prices!

Request your free sample report today & start making informed decisions powered by Credence Research!

Download Free Sample
CTA Design Element 3

What Are The Main Drivers Of The Global Natural Cosmetics Market?

The main drivers of the global natural cosmetics market are the increasing consumer demand for natural and organic products, driven by a growing awareness of the potential environmental and health risks associated with synthetic ingredients. Consumers seek safer, more sustainable alternatives for their beauty and personal care products. Besides, the rising focus on health and wellness and the shifting consumer preferences towards cleaner and greener lifestyles drive the demand for natural cosmetics.

What Are The Major Challenges Faced By The Global Natural Cosmetics Market?

The major challenge the global natural cosmetics market faces are the need for standardized regulations and definitions, which can lead to consumer confusion. In addition, sourcing natural ingredients at higher costs poses a challenge for manufacturers. Moreover, competition from conventional cosmetics and supply chain complexities add to the challenges faced by the industry.

What Are The Growth Opportunities In The Global Natural Cosmetics Market?

The increasing consumer demand for clean, organic, and sustainable beauty products is a significant opportunity for companies operating in the natural cosmetics sector. The growing awareness about the potential health risks associated with synthetic ingredients has led to a shift towards natural alternatives. Additionally, the expanding e-commerce industry and the rise of digital marketing platforms allow companies to reach a wider consumer base and promote their natural cosmetic products.

Executive Summary

Overview of the Global Natural Cosmetics Market

The global natural cosmetics market rapidly expands as people seek natural, organic, sustainable beauty and personal care products. Growing consumer awareness of the possible health and environmental concerns connected with synthetic substances, rising demand for clean and green beauty products, and a shift towards natural and holistic lifestyles are driving the market growth. Natural cosmetics offer a wide range of products, including skincare, haircare, makeup, and fragrances, formulated with plant-based ingredients and free from harmful chemicals. The global market is characterized by the presence of established multinational companies, as well as emerging indie brands that cater to niche consumer preferences.

Market Definition

The natural cosmetics market is the industry that produces and sells beauty and personal care products produced from natural and organic materials. These goods are free of synthetic chemicals, artificial perfumes, and other potentially dangerous ingredients. Natural cosmetics are becoming increasingly popular among people looking for safer, more ecologically friendly alternatives to traditional beauty products. These items frequently emphasize environmental responsibility, ethical sourcing, and cruelty-free practices. The natural cosmetics industry includes various product categories, including skincare, haircare, makeup, and personal hygiene items.

Market Insights

  • The global demand for natural cosmetics was valued at USD 37.2 Billion in 2022 and is expected to reach USD 54.11 Billion in 2030, growing at a CAGR of 5.5% between 2023 and 2030.
  • Skin care is the dominant segment by product and holds over 41% share in value in 2022, while the hair care segment is likely to exhibit the fastest CAGR during the forecast period.
  • The supermarkets/hypermarkets segment holds a significant market share of over 38.5% in 2022, indicating its dominance in the distribution of natural cosmetics.
  • E-commerce and online retail platforms have emerged as effective distribution channels for natural cosmetics, providing consumers convenient access to a wide range of products and enabling brands to reach a global customer base.
  • North America dominated the global natural cosmetics market in 2022, followed by Europe. The Asia Pacific region presents a lucrative growth opportunity and is expected to contribute to the market expansion.
  • The growing consumer preference for organic and ecological products, rising awareness about the detrimental effects of synthetic substances, and the emerging trend of clean beauty drive demand for natural cosmetics.

Segmentation by Product

  • Skin care is the leading segment in terms of product, holding over 41% share in value in 2022. This includes a wide range of natural skincare products such as face creams, moisturizers, cleansers, toners, serums, masks, and sunscreens.
  • The hair care segment is expected to exhibit the fastest CAGR during the forecast period.

Segmentation by Distribution Channel

  • The online segment will exhibit the highest CAGR in the forecast period.
  • The supermarkets/hypermarkets segment holds a leading global market revenue share, accounting for over 38.5% in 2022.
  • Other distribution channels, such as specialty and convenience stores, also contribute to the demand for natural cosmetics.

Segmentation by Region

  • North America holds a substantial market share, accounting for over one-third of the global market in 2022.
  • Europe is another prominent global natural cosmetics market region, contributing to the overall market share.
  • Asia Pacific is witnessing rapid growth and is a key region driving the expansion of the natural cosmetics market.
  • The rest of the World, including regions such as Latin America, the Middle East, and Africa, also contributes to the demand for natural cosmetics.

The global natural cosmetics market is driven by increasing consumer demand for clean and sustainable beauty products, growing preference for organic and natural ingredients, and the influence of social media and digital platforms. However, the market faces challenges such as regulatory hurdles, competition from synthetic cosmetics, limited raw material availability, and the need for stringent quality control.

The United States holds a significant share of the global natural cosmetics market due to its large consumer base and growing demand for clean and organic beauty products. Consumers in the country are increasingly becoming aware of the harmful effects of synthetic ingredients commonly found in cosmetics and are seeking safer and more sustainable alternatives. The United States is also home to several established natural cosmetics brands and has a well-developed retail infrastructure, making it conducive for market growth. Besides, regulatory bodies such as the US FDA ensure product safety and compliance, further enhancing consumer trust in natural cosmetics.

Germany is a global leader in natural cosmetics, notably in Europe. The country is well-known for its outstanding product quality and environmental sustainability. Natural and organic beauty products are becoming increasingly popular among German consumers, driven by health consciousness, environmental awareness, and a desire for products that correspond with their ethical values. The German market also has a well-developed distribution network, which includes specialized natural cosmetics outlets and online platforms, making it easier for customers to obtain.Natural Cosmetics Market

Increasing Consumer Demand for Clean and Safe Beauty Products

Consumers are becoming more conscious of the potential health risks of synthetic chemicals in conventional cosmetics. They seek safer alternatives free from harmful ingredients like parabens, sulfates, and phthalates. This growing awareness has led to a significant shift in consumer preferences toward natural cosmetics formulated with organic and plant-based ingredients. The demand for clean and green beauty products is on the rise, fueled by the perception that natural cosmetics are gentler on the skin, environmentally friendly, and promote overall well-being.

Emerging Influence of Social Media and Digital Platforms

Platforms like Instagram, YouTube, and beauty blogs have played a crucial role in developing awareness and driving the popularity of natural cosmetics. Influencers and beauty enthusiasts utilize these platforms to showcase their natural beauty routines, promote natural cosmetics brands, and share their positive experiences. This digital exposure has effectively reached a wide audience, particularly millennials and Gen Z consumers who are highly active on social media. These younger consumer segments strongly prefer natural and organic products and often make purchasing decisions based on social media recommendations and reviews. Thus, natural cosmetics brands leverage social media platforms and digital marketing strategies to engage with their target audience, build brand awareness, and drive global sales.

Limited Availability of Raw Materials and Supply Chain Challenges

Ingredients like organic plant extracts, rare botanicals, and sustainable packaging materials can be scarce or have seasonal availability, leading to supply chain challenges. Sourcing high-quality natural ingredients in sufficient quantities can be complex and costly for manufacturers. In addition, maintaining consistency in the quality and availability of raw materials becomes challenging when demand for natural cosmetics increases. These supply chain constraints can result in higher production costs, limited product offerings, and potential price fluctuations, restraining the market’s growth.

Expanding Distribution Channels and Online Sales

The upsurge of e-commerce and the growing popularity of online shopping presents a significant opportunity for the natural cosmetics market. Online platforms provide a convenient and accessible avenue for consumers to explore and purchase natural cosmetics from anywhere in the world. Natural cosmetics companies can leverage digital marketing strategies, social media presence, and online collaborations to reach a broader audience and increase brand visibility. Moreover, expanding distribution channels to include online retailers and partnering with e-commerce platforms can help companies tap into new markets and increase sales. The online channel offers flexibility, convenience, and a personalized shopping experience, making it an attractive opportunity for natural cosmetics companies to expand their customer reach and drive growth.

Competitive Landscape

Key Players

The global natural cosmetics market is characterized by intense competition among players striving to gain a significant market share. Some of the key players in the global market and their market share are as follows:

  • Burt’s Bees
  • 100% Pure
  • Korres S.A.
  • Bare Escentuals Beauty Inc
  • L’Oréal SA
  • Aveeno
  • Weleda AG
  • Arbonne International LLC
  • Avon Product Inc
  • Coty Inc
  • Tata Harper

These companies employ diverse strategies to maintain competitiveness and capitalize on the growing demand for natural cosmetics. Major companies in the natural cosmetics industry invest in R&D operations to develop new formulations, ingredients, and packaging solutions that align with natural and clean beauty principles. In addition, companies focus on expanding their distribution networks to enhance their market reach. This includes partnerships with retailers, e-commerce platforms, and other distribution channels to ensure their products are readily available to consumers.

For example, L’OCCITANE Group purchased Grown Alchemist, an Australian cosmeceutical, clean skincare company, in March 2022. The company has expanded globally, focusing on anti-aging technologies and unique botanical skincare formulae for optimal skin health.

Global Bioenergies confirmed the release of a new cosmetic ingredient, organically derived isododecane, in 2021, which may now be utilized in numerous skincare and haircare products.

Shape Your Report to Specific Countries or Regions & Enjoy 30% Off!

Summary of Key Findings

  • Consumer awareness and preference for natural and organic products, growing concerns about the use of chemicals in cosmetics, and increased demand for sustainable and eco-friendly beauty products are driving market expansion.
  • Market segmented by product, distribution channel, and region.
  • Skincare products lead the global market, accounting for the highest revenue share in value, followed by hair care, color cosmetics, and other product categories. Online distribution channels are gaining traction, with e-commerce platforms seeing significant market developments.
  • North America and Europe are the leading regions in the natural cosmetics market, supported by well-established beauty and personal care industries, growing consumer awareness, and favorable regulatory frameworks.
  • The Asia Pacific region, particularly China and India, presents immense growth opportunities owing to the rising middle-class population, increasing disposable income, and changing consumer preferences toward natural and organic beauty products.
  • Key global natural cosmetics market companies include major beauty brands, niche natural cosmetics companies, and organic-certified manufacturers.

Future Outlook

  • Increasing concerns regarding the use of chemicals in cosmetics and the growing trend of adopting a holistic approach to beauty and wellness are expected to fuel the market’s growth.
  • The skincare segment is anticipated to maintain its dominance in the global market, focusing on natural ingredients and targeted solutions for various skin concerns.
  • The increased focus on R&D operations to develop and offer new natural components and formulations is projected to propel product developments and market expansion.

Segmentation

  • By Product
    • Skin Care
    • Hair Care
    • Fragrance
    • Color Cosmetic
  • By Distribution Channel
    • Supermarkets/Hypermarkets
    • Specialty Stores
    • Convenience Stores
    • Online
  • By Region
  • North America
    • The U.S.
    • Canada
    • Mexico
  • Europe
    • Germany
    • France
    • The U.K.
    • Italy
    • Spain
    • Rest of Europe
  • Asia Pacific
    • China
    • Japan
    • India
    • South Korea
    • South-east Asia
    • Rest of Asia Pacific
  • Latin America
    • Brazil
    • Argentina
    • Rest of Latin America
  • Middle East & Africa
    • GCC Countries
    • South Africa
    • Rest of the Middle East and Africa

1. Preface
1.1. Report Description
1.1.1. Purpose of the Report
1.1.2. Target Audience
1.1.3. USP and Key Offerings
1.2. Research Scope
1.3. Research Methodology
1.3.1. Phase I – Secondary Research
1.3.2. Phase II – Data Modelling
1.3.2.1. Company Share Analysis Model
1.3.2.2. Revenue-Based Modelling
1.3.3. Phase III – Primary Research
1.3.4. Research Limitations
1.3.5. Assumptions
1.4. Market Introduction
1.5. Market Research Scope

2. Executive Summary
2.1. Market Snapshot: Global Natural Cosmetics Market
2.2. Global Natural Cosmetics Market, By Distribution Channel
2.3. Global Natural Cosmetics Market, By Product
2.4. Global Natural Cosmetics Market, By Region

3. Market Dynamics & Factors Analysis
3.1. Introduction
3.1.1. Global Natural Cosmetics Market Value, 2017-2030, (US$ Bn)
3.1.2. Y-o-Y Growth Trend Analysis
3.2. Market Dynamics
3.2.1. Market Drivers
3.2.1.1. Driver 1
3.2.1.2. Driver 2
3.2.1.3. Driver 3
3.2.2. Market Restraints
3.2.2.1. Restraint 1
3.2.2.2. Restraint 2
3.2.3. Market Opportunities
3.2.3.1. Opportunity 1
3.2.3.2. Opportunity 2
3.2.4. Major Industry Challenges
3.2.4.1. Challenge 1
3.2.4.2. Challenge 2
3.3. Growth and Development Patterns
3.4. Investment Feasibility Analysis
3.5. Market Opportunity Analysis
3.5.1. Distribution Channel
3.5.2. Product
3.5.3. Geography

4. Premium Insights
4.1. STAR (Situation, Task, Action, Results) Analysis
4.2. Porter’s Five Forces Analysis
4.2.1. Threat of New Entrants
4.2.2. Bargaining Power of Buyers/Consumers
4.2.3. Bargaining Power of Suppliers
4.2.4. Threat of Substitute Types
4.2.5. Intensity of Competitive Rivalry
4.3. Key Market Trends
4.3.1. Demand Side Trends
4.3.2. Supply Side Trends
4.4. Value Chain Analysis
4.5. Technology Analysis
4.6. Analysis and Recommendations
4.7. Marketing Strategy Analysis
4.7.1. Direct Marketing
4.7.2. Indirect Marketing
4.7.3. Marketing Channel Development Trend

5. Market Positioning of Key Players, 2022
5.1. Company Market Share of Key Players, 2022
5.2. Competitive Benchmarking
5.3. Market Positioning of Key Vendors
5.4. Geographical Presence Analysis
5.5. Major Strategies Adopted by Key Players
5.5.1. Key Strategies Analysis
5.5.2. Mergers and Acquisitions
5.5.3. Partnerships
5.5.4. Product Launch
5.5.5. Geographical Expansion
5.5.6. Others

6. Economic Impact Analysis
6.1. Recession Impact
6.1.1. North America
6.1.2. Europe
6.1.3. Asia Pacific
6.1.4. Latin America
6.1.5. Middle East and Africa
6.2. Ukraine-Russia War Impact
6.2.1. North America
6.2.2. Europe
6.2.3. Asia Pacific
6.2.4. Latin America
6.2.5. Middle East and Africa
6.3. COVID-19 Impact Analysis
6.3.1. North America
6.3.2. Europe
6.3.3. Asia Pacific
6.3.4. Latin America
6.3.5. Middle East and Africa

7. Global Natural Cosmetics Market, By Distribution Channel
7.1. Global Natural Cosmetics Market Overview, by Distribution Channel
7.1.1. Global Natural Cosmetics Market Revenue Share, By Distribution Channel, 2022 Vs 2030 (in %)
7.2. Supermarkets/Hypermarkets
7.2.1. Global Natural Cosmetics Market, By Region, 2017-2030 (US$ Bn)
7.3. Specialty Stores
7.3.1. Global Natural Cosmetics Market, By Region, 2017-2030 (US$ Bn)
7.4. Convenience Stores
7.4.1. Global Natural Cosmetics Market, By Region, 2017-2030 (US$ Bn)
7.5. Online
7.5.1. Global Natural Cosmetics Market, By Region, 2017-2030 (US$ Bn)

8. Global Natural Cosmetics Market, By Product
8.1. Global Natural Cosmetics Market Overview, by Product
8.1.1. Global Natural Cosmetics Market, By Product, 2022 vs 2030 (in %)
8.2. Skin Care
8.2.1. Global Natural Cosmetics Market, By Region, 2017-2030 (US$ Bn)
8.3. Hair Care
8.3.1. Global Natural Cosmetics Market, By Region, 2017-2030 (US$ Bn)
8.4. Fragrance
8.4.1. Global Natural Cosmetics Market, By Region, 2017-2030 (US$ Bn)
8.5. Color Cosmetic
8.5.1. Global Natural Cosmetics Market, By Region, 2017-2030 (US$ Bn)

9. Global Natural Cosmetics Market, By Region
9.1. Global Natural Cosmetics Market Overview, by Region
9.1.1. Global Natural Cosmetics Market, By Region, 2022 vs 2030 (in%)
9.2. Distribution Channel
9.2.1. Global Natural Cosmetics Market, By Distribution Channel, 2017-2030 (US$ Bn)
9.3. Product
9.3.1. Global Natural Cosmetics Market, By Product, 2017-2030 (US$ Bn)

10. North America Natural Cosmetics Market Analysis
10.1. North America Natural Cosmetics Market, by Distribution Channel, 2017-2030(US$ Bn)
10.1.1. Overview
10.1.2. SRC Analysis
10.2. North America Natural Cosmetics Market, by Product, 2017-2030(US$ Bn)
10.2.1. Overview
10.2.2. SRC Analysis
10.3. North America Natural Cosmetics Market, by Country, 2017-2030 (US$ Bn)
10.3.1. North America Natural Cosmetics Market, by Country, 2022 Vs 2030 (in%)
10.3.2. U.S.
10.3.2.1. U.S. Natural Cosmetics Market Estimates and Forecast, 2017-2030 (US$ Bn)
10.3.2.2. U.S. Natural Cosmetics, By Distribution Channel, 2017-2030 (US$ Bn)
10.3.2.3. U.S. Natural Cosmetics, By Product, 2017-2030 (US$ Bn)
10.3.3. Canada
10.3.3.1. Canada Natural Cosmetics Market Estimates and Forecast, 2017-2030 (US$ Bn)
10.3.3.2. Canada Natural Cosmetics, By Distribution Channel, 2017-2030 (US$ Bn)
10.3.3.3. Canada Natural Cosmetics, By Product, 2017-2030 (US$ Bn)
10.3.4. Mexico
10.3.4.1. Mexico Natural Cosmetics Market Estimates and Forecast, 2017-2030 (US$ Bn)
10.3.4.2. Mexico Natural Cosmetics, By Distribution Channel, 2017-2030 (US$ Bn)
10.3.4.3. Mexico Natural Cosmetics, By Product, 2017-2030 (US$ Bn)

11. Europe Natural Cosmetics Market Analysis
11.1. Europe Natural Cosmetics Market, by Distribution Channel, 2017-2030(US$ Bn)
11.1.1. Overview
11.1.2. SRC Analysis
11.2. Europe Natural Cosmetics Market, by Product, 2017-2030(US$ Bn)
11.2.1. Overview
11.2.2. SRC Analysis
11.3. Europe Natural Cosmetics Market, by Country, 2017-2030 (US$ Bn)
11.3.1. Europe Natural Cosmetics Market, by Country, 2022 Vs 2030 (in%)
11.3.2. Germany
11.3.2.1. Germany Natural Cosmetics Market Estimates and Forecast, 2017-2030 (US$ Bn)
11.3.2.2. Germany Natural Cosmetics, By Distribution Channel, 2017-2030 (US$ Bn)
11.3.2.3. Germany Natural Cosmetics, By Product, 2017-2030 (US$ Bn)
11.3.3. France
11.3.3.1. France Natural Cosmetics Market Estimates and Forecast, 2017-2030 (US$ Bn)
11.3.3.2. France Natural Cosmetics, By Distribution Channel, 2017-2030 (US$ Bn)
11.3.3.3. France Natural Cosmetics, By Product, 2017-2030 (US$ Bn)
11.3.4. UK
11.3.4.1. UK Natural Cosmetics Market Estimates and Forecast, 2017-2030 (US$ Bn)
11.3.4.2. UK Natural Cosmetics, By Distribution Channel, 2017-2030 (US$ Bn)
11.3.4.3. UK Natural Cosmetics, By Product, 2017-2030 (US$ Bn)
11.3.5. Italy
11.3.5.1. Italy Natural Cosmetics Market Estimates and Forecast, 2017-2030 (US$ Bn)
11.3.5.2. Italy Natural Cosmetics, By Distribution Channel, 2017-2030 (US$ Bn)
11.3.5.3. Italy Natural Cosmetics, By Product, 2017-2030 (US$ Bn)
11.3.6. Spain
11.3.6.1. Spain Natural Cosmetics Market Estimates and Forecast, 2017-2030 (US$ Bn)
11.3.6.2. Spain Natural Cosmetics, By Distribution Channel, 2017-2030 (US$ Bn)
11.3.6.3. Spain Natural Cosmetics, By Product, 2017-2030 (US$ Bn)
11.3.7. Rest of Europe
11.3.7.1. Rest of Europe Natural Cosmetics Market Estimates and Forecast, 2017-2030 (US$ Bn)
11.3.7.2. Rest of Europe Natural Cosmetics, By Distribution Channel, 2017-2030 (US$ Bn)
11.3.7.3. Rest of Europe Natural Cosmetics, By Product, 2017-2030 (US$ Bn)

12. Asia Pacific Natural Cosmetics Market Analysis
12.1. Asia Pacific Natural Cosmetics Market, by Distribution Channel, 2017-2030(US$ Bn)
12.1.1. Overview
12.1.2. SRC Analysis
12.2. Asia Pacific Natural Cosmetics Market, by Product, 2017-2030(US$ Bn)
12.2.1. Overview
12.2.2. SRC Analysis
12.3. Asia Pacific Natural Cosmetics Market, by Country, 2017-2030 (US$ Bn)
12.3.1. Asia Pacific Natural Cosmetics Market, by Country, 2022 Vs 2030 (in%)
12.3.2. China
12.3.2.1. China Natural Cosmetics Market Estimates and Forecast, 2017-2030 (US$ Bn)
12.3.2.2. China Natural Cosmetics, By Distribution Channel, 2017-2030 (US$ Bn)
12.3.2.3. China Natural Cosmetics, By Product, 2017-2030 (US$ Bn)
12.3.3. Japan
12.3.3.1. Japan Natural Cosmetics Market Estimates and Forecast, 2017-2030 (US$ Bn)
12.3.3.2. Japan Natural Cosmetics, By Distribution Channel, 2017-2030 (US$ Bn)
12.3.3.3. Japan Natural Cosmetics, By Product, 2017-2030 (US$ Bn)
12.3.4. India
12.3.4.1. India Natural Cosmetics Market Estimates and Forecast, 2017-2030 (US$ Bn)
12.3.4.2. India Natural Cosmetics, By Distribution Channel, 2017-2030 (US$ Bn)
12.3.4.3. India Natural Cosmetics, By Product, 2017-2030 (US$ Bn)
12.3.5. South Korea
12.3.5.1. South Korea Natural Cosmetics Market Estimates and Forecast, 2017-2030 (US$ Bn)
12.3.5.2. South Korea Natural Cosmetics, By Distribution Channel, 2017-2030 (US$ Bn)
12.3.5.3. South Korea Natural Cosmetics, By Product, 2017-2030 (US$ Bn)
12.3.6. South-East Asia
12.3.6.1. South-East Asia Natural Cosmetics Market Estimates and Forecast, 2017-2030 (US$ Bn)
12.3.6.2. South-East Asia Natural Cosmetics, By Distribution Channel, 2017-2030 (US$ Bn)
12.3.6.3. South-East Asia Natural Cosmetics, By Product, 2017-2030 (US$ Bn)
12.3.7. Rest of Asia Pacific
12.3.7.1. Rest of Asia Pacific Natural Cosmetics Market Estimates and Forecast, 2017-2030 (US$ Bn)
12.3.7.2. Rest of Asia Pacific Natural Cosmetics, By Distribution Channel, 2017-2030 (US$ Bn)
12.3.7.3. Rest of Asia Pacific Natural Cosmetics, By Product, 2017-2030 (US$ Bn)

13. Latin America Natural Cosmetics Market Analysis
13.1. Latin America Natural Cosmetics Market, by Distribution Channel, 2017-2030(US$ Bn)
13.1.1. Overview
13.1.2. SRC Analysis
13.2. Latin America Natural Cosmetics Market, by Product, 2017-2030(US$ Bn)
13.2.1. Overview
13.2.2. SRC Analysis
13.3. Latin America Natural Cosmetics Market, by Country, 2017-2030 (US$ Bn)
13.3.1. Latin America Natural Cosmetics Market, by Country, 2022 Vs 2030 (in%)
13.3.2. Brazil
13.3.2.1. Brazil Natural Cosmetics Market Estimates and Forecast, 2017-2030 (US$ Bn)
13.3.2.2. Brazil Natural Cosmetics, By Distribution Channel, 2017-2030 (US$ Bn)
13.3.2.3. Brazil Natural Cosmetics, By Product, 2017-2030 (US$ Bn)
13.3.3. Argentina
13.3.3.1. Argentina Natural Cosmetics Market Estimates and Forecast, 2017-2030 (US$ Bn)
13.3.3.2. Argentina Natural Cosmetics, By Distribution Channel, 2017-2030 (US$ Bn)
13.3.3.3. Argentina Natural Cosmetics, By Product, 2017-2030 (US$ Bn)
13.3.4. Rest of Latin America
13.3.4.1. Rest of Latin America Natural Cosmetics Market Estimates and Forecast, 2017-2030 (US$ Bn)
13.3.4.2. Rest of Latin America Natural Cosmetics, By Distribution Channel, 2017-2030 (US$ Bn)
13.3.4.3. Rest of Latin America Natural Cosmetics, By Product, 2017-2030 (US$ Bn)

14. Middle East and Africa Natural Cosmetics Market Analysis
14.1. Middle East and Africa Natural Cosmetics Market, by Distribution Channel, 2017-2030(US$ Bn)
14.1.1. Overview
14.1.2. SRC Analysis
14.2. Middle East and Africa Natural Cosmetics Market, by Product, 2017-2030(US$ Bn)
14.2.1. Overview
14.2.2. SRC Analysis
14.3. Middle East and Africa Natural Cosmetics Market, by Country, 2017-2030 (US$ Bn)
14.3.1. Middle East and Africa Natural Cosmetics Market, by Country, 2022 Vs 2030 (in%)
14.3.2. GCC Countries
14.3.2.1. GCC Countries Natural Cosmetics Market Estimates and Forecast, 2017-2030 (US$ Bn)
14.3.2.2. GCC Countries Natural Cosmetics, By Distribution Channel, 2017-2030 (US$ Bn)
14.3.2.3. GCC Countries Natural Cosmetics, By Product, 2017-2030 (US$ Bn)
14.3.3. South Africa
14.3.3.1. South Africa Natural Cosmetics Market Estimates and Forecast, 2017-2030 (US$ Bn)
14.3.3.2. South Africa Natural Cosmetics, By Distribution Channel, 2017-2030 (US$ Bn)
14.3.3.3. South Africa Natural Cosmetics, By Product, 2017-2030 (US$ Bn)
14.3.4. Rest of Middle East and Africa
14.3.4.1. Rest of Middle East and Africa Natural Cosmetics Market Estimates and Forecast, 2017-2030 (US$ Bn)
14.3.4.2. Rest of Middle East and Africa Natural Cosmetics, By Distribution Channel, 2017-2030 (US$ Bn)
14.3.4.3. Rest of Middle East and Africa Natural Cosmetics, By Product, 2017-2030 (US$ Bn)

15. Company Profiles
15.1. Burt’s Bees
15.1.1. Company Overview
15.1.2. Products/Services Portfolio
15.1.3. Geographical Presence
15.1.4. Financial Summary
15.1.4.1. Market Revenue and Net Profit (2019-2022)
15.1.4.2. Business Segment Revenue Analysis
15.1.4.3. Geographical Revenue Analysis
15.2. 100% Pure
15.3. Korres S.A.
15.4. Bare Escentuals Beauty Inc
15.5. L’Oréal SA
15.6. Aveeno
15.7. Weleda AG
15.8. Arbonne International LLC
15.9. Avon Product Inc
15.10. Coty Inc
15.11. Tata Harper

List of Figures
FIG. 1 Global Natural Cosmetics Market: Research Methodology
FIG. 2 Market Size Estimation – Top Down & Bottom Up Approach
FIG. 3 Global Natural Cosmetics Market Segmentation
FIG. 4 Global Natural Cosmetics Market, by Distribution Channel, 2022 (US$ Bn)
FIG. 5 Global Natural Cosmetics Market, by Product, 2022 (US$ Bn)
FIG. 6 Global Natural Cosmetics Market, by Geography, 2022 (US$ Bn)
FIG. 7 Attractive Investment Proposition, by Distribution Channel, 2022
FIG. 8 Attractive Investment Proposition, by Product, 2022
FIG. 9 Attractive Investment Proposition, by Geography, 2022
FIG. 10 Global Market Share Analysis of Key Natural Cosmetics Market Manufacturers, 2022
FIG. 11 Global Market Positioning of Key Natural Cosmetics Market Manufacturers, 2022
FIG. 12 Global Natural Cosmetics Market Value Contribution, By Distribution Channel, 2022 & 2030 (Value %)
FIG. 13 Global Natural Cosmetics Market, by Supermarkets/Hypermarkets, Value, 2017-2030 (US$ Bn)
FIG. 14 Global Natural Cosmetics Market, by Specialty Stores, Value, 2017-2030 (US$ Bn)
FIG. 15 Global Natural Cosmetics Market, by Convenience Stores, Value, 2017-2030 (US$ Bn)
FIG. 16 Global Natural Cosmetics Market, by Online, Value, 2017-2030 (US$ Bn)
FIG. 17 Global Natural Cosmetics Market Value Contribution, By Product, 2022 & 2030 (Value %)
FIG. 18 Global Natural Cosmetics Market, by Skin Care, Value, 2017-2030 (US$ Bn)
FIG. 19 Global Natural Cosmetics Market, by Hair Care, 2017-2030 (US$ Bn)
FIG. 20 Global Natural Cosmetics Market, by Fragrance, Value, 2017-2030 (US$ Bn)
FIG. 21 Global Natural Cosmetics Market, by Color Cosmetic, 2017-2030 (US$ Bn)
FIG. 22 North America Natural Cosmetics Market, 2017-2030 (US$ Bn)
FIG. 23 U.S. Natural Cosmetics Market, 2017-2030 (US$ Bn)
FIG. 24 Canada Natural Cosmetics Market, 2017-2030 (US$ Bn)
FIG. 25 Europe Natural Cosmetics Market, 2017-2030 (US$ Bn)
FIG. 26 Germany Natural Cosmetics Market, 2017-2030 (US$ Bn)
FIG. 27 France Natural Cosmetics Market, 2017-2030 (US$ Bn)
FIG. 28 U.K. Natural Cosmetics Market, 2017-2030 (US$ Bn)
FIG. 29 Italy Natural Cosmetics Market, 2017-2030 (US$ Bn)
FIG. 30 Spain Natural Cosmetics Market, 2017-2030 (US$ Bn)
FIG. 31 Rest of Europe Natural Cosmetics Market, 2017-2030 (US$ Bn)
FIG. 32 Asia Pacific Natural Cosmetics Market, 2017-2030 (US$ Bn)
FIG. 33 China Natural Cosmetics Market, 2017-2030 (US$ Bn)
FIG. 34 Japan Natural Cosmetics Market, 2017-2030 (US$ Bn)
FIG. 35 India Natural Cosmetics Market, 2017-2030 (US$ Bn)
FIG. 36 South Korea Natural Cosmetics Market, 2017-2030 (US$ Bn)
FIG. 37 South-East Asia Natural Cosmetics Market, 2017-2030 (US$ Bn)
FIG. 38 Rest of Asia Pacific Natural Cosmetics Market, 2017-2030 (US$ Bn)
FIG. 39 Latin America Natural Cosmetics Market, 2017-2030 (US$ Bn)
FIG. 40 Brazil Natural Cosmetics Market, 2017-2030 (US$ Bn)
FIG. 41 Mexico Natural Cosmetics Market, 2017-2030 (US$ Bn)
FIG. 42 Rest of Latin America Natural Cosmetics Market, 2017-2030 (US$ Bn)
FIG. 43 Middle East & Africa Natural Cosmetics Market, 2017-2030 (US$ Bn)
FIG. 44 GCC Countries Natural Cosmetics Market, 2017-2030 (US$ Bn)
FIG. 45 South Africa Natural Cosmetics Market, 2017-2030 (US$ Bn)
FIG. 46 Rest of Middle East and Africa Natural Cosmetics Market, 2017-2030 (US$ Bn)

List of Tables
TABLE 1 Market Snapshot: Global Natural Cosmetics Market
TABLE 2 Global Natural Cosmetics Market: Market Drivers Impact Analysis
TABLE 3 Global Natural Cosmetics Market: Market Restraints Impact Analysis
TABLE 4 Global Natural Cosmetics Market, by Competitive Benchmarking, 2022
TABLE 5 Global Natural Cosmetics Market, by Geographical Presence Analysis, 2022
TABLE 6 Global Natural Cosmetics Market, by Key Strategies Analysis, 2022
TABLE 7 Global Natural Cosmetics Market, by Supermarkets/Hypermarkets, By Region, 2017-2022 (US$ Bn)
TABLE 8 Global Natural Cosmetics Market, by Supermarkets/Hypermarkets, By Region, 2023-2030 (US$ Bn)
TABLE 9 Global Natural Cosmetics Market, by Specialty Stores, By Region, 2017-2022 (US$ Bn)
TABLE 10 Global Natural Cosmetics Market, by Specialty Stores, By Region, 2023-2030 (US$ Bn)
TABLE 11 Global Natural Cosmetics Market, by Convenience Stores, By Region, 2017-2022 (US$ Bn)
TABLE 12 Global Natural Cosmetics Market, by Convenience Stores, By Region, 2023-2030 (US$ Bn)
TABLE 13 Global Natural Cosmetics Market, by Online, By Region, 2017-2022 (US$ Bn)
TABLE 14 Global Natural Cosmetics Market, by Online, By Region, 2023-2030 (US$ Bn)
TABLE 15 Global Natural Cosmetics Market, by Skin Care, By Region, 2017-2022 (US$ Bn)
TABLE 16 Global Natural Cosmetics Market, by Skin Care, By Region, 2023-2030 (US$ Bn)
TABLE 17 Global Natural Cosmetics Market, by Hair Care, By Region, 2017-2022 (US$ Bn)
TABLE 18 Global Natural Cosmetics Market, by Hair Care, By Region, 2023-2030 (US$ Bn)
TABLE 19 Global Natural Cosmetics Market, by Fragrance, By Region, 2017-2022 (US$ Bn)
TABLE 20 Global Natural Cosmetics Market, by Fragrance, By Region, 2023-2030 (US$ Bn)
TABLE 21 Global Natural Cosmetics Market, by Color Cosmetic, By Region, 2017-2022 (US$ Bn)
TABLE 22 Global Natural Cosmetics Market, by Color Cosmetic, By Region, 2023-2030 (US$ Bn)
TABLE 23 Global Natural Cosmetics Market, by Distribution Channel, 2017-2022 (US$ Bn)
TABLE 24 Global Natural Cosmetics Market, by Distribution Channel, 2023-2030 (US$ Bn)
TABLE 25 Global Natural Cosmetics Market, by Product, 2017-2022 (US$ Bn)
TABLE 26 Global Natural Cosmetics Market, by Product, 2023-2030 (US$ Bn)
TABLE 27 Global Natural Cosmetics Market, by Region, 2017-2022 (US$ Bn)
TABLE 28 Global Natural Cosmetics Market, by Region, 2023-2030 (US$ Bn)
TABLE 29 North America Natural Cosmetics Market, by Distribution Channel, 2017-2022 (US$ Bn)
TABLE 30 North America Natural Cosmetics Market, by Distribution Channel, 2023-2030 (US$ Bn)
TABLE 31 North America Natural Cosmetics Market, by Product, 2017-2022 (US$ Bn)
TABLE 32 North America Natural Cosmetics Market, by Product, 2023-2030 (US$ Bn)
TABLE 33 North America Natural Cosmetics Market, by Country, 2017-2022 (US$ Bn)
TABLE 34 North America Natural Cosmetics Market, by Country, 2023-2030 (US$ Bn)
TABLE 35 United States Natural Cosmetics Market, by Distribution Channel, 2017-2022 (US$ Bn)
TABLE 36 United States Natural Cosmetics Market, by Distribution Channel, 2023-2030 (US$ Bn)
TABLE 37 United States Natural Cosmetics Market, by Product, 2017-2022 (US$ Bn)
TABLE 38 United States Natural Cosmetics Market, by Product, 2023-2030 (US$ Bn)
TABLE 39 Canada Natural Cosmetics Market, by Distribution Channel, 2017-2022 (US$ Bn)
TABLE 40 Canada Natural Cosmetics Market, by Distribution Channel, 2023-2030 (US$ Bn)
TABLE 41 Canada Natural Cosmetics Market, by Product, 2017-2022 (US$ Bn)
TABLE 42 Canada Natural Cosmetics Market, by Product, 2023-2030 (US$ Bn)
TABLE 43 Mexico Natural Cosmetics Market, by Distribution Channel, 2017-2022 (US$ Bn)
TABLE 44 Mexico Natural Cosmetics Market, by Distribution Channel, 2023-2030 (US$ Bn)
TABLE 45 Mexico Natural Cosmetics Market, by Product, 2017-2022 (US$ Bn)
TABLE 46 Mexico Natural Cosmetics Market, by Product, 2023-2030 (US$ Bn)
TABLE 47 Europe Natural Cosmetics Market, by Distribution Channel, 2017-2022 (US$ Bn)
TABLE 48 Europe Natural Cosmetics Market, by Distribution Channel, 2023-2030 (US$ Bn)
TABLE 49 Europe Natural Cosmetics Market, by Product, 2017-2022 (US$ Bn)
TABLE 50 Europe Natural Cosmetics Market, by Product, 2023-2030 (US$ Bn)
TABLE 51 Europe Natural Cosmetics Market, by Country, 2017-2022 (US$ Bn)
TABLE 52 Europe Natural Cosmetics Market, by Country, 2023-2030 (US$ Bn)
TABLE 53 Germany Natural Cosmetics Market, by Distribution Channel, 2017-2022 (US$ Bn)
TABLE 54 Germany Natural Cosmetics Market, by Distribution Channel, 2023-2030 (US$ Bn)
TABLE 55 Germany Natural Cosmetics Market, by Product, 2017-2022 (US$ Bn)
TABLE 56 Germany Natural Cosmetics Market, by Product, 2023-2030 (US$ Bn)
TABLE 57 France Natural Cosmetics Market, by Distribution Channel, 2017-2022 (US$ Bn)
TABLE 58 France Natural Cosmetics Market, by Distribution Channel, 2023-2030 (US$ Bn)
TABLE 59 France Natural Cosmetics Market, by Product, 2017-2022 (US$ Bn)
TABLE 60 France Natural Cosmetics Market, by Product, 2023-2030 (US$ Bn)
TABLE 61 United Kingdom Natural Cosmetics Market, by Distribution Channel, 2017-2022 (US$ Bn)
TABLE 62 United Kingdom Natural Cosmetics Market, by Distribution Channel, 2023-2030 (US$ Bn)
TABLE 63 United Kingdom Natural Cosmetics Market, by Product, 2017-2022 (US$ Bn)
TABLE 64 United Kingdom Natural Cosmetics Market, by Product, 2023-2030 (US$ Bn)
TABLE 65 Italy Natural Cosmetics Market, by Distribution Channel, 2017-2022 (US$ Bn)
TABLE 66 Italy Natural Cosmetics Market, by Distribution Channel, 2023-2030 (US$ Bn)
TABLE 67 Italy Natural Cosmetics Market, by Product, 2017-2022 (US$ Bn)
TABLE 68 Italy Natural Cosmetics Market, by Product, 2023-2030 (US$ Bn)
TABLE 69 Spain Natural Cosmetics Market, by Distribution Channel, 2017-2022 (US$ Bn)
TABLE 70 Spain Natural Cosmetics Market, by Distribution Channel, 2023-2030 (US$ Bn)
TABLE 71 Spain Natural Cosmetics Market, by Product, 2017-2022 (US$ Bn)
TABLE 72 Spain Natural Cosmetics Market, by Product, 2023-2030 (US$ Bn)
TABLE 73 Rest of Europe Natural Cosmetics Market, by Distribution Channel, 2017-2022 (US$ Bn)
TABLE 74 Rest of Europe Natural Cosmetics Market, by Distribution Channel, 2023-2030 (US$ Bn)
TABLE 75 Rest of Europe Natural Cosmetics Market, by Product, 2017-2022 (US$ Bn)
TABLE 76 Rest of Europe Natural Cosmetics Market, by Product, 2023-2030 (US$ Bn)
TABLE 77 Asia Pacific Natural Cosmetics Market, by Distribution Channel, 2017-2022 (US$ Bn)
TABLE 78 Asia Pacific Natural Cosmetics Market, by Distribution Channel, 2023-2030 (US$ Bn)
TABLE 79 Asia Pacific Natural Cosmetics Market, by Product, 2017-2022 (US$ Bn)
TABLE 80 Asia Pacific Natural Cosmetics Market, by Product, 2023-2030 (US$ Bn)
TABLE 81 China Natural Cosmetics Market, by Distribution Channel, 2017-2022 (US$ Bn)
TABLE 82 China Natural Cosmetics Market, by Distribution Channel, 2023-2030 (US$ Bn)
TABLE 83 China Natural Cosmetics Market, by Product, 2017-2022 (US$ Bn)
TABLE 84 China Natural Cosmetics Market, by Product, 2023-2030 (US$ Bn)
TABLE 85 Japan Natural Cosmetics Market, by Distribution Channel, 2017-2022 (US$ Bn)
TABLE 86 Japan Natural Cosmetics Market, by Distribution Channel, 2023-2030 (US$ Bn)
TABLE 87 Japan Natural Cosmetics Market, by Product, 2017-2022 (US$ Bn)
TABLE 88 Japan Natural Cosmetics Market, by Product, 2023-2030 (US$ Bn)
TABLE 89 India Natural Cosmetics Market, by Distribution Channel, 2017-2022 (US$ Bn)
TABLE 90 India Natural Cosmetics Market, by Distribution Channel, 2023-2030 (US$ Bn)
TABLE 91 India Natural Cosmetics Market, by Product, 2017-2022 (US$ Bn)
TABLE 92 India Natural Cosmetics Market, by Product, 2023-2030 (US$ Bn)
TABLE 93 South Korea Natural Cosmetics Market, by Distribution Channel, 2017-2022 (US$ Bn)
TABLE 94 South Korea Natural Cosmetics Market, by Distribution Channel, 2023-2030 (US$ Bn)
TABLE 95 South Korea Natural Cosmetics Market, by Product, 2017-2022 (US$ Bn)
TABLE 96 South Korea Natural Cosmetics Market, by Product, 2023-2030 (US$ Bn)
TABLE 97 South-East Asia Natural Cosmetics Market, by Distribution Channel, 2017-2022 (US$ Bn)
TABLE 98 South-East Asia Natural Cosmetics Market, by Distribution Channel, 2023-2030 (US$ Bn)
TABLE 99 South-East Asia Natural Cosmetics Market, by Product, 2017-2022 (US$ Bn)
TABLE 100 South-East Asia Natural Cosmetics Market, by Product, 2023-2030 (US$ Bn)
TABLE 101 Rest of Asia Pacific Natural Cosmetics Market, by Distribution Channel, 2017-2022 (US$ Bn)
TABLE 102 Rest of Asia Pacific Natural Cosmetics Market, by Distribution Channel, 2023-2030 (US$ Bn)
TABLE 103 Rest of Asia Pacific Natural Cosmetics Market, by Product, 2017-2022 (US$ Bn)
TABLE 104 Rest of Asia Pacific Natural Cosmetics Market, by Product, 2023-2030 (US$ Bn)
TABLE 105 Latin America Natural Cosmetics Market, by Distribution Channel, 2017-2022 (US$ Bn)
TABLE 106 Latin America Natural Cosmetics Market, by Distribution Channel, 2023-2030 (US$ Bn)
TABLE 107 Latin America Natural Cosmetics Market, by Product, 2017-2022 (US$ Bn)
TABLE 108 Latin America Natural Cosmetics Market, by Product, 2023-2030 (US$ Bn)
TABLE 109 Brazil Natural Cosmetics Market, by Distribution Channel, 2017-2022 (US$ Bn)
TABLE 110 Brazil Natural Cosmetics Market, by Distribution Channel, 2023-2030 (US$ Bn)
TABLE 111 Brazil Natural Cosmetics Market, by Product, 2017-2022 (US$ Bn)
TABLE 112 Brazil Natural Cosmetics Market, by Product, 2023-2030 (US$ Bn)
TABLE 113 Argentina Natural Cosmetics Market, by Distribution Channel, 2017-2022 (US$ Bn)
TABLE 114 Argentina Natural Cosmetics Market, by Distribution Channel, 2023-2030 (US$ Bn)
TABLE 115 Argentina Natural Cosmetics Market, by Product, 2017-2022 (US$ Bn)
TABLE 116 Argentina Natural Cosmetics Market, by Product, 2023-2030 (US$ Bn)
TABLE 117 Rest of Latin America Natural Cosmetics Market, by Distribution Channel, 2017-2022 (US$ Bn)
TABLE 118 Rest of Latin America Natural Cosmetics Market, by Distribution Channel, 2023-2030 (US$ Bn)
TABLE 119 Rest of Latin America Natural Cosmetics Market, by Product, 2017-2022 (US$ Bn)
TABLE 120 Rest of Latin America Natural Cosmetics Market, by Product, 2023-2030 (US$ Bn)
TABLE 121 Middle East and Africa Natural Cosmetics Market, by Distribution Channel, 2017-2022 (US$ Bn)
TABLE 122 Middle East and Africa Natural Cosmetics Market, by Distribution Channel, 2023-2030 (US$ Bn)
TABLE 123 Middle East and Africa Natural Cosmetics Market, by Product, 2017-2022 (US$ Bn)
TABLE 124 Middle East and Africa Natural Cosmetics Market, by Product, 2023-2030 (US$ Bn)
TABLE 125 GCC Countries Natural Cosmetics Market, by Distribution Channel, 2017-2022 (US$ Bn)
TABLE 126 GCC Countries Natural Cosmetics Market, by Distribution Channel, 2023-2030 (US$ Bn)
TABLE 127 GCC Countries Natural Cosmetics Market, by Product, 2017-2022 (US$ Bn)
TABLE 128 GCC Countries Natural Cosmetics Market, by Product, 2023-2030 (US$ Bn)
TABLE 129 South Africa Natural Cosmetics Market, by Distribution Channel, 2017-2022 (US$ Bn)
TABLE 130 South Africa Natural Cosmetics Market, by Distribution Channel, 2023-2030 (US$ Bn)
TABLE 131 South Africa Natural Cosmetics Market, by Product, 2017-2022 (US$ Bn)
TABLE 132 South Africa Natural Cosmetics Market, by Product, 2023-2030 (US$ Bn)
TABLE 133 Rest of Middle East and Africa Natural Cosmetics Market, by Distribution Channel, 2017-2022 (US$ Bn)
TABLE 134 Rest of Middle East and Africa Natural Cosmetics Market, by Distribution Channel, 2023-2030 (US$ Bn)
TABLE 135 Rest of Middle East and Africa Natural Cosmetics Market, by Product, 2017-2022 (US$ Bn)
TABLE 136 Rest of Middle East and Africa Natural Cosmetics Market, by Product, 2023-2030 (US$ Bn)

Frequent Asked Questions

What is the current size of the global natural cosmetics market?

The global natural cosmetics market was valued at USD 37.2 Billion in 2022.

What is the anticipated growth rate of the natural cosmetics market between 2023 and 2030?

The natural cosmetics market is anticipated to grow at a CAGR of 5.5% between 2023 and 2030, reaching USD 54.11 Billion in 2030.

Which segment is leading the market share in terms of product?

Skin care is the leading segment by material, holding over 41% share in terms of value in 2022.

Which distribution channel segment governs the demand for natural cosmetics in the world?

.The supermarkets/hypermarkets segment governs the demand for natural cosmetics in the world, holding a massive share of over 38.5% in 2022

Which product segment is expected to post the highest CAGR during the forecast period?

The hair care segment will post the highest CAGR during the forecast period.

Which region is fueling the growth of the natural cosmetics industry?

North America is fueling the growth of the natural cosmetics industry, with an over one-third share in 2022.

Who are the major players in the global natural cosmetics market?

The top players include L’Oréal SA, Tata Harper, Weleda AG, and Burt’s Bees. Other major players include Korres S.A., Aveeno, Avon Product Inc, and 100% Pure.

What are the major market drivers of the natural cosmetics industry?

The key market drivers of the natural cosmetics sector include rising consumer demand for clean and sustainable beauty products, increased awareness of the possible hazards connected with traditional cosmetics, and a shift towards a more holistic approach to beauty and wellness.

What are the major market restraints of the natural cosmetics industry?

The key market limitations of the natural cosmetics industry are the higher cost of natural and organic materials, challenges associated with sourcing and ensuring a constant supply of these ingredients, and the requirement for stronger regulatory compliance and certifications.

What are the major market opportunities in the natural cosmetics industry?

Major market opportunities in the natural cosmetics industry are growing consumer demand for clean and sustainable beauty products, the rising popularity of organic and natural ingredients, and expanding market potential in emerging economies.

Massage Chair Market

Published:
Report ID: 36375

Foot Care Products Market

Published:
Report ID: 5605

Hair Styling Tools Market

Published:
Report ID: 36362

Electric Kettle Market

Published:
Report ID: 36332

Baby High Chair Market

Published:
Report ID: 36303

Water Cooler Market

Published:
Report ID: 36292

Dishwasher Market

Published:
Report ID: 36268

Vacuum Cleaner Market

Published:
Report ID: 36253

Lipstick Market

Published:
Report ID: 36247

Coconut Oil Market

Published:
Report ID: 36156

Train Seat Market

Published:
Report ID: 11562

Hair Removal Wax Market

Published:
Report ID: 35837

Purchase Options

$2999
Delivery Format: Excel.
$4999
Designed for the individual purchaser.
$6999
Users located at a single corporate site or regional office.
$7999
Allowed for unlimited sharing globally within one company.
Smallform of Sample request

Have a question?

User Profile

Don’t settle for less – trust Mitul to help you find the best solution.

Report delivery within 24 to 48 hours

– Other Info –

What people say?-

User Review

I am very impressed with the information in this report. The author clearly did their research when they came up with this product and it has already given me a lot of ideas.

Jana Schmidt
CEDAR CX Technologies

– Connect with us –

Phone

+91 6232 49 3207


support

24/7 Research Support


sales@credenceresearch.com

– Research Methodology –

Going beyond the basics: advanced techniques in research methodology

– Trusted By –

Pepshi, LG, Nestle
Motorola, Honeywell, Johnson and johnson
LG Chem, SIEMENS, Pfizer
Unilever, Samsonite, QIAGEN