Market Overview:
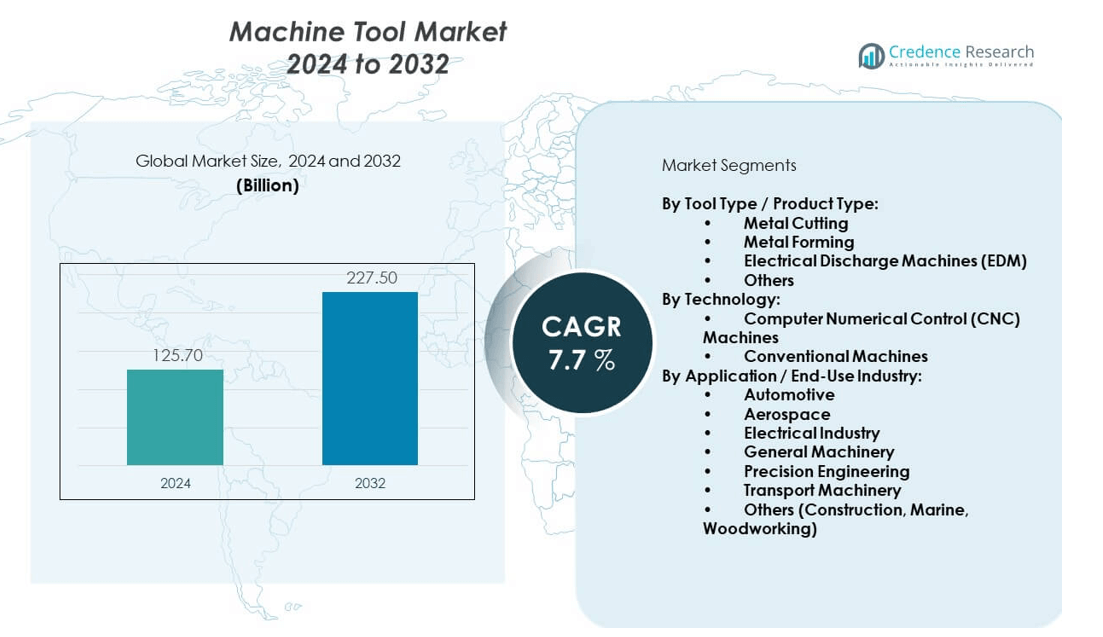
The Machine tool market is projected to grow from USD 125.7 billion in 2024 to an estimated USD 227.5 billion by 2032, registering a compound annual growth rate (CAGR) of 7.7% during the forecast period (2024–2032).
| REPORT ATTRIBUTE |
DETAILS |
| Historical Period |
2020-2023 |
| Base Year |
2024 |
| Forecast Period |
2025-2032 |
| Machine Tool Market Size 2024 |
USD 125.7 billion |
| Machine Tool Market, CAGR |
7.7% |
| Machine Tool Market Size 2032 |
USD 227.5 billion |
The market is propelled by growing emphasis on high-precision manufacturing, rising demand for customized products, and the shift toward automation and smart factories. Manufacturers are increasingly investing in CNC machines, multi-axis machining centers, and additive manufacturing-compatible tools to enhance productivity. The integration of IoT and predictive maintenance solutions also enables improved operational efficiency, reducing downtime and production costs. Expanding applications across EV manufacturing, defense, and electronics industries further stimulate steady growth opportunities for machine tools.
Geographically, Asia-Pacific dominates the machine tool market, led by strong industrial output and manufacturing bases in China, Japan, and South Korea. Europe follows, supported by advanced automotive and aerospace industries, particularly in Germany and Italy, which are renowned for precision engineering. North America shows robust growth fueled by automation adoption and reshoring initiatives in the United States. Emerging regions such as Latin America and the Middle East & Africa are experiencing rising demand, largely due to growing infrastructure projects, industrialization, and government-led initiatives to strengthen local manufacturing sectors.
Market Insights:
- The machine tool market was valued at USD 125.7 billion in 2024 and is projected to reach USD 227.5 billion by 2032, growing at a CAGR of 7% during the forecast period.
- Rising demand for high-precision components in automotive, aerospace, and electronics industries drives consistent adoption of advanced machine tools.
- Integration of Industry 4.0, IoT-enabled systems, and smart manufacturing solutions enhances productivity and operational efficiency.
- High capital investment requirements and growing maintenance costs act as significant restraints for small and medium enterprises.
- Skilled workforce shortages and supply chain volatility continue to challenge global production stability.
- Asia-Pacific leads the market with strong industrial output, while North America and Europe benefit from automation and advanced manufacturing adoption.
- Emerging economies in Latin America and the Middle East & Africa show strong growth potential, fueled by industrialization and infrastructure expansion.
Access crucial information at unmatched prices!
Request your sample report today & start making informed decisions powered by Credence Research Inc.!
Download Sample
Market Drivers:
Rising Demand for Precision Manufacturing Across Multiple Industrial Applications:
The machine tool market is driven by the rising demand for high-precision components across industries such as automotive, aerospace, electronics, and energy. Companies are increasingly focusing on producing complex parts with tighter tolerances, which requires advanced machining technologies. Growing consumer expectations for customized and high-performance products encourage manufacturers to adopt CNC-based and multi-axis machine tools. Industrial automation is reshaping production environments by reducing errors and improving consistency in output. The growth of electric vehicle manufacturing is intensifying demand for advanced machine tools capable of working with lightweight and high-strength materials. Aerospace companies rely on such tools to achieve the high safety and performance standards required for critical applications. Electronics manufacturers are adopting micromachining technologies to keep up with miniaturization trends. It is this consistent requirement for precision and productivity that sustains the expansion of the machine tool market.
- For instance, DMG Mori Seiki’s ULTRASONIC Precision machine offers a positioning accuracy as standard, enabling highly precise 5-axis milling combined with ultrasonic-assisted machining.
Integration of Smart Manufacturing and Digital Technologies in Industrial Systems:
The widespread adoption of Industry 4.0 practices acts as a major driver for the machine tool market. Manufacturers are increasingly embracing IoT-enabled machines, real-time monitoring systems, and data-driven controls to optimize operations. Smart factories rely on predictive analytics and digital twins to minimize downtime and extend equipment life. Automation combined with advanced software solutions enhances operational efficiency and reduces production costs. Integration of AI-driven programming enables improved design accuracy and accelerated prototyping. Companies are using cloud-based platforms to connect machine tools with enterprise systems, allowing greater control and traceability. The shift toward digitally connected machines also supports sustainability goals by minimizing material waste. It is this convergence of technology and manufacturing that strengthens the competitiveness of machine tool investments.
- For instance, DMG Mori Seiki’s CELOS X control system supports entire production workflows from programming to process optimization, while GREENMODE reduces energy consumption by up to 30% in connected machines.
Growing Investments in Automotive, Aerospace, and Infrastructure Expansion:
The machine tool market is expanding through strong investments in automotive and aerospace manufacturing. Automakers are increasing reliance on machine tools for producing powertrain parts, electric vehicle components, and lightweight structures. Aerospace manufacturers demand tools capable of handling titanium, composites, and other specialized materials used in aircraft. Expanding infrastructure projects across Asia and the Middle East create demand for heavy machinery, construction equipment, and industrial components. Machine tools play a crucial role in producing the precision parts required in construction and energy projects. Government initiatives that promote industrial development strengthen domestic demand for advanced production equipment. Rising defense budgets in several nations also stimulate machine tool requirements for military-grade manufacturing. It is this alignment of industry investments and public policies that keeps the sector on a steady growth trajectory.
Expanding Adoption of Advanced Machining for Emerging Applications:
The machine tool market benefits from growing adoption in emerging applications such as renewable energy, robotics, and medical devices. Wind turbine and solar equipment manufacturers require precise components that can only be produced through high-performance machine tools. The robotics industry increasingly depends on such tools for fabricating accurate joints and control assemblies. Healthcare applications such as surgical instruments, implants, and prosthetics rely on machining technologies for high precision. Machine tools with micromachining and hybrid capabilities address the rising complexity of these products. Technological upgrades in additive-subtractive hybrid machines enable broader application coverage. Global supply chains are also being reshaped to support localization, further strengthening investments in machine tools. It is the broadening scope of industries adopting machining solutions that continues to drive sustained growth.
Market Trends:
Adoption of Hybrid Manufacturing Systems Combining Additive and Subtractive Processes:
A key trend in the machine tool market is the rise of hybrid systems that combine additive manufacturing with traditional subtractive processes. Companies are using these solutions to achieve greater design flexibility, cost efficiency, and speed of production. Hybrid machines allow manufacturers to build complex geometries and then finish them with high precision, improving both aesthetics and functionality. Aerospace and defense sectors adopt this trend to reduce lead times and material waste. Automotive manufacturers use hybrid approaches for lightweight prototyping and component optimization. Medical device companies benefit from customized implants and prosthetics produced more efficiently. The ability to integrate both techniques in one system enhances productivity and expands the application base. It is this combination of versatility and efficiency that makes hybrid machines a transformative trend.
- For instance, DMG Mori Seiki’s LASERTEC 30 SLM US powder bed machine features a high accuracy ball screw and a laser power of 1200 watts, allowing layer thicknesses of as fine as 30 micrometers for intricate part production.
Increasing Role of Automation, Robotics, and Human-Machine Collaboration:
Automation and robotics integration represent a major trend shaping the machine tool market. Collaborative robots are increasingly deployed in machining environments to assist in loading, unloading, and part handling. Manufacturers use automation to achieve consistency, reduce human errors, and maximize throughput. Human-machine collaboration models allow skilled operators to focus on high-value tasks while machines handle repetitive operations. The demand for flexible automation grows with shorter product life cycles and rising customization needs. Machine shops invest in robotic arms and automated guided vehicles to streamline workflows. Integration with CNC systems improves accuracy and reduces downtime. It is this fusion of human expertise with robotic precision that drives a transformative approach to manufacturing operations.
- For instance, DMG Mori Seiki’s AMR 1000 is an automated guided vehicle system supporting tool, material pallet, and chip trolley transport, facilitating unattended and autonomous production workflows.
Sustainability and Energy Efficiency as Core Focus in Production Environments:
The shift toward sustainability is emerging as a defining trend in the machine tool market. Companies are developing energy-efficient machines that reduce power consumption and improve lifecycle performance. Advanced cooling systems, regenerative drives, and optimized cutting processes support environmental goals. Manufacturers face pressure from regulations to adopt eco-friendly machining fluids and reduce carbon emissions. Demand for remanufactured and refurbished machines is growing as businesses aim to lower costs and promote circular economy practices. Machine tools that minimize material waste are favored in industries seeking compliance with global sustainability standards. Aerospace and automotive sectors are aligning production with greener objectives. It is this industry-wide focus on sustainable practices that reshapes machine tool investments.
Customization, Flexibility, and Shorter Product Development Cycles:
Customization and shorter production timelines are driving a major trend across the machine tool market. Manufacturers face increasing demand for tailor-made products in automotive, consumer electronics, and medical industries. Flexible machine tools capable of handling varied production runs are becoming more critical. Companies invest in quick-change tooling systems and modular machines to adapt faster to changing requirements. Rapid prototyping is supported by advanced CAD/CAM integration with CNC machines. Demand for just-in-time production models drives the need for more agile equipment. Small and medium-sized enterprises are particularly investing in cost-effective, flexible solutions. It is this move toward adaptable and responsive systems that highlights customization as a central trend in the sector.
Market Challenges Analysis:
High Initial Investment and Rising Maintenance Requirements:
One of the major challenges in the machine tool market is the high initial investment required for advanced machinery. CNC machines, multi-axis centers, and hybrid solutions demand substantial capital outlay, which limits adoption among smaller enterprises. The cost of integrating automation and digital technologies further raises the entry barrier. Rising maintenance expenses and the need for skilled technicians add to operational complexity. Manufacturers struggle to balance cost efficiency with the need for advanced capabilities. Long replacement cycles also slow down the pace of adoption, especially in emerging economies. Financial risks associated with fluctuating demand discourage some players from investing in large-scale modernization. It is this high cost and maintenance burden that continues to restrict the market in certain segments.
Skilled Workforce Shortages and Supply Chain Volatility:
Another challenge faced by the machine tool market is the shortage of skilled labor required for advanced machining operations. Operators need specialized training to handle CNC programming, multi-axis operations, and IoT-enabled systems. The talent gap leads to reduced productivity and increased reliance on automation. Supply chain disruptions, including raw material shortages and geopolitical uncertainties, further impact production schedules. Fluctuations in steel, aluminum, and other input costs affect profitability for manufacturers. Global trade tensions create uncertainties for cross-border machine tool shipments and component availability. Companies often struggle to maintain a steady balance between demand and supply in such conditions. It is this mix of labor shortages and supply chain volatility that poses a significant restraint for market stability.
Market Opportunities:
Expansion into Emerging Economies with Industrialization and Infrastructure Growth:
The machine tool market offers significant opportunities through expansion into emerging economies undergoing rapid industrialization. Countries in Asia, Latin America, and Africa are investing heavily in infrastructure, automotive, and manufacturing sectors. Demand for precision components and advanced equipment is rising as industries mature in these regions. Local governments provide incentives for establishing production facilities, which boosts investments in machinery. The growing middle class stimulates demand for consumer goods, further fueling production requirements. Machine tool manufacturers can benefit by setting up localized facilities and tapping into regional supply chains. It is this wave of industrial growth in developing nations that presents strong opportunities for expansion.
Growth Through Technological Innovations and Strategic Partnerships:
The machine tool market is also positioned to benefit from advancements in smart machining, hybrid manufacturing, and automation technologies. Companies introducing cost-effective yet advanced solutions gain an edge in highly competitive environments. Strategic partnerships between machine tool producers and technology providers help accelerate innovation. Collaborations with aerospace, automotive, and medical device companies create opportunities for tailored solutions. Digital service offerings such as predictive maintenance, software upgrades, and real-time analytics open new revenue streams. Companies entering niche markets like micromachining or additive-subtractive systems can secure long-term advantages. It is the focus on innovation and collaboration that underpins future opportunities for the market.
Market Segmentation Analysis:
By Tool Type
The machine tool market is segmented into metal cutting, metal forming, electrical discharge machines, and others. Metal cutting machines, including milling, lathes, drilling, and grinding, dominate due to widespread use in automotive and aerospace sectors where precision machining is critical. Metal forming machines, such as machining centers, presses, punching, and bending tools, support large-scale industrial and construction applications. Electrical discharge machines (EDM) hold importance in aerospace and electronics for intricate cutting and mold production. Other tools, including laser and polishing machines, are gaining adoption in precision engineering and advanced fabrication.
- For instance, The AMR 1000 automated guided vehicle for autonomous handling with a load capacity and integrated safety systems is verified by DMG MORI’s official demonstration and product release materials.
By Technology
The machine tool market is divided into computer numerical control (CNC) machines and conventional machines. CNC machines lead the segment with their superior accuracy, automation integration, and compatibility with smart manufacturing systems. They are widely adopted in developed markets where productivity and efficiency drive investments. Conventional machines, while declining in share, continue to serve cost-sensitive markets and small workshops due to their affordability and simpler operation requirements.
- For instance, The NTX 2500|1250 2nd Generation universal turning machine combining turn-mill spindles with in-process measuring to guarantee high precision is substantiated in official product catalogues and digital twin showroom from DMG MORI
By Application
The machine tool market serves multiple industries including automotive, aerospace, electrical, general machinery, precision engineering, and transport machinery, along with other applications such as construction, marine, and woodworking. Automotive dominates with rising EV production and complex component needs. Aerospace follows closely, demanding machining of high-strength metals and composites. The electrical industry depends on precision tools for microcomponents, while general machinery and precision engineering maintain stable demand. Transport machinery is expanding with infrastructure investments, and other applications highlight the market’s versatile utility.
Segmentation:
By Tool Type:
- Metal Cutting (Milling Machines, Lathes, Drilling Machines, Grinding Machines, etc.)
- Metal Forming (Machining Centers, Presses, Punching Machines, Bending Machines, etc.)
- Electrical Discharge Machines (EDM)
- Others (Laser Machines, Polishing Machines, etc.)
By Technology:
- Computer Numerical Control (CNC) Machines
- Conventional Machines
By Application:
- Automotive
- Aerospace
- Electrical Industry
- General Machinery
- Precision Engineering
- Transport Machinery
- Others (Construction, Marine, Woodworking)
By Region:
- North America
- Europe
- Germany
- France
- U.K.
- Italy
- Spain
- Rest of Europe
- Asia Pacific
- China
- Japan
- India
- South Korea
- South-east Asia
- Rest of Asia Pacific
- Latin America
- Brazil
- Argentina
- Rest of Latin America
- Middle East & Africa
- GCC Countries
- South Africa
- Rest of the Middle East and Africa
Regional Analysis:
Asia-Pacific: Leading with Strong Industrial and Manufacturing Base
The machine tool market is dominated by Asia-Pacific, holding around 40 percent share of the global industry. China leads with its massive industrial base and investments in automotive, aerospace, and electronics manufacturing. Japan and South Korea contribute significantly with advanced technologies and high-precision machining expertise. India is emerging rapidly, supported by government initiatives promoting industrialization and infrastructure growth. The region benefits from large-scale adoption of CNC machines and rising demand for EV components. It is the combination of industrial capacity and technology-driven expansion that establishes Asia-Pacific as the global leader.
Europe: Advanced Manufacturing and Strong Automotive and Aerospace Demand
Europe accounts for close to 30 percent share of the machine tool market, driven by its advanced manufacturing base. Germany and Italy lead the region with their precision engineering expertise and strong exports of machine tools. The aerospace industry in France and the UK creates additional demand for high-performance machining solutions. European manufacturers focus heavily on innovation, sustainability, and automation in machining operations. The region is also supported by regulatory standards that promote energy efficiency and sustainable production. It is this alignment of industrial expertise and policy direction that strengthens Europe’s position.
North America, Latin America, and Middle East & Africa: Growth Through Automation and Industrialization
North America represents about 20 percent share of the machine tool market, supported by automation adoption and reshoring of manufacturing in the United States. The region’s aerospace and defense sectors create significant demand for advanced machining systems. Latin America holds close to 5 percent share, driven by industrialization in Brazil and Mexico. The Middle East & Africa collectively account for around 5 percent share, with infrastructure and energy projects fueling adoption. Both emerging regions are increasingly investing in localized manufacturing and industrial equipment to reduce import reliance. It is this rising momentum in developing markets that expands global growth opportunities for the sector.
Shape Your Report to Specific Countries or Regions & Enjoy 30% Off!
Key Player Analysis:
- DMG Mori Seiki Co. Ltd.
- Okuma Corporation
- Haas Automation, Inc.
- Yamazaki Mazak Corporation
- Makino Milling Machine Co., Ltd.
- Amada Co., Ltd.
- FANUC Corporation
- Trumpf Group
- Hyundai WIA Corporation
- Doosan Corporation
Competitive Analysis:
The machine tool market is highly competitive with global players focusing on innovation, automation, and digital integration to strengthen their market positions. Leading companies such as DMG Mori, Yamazaki Mazak, Okuma, Haas Automation, and Trumpf invest heavily in R&D to develop advanced CNC machines and hybrid solutions. Firms emphasize partnerships and acquisitions to expand geographic presence and customer base. Regional players compete through cost-effective offerings and localized support services. It is driven by technological advancements, rising demand from automotive and aerospace industries, and strong regional manufacturing bases that shape competitive dynamics.
Recent Developments:
- In 2025, DMG Mori Seiki Co. Ltd. launched eight world premieres focused on Machining Transformation (MX) pillars, featuring new models such as the DMC 55 H Twin and the DMC 65 monoBLOCK 2. Generation, and the ULTRASONIC 60 Precision, which combines 5-axis milling with ultrasonic-assisted precision machining. The company also introduced the versatile NLX 2500|1250 2. Generation universal turning machine and the AMR 1000, a driverless transport system for autonomous handling in manufacturing
- FANUC Corporation partnered with Inbolt in 2025 to integrate AI-powered 3D vision technology with FANUC robots, significantly enhancing assembly line automation. This collaboration enables real-time adaptive trajectory correction to improve efficiency and precision in manufacturing environments, with General Motors as the first adopter.
- Trumpf Group sold its Additive Manufacturing business to the LEO III Fund managed by DUBAG Group in 2025 to focus on core areas like laser systems and CNC machining. The new entity plans to become a leading industrial metal 3D printing solutions provider, with continued manufacturing operations in Europe and the USA.
- Amada Co., Ltd. launched two new products in 2025: the ORSUS-3015AJe fiber laser cutting machine and the SRB-1003 press brake, targeted at overseas markets starting June 2025. These products feature designs optimized for cost performance and are part of Amada’s strategy to expand globally.
Market Concentration & Characteristics:
The machine tool market is moderately concentrated, with a mix of global leaders and regional players competing for market share. Large companies dominate through advanced product portfolios, strong brand presence, and global distribution networks. Smaller firms focus on niche applications and cost-effective solutions to maintain relevance. The market is characterized by high technological intensity, frequent product innovation, and integration of smart manufacturing systems. It is influenced by cyclical demand from end-use industries and investment trends in automation and digitalization.
Report Coverage:
The research report offers an in-depth analysis based on tool type, technology, application, and region. It details leading market players, providing an overview of their business, product offerings, investments, revenue streams, and key applications. Additionally, the report includes insights into the competitive environment, SWOT analysis, current market trends, as well as the primary drivers and constraints. Furthermore, it discusses various factors that have driven market expansion in recent years. The report also explores market dynamics, regulatory scenarios, and technological advancements that are shaping the industry. It assesses the impact of external factors and global economic changes on market growth. Lastly, it provides strategic recommendations for new entrants and established companies to navigate the complexities of the market.
Future Outlook:
- Growth in demand for advanced CNC machines with digital integration.
- Rising adoption of hybrid manufacturing combining additive and subtractive processes.
- Strong expansion in Asia-Pacific due to industrialization and EV demand.
- Increased focus on sustainable and energy-efficient machine tools.
- Wider use of predictive maintenance and IoT-enabled systems.
- Growing application in aerospace for high-performance material machining.
- Expansion of automation and robotics in production lines.
- Emerging opportunities in medical devices and renewable energy industries.
- Strategic collaborations between machine tool makers and tech providers.
- Continued regional investment in reshoring and localized manufacturing.


