
Pouch and can lines drive machinery spending across Asia
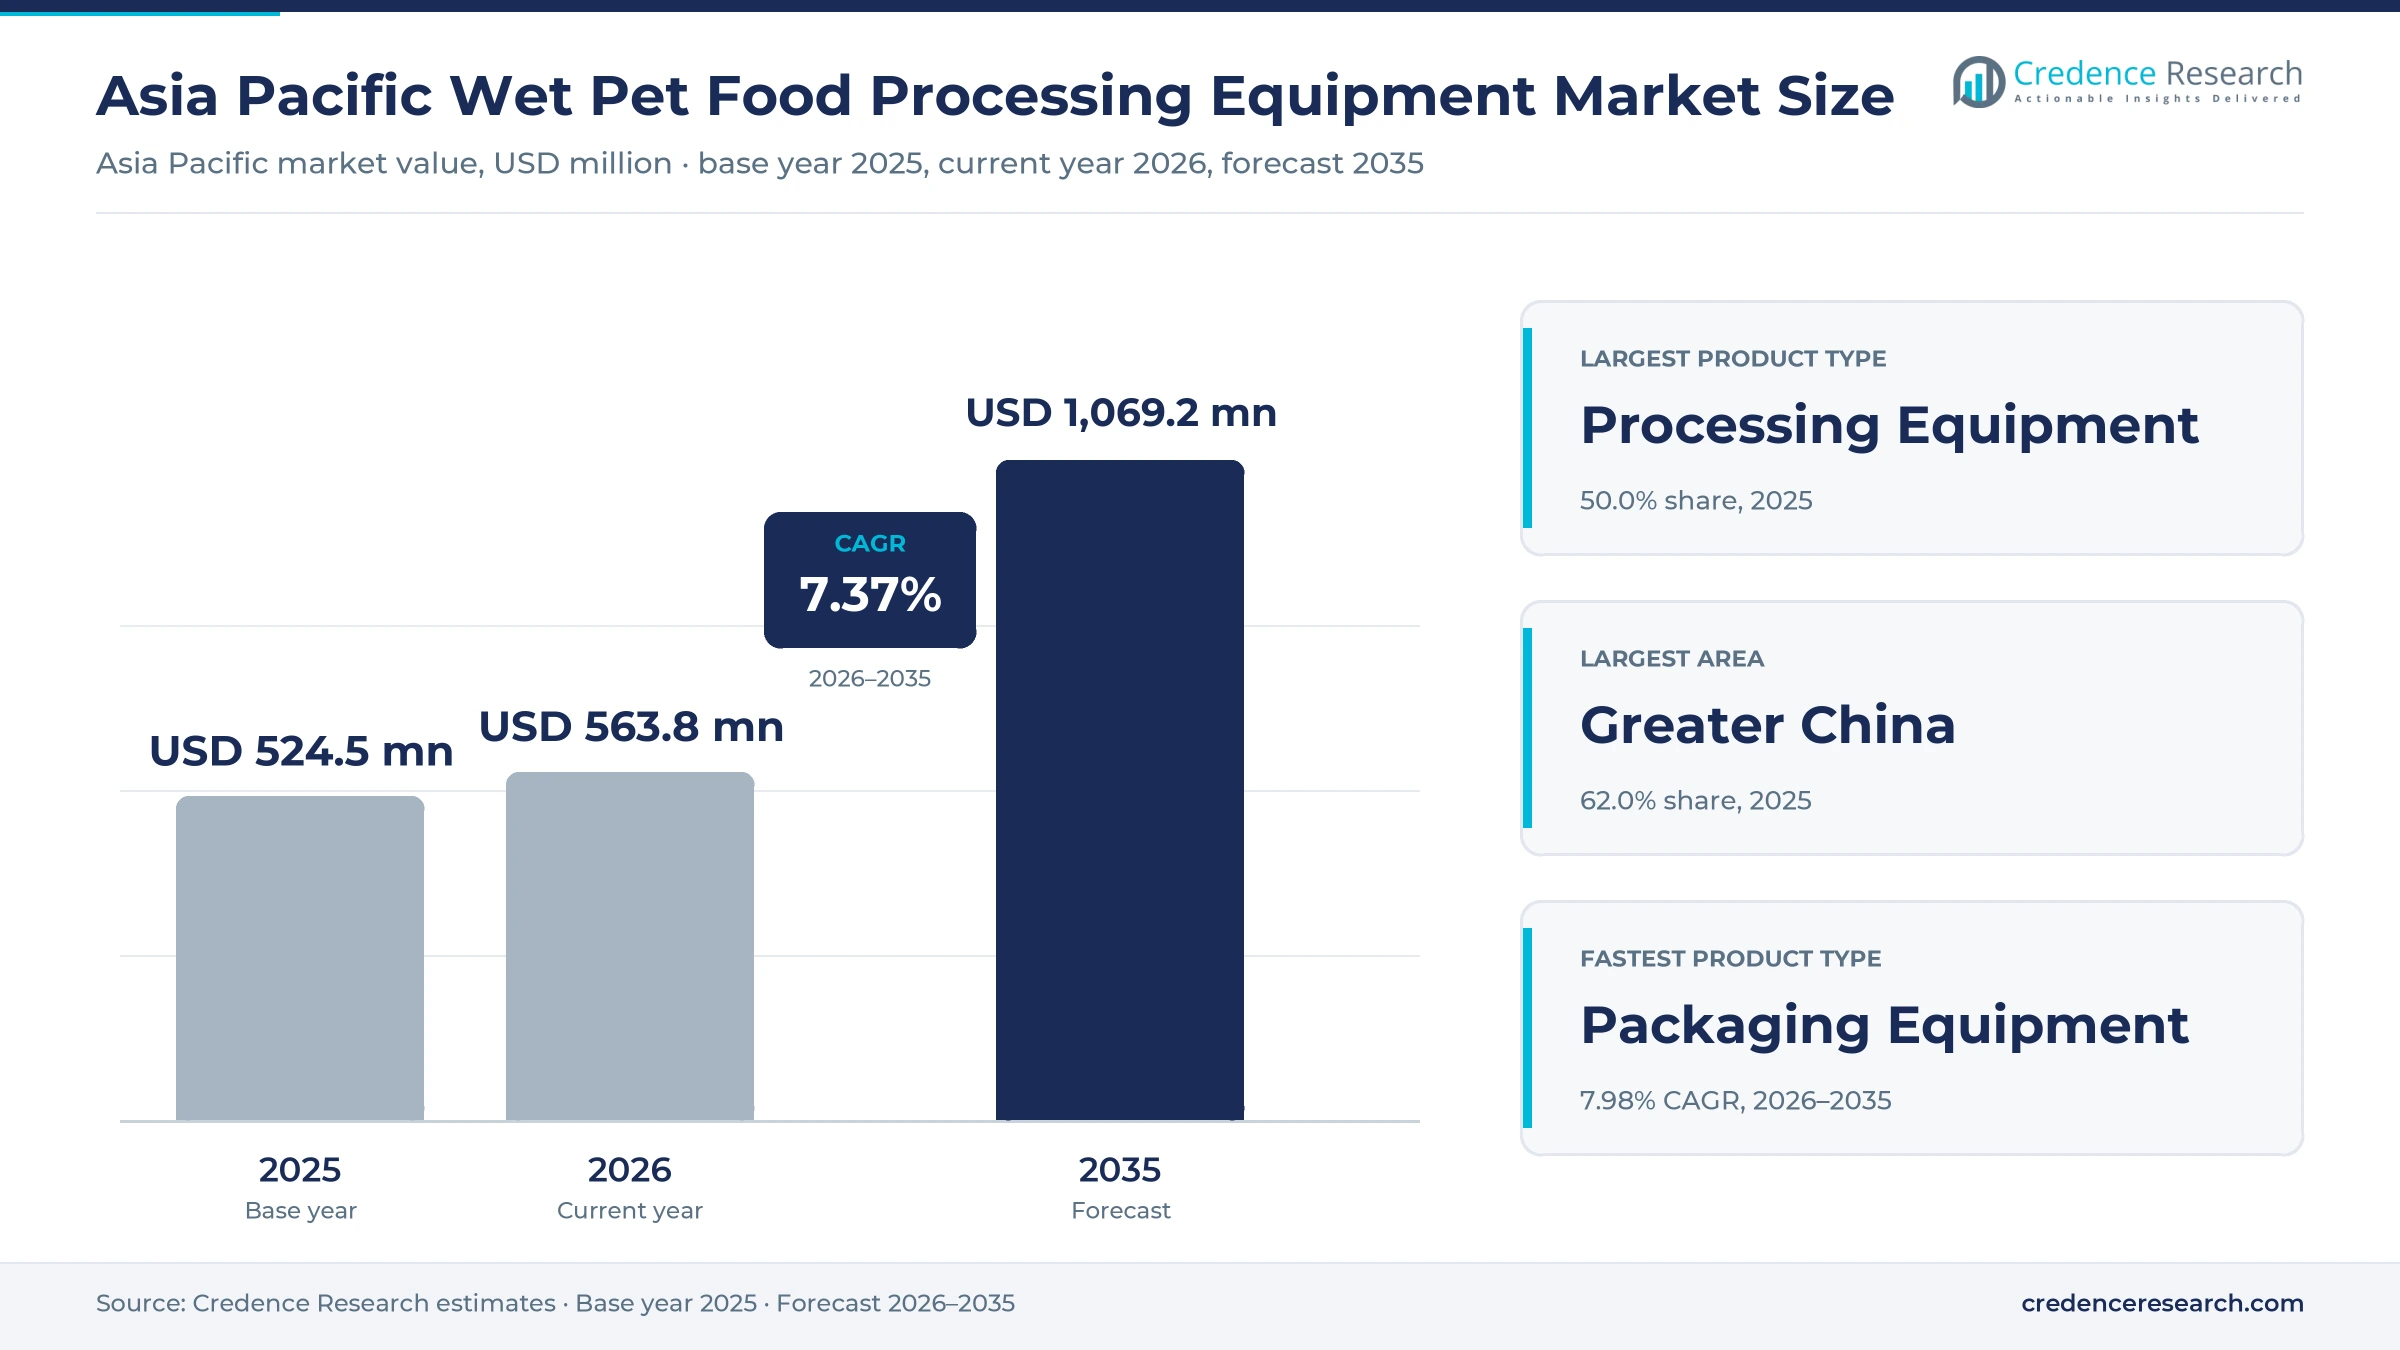
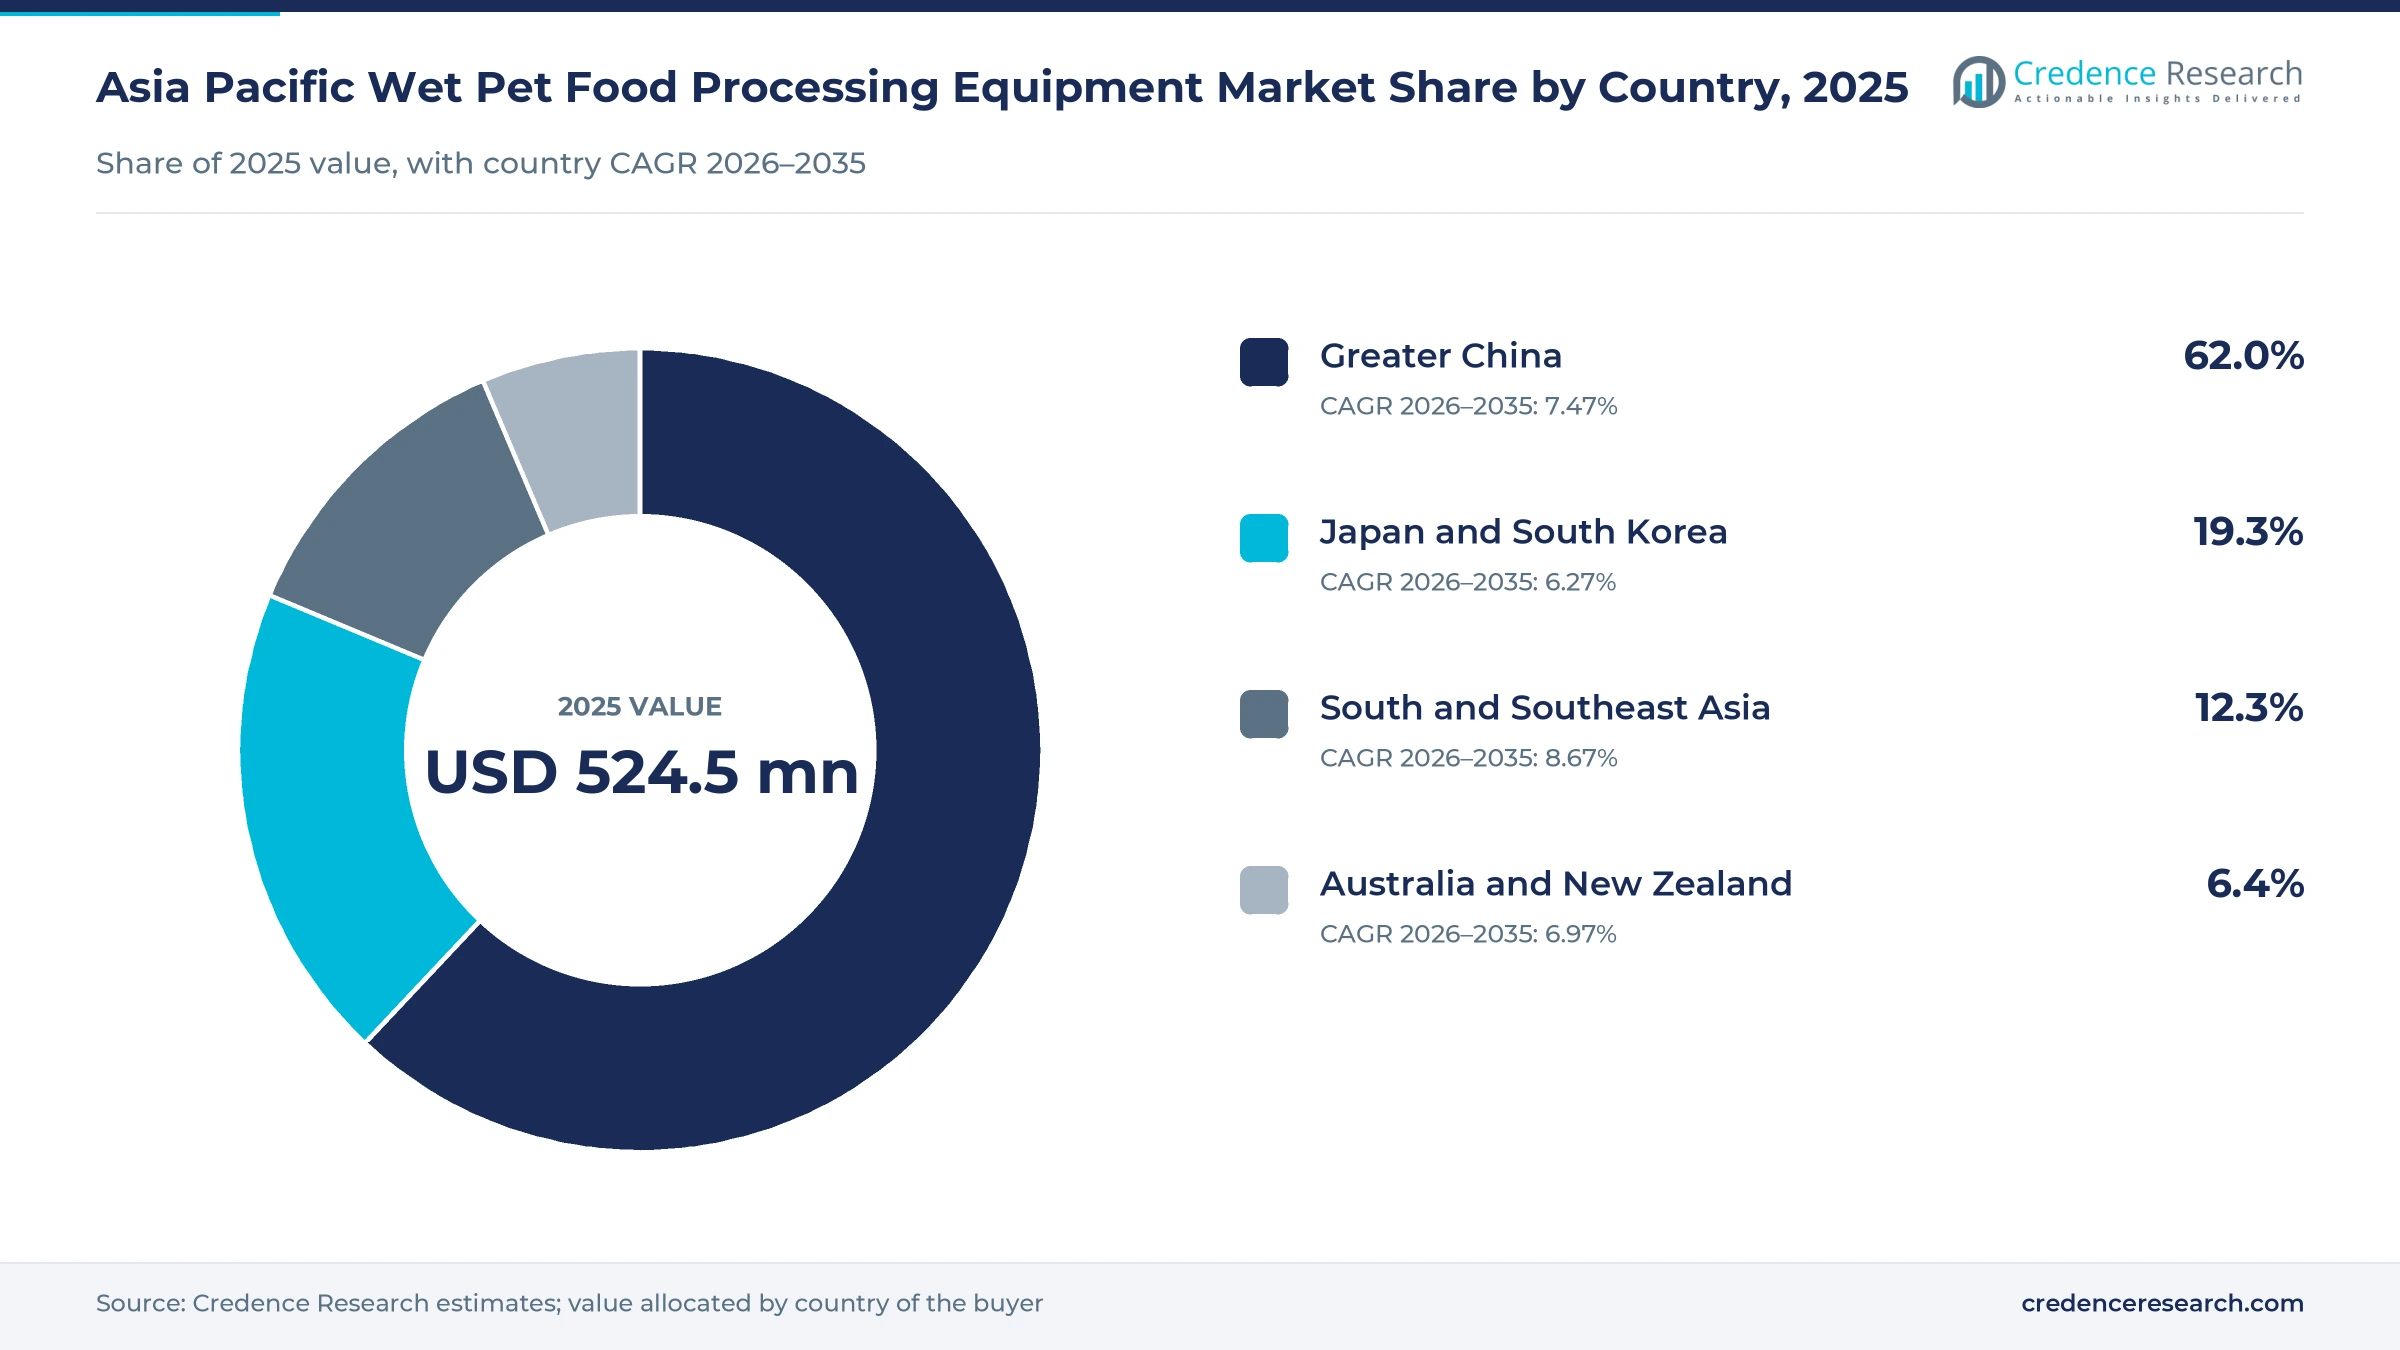
The Asia Pacific wet pet food processing equipment market was valued at USD 524.5 million in 2025 and is projected to increase from USD 563.8 million in 2026 to USD 1.07 billion by 2035, registering a CAGR of 7.37% during 2026–2035. Demand comes from pet food makers adding retort, filling and pouch capacity as cat ownership and exports grow across the region. Greater China held the largest share, 62.0% in 2025, as Chinese pet food output reached 1.9 million metric tons that year, according to the China Feed Industry Association. South and Southeast Asia is the fastest-growing area at 8.67% a year, helped by Thailand's position as the second-largest pet food exporter in the world. Mars opened a pouch facility in Wodonga, Australia, in June 2026, and Nestlé plans two more lines in Rayong, Thailand, by 2028, which shows how multinational brands are placing wet capacity closer to regional buyers.
What does wet pet food processing equipment cover in Asia Pacific?
The market counts machinery sold to plants that make canned, pouched and tray-packed food for cats and dogs across Greater China, Japan, South Korea, Australia, New Zealand and South and Southeast Asia. Buyers purchase grinders, mixers, emulsifiers, fillers, seamers, retorts, form-fill-seal machines and cleaning systems, either as single machines or as complete lines. Most large orders follow a plant project and include commissioning, spare parts and operator training.
Extruders and dryers bought for kibble lines sit outside the count, as do packaging materials, ingredients and the finished food itself. The value chain runs from machine builders and component makers through distributors and system integrators to integrated brands, contract manufacturers and independent specialty producers. Service and retrofit work matters as well, because retorts and filling stations are kept running for many years.
Asia Pacific Wet Pet Food Processing Equipment Market Insights
- The market grows from USD 524.5 million in 2025 to USD 1.07 billion by 2035, a 7.37% CAGR over 2026–2035, as producers add wet capacity across the region.
- Greater China held 62.0% of 2025 value, and China produced 1.9 million metric tons of pet food in 2025 according to its feed industry association.
- Processing Equipment led with 50.0% of 2025 value because every new wet line needs preparation, cooking and filling stations before packing.
- Mars opened its AU$112.6 million Wodonga pouch facility in June 2026, and nine in ten Mars pet care products sold in Australia and New Zealand are slated for local production.
- Nestlé committed more than CHF 157 million to Rayong, Thailand, in September 2026, adding two lines that take the wet pet food site to five by 2028.
Processing lines lead while pouch packaging grows fastest
Why do processing lines take the largest equipment budget?
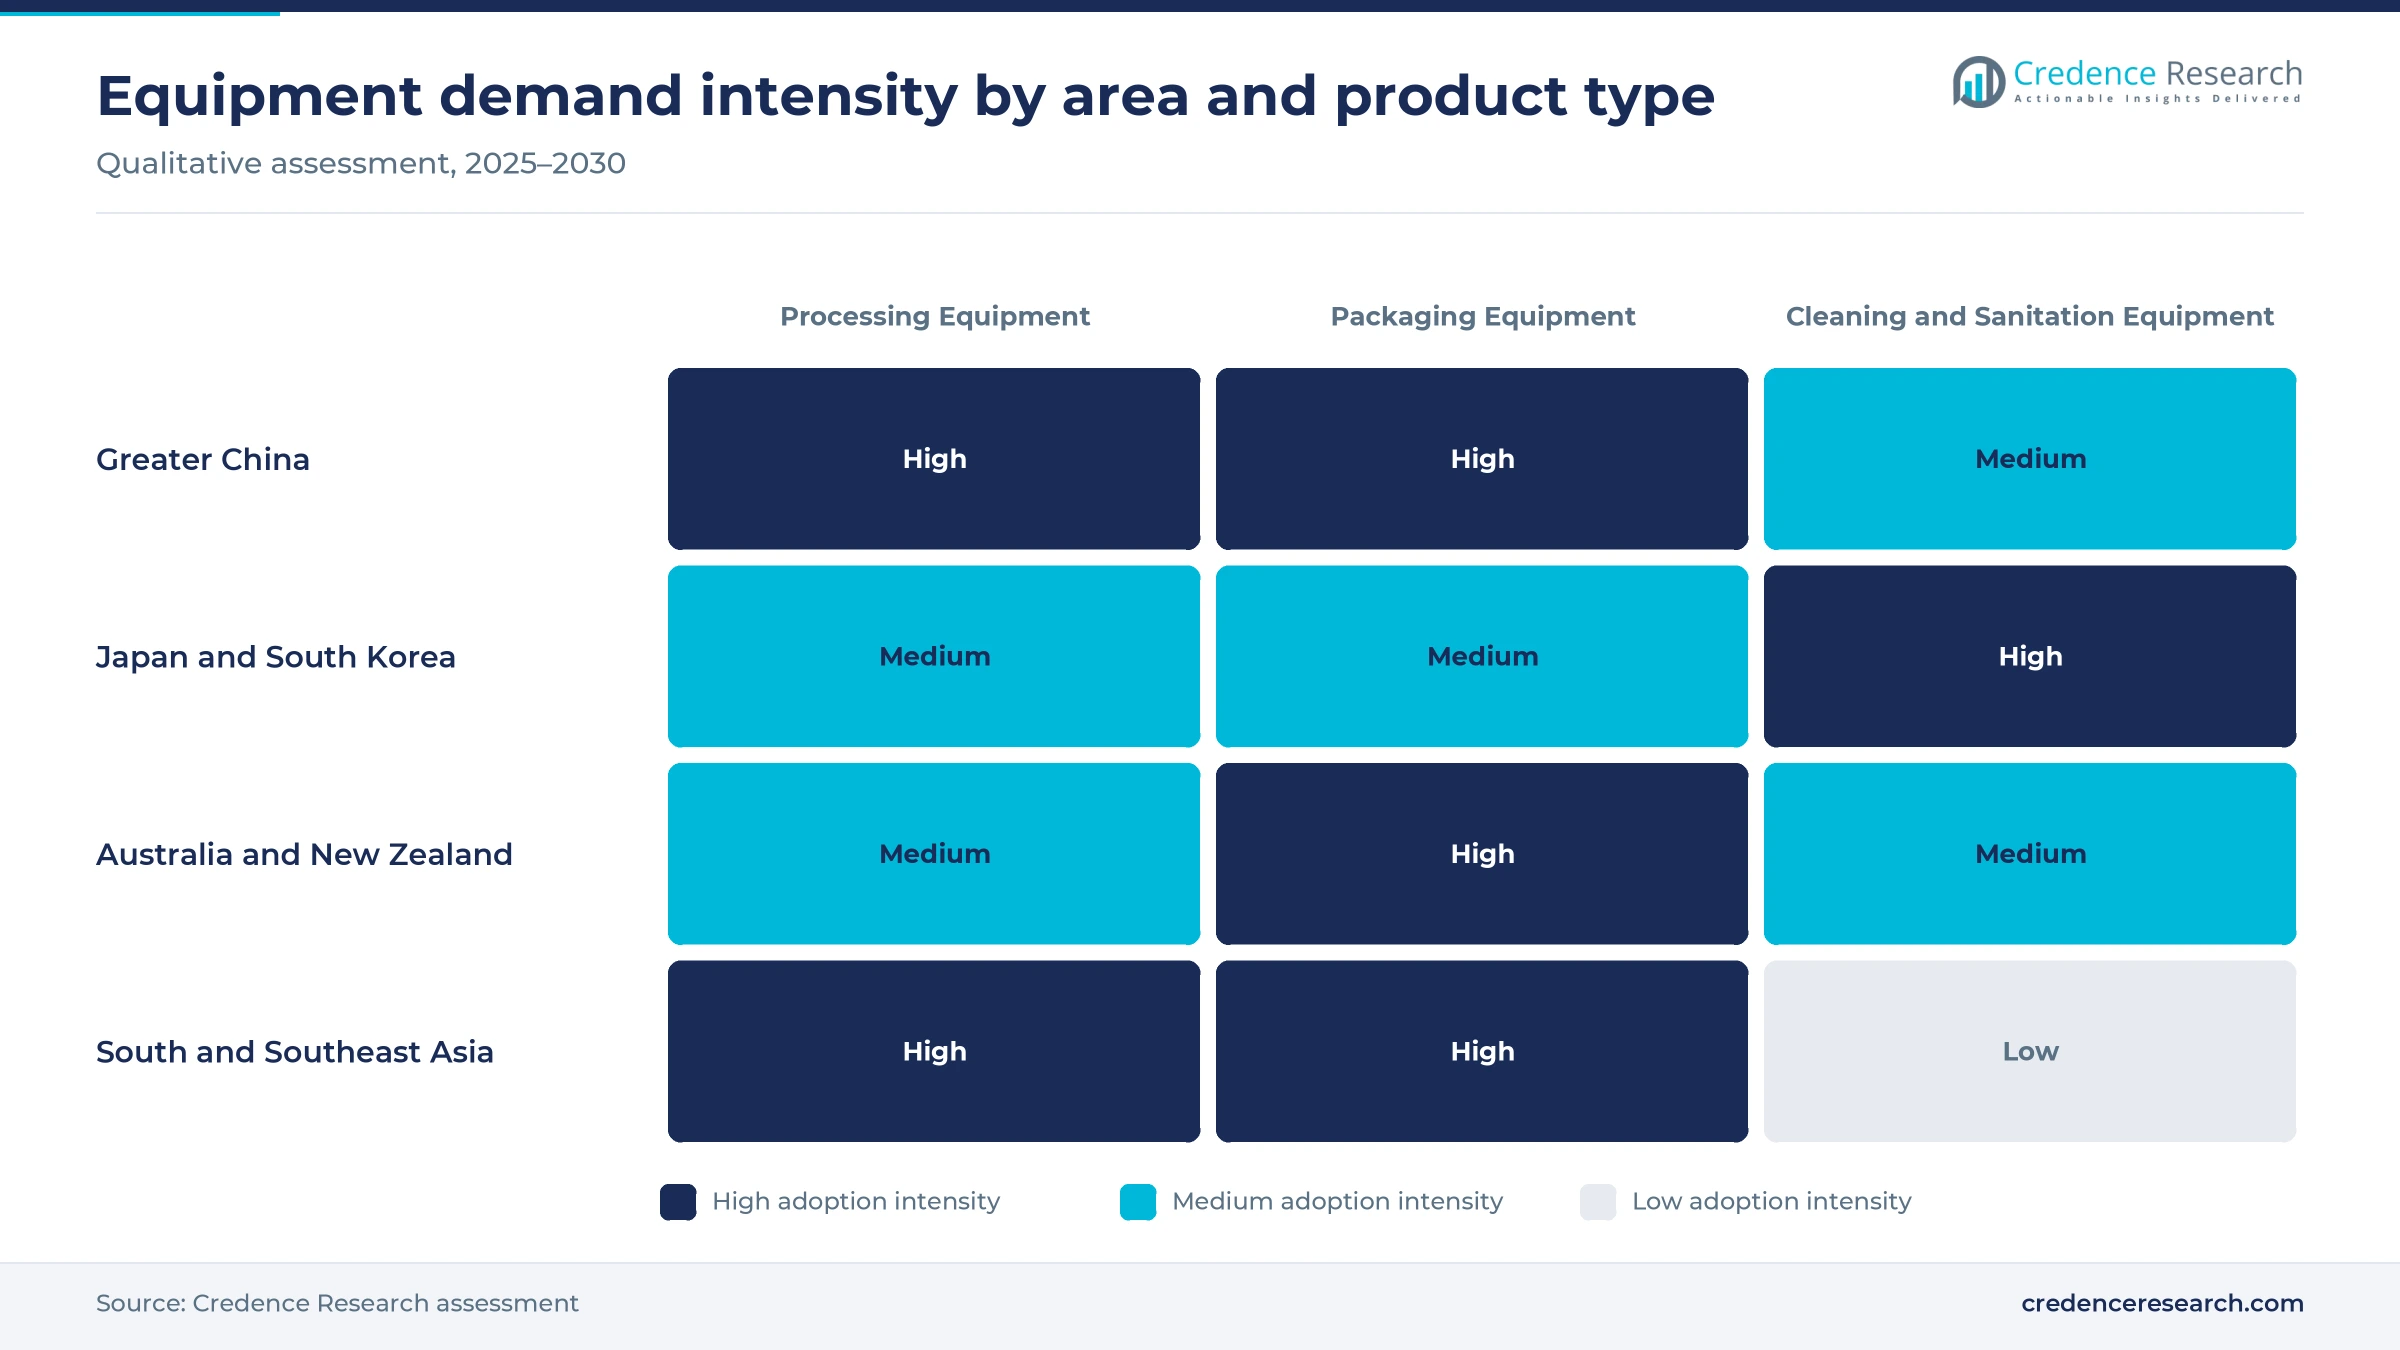
Based on product type, the market is categorized into processing equipment, packaging equipment and cleaning and sanitation equipment. Processing Equipment led with 50.0% of 2025 value because preparation, cooking and sterilizing stations carry most of the cost of a new wet line, and BEWITAL had its Weihai, China, equipment installed during 2025 ahead of opening in 2026, according to PET worldwide. Packaging Equipment is the fastest sub-segment at 7.98% a year as pouch volumes scale, with Mars sizing its Wodonga plant for 290 million wet cat food pouches annually.
How do cat formats shape line design more than dog formats?
Based on application, the market is categorized into cat wet food, dog wet food and multi-species wet food. Cat Wet Food led with 58.0% of 2025 value because cats outnumber dogs in key buying markets, with 8.85 million cats against 6.82 million dogs in the 2025 census of the Japan Pet Food Association. Cat Wet Food is also the fastest sub-segment at 7.80% a year as cat nutrition grew 10.7% in China in 2024 against 4.6% for dog nutrition, according to the USDA Shanghai office, which keeps new pouch orders focused on feline recipes.
Why are contract manufacturers gaining on integrated brands?
Based on customer type, the market is categorized into integrated brand manufacturers, contract manufacturers and independent specialty manufacturers. Integrated Brand Manufacturers led with 52.0% of 2025 value because multinationals fund the largest projects, including the more than AU$450 million that Mars has invested across Australian operations since 2020. Contract Manufacturers is the fastest sub-segment at 8.18% a year as outsourcing deepens, since about 80% of Thai pet food exports were private-label products in the New Zealand Embassy in Tokyo assessment of 2023, and i-Tail reports double-digit private-label growth.
Which project types bring the most equipment orders?
Based on project type, the market is categorized into greenfield capacity, replacement investment and brownfield expansion. Greenfield Capacity led with 44.0% of 2025 value because China added new sites as output rose 17.9% in 2025, and BEWITAL built its first plant outside Germany in Weihai. Brownfield Expansion is the fastest sub-segment at 7.98% a year as owners extend proven sites, as Nestlé is doing with two additional lines at Rayong and Mars did at Wodonga, where it has operated since 1967, reducing permitting and utility work for each new line.
| Segment Group | Leading Sub-segment | Share, 2025 | Fastest-growing Sub-segment | CAGR, 2026–2035 |
|---|---|---|---|---|
| By Product Type | Processing Equipment | 50.0% | Packaging Equipment | 7.98% |
| By Application | Cat Wet Food | 58.0% | Cat Wet Food | 7.80% |
| By Customer Type | Integrated Brand Manufacturers | 52.0% | Contract Manufacturers | 8.18% |
| By Project Type | Greenfield Capacity | 44.0% | Brownfield Expansion | 7.98% |
Request a Free Sample
Fill in your details and we'll send you a free sample report.
- Sample data tables & charts
- Research methodology
Plant builds and export demand lift machinery orders
Wet-format manufacturing expansion adds new line orders
New wet capacity is the largest single source of machinery orders, because each plant needs a complete chain from meat preparation to sterilization. China produced 1.9 million metric tons of pet food in 2025, up 17.9% from a year earlier, according to the China Feed Industry Association, compared with 1.6 million tons in 2024. Nestlé said in September 2026 that it would invest more than CHF 157 million in Rayong, Thailand, adding two lines to the three already making wet food in pouches and cans. BEWITAL opened its first plant outside Germany in Weihai, a wet food site serving China only. As a result, Greater China remains the largest source of orders in the region.
Package diversification and smaller runs reshape filling
Producers are splitting volume across more pack sizes and recipes, which raises demand for fast changeovers and flexible fillers. Wet pouches are the fastest-growing pet food packaging format in Australia, according to Mars, whose Wodonga facility will make 290 million pouches a year. i-Tail is expanding to 40 million sachets per month in 2026 to serve lickable formats, according to GlobalPETS, while Asian Alliance International introduced 34 new cat food products and 18 new dog food products in its 2024 portfolio. Drools chose 150 g and 350 g packs for its April 2026 launch in India. In turn, buyers of flexible packaging machinery weigh changeover time alongside speed, which supports the faster growth of Packaging Equipment across the region.
Replacement-cycle modernization targets energy and labor
Older plants are being upgraded because energy, wage and hygiene costs now justify earlier replacement of retorts and manual stations. Mars has invested more than AU$450 million across Australian operations since 2020 to modernize facilities, and it announced a further AU$200 million through 2027. Its Wodonga site hosts a AU$39.3 million concentrated solar thermal system funded jointly with the Australian Renewable Energy Agency, and energy projects there have already cut gas consumption by 20%. Thailand set a THB 400 daily minimum wage for Bangkok and certain sectors in 2025, according to Forvis Mazars, which improves the payback on automated loading and casing. These upgrades keep Replacement Investment moving even when new-site approvals slow.
Thai export growth sustains regional retort investment
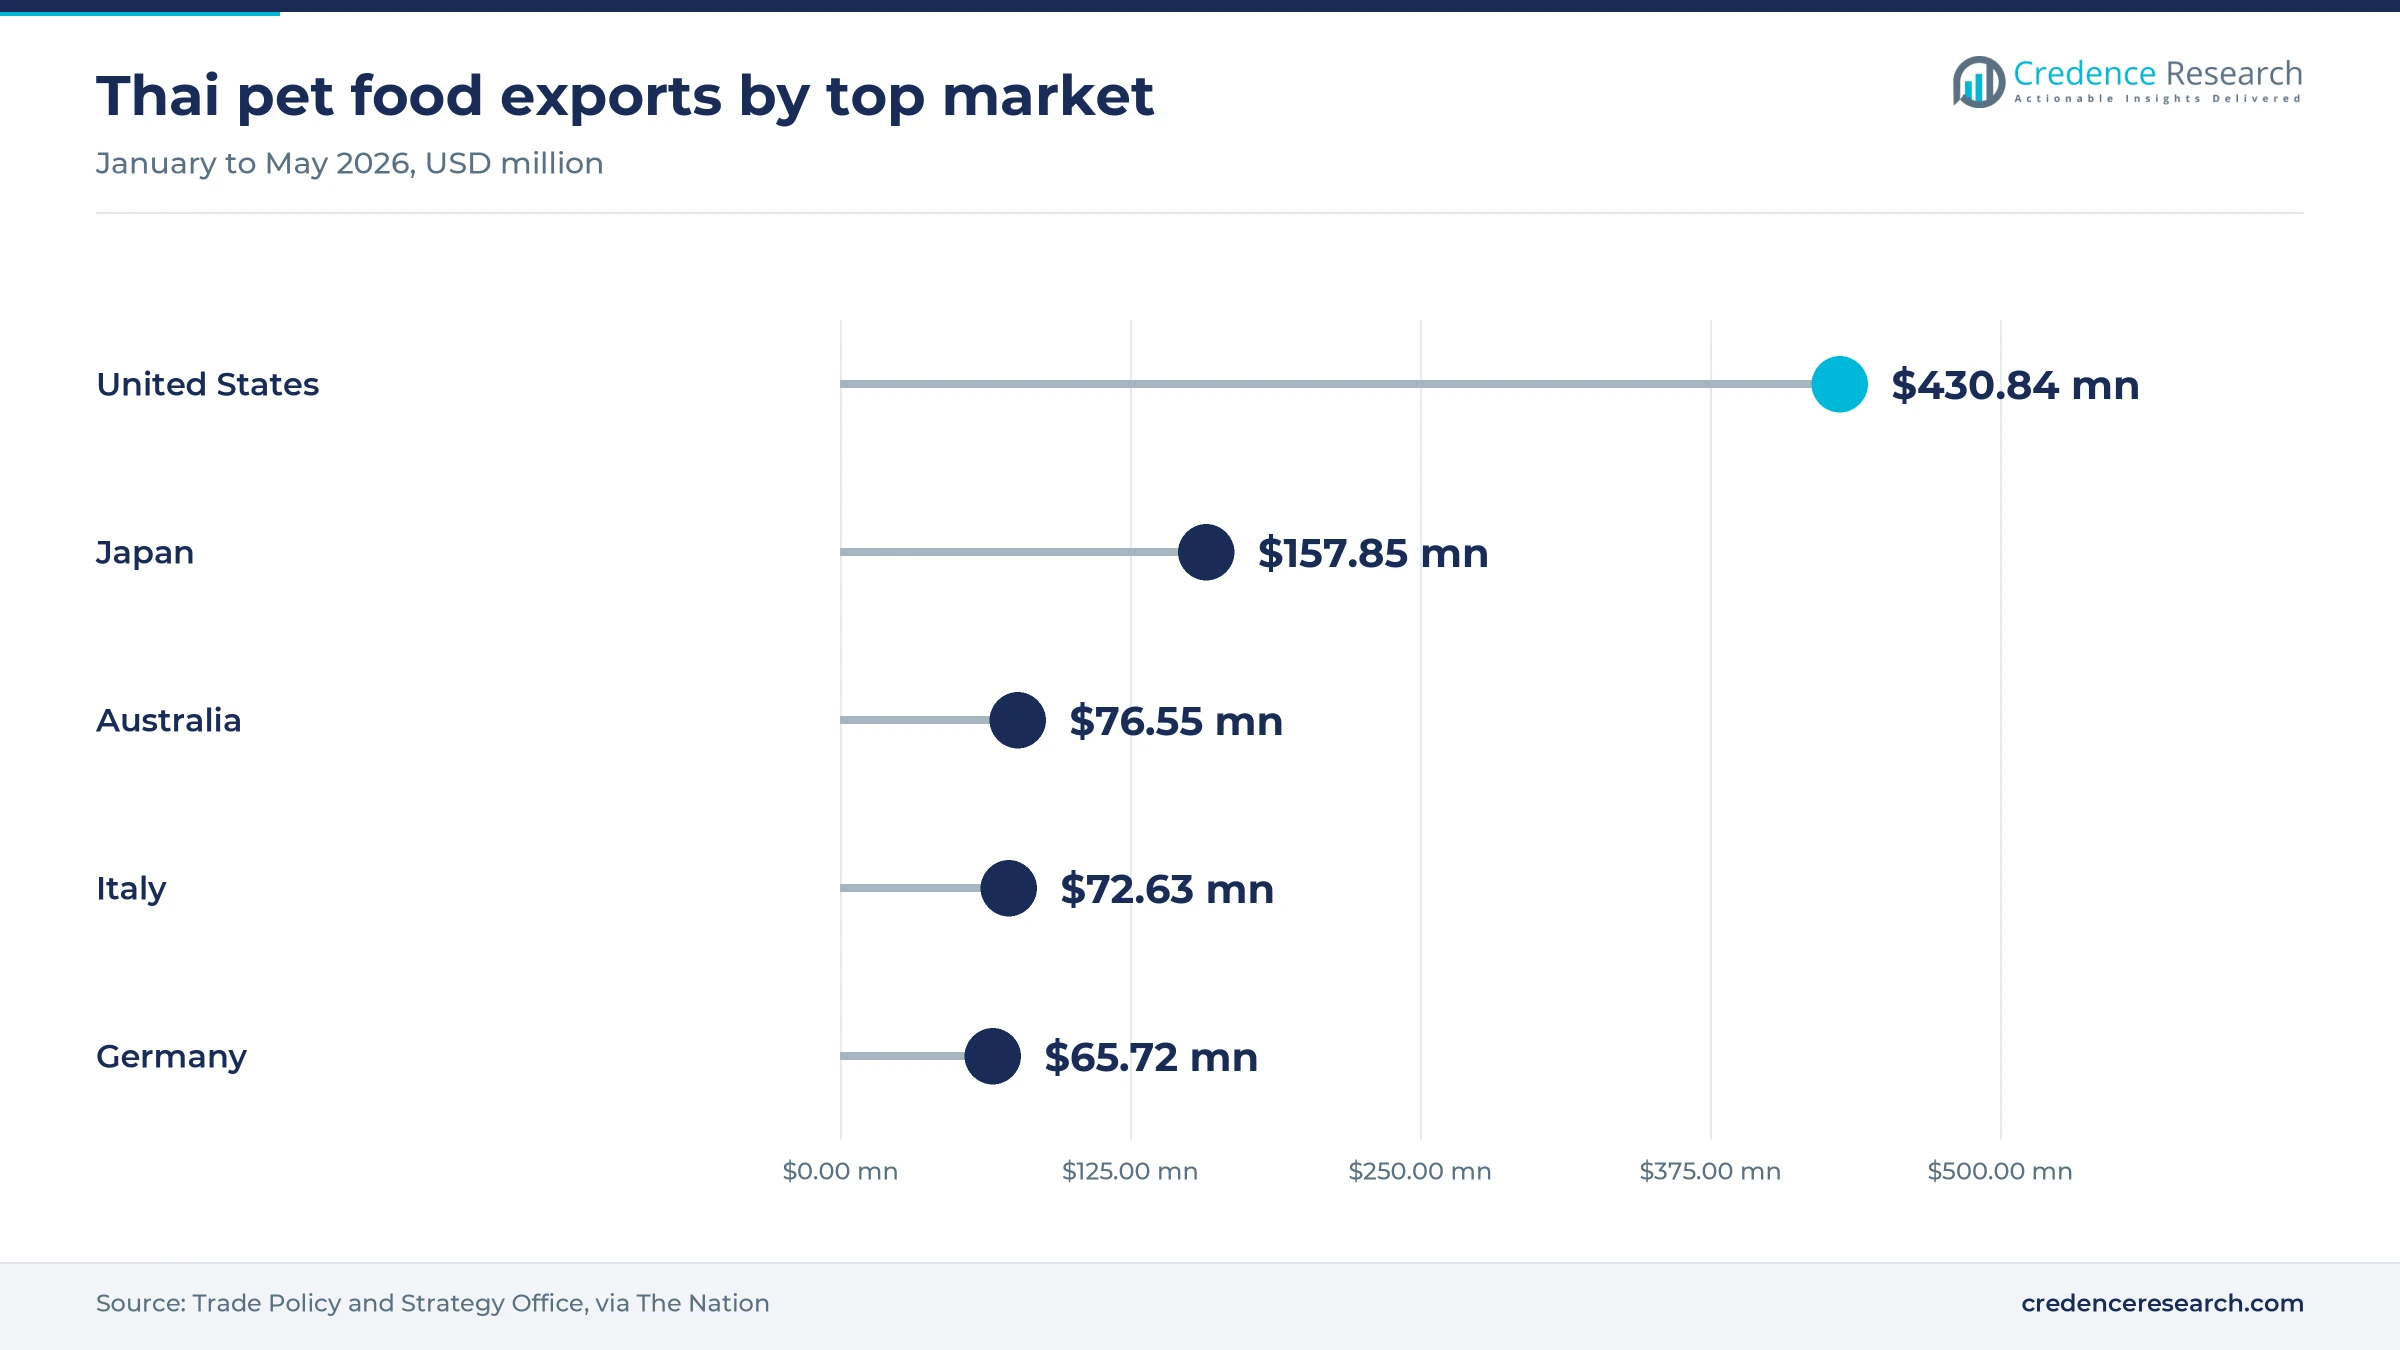
Export contracts give Southeast Asian plants a reason to add capacity ahead of domestic demand, because foreign buyers require volume and certified lines. Thailand exported $3.28 billion of pet food in 2025, up 8.15% from 2024, and it held a 10.2% global share behind Germany, according to the Trade Policy and Strategy Office. From January to May 2026, shipments to Japan rose 12.14% and shipments to Australia rose 25.71%. The Thailand Board of Investment approved about 4.5 billion baht for Nestlé pet food manufacturing in 2026, with more than 90% of output from its two approved projects destined for export. This export pull keeps South and Southeast Asia ahead of the other areas on growth through 2035.
Local production and shelf-stable formats open new demand
Shift toward locally produced wet food in China
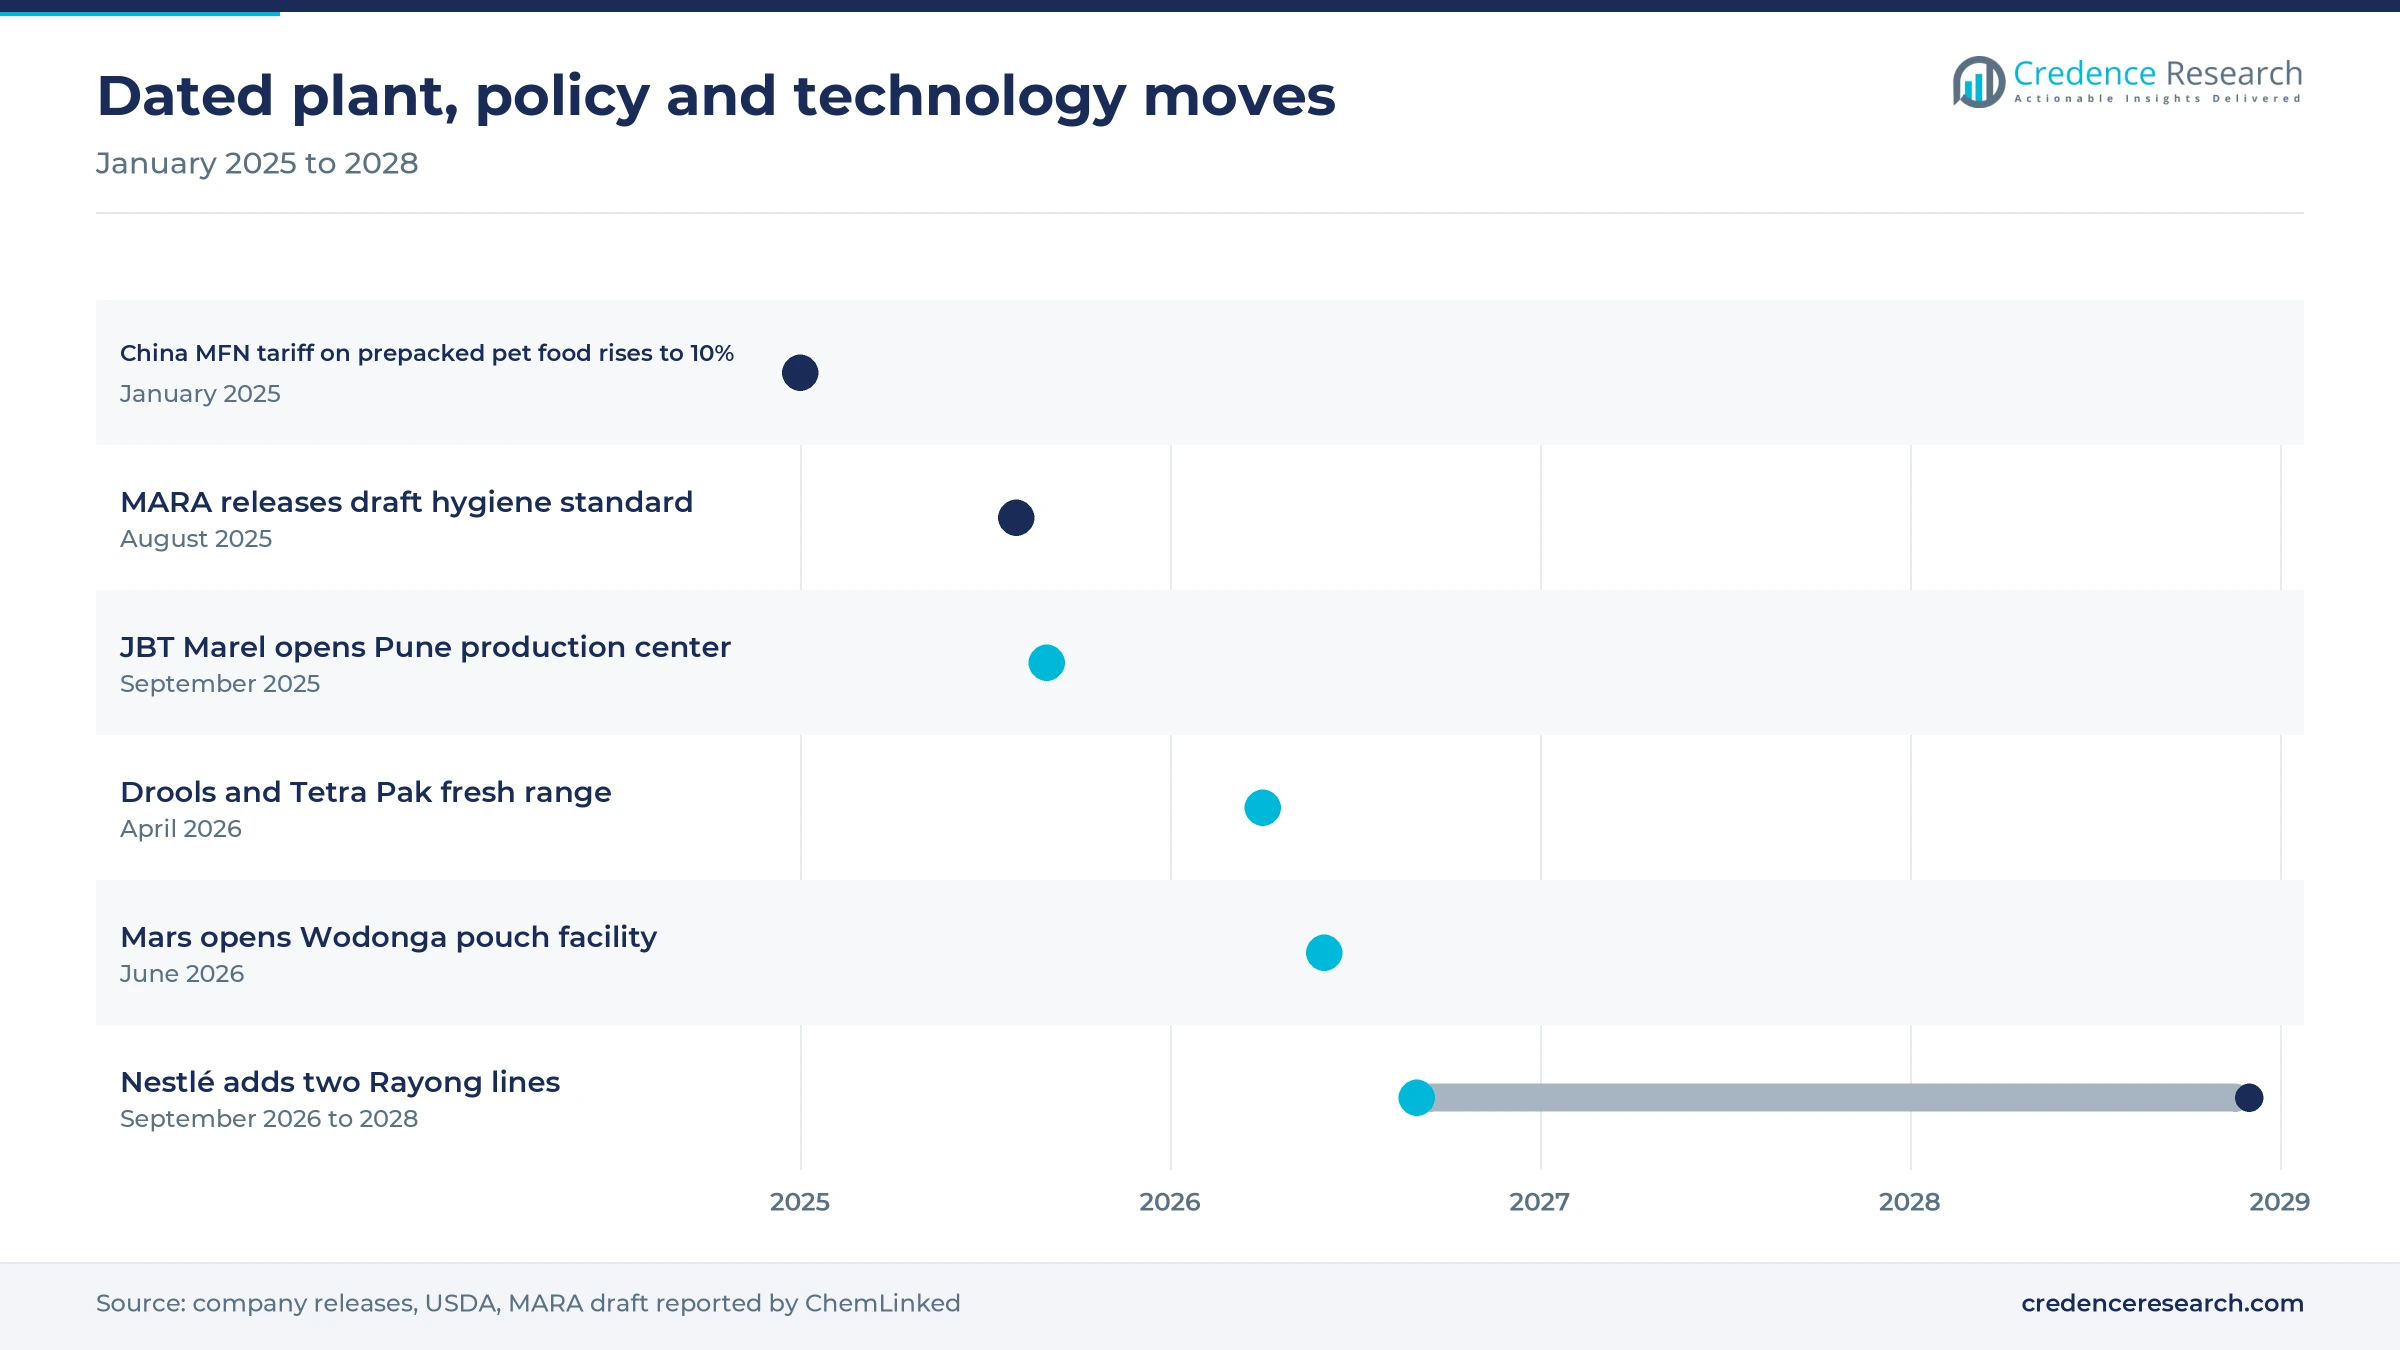
Brands selling in China are moving production onshore, which redirects equipment orders from export plants toward Chinese sites. China raised its most-favored-nation tariff on prepackaged pet food from 4% to 10% from Jan. 1, 2025, and total pet food imports fell 11.4% to $499.8 million in 2024, according to the USDA and China customs. U.S. shipments still reached a record $296.6 million in 2024, yet General Mills said Blue Buffalo had wound down China operations by April 9, 2026. Animonda Carny reported a 30% fall in China sales of a German-made chicken cat food in 2025. BEWITAL, whose partners decided on the plant in 2023, now makes wet food in Weihai with its distributor, Megapet, for the Chinese market only.
Emerging shelf-stable formats change sterilization specifications
Fresher, shelf-stable recipes are pushing buyers toward gentler thermal and aseptic systems, which changes the mix of retort and filling equipment. Drools invested ₹180 crore with Tetra Pak in April 2026 to launch a fresh range using retort and aseptic packaging that needs no refrigeration before opening. JBT Marel formed an exclusive cooperation with Aurum Process Technology on May 11, 2026, adding aseptic filling in flexible packaging for premium wet pet food. JBT Marel also showed its Minimally Processed Pet Food line at Interzoo in Nuremberg in May 2026. These moves favor suppliers able to offer the full thermal chain, and they support spending within Processing Equipment at 50.0% of 2025 value.
Opportunity in South Asian line supply and local service
South Asia offers an opening for suppliers that build or support machinery close to customers, because plants there remain small and lead times matter. JBT Marel opened a global production center in Pune in September 2025 as an export base for the Asia region, according to Built In. MULTIVAC inaugurated a production site in Ghiloth, India, in 2023 and later added a capability center in Hyderabad, according to Packaging South Asia. Drools' ₹180 crore fresh range with Tetra Pak, announced April 4, 2026, in 150 g and 350 g packs, shows that Indian companion-animal nutrition projects now budget for retort and aseptic packaging. As a result, South and Southeast Asia offers room for first-time buyers of automated lines.
Opportunity in private-label capacity for contract producers
Contract producers offer an opening for mid-sized lines, because private-label customers want many recipes in modest volumes rather than one long run. The New Zealand Embassy in Tokyo estimated in 2023 that about 80% of Thai pet food exports carried private labels and that Thailand held 40% of Japan's pet food imports in 2022. i-Tail told GlobalPETS in July 2026 that private-label demand was delivering double-digit growth in the U.S. and Europe. Asian Alliance International reported pet food volumes up 49.1% to 9,419 tons in a 2024 quarter and planned facility expansion for 2025. These buyers suit modular equipment, which supports Contract Manufacturers at 8.18% a year through 2035.
Capital cost, tariffs and hygiene rules slow decisions
High capital cost per unit of pouch capacity
Full wet lines demand large budgets that smaller producers struggle to fund. Mars spent AU$112.6 million on Wodonga for 290 million pouches a year, or about AU$0.39 for each pouch of annual capacity. Independent specialty producers cannot match that outlay, so many postpone automation or remain with operator-assisted stations. Phased installation, used equipment and contract filling reduce the burden, although each option limits throughput and margin in the early years.
U.S. tariffs add risk for Thai export lines
Tariffs make export-focused line investments harder to approve in Thailand. A 19% U.S. reciprocal rate has applied to Thai goods since Aug. 1, 2025, according to GlobalPETS, and the U.S. took $430.84 million, or 30.22%, of Thai pet food exports from January to May 2026. Plant owners exposed to American retail buyers therefore face uncertain margins on new retort capacity. Shipments to Germany rose 32.25% in the same months, yet other markets remain far smaller than the American one, so they cannot quickly replace that volume.
China hygiene draft raises compliance uncertainty
Pending rules complicate equipment choices for Chinese producers, who cannot yet fix final specifications. China's Ministry of Agriculture and Rural Affairs released a draft mandatory hygiene standard on Aug. 11, 2025, with a 24-month transition after publication, according to ChemLinked. Its nitrite limit is 100 mg/kg for feed with at least 20% moisture and 15 mg/kg below that level. Producers making both formats must validate testing and cleaning routines, which adds cost, although early adopters of validated sanitation systems can reduce the risk of later rework.
Long project timelines make supplier orders lumpy
Multi-year schedules delay revenue recognition for machine builders and tie up buyer capital. BEWITAL and its partners decided to build the Weihai wet plant in 2023, installed equipment during 2025 and opened in 2026, according to PET worldwide. Nestlé announced its Rayong lines in September 2026 for operation in 2028. Suppliers therefore carry long engineering and delivery cycles, while buyers risk demand shifts before start-up. Framework agreements, staged commissioning and local spare-parts stocks help both sides manage the gap, though they rarely remove it.
Greater China leads as South and Southeast Asia gains pace
| Region | Value, 2025 (USD million) | Share, 2025 | CAGR, 2026–2035 |
|---|---|---|---|
| Greater China | 325.2 | 62.0% | 7.47% |
| Japan and South Korea | 101.2 | 19.3% | 6.27% |
| South and Southeast Asia | 64.5 | 12.3% | 8.67% |
| Australia and New Zealand | 33.6 | 6.4% | 6.97% |
Greater China holds the largest installed line base
Greater China held 62.0% of 2025 value and grows at 7.47% a year, the largest pool of orders in the region. Domestic output rose 9.3% in 2024 to 1.6 million tons, with Shandong and Hebei producing more than 70% of it, according to the USDA, while Tianjin grew 58.5% and Henan grew 119%. Those clusters are where machine builders concentrate sales and service teams. BEWITAL added a foreign-backed wet plant in Weihai, Shandong, in 2026.
Japan and South Korea buy for precision and hygiene
Japan and South Korea held 19.3% of 2025 value and grow at 6.27% a year, with demand tied to replacement and premium recipes. The Japanese cat and dog nutrition sector counted 15.67 million pets in the 2025 census, and Thailand supplied 40% of its imports in 2022. MULTIVAC invested €20 million in a Tsukuba building in 2021 to support local service.
Australia and New Zealand localize premium pouch supply
Australia and New Zealand held 6.4% of 2025 value and grow at 6.97% a year, from a small number of large sites. Nine in ten Mars pet care products sold across both countries are slated for local production, serving Australian companion-animal nutrition demand from 5.3 million cats. Thai shipments still rose 25.71% to Australia and 36.69% to New Zealand from January to May 2026, so imports remain a competitive check on further local lines.
South and Southeast Asia is the fastest-growing area
South and Southeast Asia held 12.3% of 2025 value and grows at 8.67% a year, the fastest pace in the region. Thailand drives most spending through exports, with Nestlé taking Rayong to five lines by 2028 and i-Tail expanding sachet output. India adds a second pole, with Drools investing ₹180 crore in retort and aseptic systems and JBT Marel producing machinery in Pune. Thai pet food exports reached 639,541 tons from January to July 2025, according to the Thai Pet Food Trade Association.
Dated plant and technology moves from 2025 to 2026
| Development | Status and market relevance |
|---|---|
| In September 2026, Nestlé said it would invest more than CHF 157 million to add two lines at Rayong, Thailand. | Announced, operation expected in 2028; adds machinery demand in Southeast Asia. |
| In August 2026, BEWITAL opened its first plant outside Germany, a wet food site in Weihai, China, with partner Megapet. | Open; output is intended only for the Chinese market. |
| In June 2026, Mars opened its AU$112.6 million wet cat food pouch facility in Wodonga, Australia. | Open; nine in ten Mars pet care products sold in both countries are slated for local production. |
| In May 2026, JBT Marel formed an exclusive cooperation with Aurum Process Technology on aseptic processing. | Active; aimed at ready meals and premium wet pet food. |
| In April 2026, Drools and Tetra Pak announced a ₹180 crore fresh pet food program in India. | Launched; uses retort and aseptic packaging without a cold chain. |
Automation levels separate large lines from small runs
- Integrated Automated Systems link preparation, filling, sterilizing and packing under one control layer, and JBT Marel markets such end-to-end solutions for premium wet recipes.
- Standalone Automated Systems automate a single step, such as the VEMAG FKF607 can filling line that handles up to 120 cans, jars or cups per minute.
- Operator-Assisted Systems keep workers at loading and changeover points, which suits short runs, although higher wage floors such as the Thai THB 400 daily rate weaken the case over time.
- Hygienic preparation and heat transfer cover grinders, emulsifiers and heat exchangers, including scansteel foodtech grinders for fresh and frozen raw material and Alfa Laval food heat exchangers built to strict hygiene standards.
Need a Custom Version of This Report?
Tailor the scope, geography, or segments to your exact requirements.
- Custom geography or segment scope
- Direct access to our analyst team
Global line builders compete through local service bases
Competition in Asia Pacific turns on local engineering, service reach and the ability to deliver a complete line rather than a single machine. JBT Marel pairs its global wet and kibble portfolio with a production center in Pune, which shortens delivery into South Asia. Tetra Pak competes through retort and aseptic packaging systems, as its April 2026 work with Drools in India shows. MULTIVAC relies on subsidiaries and production in Japan, India and Australia to win thermoforming and service contracts. GEA markets meat preparation and packaging technology for wet pet food, while Alfa Laval supplies hygienic heat exchangers through its Japanese food business. Buyers therefore weigh purchase price against commissioning support and long-term access to spare parts.
Companies profiled and their roles in this market
| Company | Type | Role in the market |
|---|---|---|
| JBT Marel | Line builder | Global production center in Pune, India, opened September 2025, plus aseptic cooperation with Aurum |
| Tetra Pak | Packaging and processing systems | Retort and aseptic technology behind the Drools fresh range in India, April 2026 |
| MULTIVAC | Packaging machinery | Tsukuba, Japan, operations building and Ghiloth, India, production site; subsidiaries across Australia |
| GEA Group | Process technology | Meat preparation and packaging technology for wet pet food, promoted through its Chinese-language site |
| Alfa Laval | Heat transfer and hygiene | Hygienic food heat exchangers marketed through its Japanese business |
Credence Research view on line investment to 2035
Credence Research's view is that the region will keep adding wet capacity, but the buying center is moving from a few multinational projects toward a wider group of Chinese and contract producers. Equipment suppliers that win will combine retort and pouch expertise with local service, because recipe counts are rising while plant teams remain lean. The largest uncertainty is the share of Chinese output that is actually wet, since official data reports all pet food together. Suppliers should therefore track named plant projects rather than rely on national volume figures, particularly in Shandong and Hebei.
How Credence Research built these estimates
The report uses 2025 as the base year and forecasts to 2035. Market values come from the Credence Research model, and segment and regional splits are Credence Research estimates informed by public data. Sources include government and trade statistics, regulator documents, company releases and trade press opened during research. No primary interviews or surveys were conducted for this edition. Wet food is not reported separately in most official data, so wet shares rest on analyst judgment and are the most assumption-heavy inputs in the model.
Capacity additions keep orders rising through 2035
The market should rise from USD 563.8 million in 2026 to USD 1.07 billion by 2035 as committed projects reach start-up and replacement work builds on the plants opened this decade. Greater China will remain the largest buyer, while South and Southeast Asia gains share through Thai export lines and first-generation Indian plants. Nestlé's Rayong lines arrive in 2028, and China's hygiene standard could trigger sanitation upgrades once it is finalized. Pouch and tray formats should keep packaging orders ahead of processing growth, although U.S. tariffs and slower pet population growth in Japan remain clear limits on the pace.
Frequently Asked Questions
How big is the Asia Pacific wet pet food processing equipment market?
Which area leads the market?
Which area grows fastest?
Which product type holds the largest share?
Why does cat food dominate equipment demand?
What is the biggest recent plant project in the region?
What are the main challenges for buyers?
Which companies are active in this market?
Table of Content
Chapter 1 Market Segmentation
- 1.1 Segmentation Framework
- 1.1.1 Product and Service Classification
- 1.1.2 Application and End-Use Classification
- 1.1.3 Technology and Solution Classification
- 1.1.4 Customer and Distribution Channel Classification
- 1.1.5 Geographic Segmentation
- 1.1.6 Market Segment Definitions and Boundaries
- 1.2 By Product Type
- 1.2.1 Processing Equipment
- 1.2.2 Packaging Equipment
- 1.2.3 Cleaning and Sanitation Equipment
- 1.3 By Application
- 1.3.1 Cat Wet Food
- 1.3.2 Dog Wet Food
- 1.3.3 Multi-Species Wet Food
- 1.4 By Customer Type
- 1.4.1 Integrated Brand Manufacturers
- 1.4.2 Contract Manufacturers
- 1.4.3 Independent Specialty Manufacturers
- 1.5 By Project Type
- 1.5.1 Greenfield Capacity
- 1.5.2 Replacement Investment
- 1.5.3 Brownfield Expansion
Chapter 2 Introduction
- 2.1 Report Objectives and Scope
- 2.2 Product Definition and Industry Terminology
- 2.3 Market Inclusions and Exclusions
- 2.4 Research Process
- 2.4.1 Primary Research and Expert Interviews
- 2.4.2 Secondary Research and Source Review
- 2.4.3 Top-Down and Bottom-Up Estimation
- 2.4.4 Data Triangulation and Verification
- 2.5 Market Size Measurement Basis
- 2.5.1 2025: USD 524.5 million → 2035: USD 1.07 billion
- 2.6 Historical and Forecast Reference Periods
- 2.6.1 Historical Period: 2018-2025
- 2.6.2 Base Year: 2025
- 2.6.3 Forecast Period: 2025-2035
- 2.7 Research Assumptions and Limitations
Chapter 3 Executive Summary
- 3.1 Market Snapshot and Key Findings
- 3.2 Base-Year Market Size, 2025
- 3.3 Forecast Market Size, 2035
- 3.4 Revenue and Volume Growth Outlook
- 3.5 Key Demand and Supply Indicators
- 3.6 Leading Market Segments
- 3.7 Fastest-Growing Market Opportunities
- 3.8 Regional Performance Highlights
- 3.9 Technology and Industry Transformation
- 3.10 Competitive Landscape Summary
- 3.11 Analyst View and Strategic Implications
Chapter 4 Asia Pacific Wet Pet Food Processing Equipment Market Trends and Developments
- 4.1 Historical Industry Development, 2018-2025
- 4.2 Recent Market Trends and Developments
- 4.3 Demand and Customer Behavior Trends
- 4.4 Technology and Product Innovation
- 4.5 Artificial Intelligence, Automation and Digitalization
- 4.6 Local Manufacturing and Supply Chain Realignment
- 4.7 Industry Partnerships, Mergers and Acquisitions
- 4.8 Sustainability and Circular Economy Developments
- 4.9 Government and Private Sector Investment Trends
- 4.10 Emerging Business Models and Commercialization
- 4.11 Industry Developments and Announcements
Chapter 5 Asia Pacific Wet Pet Food Processing Equipment Market Production, Supply and Demand Analysis
- 5.1 Demand Trend and Consumption Analysis, 2018-2025
- 5.2 Demand Forecast, 2025-2035
- 5.3 Production and Output Trend, 2018-2025
- 5.4 Production and Output Forecast, 2025-2035
- 5.5 Installed Capacity and Capacity Utilization
- 5.6 Company-Wise Production Plants and Statistics
- 5.6.1 Installed Production Capacity
- 5.6.2 Actual Production
- 5.6.3 Planned Capacity and Expansion Targets
- 5.7 Supply Chain Structure and Procurement Trends
- 5.8 Supply-Demand Gap and Bottlenecks
- 5.9 Import Dependence and Sourcing Structure
- 5.10 Contract Manufacturing and Outsourcing
- 5.11 Regional Supply and Demand Concentration
Chapter 6 Asia Pacific Wet Pet Food Processing Equipment Market Pricing Analysis
- 6.1 Pricing Structure and Measurement
- 6.2 Historical Pricing Trends, 2018-2025
- 6.3 Pricing Outlook, 2025-2035
- 6.4 Average Selling Price and Unit Economics
- 6.5 Pricing by Product and Market Segment
- 6.6 Geographic Pricing Differences
- 6.7 Key Input, Energy, Labor and Logistics Costs
- 6.8 Contract Pricing and Purchasing Models
- 6.9 Pricing Sensitivity and Competitive Positioning
- 6.10 Price, Margin and Profitability Implications
Chapter 7 Asia Pacific Wet Pet Food Processing Equipment Market Dynamics
- 7.1 Market Growth Drivers
- 7.1.1 Demand-Side Drivers
- 7.1.2 Technology and Innovation Drivers
- 7.1.3 Infrastructure and Investment Drivers
- 7.1.4 Regulatory and Policy Drivers
- 7.2 Market Restraints
- 7.2.1 Cost and Affordability Constraints
- 7.2.2 Technology and Adoption Barriers
- 7.2.3 Supply Chain and Operational Constraints
- 7.3 Market Challenges
- 7.3.1 Competitive Pressure and Margin Erosion
- 7.3.2 Skills, Infrastructure and Implementation Gaps
- 7.4 Emerging Market Opportunities
- 7.5 Market Dynamics Impact and Time-Horizon Assessment
Chapter 8 Asia Pacific Wet Pet Food Processing Equipment Value Chain Analysis
- 8.1 Industry Value Chain Overview
- 8.2 Upstream Suppliers and Critical Inputs
- 8.3 Technology and Component Providers
- 8.4 Manufacturing or Service Delivery
- 8.5 Distribution, Channel Partners and Integrators
- 8.6 Downstream Applications and End Users
- 8.7 Value Addition and Profit Pools
- 8.8 Vertical Integration and Outsourcing
- 8.9 Supplier Concentration and Risk
- 8.10 Supply Chain Localization and Resilience
Chapter 9 Asia Pacific Wet Pet Food Processing Equipment Market Regulations and Policies
- 9.1 Relevant Laws, Standards and Compliance Frameworks
- 9.2 Product, Service, Safety and Quality Requirements
- 9.3 Government Policies, Incentives and Subsidies
- 9.4 Imports, Exports and Trade Barriers
- 9.5 Public Procurement and Local Content Requirements
- 9.6 Environmental and Sustainability Compliance
- 9.7 Upcoming Policy Changes and Market Implications
Chapter 10 Asia Pacific Wet Pet Food Processing Equipment Market Hotspots and Opportunities
- 10.1 Market Opportunity Mapping and Growth Hotspots
- 10.2 High-Growth Applications and Customer Groups
- 10.3 Underserved Markets and White-Space Opportunities
- 10.4 Emerging Technology and Product Opportunities
- 10.5 New Capacity and Investment Hotspots
- 10.6 Market Entry and Expansion Opportunities
- 10.7 Distribution and Partnership Opportunities
- 10.8 Near-Term and Long-Term Commercial Potential
- 10.9 Opportunity Attractiveness and Execution Risks
Chapter 11 Asia Pacific Wet Pet Food Processing Equipment Market Outlook, 2025-2035
- 11.1 Market Size and Analysis
- 11.1.1 Revenue (Market Measurement: 2025: USD 524.5 million → 2035: USD 1.07 billion)
- 11.1.2 Market Volume and Quantity Sold
- 11.1.3 Historical Market Size, 2018-2025
- 11.1.4 Base-Year Market Size, 2025
- 11.2 Market Forecast, 2025-2035
- 11.2.1 Revenue Forecast to 2035
- 11.2.2 Volume Forecast to 2035
- 11.2.3 CAGR and Year-on-Year Growth
- 11.2.4 Incremental Revenue Opportunity
- 11.3 Forecast Assumptions and Scenario Analysis
- 11.3.1 Base-Case Forecast
- 11.3.2 Optimistic and Conservative Scenarios
- 11.3.3 Technology, Pricing and Policy Sensitivities
- 11.4 Market Attractiveness and Growth Outlook
Chapter 12 Asia Pacific Wet Pet Food Processing Equipment Market Segmentation and Outlook
- 12.1 Segmentation Summary and Market Shares, 2025
- 12.2 Largest and Fastest-Growing Segments
- 12.3 By Product Type - Market Size and Forecast, 2025-2035
- 12.3.1 Segment Definition and Scope
- 12.3.2 Historical Market Size, 2018-2025
- 12.3.3 Revenue Forecast, 2025-2035
- 12.3.4 Volume Forecast, 2025-2035
- 12.3.5 Base-Year Market Share, 2025
- 12.3.6 Segment CAGR and Growth Drivers
- 12.3.7 Subsegment Market Size and Forecast
- 12.3.7.1 Processing Equipment
- 12.3.7.2 Packaging Equipment
- 12.3.7.3 Cleaning and Sanitation Equipment
- 12.3.8 Subsegment Pricing and Adoption Trends
- 12.3.9 Leading Suppliers and Competition
- 12.3.10 Regional Demand and Opportunities
- 12.4 By Application - Market Size and Forecast, 2025-2035
- 12.4.1 Segment Definition and Scope
- 12.4.2 Historical Market Size, 2018-2025
- 12.4.3 Revenue Forecast, 2025-2035
- 12.4.4 Volume Forecast, 2025-2035
- 12.4.5 Base-Year Market Share, 2025
- 12.4.6 Segment CAGR and Growth Drivers
- 12.4.7 Subsegment Market Size and Forecast
- 12.4.7.1 Cat Wet Food
- 12.4.7.2 Dog Wet Food
- 12.4.7.3 Multi-Species Wet Food
- 12.4.8 Subsegment Pricing and Adoption Trends
- 12.4.9 Leading Suppliers and Competition
- 12.4.10 Regional Demand and Opportunities
- 12.5 By Customer Type - Market Size and Forecast, 2025-2035
- 12.5.1 Segment Definition and Scope
- 12.5.2 Historical Market Size, 2018-2025
- 12.5.3 Revenue Forecast, 2025-2035
- 12.5.4 Volume Forecast, 2025-2035
- 12.5.5 Base-Year Market Share, 2025
- 12.5.6 Segment CAGR and Growth Drivers
- 12.5.7 Subsegment Market Size and Forecast
- 12.5.7.1 Integrated Brand Manufacturers
- 12.5.7.2 Contract Manufacturers
- 12.5.7.3 Independent Specialty Manufacturers
- 12.5.8 Subsegment Pricing and Adoption Trends
- 12.5.9 Leading Suppliers and Competition
- 12.5.10 Regional Demand and Opportunities
- 12.6 By Project Type - Market Size and Forecast, 2025-2035
- 12.6.1 Segment Definition and Scope
- 12.6.2 Historical Market Size, 2018-2025
- 12.6.3 Revenue Forecast, 2025-2035
- 12.6.4 Volume Forecast, 2025-2035
- 12.6.5 Base-Year Market Share, 2025
- 12.6.6 Segment CAGR and Growth Drivers
- 12.6.7 Subsegment Market Size and Forecast
- 12.6.7.1 Greenfield Capacity
- 12.6.7.2 Replacement Investment
- 12.6.7.3 Brownfield Expansion
- 12.6.8 Subsegment Pricing and Adoption Trends
- 12.6.9 Leading Suppliers and Competition
- 12.6.10 Regional Demand and Opportunities
- 12.7 Segment Growth Comparison
- 12.8 Segment Attractiveness and Priority Matrix
Chapter 13 Asia Pacific Wet Pet Food Processing Equipment End-Use and Application Market Outlook
- 13.1 End-Use Industry and Customer Demand Structure
- 13.2 Leading Applications and Customer Groups
- 13.3 End-Use Market Size, Share and Forecast
- 13.4 Major End-Use Industry Deep Dives
- 13.4.1 Customer Requirements and Use Cases
- 13.4.2 Demand and Replacement Cycles
- 13.4.3 Technical and Regulatory Considerations
- 13.4.4 Purchasing and Procurement Models
- 13.4.5 Leading Vendors and Distribution Channels
- 13.4.6 Forecast and Commercial Opportunities
- 13.5 Emerging Applications and Cross-Segment Demand
- 13.6 End-Use Industry Investment Priorities
Chapter 14 Asia Pacific Wet Pet Food Processing Equipment Geographic Market Outlook, 2025-2035
- 14.1 Regional Market Size and Country-Level Shares, 2025
- 14.2 Country Market Size Comparison, 2025
- 14.3 Country Market Forecasts, 2025-2035
- 14.4 Subregional Industrial and Demand Clusters
- 14.5 Intra-Regional Pricing and Cost Differences
- 14.6 Cross-Border Trade and Supply Networks
- 14.7 Regional Supply and Demand Balances
- 14.8 Country Opportunity Comparison and Prioritization
Note: Every listed country is covered on the structure shown under the first country.
Chapter 15 Asia Pacific Wet Pet Food Processing Equipment Technology, Innovation and Sustainability Outlook
- 15.1 Technology Landscape and Maturity
- 15.2 Product, Process and Service Innovation
- 15.3 AI, Automation and Digital Tools in the Industry
- 15.4 Technology Adoption and Performance Benchmarking
- 15.5 Innovation Pipeline and R&D Investment
- 15.6 Patent and Intellectual Property Trends
- 15.7 Energy Efficiency and Resource Management
- 15.8 Sustainability, Recycling and Circularity
- 15.9 Technology Roadmap, 2025-2035
- 15.10 Risks of Obsolescence and Technology Substitution
Chapter 16 Asia Pacific Wet Pet Food Processing Equipment Market Key Strategic Imperatives
- 16.1 Growth and Market Entry Priorities
- 16.2 High-Return Products and Segments
- 16.3 Pricing, Profitability and Cost Optimization
- 16.4 Technology Investment and Product Differentiation
- 16.5 Supply Chain Localization and Resilience
- 16.6 Distribution and Customer Acquisition
- 16.7 Partnership, Acquisition and Capacity Strategy
- 16.8 Regional Expansion Priorities
- 16.9 Short-, Medium- and Long-Term Actions
Chapter 17 Competition Outlook
- 17.1 Industry Competition Characteristics
- 17.2 Market Structure and Concentration
- 17.3 Market Share and Competitive Positioning, 2025
- 17.4 Company-Wise Revenue and Product Benchmarking
- 17.5 Production and Service Capacity Benchmarking
- 17.6 Technology, Pricing and Differentiation
- 17.7 Regional Footprint and Distribution Strength
- 17.8 Mergers, Acquisitions and Strategic Alliances
- 17.9 New Entrants and Competitive Threats
- 17.10 Porter's Five Forces and Industry Attractiveness
- 17.11 Competitive Outlook, 2025-2035
Chapter 18 Company Profiles
- 18.1 Company Coverage and Selection Criteria
- 18.2 GEA Group
- 18.2.1 Business Description
- 18.2.2 Company Ownership and Geographic Presence
- 18.2.3 Product and Service Portfolio
- 18.2.4 Manufacturing and Operating Footprint
- 18.2.5 Production Capacity and Expansion Plans
- 18.2.6 Financial Performance and Investment
- 18.2.7 Market Share and Competitive Position
- 18.2.8 Technology and Innovation Capabilities
- 18.2.9 Strategic Alliances or Partnerships
- 18.2.10 Recent Developments
- 18.2.11 Growth Strategy and Outlook
- 18.3 JBT Marel
- 18.4 Alfa Laval
- 18.5 MULTIVAC
- 18.6 Tetra Pak
- 18.7 Middleby
- 18.8 VEMAG
- 18.9 Jinan Darin Machinery
- 18.10 scansteel foodtech
- 18.11 Shandong Dingtaisheng Machinery Technology
- 18.12 Other Relevant Market Participants
Note: Every listed company is profiled on the structure shown under the first company. The company list is preliminary and may change based on research findings, market developments, data availability and client requirements.
Chapter 19 Disclaimer
- 19.1 Research and Forecast Disclaimer
- 19.2 Data Source and Estimation Limitations
Note: The depth of individual sections depends on data availability for this market. Volume, capacity, trade and other unit-based metrics are included where applicable.

