
Short runs and packaging reshape regional press demand
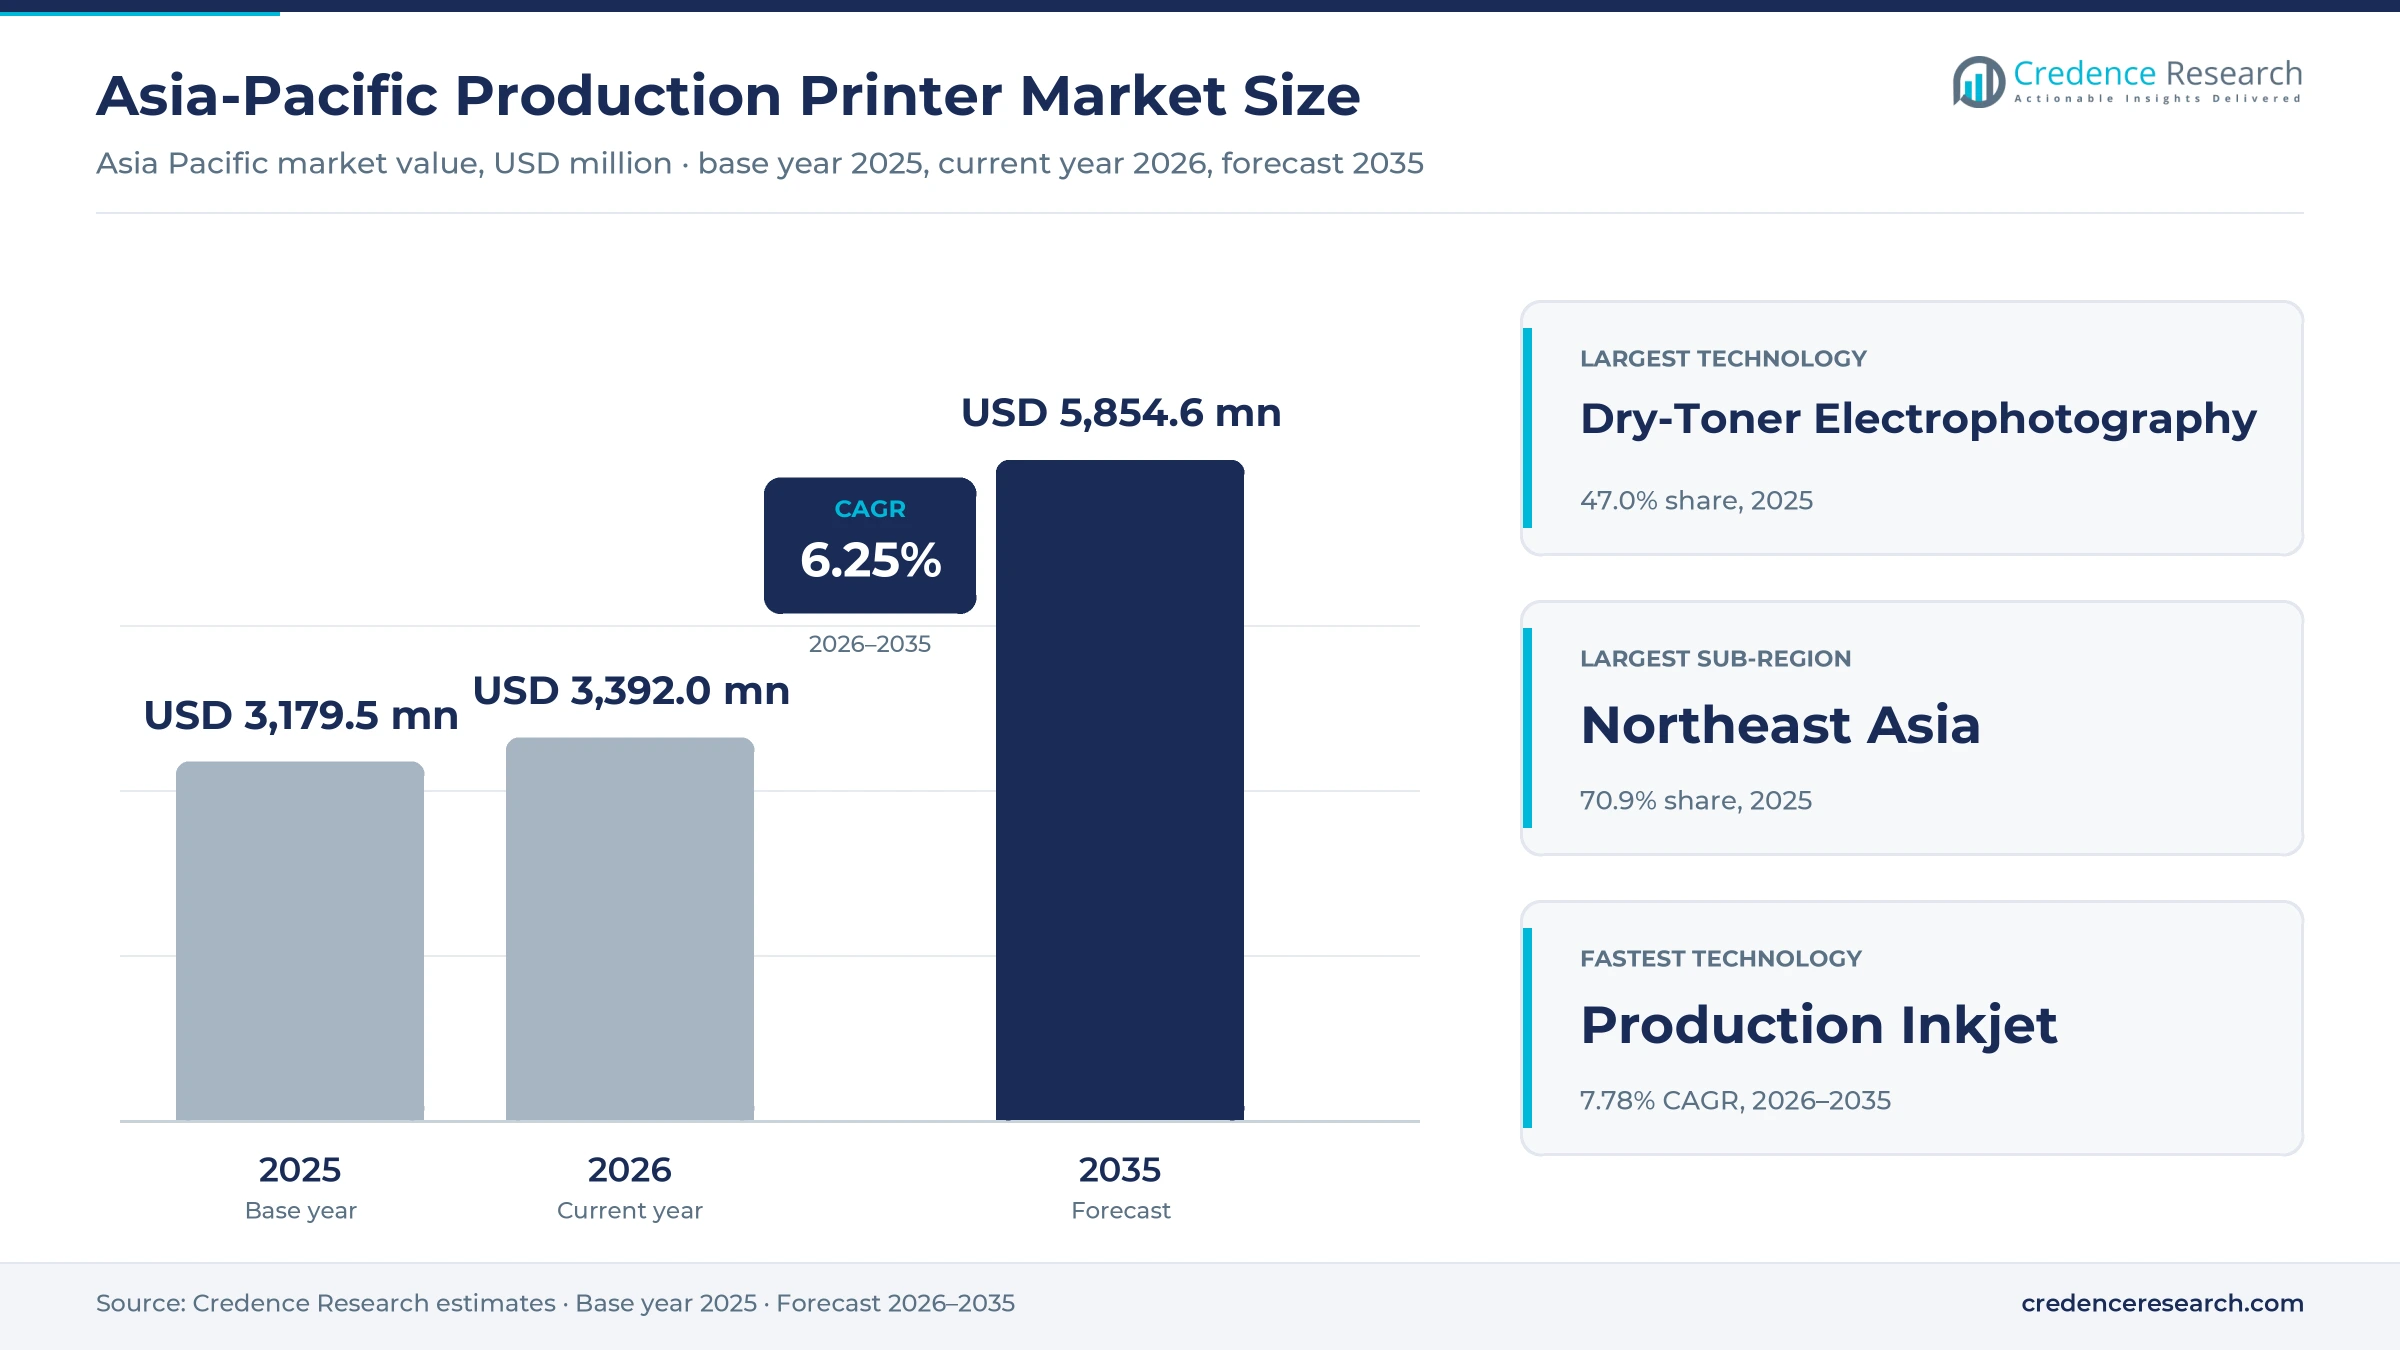
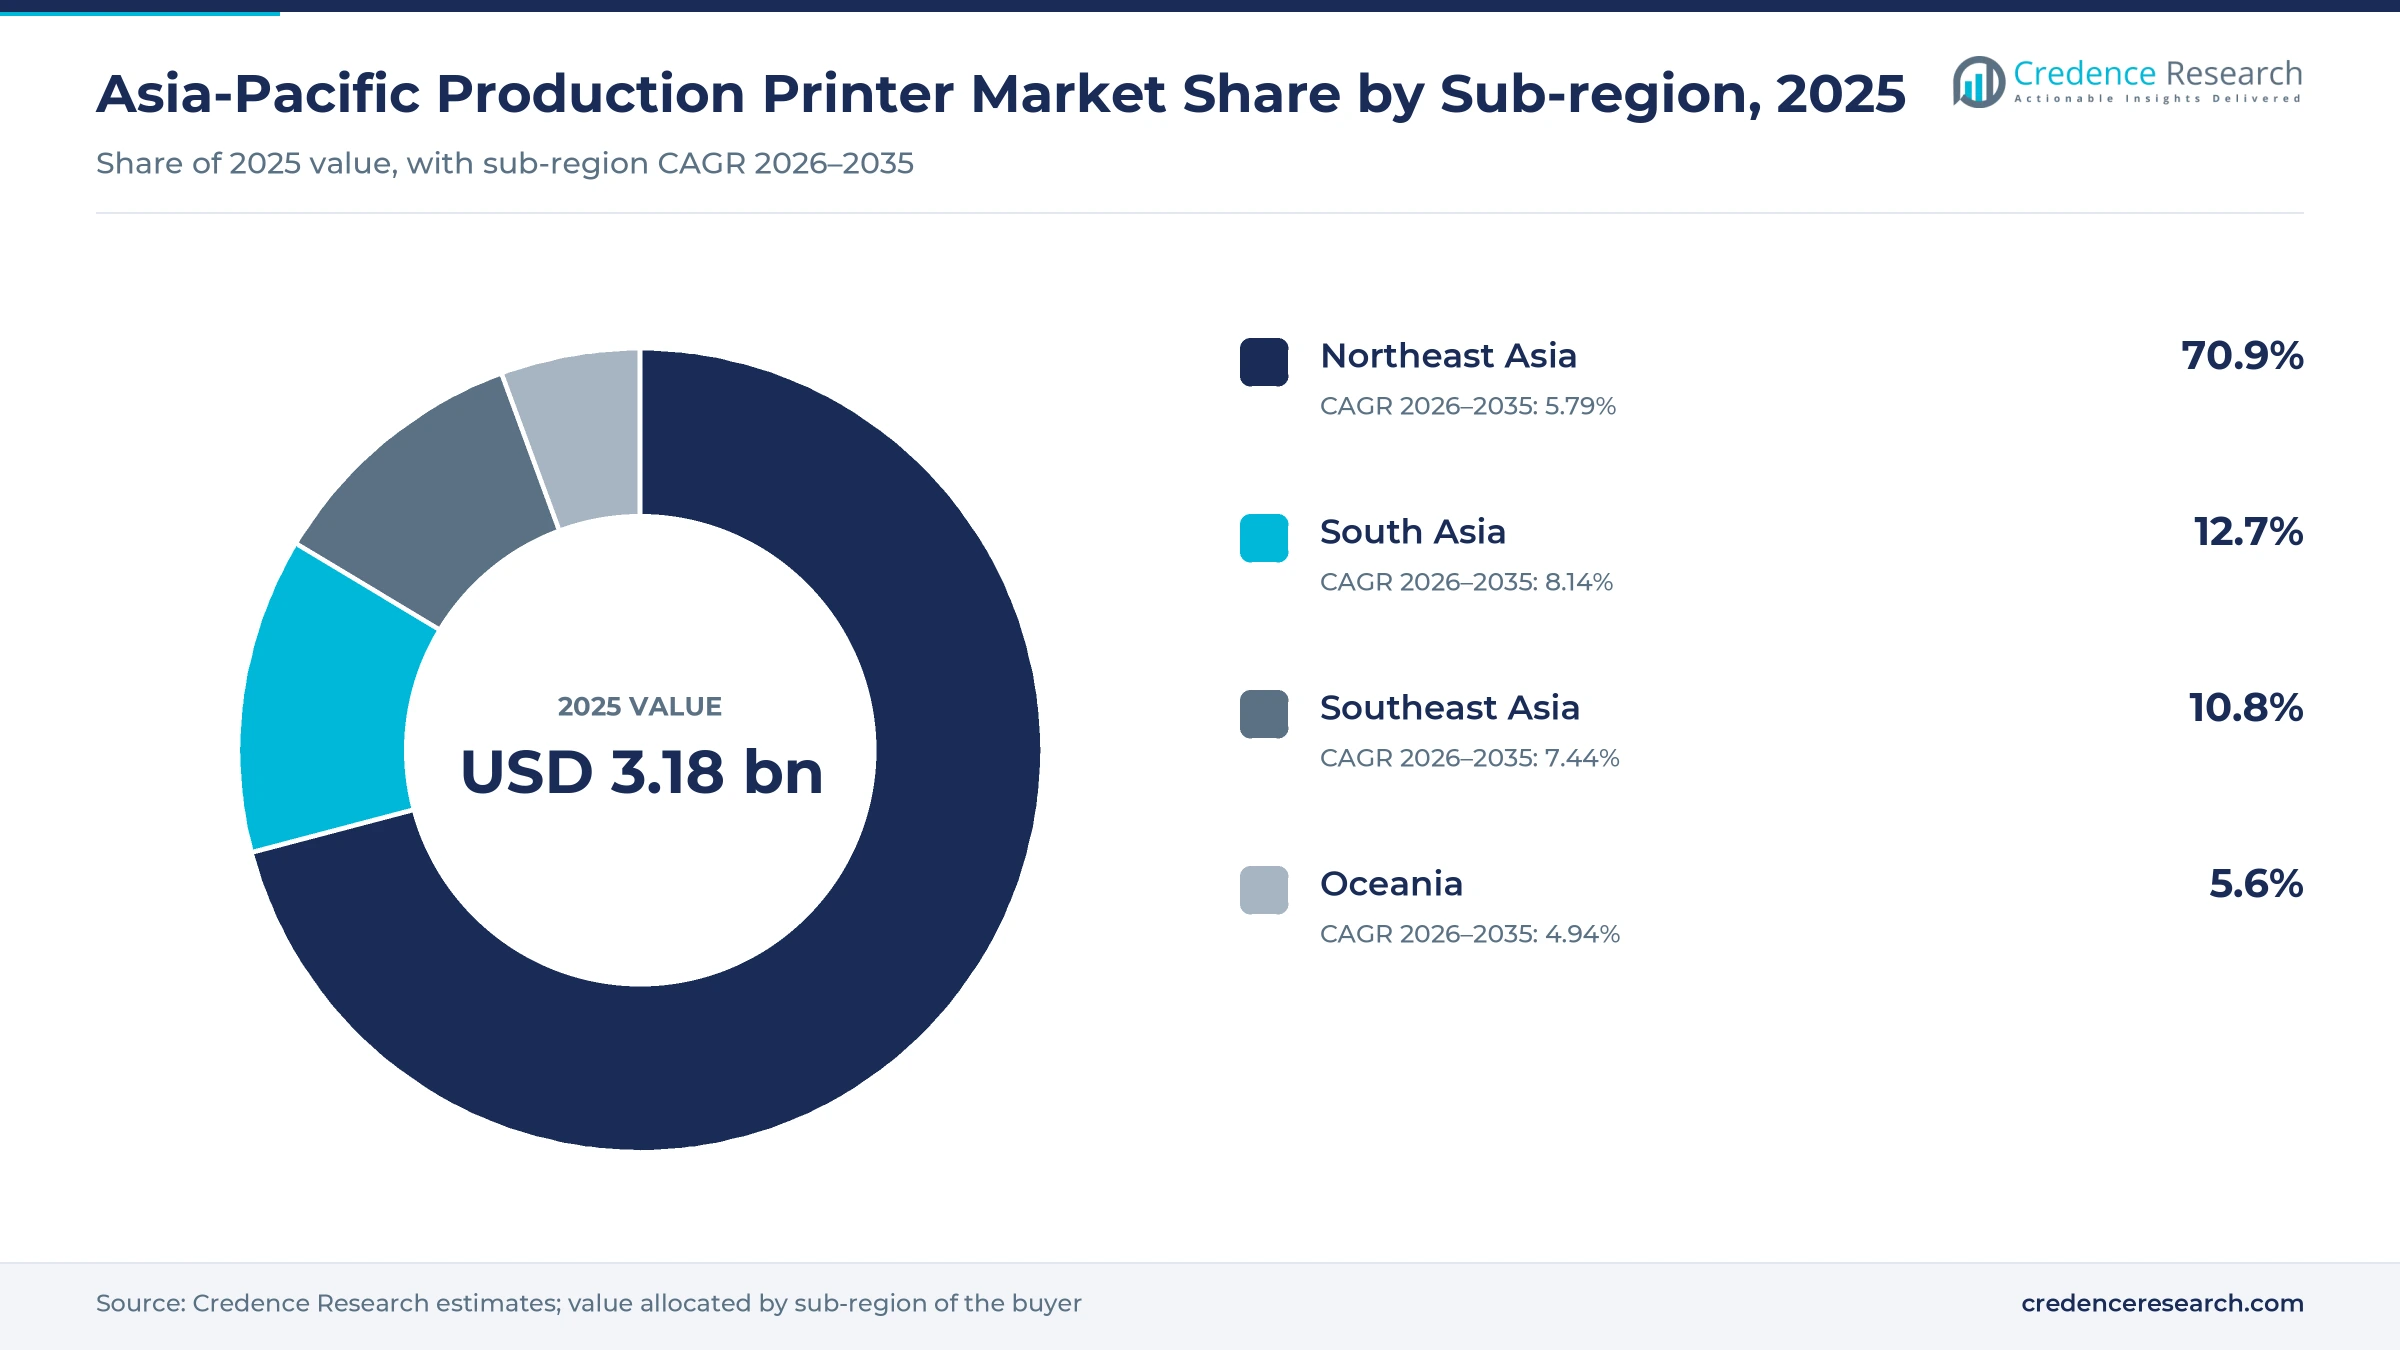
The Asia-Pacific production printer market was valued at USD 3.18 billion in 2025 and is projected to increase from USD 3.39 billion in 2026 to USD 5.85 billion by 2035, registering a CAGR of 6.25% during 2026–2035. Demand comes from commercial printers replacing short offset runs, packaging converters adding digital capacity, and buyers seeking presses that need fewer skilled operators. Northeast Asia held the largest sub-regional share, 70.9% in 2025, because China and Japan hold most installed capacity and Japan is home to Canon, Ricoh, Konica Minolta and FUJIFILM. South Asia is the fastest-growing sub-region at 8.14% a year, as Indian printers in smaller cities buy their first high-end digital machines. A notable commercial change came in December 2025, when 12 Chinese inkjet label press makers exhibited at a Shanghai trade show. In turn, established suppliers now face newer rivals in narrow-web work while they push B2 inkjet and AI-assisted toner models into commercial plants across the region.
What does the production printer category include?
The category covers digital presses built for paid or high-volume output, using dry toner, liquid toner or inkjet, in cut-sheet and continuous-feed forms. Value includes machine placement, OEM consumables such as toner and ink, and the service and software contracts sold with each press. Buyers purchase directly from the manufacturer, through authorized dealers or through integrators that combine presses with finishing lines.
Office multifunction devices, desktop printers, wide-format graphics machines, textile printers and conventional offset, flexo or gravure presses are excluded from this scope. The value chain runs from printhead and engine makers through OEM brands and distributors to commercial printers, converters, publishers, mailing houses and corporate in-plant shops.
Asia-Pacific Production Printer Market Insights
- The market is forecast to grow from USD 3.18 billion in 2025 to USD 5.85 billion by 2035, at a 6.25% CAGR over 2026–2035, on short-run and packaging work.
- Northeast Asia held 70.9% of 2025 value, supported by China and Japan, while South Asia grows fastest at 8.14% a year on Indian placements.
- Dry-Toner Electrophotography led the technology split with 47.0% in 2025, because cut-sheet commercial shops across the region still run mostly toner engines.
- Dongguan Honggan Packaging installed the 100th HP Indigo flexible packaging press in the region in April 2025, showing how packaging now drives digital placements.
- Twelve Chinese inkjet label press makers exhibited in Shanghai in December 2025, which increases competition for established OEMs in narrow-web equipment and consumables.
Toner leads today while inkjet and packaging gain ground
Why does dry toner lead as production inkjet gains?
Based on technology, the market is categorized into dry-toner electrophotography, liquid electrophotography and production inkjet. Dry-Toner Electrophotography led with 47.0% of 2025 value because toner engines keep getting faster at commercial sizes, as Fujifilm's 100-page-a-minute Revoria Press EC2100, announced Dec. 12, 2024, shows. Production Inkjet grows fastest at 7.78% a year as inkjet moves into sheetfed work. Canon's varioPRESS iV7, for example, is rated at 8,700 B2 sheets an hour, and Ricoh's Pro VC80000 web press runs at 150 meters a minute, according to Sprinter in June 2025.
Why is packaging the fastest digital press application?
Based on application, the market is categorized into commercial print, transactional documents, packaging print and publishing and in-plant print. Commercial Print led with 40.0% of 2025 value because general commercial work remains the first use for most new machines, as HP India's customers demonstrated with photo and general jobs on Indigo B2 presses in February 2025. Packaging Print grows fastest at 8.38% a year as converters add dedicated lines. Labels & Labeling reported that Dongguan Honggan's HP Indigo 200K, installed in April 2025, was the 100th Indigo flexible packaging press in the region.
How do cut-sheet and web formats divide the market?
Based on production method, the market is categorized into cut-sheet, wide-web continuous feed and narrow-web continuous feed. Cut-Sheet led with 58.0% of 2025 value because smaller commercial shops prefer sheet engines, including Konica Minolta's AccurioPress C14010S at 140 A4 pages a minute, launched at PrintPack India in February 2025. Narrow-Web Continuous Feed grows fastest at 7.66% a year as label converters replace older lines. Mercury Walch in Hobart, for example, moved from about 9 to 60 meters a minute with a Screen L350UV SAI-S, IT Brief Australia reported on Aug. 19, 2026.
Why do consumables out-earn the press itself?
Based on revenue model, the market is categorized into equipment placement revenue, OEM consumables revenue and service and bundled software revenue. OEM Consumables Revenue led with 44.0% of 2025 value because ink and toner sales recur on heavy volumes, and Canon rates the varioPRESS iV7 at up to 4.5 million B2 images a month. Service and Bundled Software Revenue grows fastest at 7.41% a year as vendors attach software and flexible contracts. Xeikon launched its subscription-based Ecolyne press at Labelexpo Asia in December 2025, and HP sells PQ Maestro as a workflow tool for Indigo presses.
| Segment Group | Leading Sub-segment | Share, 2025 | Fastest-growing Sub-segment | CAGR, 2026–2035 |
|---|---|---|---|---|
| By Technology | Dry-Toner Electrophotography | 47.0% | Production Inkjet | 7.78% |
| By Application | Commercial Print | 40.0% | Packaging Print | 8.38% |
| By Production Method | Cut-Sheet | 58.0% | Narrow-Web Continuous Feed | 7.66% |
| By Revenue Model | OEM Consumables Revenue | 44.0% | Service and Bundled Software Revenue | 7.41% |
Request a Free Sample
Fill in your details and we'll send you a free sample report.
- Sample data tables & charts
- Research methodology
Short runs, packaging and automation lift press demand
Short-run commercial conversion opens the offset base
Commercial printers across the region are moving shorter jobs from offset to digital presses because run lengths keep falling and setup labor is scarce. Dempa Shimbun reported in June 2026 that digital printing accounts for just over 10% of Japanese commercial printing while the wider sector shrinks, which leaves a large offset base still open to conversion. HP marked its 25th Indigo B2 press installation in India in February 2025, with customers using the machines for photo and general commercial work. Fujifilm Business Innovation began worldwide sales of the 100-page-a-minute Revoria Press EC2100 in January 2025, and Konica Minolta showed the 140-page-a-minute AccurioPress C14010S at PrintPack India a month later. As a result, Commercial Print held 40.0% of 2025 value across commercial printing customers.
Digital packaging adoption brings in converter budgets
Packaging converters are adding digital capacity because brand owners order more versions in smaller lots, and China sets the pace. Heidelberg said in June 2025 that packaging and labels make up almost 50% of China's printing industry and that paper-based packaging grows about 4% a year there. Dongguan Honggan Packaging installed an HP Indigo 200K in April 2025, which Labels & Labeling reported as the 100th HP Indigo flexible packaging press in the region. HP also showed its 6,000-sheet-an-hour Indigo 120K HD at China Print in May 2025, while Heidelberg gave its Jetfire 50 inkjet press an Asian debut at the same show. These placements help Packaging Print post the fastest application growth at 8.38% a year, with digital packaging lines now reaching converters in southern China.
Production automation answers labor and cost pressure
Labor shortages and material costs push buyers toward presses that need fewer skilled hands. Paper accounts for about half of printing costs in Japan, according to Dempa Shimbun in June 2026. Fujifilm Business Innovation Australia unveiled the AI-assisted Revoria Press PC2120 on July 2, 2026, Sprinter reported, and Konica Minolta's C14010S, launched in February 2025, pairs a quality optimizer with a paper inspection unit. HP claims its PQ Maestro tool saves about two hours of media-transfer time a day per device and that AAA 2.0 saves up to one hour per 80,000 prints, while Heidelberg's Prinect Touch Free software uses AI to route jobs between digital and offset. Because vendors sell this software with the press, Service and Bundled Software Revenue is the fastest revenue line at 7.41% a year.
Smaller Indian cities widen the buyer base
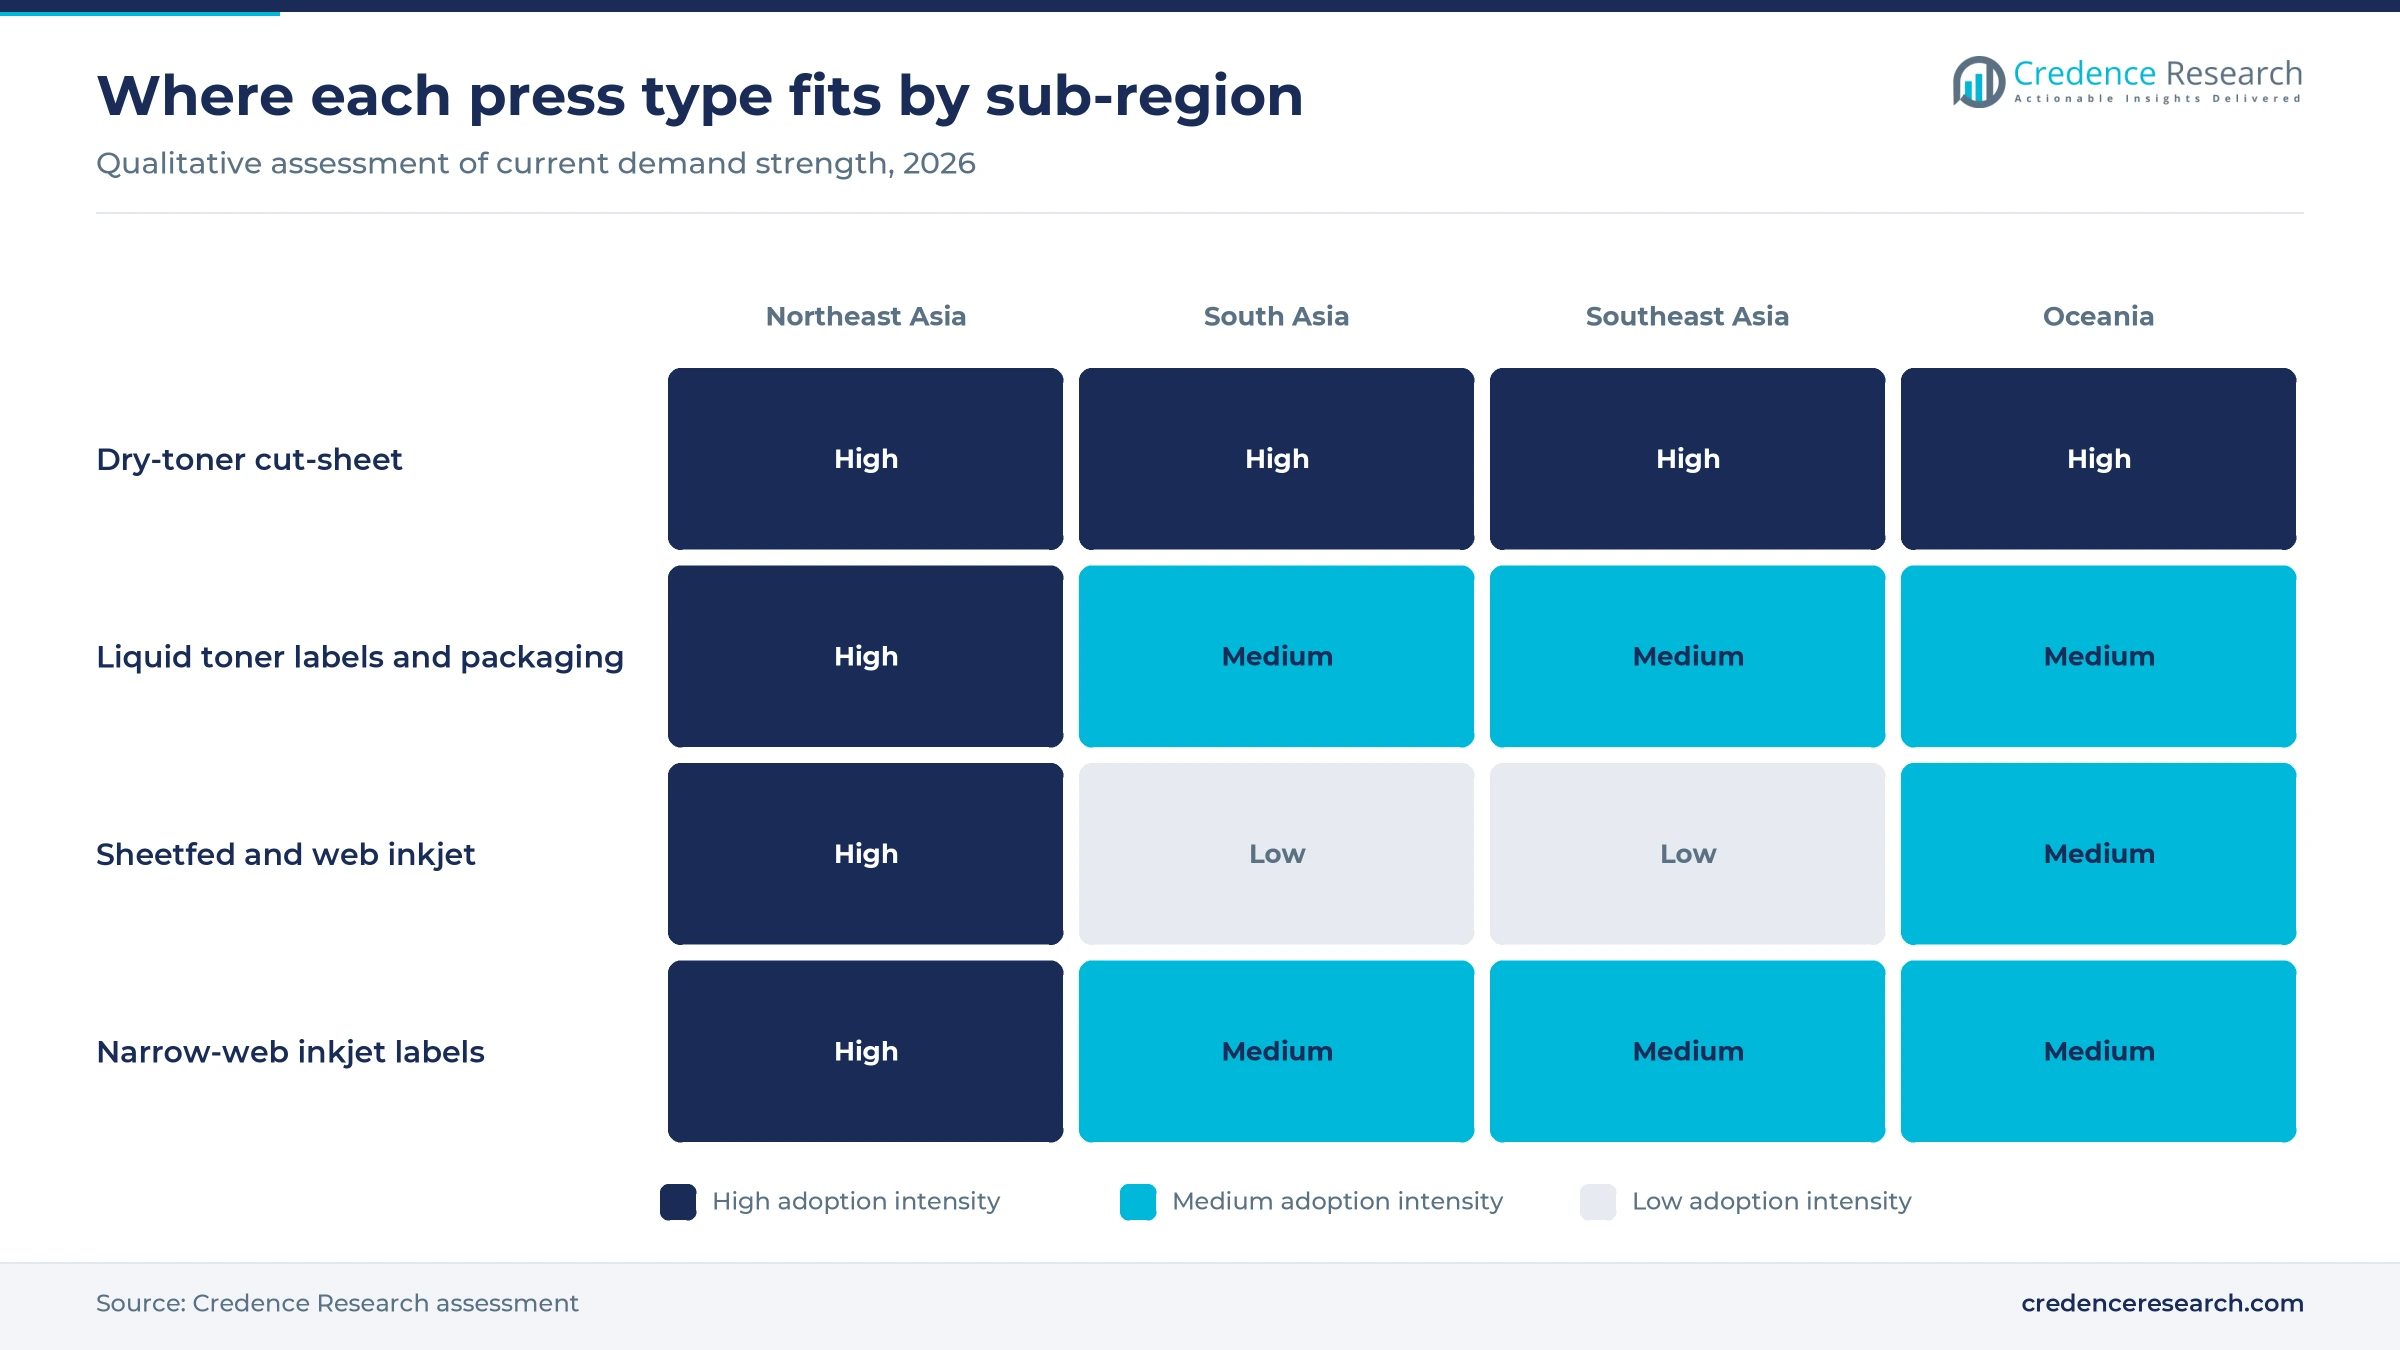
South Asia's smaller cities are becoming real buyers of high-end digital equipment, which widens the customer base beyond the large metros. HP India said in February 2025 that half of its Indigo B2 presses sit in Tier-II, Tier-III and Tier-IV cities, naming Saharanpur, Jhansi and Roorkee, according to Print & Publishing. Dempa Shimbun reported in June 2026 that Fujifilm Business Innovation had opened a base in India for print verification and talent development. Konica Minolta drew more than 2,000 visitors to its PrintPack India stand in February 2025, The Packman reported, and it has told Labels & Labeling that it is appointing distributors in Sri Lanka and Bangladesh. This activity builds on Indian commercial printing demand, which underpins South Asia's 12.7% share of 2025 value.
Chinese inkjet entrants and OEM ventures redraw the field
Chinese inkjet makers shift label presses to 1200 dpi
Chinese press builders are moving from entry UV machines to 1200 dpi lines, which narrows the quality gap with imported systems. WhatTheyThink profiled 12 Chinese inkjet label press makers at Labelexpo Asia in Shanghai on Dec. 2 to 5, 2025, a show with more than 450 exhibitors and over 30,560 visitors from 114 countries. Arojet showed the DF-330-HD at 80 meters a minute in full resolution, while Weigang's WG S350 Ultra ran at 75 meters a minute at 1200 by 1200 dpi. Established vendors still sold there, and Epson reported six SurePress L-5034 sales in China during the event. This competition lifts Narrow-Web Continuous Feed, the fastest method at 7.66% a year, although it also lowers equipment pricing for digital label converters.
Japanese OEMs shift engines and sourcing into joint ventures
Japanese suppliers are pooling engine development and purchasing, as flat office demand pushes them to protect margins for production lines. Ricoh and Toshiba Tec began ETRIA as a joint venture on July 1, 2024, to develop and make multifunction printers, and Ricoh said on Feb. 13, 2025, that Oki was being considered as a new partner. Fujifilm Business Innovation and Konica Minolta signed a procurement joint venture agreement on July 8, 2024, after opening a study in April 2024 that named production printers among the segments. Dempa Shimbun also reported in June 2026 that Seiko Epson fully acquired Fiery, the print-server specialist and is seeking synergies with its inkjet business. These moves matter because Northeast Asia hosts most of the affected engineering and purchasing.
Southeast Asia offers an opening for dealer-led placements
Southeast Asia is an opportunity because channel coverage is still being built outside its most developed print centers. Konica Minolta said on March 20, 2025, that it ranked first in color light and mid production printers across Singapore, Malaysia, Thailand, Vietnam, Indonesia and the Philippines for a third year. The company told Labels & Labeling that Malaysia has its most regional presses, that Thailand has the most room for growth, and that it wants to double its AccurioLabel 190 base. Fujifilm Business Innovation showed the Revoria Press SC285 and EC2100 at a Ho Chi Minh City print exhibition on Sept. 16 to 19, 2026. Suppliers with local service can therefore target a sub-region holding 10.8% and growing at 7.44% a year.
Oceania label insourcing opens room for new presses
Oceania offers an opening in label and short-run work that local printers currently lose to interstate or overseas suppliers. Mercury Walch installed a Screen L350UV SAI-S in Hobart to win back label jobs sent interstate, adding white printing, IT Brief Australia reported on Aug. 19, 2026. Print21 reported on Sept. 19, 2025, that Ultra Labels & Flexpack became the first company in Australia and New Zealand to invest in the 120-meter-a-minute HP Indigo V12, supported by distributor Currie Group. Fujifilm Business Innovation also launched four Revoria machines in Australia on March 26, 2025, according to Sprinter. Although Oceania holds only 5.6% of value and grows at 4.94% a year, such replacements carry dependable consumables income for suppliers.
Falling mail and offset loyalty slow the digital shift
Falling mail volumes shrink transactional print
Transactional print is losing volume as bills and statements move online. Australia Post reported letter volumes of 1.66 billion for fiscal 2025, down 5.4%, or 11.7% on a like-for-like basis, while Japan Post raised standard letter postage from 84 to 110 yen in October 2024. Mailing houses therefore face less work for monochrome web presses and a weaker case for replacing them. Adding marketing mail and color work is the likely response, which favors fewer but more capable machines.
Offset investment still competes for packaging budgets
Offset remains the default for long packaging runs, which limits how fast digital presses can take share. Heidelberg reported selling just under 350 printing units at China Print in May 2025, with packaging customers investing in particular in sheetfed technology, including two Speedmaster XL 75 presses with 19 printing units in eastern China. Converters that commit capital to such lines have less money for digital machines for several years. Digital suppliers respond by targeting short-run work and hybrid routing rather than direct replacement.
Printhead sourcing concentrates inkjet supply risk
Inkjet press builders depend on very few printhead suppliers, which concentrates risk for buyers. WhatTheyThink noted in December 2025 that Kyocera's KJ4A-EX1200-RC head was used in most 1200 dpi presses at Labelexpo Asia, with Epson heads on several other lines. A shortage or price change at either supplier would therefore affect many Chinese press brands together. Buyers can reduce that exposure by checking head warranty terms and spare-part stocks before they sign contracts.
Coated stock remains a hurdle for inkjet
Coated paper still limits how much offset work inkjet can take, especially in commercial catalogs. Kyocera showed the TASKalfa Pro 55000c only as a reference, not-yet-on-sale model at page2025 in Tokyo on Feb. 19 to 21, 2025, after developing new ink and clog-prevention technology for coated stock. Printers must therefore qualify each paper grade before moving jobs across, which slows conversion. Vendors answer with conditioning liquids, primers and pre-testing services before any press order.
Northeast Asia dominates as South Asia grows fastest
| Sub-region | Value, 2025 (USD billion) | Share, 2025 | CAGR, 2026–2035 |
|---|---|---|---|
| Northeast Asia | 2.25 | 70.9% | 5.79% |
| South Asia | 0.40 | 12.7% | 8.14% |
| Southeast Asia | 0.34 | 10.8% | 7.44% |
| Oceania | 0.18 | 5.6% | 4.94% |
Northeast Asia holds the installed base and press makers
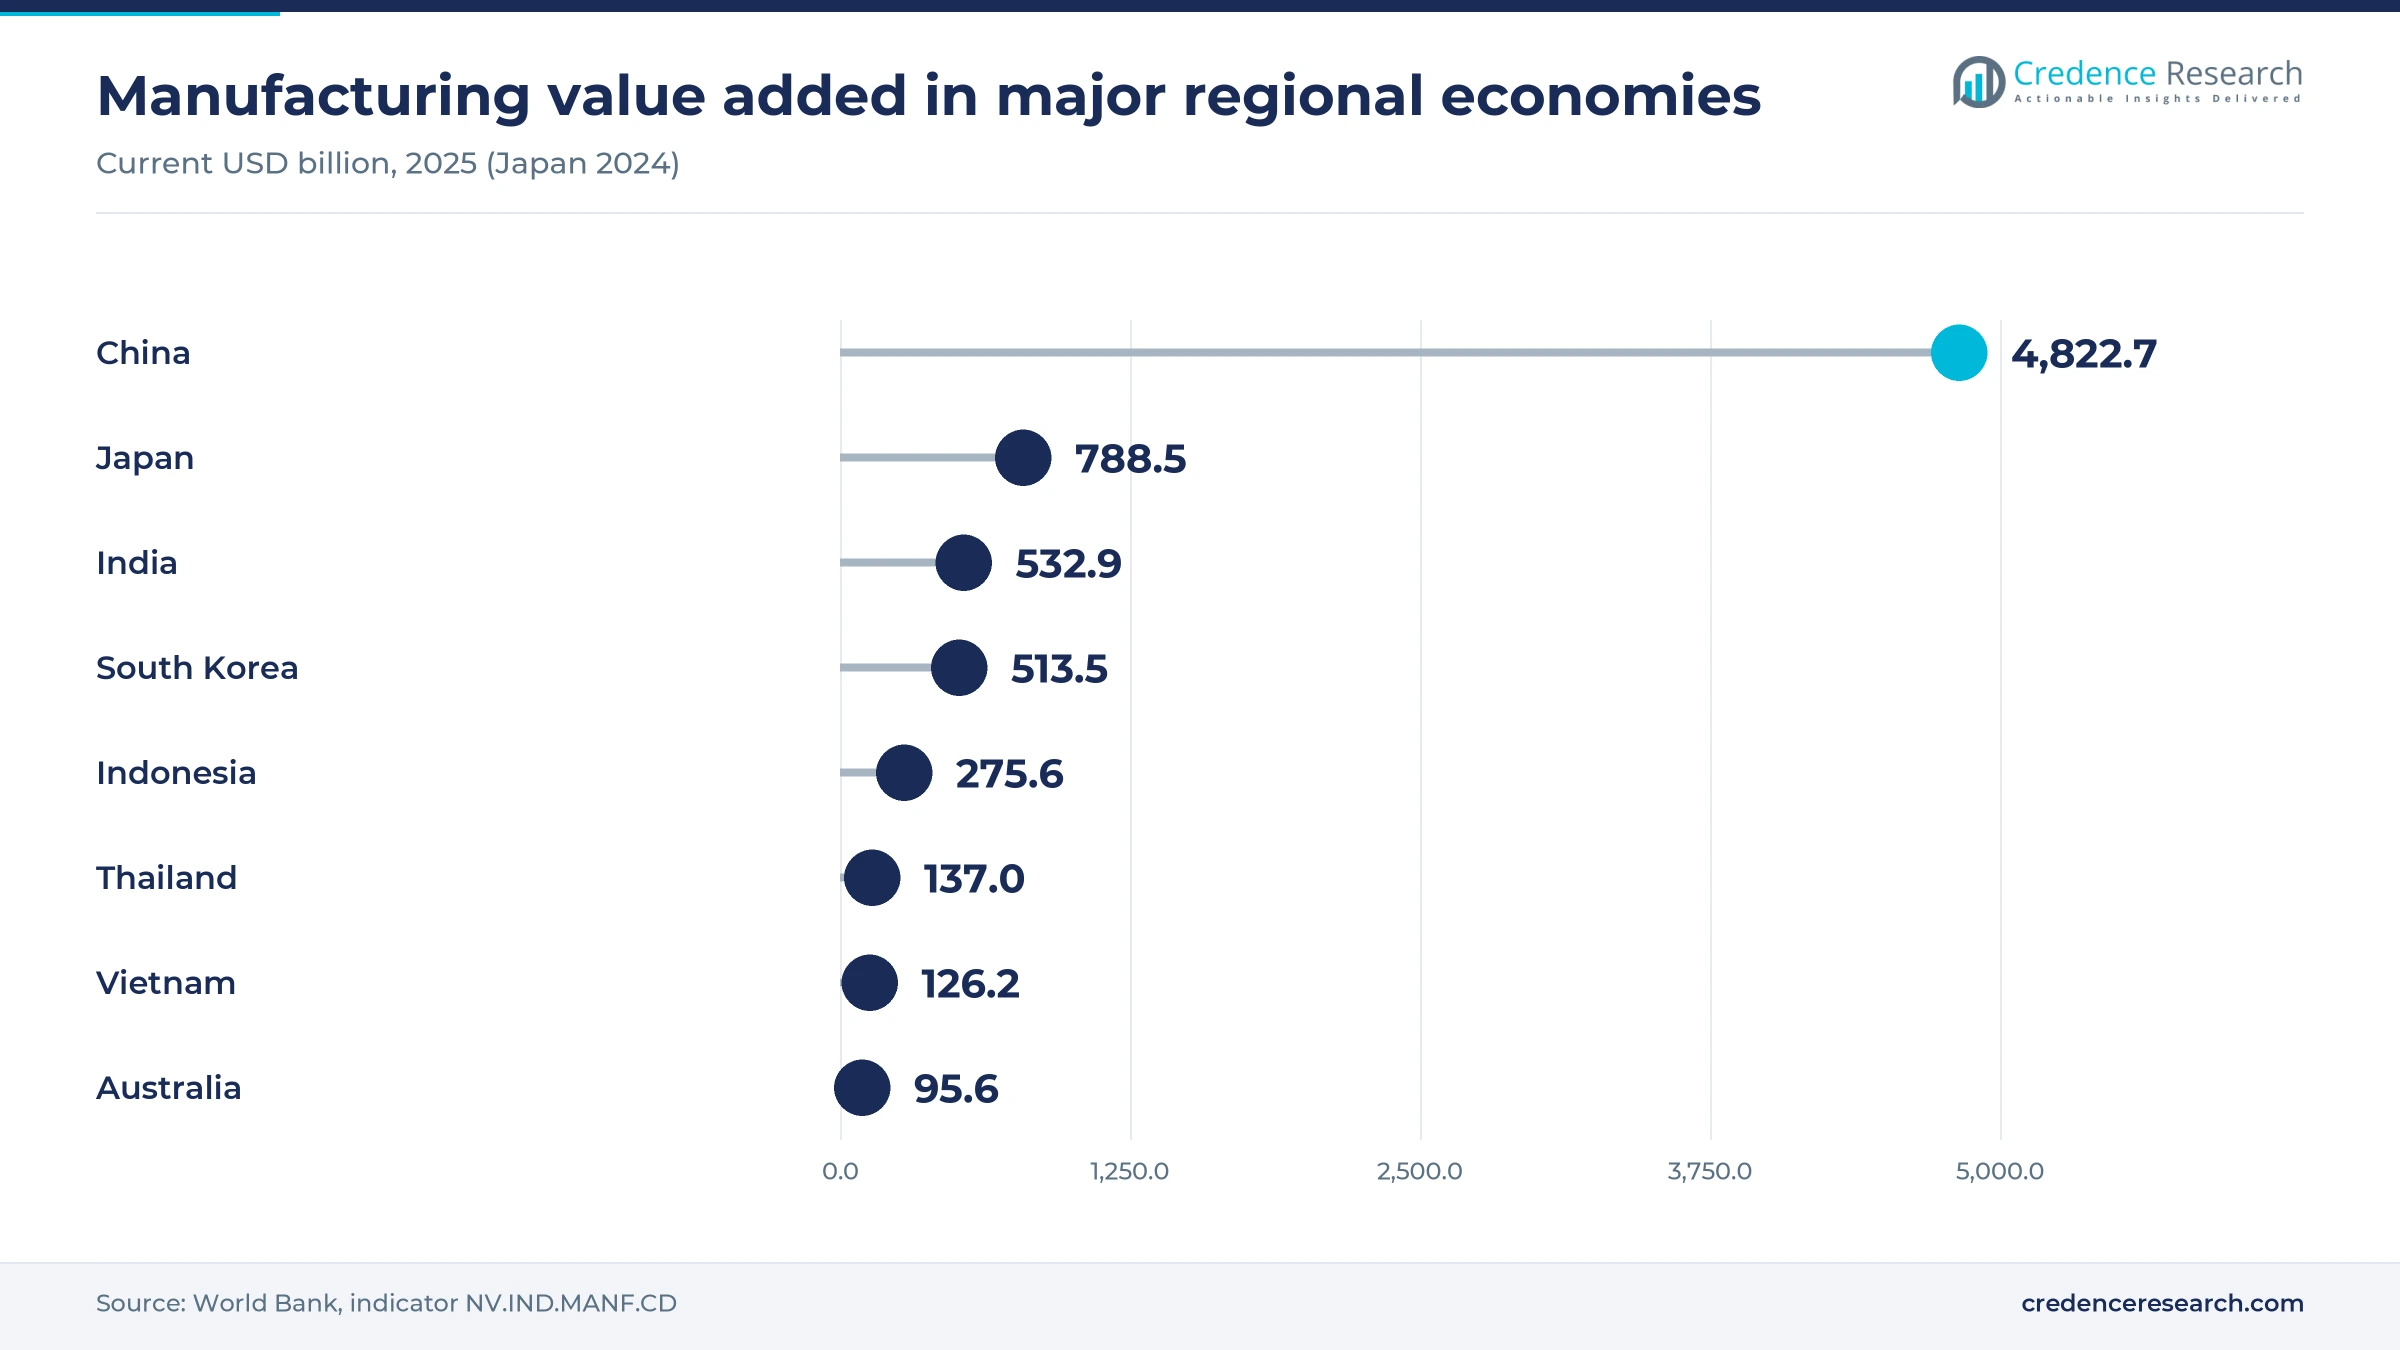
Northeast Asia held 70.9% of 2025 value and grows at 5.79% a year, the slowest pace apart from Oceania because Japan is mature. China Print drew about 120,000 visitors in May 2025, and World Bank data put China's 2025 manufacturing value added at USD 4,822.7 billion, the base for its packaging demand. Sprinter reported that Ricoh has a Pro VC80000 installed in China and placed its first Asian Pro Z75 in Taiwan, while Japanese commercial printing is still converting from offset.
South Asia grows fastest on Indian placements
South Asia held 12.7% of 2025 value and is the fastest-growing sub-region at 8.14% a year, starting from a much smaller installed base. India accounts for most spending, and Packaging South Asia reported in August 2026 that Ekta Graphics runs an HP Indigo 12000 HD in Roorkee, with B2 models on the way to the country. World Bank figures put India's 2025 manufacturing value added at USD 532.9 billion, which supports label and carton work in the sub-region.
Southeast Asia builds around Malaysia and Thailand
Southeast Asia held 10.8% of 2025 value and grows at 7.44% a year as converters serving multinational brands take short-run work. Konica Minolta told Labels & Labeling that Malaysia has its largest regional press base and that Thailand has the most scope, with new distributors planned for Indonesia and the Philippines. World Bank data show 2025 manufacturing value added of USD 275.6 billion in Indonesia, USD 137.0 billion in Thailand and USD 126.2 billion in Vietnam, which indicates where packaging demand concentrates.
Oceania is a replacement market led by Australia
Oceania held 5.6% of 2025 value and grows at 4.94% a year, the slowest pace in the region, because purchases are mostly replacements rather than new capacity. Australia Post's Letters service lost A$230.4 million in fiscal 2025, which signals continued pressure on mail printers. Label and commercial shops are still buying, as Mercury Walch's Hobart order and Ultra Labels' HP Indigo V12 purchase show. World Bank data put Australia's 2025 manufacturing value added at USD 95.6 billion.
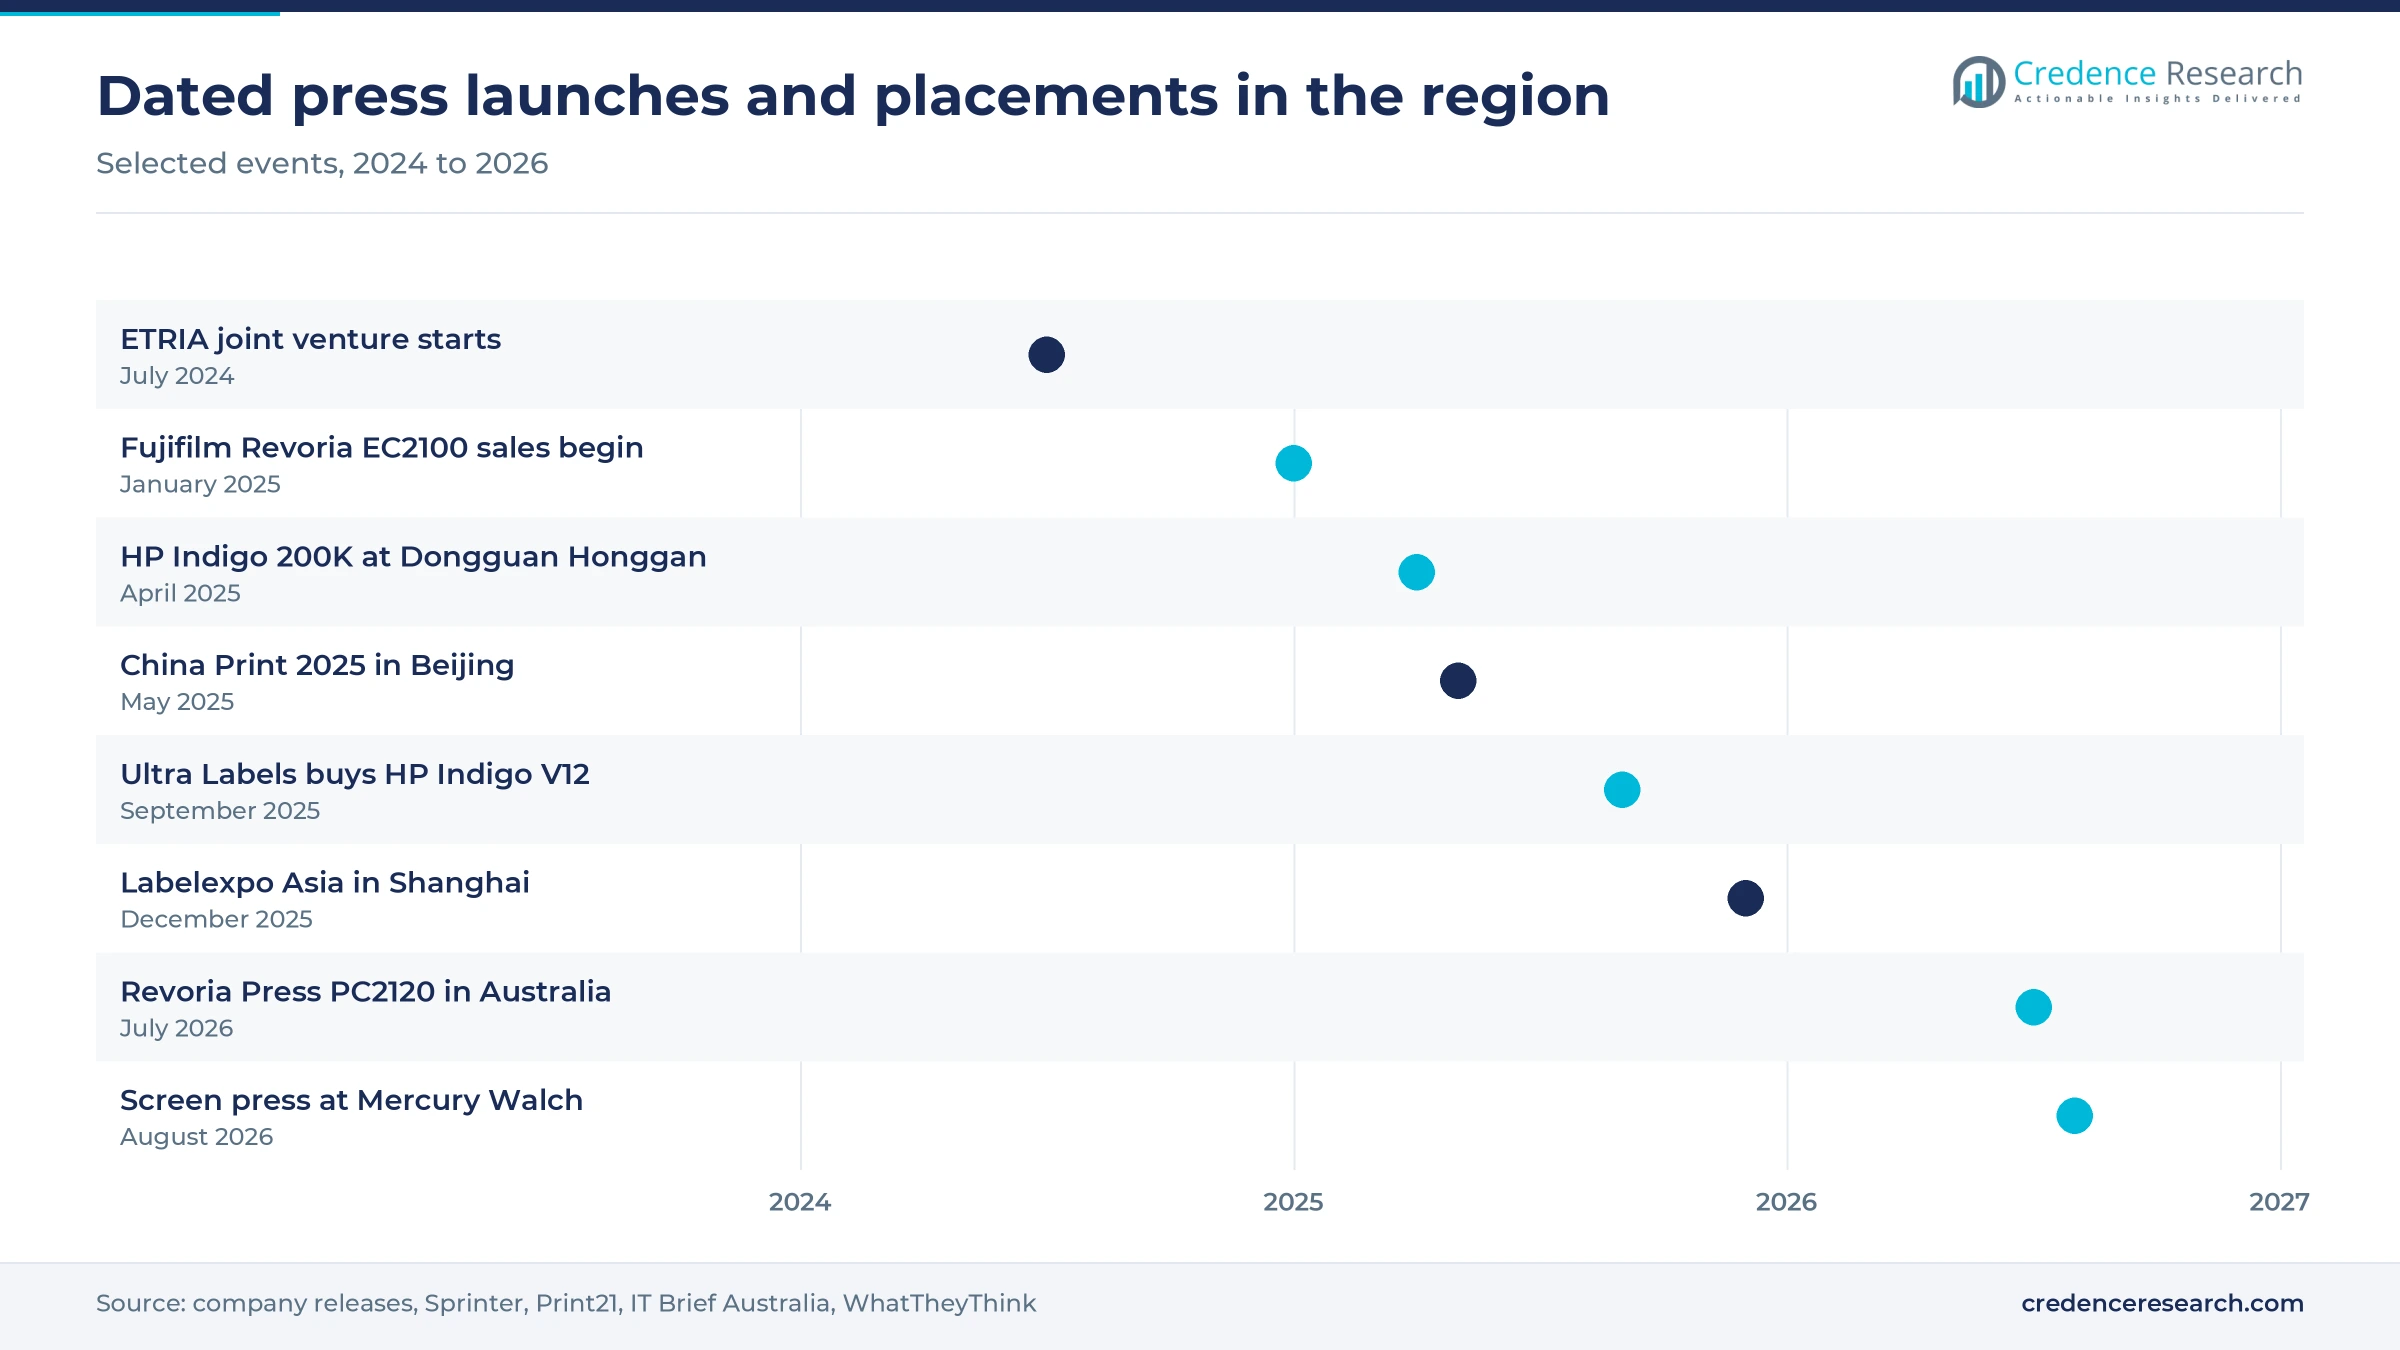
Press launches and placements from 2024 to 2026
| Development | Status and market relevance |
|---|---|
| In August 2026, Mercury Walch installed a Screen L350UV SAI-S digital label press in Hobart, supplied by Jet Technologies. | Installed; raises label speed from about 9 to 60 meters a minute |
| In July 2026, Fujifilm Business Innovation Australia unveiled the AI-assisted Revoria Press PC2120. | Launched in Australia; targets color quality without specialist operators |
| In December 2025, 12 Chinese inkjet label press makers exhibited at Labelexpo Asia in Shanghai. | Show closed; raises competition in narrow-web equipment |
| In September 2025, Ultra Labels & Flexpack became the first company in Australia and New Zealand to invest in the HP Indigo V12. | Sold; adds 120-meter-a-minute capacity for labels |
| In April 2025, Dongguan Honggan Packaging installed an HP Indigo 200K, reported as the 100th Indigo flexible packaging press in the region. | Installed; confirms packaging as a placement driver |
Toner, liquid toner and inkjet serve different run lengths
- Dry-toner electrophotography remains the commercial workhorse, and Fujifilm reaches 100 pages a minute at 2400 dpi on stock up to 400 gsm with the Revoria Press EC2100.
- Liquid electrophotography serves premium labels and flexible packaging, with the HP Indigo 200K printing up to 56 meters a minute on substrates up to 760 millimeters wide.
- Production inkjet carries the highest-volume work, as Canon rates its varioPRESS iV7 at 8,700 B2 sheets an hour using 1200 dpi piezo printheads and a conditioning liquid.
- Workflow software links presses to scheduling, and Konica Minolta adds automated quality control through its Intelligent Quality Optimizer on the AccurioPress C14010S.
Need a Custom Version of This Report?
Tailor the scope, geography, or segments to your exact requirements.
- Custom geography or segment scope
- Direct access to our analyst team
Japanese OEMs and HP face new Chinese press makers
Competition splits between Japanese engine makers, HP's liquid toner franchise and a growing group of Chinese inkjet builders. Canon, Ricoh, Konica Minolta and FUJIFILM compete hardest in cut-sheet toner and B2 inkjet, with each selling direct in major markets and through dealers elsewhere. HP holds a distinct position in liquid electrophotography through Indigo, supported by partners such as Currie Group in Australia and New Zealand. SCREEN and Kyocera bring inkjet engineering from Japan, Seiko Epson combines label presses with its Fiery software unit, and Heidelberg is entering Asian inkjet with the Jetfire 50. Xeikon competes on subscription terms in the narrow-web label segment. Chinese makers such as Zonten and Haotian offer entry-level models, while Arojet and Weigang push 1200 dpi speed in narrow-web equipment. Winning in this market increasingly depends on service reach, consumables contracts and workflow software rather than on press speed alone.
Companies profiled and their roles in this market
| Company | Type | Role in the market |
|---|---|---|
| Canon Inc. | Japanese OEM | Promoted the B2 varioPRESS iV7 through Canon Vietnam and combines Canon and Canon Production Printing technology for Japan |
| HP Inc. | Liquid toner OEM | Indigo presses installed in Dongguan and across Indian cities, with Currie Group as its Australia and New Zealand partner |
| Ricoh Company, Ltd. | Japanese OEM | Showed the Pro VC80000 and Pro Z75 at China Print 2025, with the first Asian Pro Z75 in Taiwan |
| Konica Minolta, Inc. | Japanese OEM | AccurioPress range sold in India and ASEAN, with AccurioLabel presses aimed at Southeast Asian converters |
| FUJIFILM Holdings Corporation | Japanese OEM | Revoria presses launched in Australia and shown in Vietnam, plus a verification base in India |
| SCREEN Holdings Co., Ltd. | Inkjet OEM | L350UV SAI-S label press installed at Mercury Walch in Hobart through Jet Technologies |
| Kyocera Corporation | Inkjet OEM and head maker | Showed the TASKalfa Pro 55000c at page2025 in Tokyo and supplies heads to Chinese label press builders |
| Seiko Epson Corporation | Inkjet OEM and head maker | Reported six SurePress L-5034 sales in China at Labelexpo Asia 2025 and owns Fiery |
| Heidelberger Druckmaschinen AG | Press OEM | Gave the Jetfire 50 its Asian debut at China Print, with Shengda Printing Technology as first Chinese user |
| Xeikon | Toner label OEM | Debuted the subscription-based Ecolyne press at Labelexpo Asia in Shanghai in December 2025 |
Consumables and software decide long-term vendor returns
Credence Research's view is that the machine sale is only the start of the value in this market, because consumables and software contracts earn returns for a decade after placement. The evidence from Hobart, Roorkee and Dongguan suggests buyers now choose suppliers partly on local service and application support. Chinese label press builders will test pricing first in narrow-web equipment, but wider adoption in commercial sheetfed work depends on coated-stock results and dependable service. Suppliers with established dealer networks in India and Southeast Asia therefore hold an advantage that is harder to copy than press speed.
How the regional estimates were built
The report uses 2025 as the base year and forecasts values to 2035 in USD million. Market values come from the Credence Research model, and segment and sub-regional splits are Credence Research estimates informed by public evidence. Sources used were company press releases, trade press reports, trade show reports and World Bank manufacturing data. Every fact cited in the report was checked on its source page. No interviews or surveys were conducted for this edition, so shares should be read as modeled estimates rather than audited sales data.
Inkjet and packaging carry growth through 2035
The market is expected to reach USD 5.85 billion by 2035, growing at a 6.25% CAGR over 2026–2035, with inkjet and packaging supplying most of the added value. Northeast Asia should stay the largest sub-region because China and Japan host the most press capacity and the main suppliers. South Asia should keep the fastest pace as Indian placements spread beyond large metros. The main uncertainty is how quickly Chinese press makers can move from labels into wider formats, since success there would lower equipment prices while bringing more printers into digital production.
Frequently Asked Questions
How big is the Asia-Pacific production printer market?
Which sub-region leads the market?
Which sub-region is growing fastest?
Which technology is the largest?
Why is packaging important to press demand?
What is holding the market back?
Which companies compete in this market?
How do suppliers earn revenue after the sale?
Table of Content
Chapter 1 Market Segmentation
- 1.1 Segmentation Framework
- 1.1.1 Product and Service Classification
- 1.1.2 Application and End-Use Classification
- 1.1.3 Technology and Solution Classification
- 1.1.4 Customer and Distribution Channel Classification
- 1.1.5 Geographic Segmentation
- 1.1.6 Market Segment Definitions and Boundaries
- 1.2 By Technology
- 1.2.1 Dry-Toner Electrophotography
- 1.2.2 Production Inkjet
- 1.2.3 Liquid Electrophotography
- 1.3 By Application
- 1.3.1 Commercial Print
- 1.3.2 Packaging Print
- 1.3.3 Transactional Documents
- 1.3.4 Publishing and In-Plant Print
- 1.4 By Production Method
- 1.4.1 Cut-Sheet
- 1.4.2 Wide-Web Continuous Feed
- 1.4.3 Narrow-Web Continuous Feed
- 1.5 By Revenue Model
- 1.5.1 OEM Consumables Revenue
- 1.5.2 Equipment Placement Revenue
- 1.5.3 Service and Bundled Software Revenue
- 1.6 By Sub-region
- 1.6.1 Northeast Asia
- 1.6.2 South Asia
- 1.6.3 Southeast Asia
- 1.6.4 Oceania
Chapter 2 Introduction
- 2.1 Report Objectives and Scope
- 2.2 Product Definition and Industry Terminology
- 2.3 Market Inclusions and Exclusions
- 2.4 Research Process
- 2.4.1 Primary Research and Expert Interviews
- 2.4.2 Secondary Research and Source Review
- 2.4.3 Top-Down and Bottom-Up Estimation
- 2.4.4 Data Triangulation and Verification
- 2.5 Market Size Measurement Basis
- 2.5.1 2025: USD 3.18 billion → 2035: USD 5.85 billion
- 2.6 Historical and Forecast Reference Periods
- 2.6.1 Historical Period: 2018-2025
- 2.6.2 Base Year: 2025
- 2.6.3 Forecast Period: 2025-2035
- 2.7 Research Assumptions and Limitations
Chapter 3 Executive Summary
- 3.1 Market Snapshot and Key Findings
- 3.2 Base-Year Market Size, 2025
- 3.3 Forecast Market Size, 2035
- 3.4 Revenue and Volume Growth Outlook
- 3.5 Key Demand and Supply Indicators
- 3.6 Leading Market Segments
- 3.7 Fastest-Growing Market Opportunities
- 3.8 Regional Performance Highlights
- 3.9 Technology and Industry Transformation
- 3.10 Competitive Landscape Summary
- 3.11 Analyst View and Strategic Implications
Chapter 4 Asia-Pacific Production Printer Market Trends and Developments
- 4.1 Historical Industry Development, 2018-2025
- 4.2 Recent Market Trends and Developments
- 4.3 Demand and Customer Behavior Trends
- 4.4 Technology and Product Innovation
- 4.5 Artificial Intelligence, Automation and Digitalization
- 4.6 Local Manufacturing and Supply Chain Realignment
- 4.7 Industry Partnerships, Mergers and Acquisitions
- 4.8 Sustainability and Circular Economy Developments
- 4.9 Government and Private Sector Investment Trends
- 4.10 Emerging Business Models and Commercialization
- 4.11 Industry Developments and Announcements
Chapter 5 Asia-Pacific Production Printer Market Production, Supply and Demand Analysis
- 5.1 Demand Trend and Consumption Analysis, 2018-2025
- 5.2 Demand Forecast, 2025-2035
- 5.3 Production and Output Trend, 2018-2025
- 5.4 Production and Output Forecast, 2025-2035
- 5.5 Installed Capacity and Capacity Utilization
- 5.6 Company-Wise Production Plants and Statistics
- 5.6.1 Installed Production Capacity
- 5.6.2 Actual Production
- 5.6.3 Planned Capacity and Expansion Targets
- 5.7 Supply Chain Structure and Procurement Trends
- 5.8 Supply-Demand Gap and Bottlenecks
- 5.9 Import Dependence and Sourcing Structure
- 5.10 Contract Manufacturing and Outsourcing
- 5.11 Regional Supply and Demand Concentration
Chapter 6 Asia-Pacific Production Printer Market Pricing Analysis
- 6.1 Pricing Structure and Measurement
- 6.2 Historical Pricing Trends, 2018-2025
- 6.3 Pricing Outlook, 2025-2035
- 6.4 Average Selling Price and Unit Economics
- 6.5 Pricing by Product and Market Segment
- 6.6 Geographic Pricing Differences
- 6.7 Key Input, Energy, Labor and Logistics Costs
- 6.8 Contract Pricing and Purchasing Models
- 6.9 Pricing Sensitivity and Competitive Positioning
- 6.10 Price, Margin and Profitability Implications
Chapter 7 Asia-Pacific Production Printer Market Dynamics
- 7.1 Market Growth Drivers
- 7.1.1 Demand-Side Drivers
- 7.1.2 Technology and Innovation Drivers
- 7.1.3 Infrastructure and Investment Drivers
- 7.1.4 Regulatory and Policy Drivers
- 7.2 Market Restraints
- 7.2.1 Cost and Affordability Constraints
- 7.2.2 Technology and Adoption Barriers
- 7.2.3 Supply Chain and Operational Constraints
- 7.3 Market Challenges
- 7.3.1 Competitive Pressure and Margin Erosion
- 7.3.2 Skills, Infrastructure and Implementation Gaps
- 7.4 Emerging Market Opportunities
- 7.5 Market Dynamics Impact and Time-Horizon Assessment
Chapter 8 Asia-Pacific Production Printer Value Chain Analysis
- 8.1 Industry Value Chain Overview
- 8.2 Upstream Suppliers and Critical Inputs
- 8.3 Technology and Component Providers
- 8.4 Manufacturing or Service Delivery
- 8.5 Distribution, Channel Partners and Integrators
- 8.6 Downstream Applications and End Users
- 8.7 Value Addition and Profit Pools
- 8.8 Vertical Integration and Outsourcing
- 8.9 Supplier Concentration and Risk
- 8.10 Supply Chain Localization and Resilience
Chapter 9 Asia-Pacific Production Printer Market Regulations and Policies
- 9.1 Relevant Laws, Standards and Compliance Frameworks
- 9.2 Product, Service, Safety and Quality Requirements
- 9.3 Government Policies, Incentives and Subsidies
- 9.4 Imports, Exports and Trade Barriers
- 9.5 Public Procurement and Local Content Requirements
- 9.6 Environmental and Sustainability Compliance
- 9.7 Upcoming Policy Changes and Market Implications
Chapter 10 Asia-Pacific Production Printer Market Hotspots and Opportunities
- 10.1 Market Opportunity Mapping and Growth Hotspots
- 10.2 High-Growth Applications and Customer Groups
- 10.3 Underserved Markets and White-Space Opportunities
- 10.4 Emerging Technology and Product Opportunities
- 10.5 New Capacity and Investment Hotspots
- 10.6 Market Entry and Expansion Opportunities
- 10.7 Distribution and Partnership Opportunities
- 10.8 Near-Term and Long-Term Commercial Potential
- 10.9 Opportunity Attractiveness and Execution Risks
Chapter 11 Asia-Pacific Production Printer Market Outlook, 2025-2035
- 11.1 Market Size and Analysis
- 11.1.1 Revenue (Market Measurement: 2025: USD 3.18 billion → 2035: USD 5.85 billion)
- 11.1.2 Market Volume and Quantity Sold
- 11.1.3 Historical Market Size, 2018-2025
- 11.1.4 Base-Year Market Size, 2025
- 11.2 Market Forecast, 2025-2035
- 11.2.1 Revenue Forecast to 2035
- 11.2.2 Volume Forecast to 2035
- 11.2.3 CAGR and Year-on-Year Growth
- 11.2.4 Incremental Revenue Opportunity
- 11.3 Forecast Assumptions and Scenario Analysis
- 11.3.1 Base-Case Forecast
- 11.3.2 Optimistic and Conservative Scenarios
- 11.3.3 Technology, Pricing and Policy Sensitivities
- 11.4 Market Attractiveness and Growth Outlook
Chapter 12 Asia-Pacific Production Printer Market Segmentation and Outlook
- 12.1 Segmentation Summary and Market Shares, 2025
- 12.2 Largest and Fastest-Growing Segments
- 12.3 By Technology - Market Size and Forecast, 2025-2035
- 12.3.1 Segment Definition and Scope
- 12.3.2 Historical Market Size, 2018-2025
- 12.3.3 Revenue Forecast, 2025-2035
- 12.3.4 Volume Forecast, 2025-2035
- 12.3.5 Base-Year Market Share, 2025
- 12.3.6 Segment CAGR and Growth Drivers
- 12.3.7 Subsegment Market Size and Forecast
- 12.3.7.1 Dry-Toner Electrophotography
- 12.3.7.2 Production Inkjet
- 12.3.7.3 Liquid Electrophotography
- 12.3.8 Subsegment Pricing and Adoption Trends
- 12.3.9 Leading Suppliers and Competition
- 12.3.10 Regional Demand and Opportunities
- 12.4 By Application - Market Size and Forecast, 2025-2035
- 12.4.1 Segment Definition and Scope
- 12.4.2 Historical Market Size, 2018-2025
- 12.4.3 Revenue Forecast, 2025-2035
- 12.4.4 Volume Forecast, 2025-2035
- 12.4.5 Base-Year Market Share, 2025
- 12.4.6 Segment CAGR and Growth Drivers
- 12.4.7 Subsegment Market Size and Forecast
- 12.4.7.1 Commercial Print
- 12.4.7.2 Packaging Print
- 12.4.7.3 Transactional Documents
- 12.4.7.4 Publishing and In-Plant Print
- 12.4.8 Subsegment Pricing and Adoption Trends
- 12.4.9 Leading Suppliers and Competition
- 12.4.10 Regional Demand and Opportunities
- 12.5 By Production Method - Market Size and Forecast, 2025-2035
- 12.5.1 Segment Definition and Scope
- 12.5.2 Historical Market Size, 2018-2025
- 12.5.3 Revenue Forecast, 2025-2035
- 12.5.4 Volume Forecast, 2025-2035
- 12.5.5 Base-Year Market Share, 2025
- 12.5.6 Segment CAGR and Growth Drivers
- 12.5.7 Subsegment Market Size and Forecast
- 12.5.7.1 Cut-Sheet
- 12.5.7.2 Wide-Web Continuous Feed
- 12.5.7.3 Narrow-Web Continuous Feed
- 12.5.8 Subsegment Pricing and Adoption Trends
- 12.5.9 Leading Suppliers and Competition
- 12.5.10 Regional Demand and Opportunities
- 12.6 By Revenue Model - Market Size and Forecast, 2025-2035
- 12.6.1 Segment Definition and Scope
- 12.6.2 Historical Market Size, 2018-2025
- 12.6.3 Revenue Forecast, 2025-2035
- 12.6.4 Volume Forecast, 2025-2035
- 12.6.5 Base-Year Market Share, 2025
- 12.6.6 Segment CAGR and Growth Drivers
- 12.6.7 Subsegment Market Size and Forecast
- 12.6.7.1 OEM Consumables Revenue
- 12.6.7.2 Equipment Placement Revenue
- 12.6.7.3 Service and Bundled Software Revenue
- 12.6.8 Subsegment Pricing and Adoption Trends
- 12.6.9 Leading Suppliers and Competition
- 12.6.10 Regional Demand and Opportunities
- 12.7 By Sub-region - Market Size and Forecast, 2025-2035
- 12.7.1 Segment Definition and Scope
- 12.7.2 Historical Market Size, 2018-2025
- 12.7.3 Revenue Forecast, 2025-2035
- 12.7.4 Volume Forecast, 2025-2035
- 12.7.5 Base-Year Market Share, 2025
- 12.7.6 Segment CAGR and Growth Drivers
- 12.7.7 Subsegment Market Size and Forecast
- 12.7.7.1 Northeast Asia
- 12.7.7.2 South Asia
- 12.7.7.3 Southeast Asia
- 12.7.7.4 Oceania
- 12.7.8 Subsegment Pricing and Adoption Trends
- 12.7.9 Leading Suppliers and Competition
- 12.7.10 Regional Demand and Opportunities
- 12.8 Segment Growth Comparison
- 12.9 Segment Attractiveness and Priority Matrix
Chapter 13 Asia-Pacific Production Printer End-Use and Application Market Outlook
- 13.1 End-Use Industry and Customer Demand Structure
- 13.2 Leading Applications and Customer Groups
- 13.3 End-Use Market Size, Share and Forecast
- 13.4 Major End-Use Industry Deep Dives
- 13.4.1 Customer Requirements and Use Cases
- 13.4.2 Demand and Replacement Cycles
- 13.4.3 Technical and Regulatory Considerations
- 13.4.4 Purchasing and Procurement Models
- 13.4.5 Leading Vendors and Distribution Channels
- 13.4.6 Forecast and Commercial Opportunities
- 13.5 Emerging Applications and Cross-Segment Demand
- 13.6 End-Use Industry Investment Priorities
Chapter 14 Asia-Pacific Production Printer Geographic Market Outlook, 2025-2035
- 14.1 Regional Market Size and Country-Level Shares, 2025
- 14.2 Country Market Size Comparison, 2025
- 14.3 Country Market Forecasts, 2025-2035
- 14.4 Subregional Industrial and Demand Clusters
- 14.5 Intra-Regional Pricing and Cost Differences
- 14.6 Cross-Border Trade and Supply Networks
- 14.7 Regional Supply and Demand Balances
- 14.8 Country Opportunity Comparison and Prioritization
Note: Every listed country is covered on the structure shown under the first country.
Chapter 15 Asia-Pacific Production Printer Technology, Innovation and Sustainability Outlook
- 15.1 Technology Landscape and Maturity
- 15.2 Product, Process and Service Innovation
- 15.3 AI, Automation and Digital Tools in the Industry
- 15.4 Technology Adoption and Performance Benchmarking
- 15.5 Innovation Pipeline and R&D Investment
- 15.6 Patent and Intellectual Property Trends
- 15.7 Energy Efficiency and Resource Management
- 15.8 Sustainability, Recycling and Circularity
- 15.9 Technology Roadmap, 2025-2035
- 15.10 Risks of Obsolescence and Technology Substitution
Chapter 16 Asia-Pacific Production Printer Market Key Strategic Imperatives
- 16.1 Growth and Market Entry Priorities
- 16.2 High-Return Products and Segments
- 16.3 Pricing, Profitability and Cost Optimization
- 16.4 Technology Investment and Product Differentiation
- 16.5 Supply Chain Localization and Resilience
- 16.6 Distribution and Customer Acquisition
- 16.7 Partnership, Acquisition and Capacity Strategy
- 16.8 Regional Expansion Priorities
- 16.9 Short-, Medium- and Long-Term Actions
Chapter 17 Competition Outlook
- 17.1 Industry Competition Characteristics
- 17.2 Market Structure and Concentration
- 17.3 Market Share and Competitive Positioning, 2025
- 17.4 Company-Wise Revenue and Product Benchmarking
- 17.5 Production and Service Capacity Benchmarking
- 17.6 Technology, Pricing and Differentiation
- 17.7 Regional Footprint and Distribution Strength
- 17.8 Mergers, Acquisitions and Strategic Alliances
- 17.9 New Entrants and Competitive Threats
- 17.10 Porter's Five Forces and Industry Attractiveness
- 17.11 Competitive Outlook, 2025-2035
Chapter 18 Company Profiles
- 18.1 Company Coverage and Selection Criteria
- 18.2 Canon Inc.
- 18.2.1 Business Description
- 18.2.2 Company Ownership and Geographic Presence
- 18.2.3 Product and Service Portfolio
- 18.2.4 Manufacturing and Operating Footprint
- 18.2.5 Production Capacity and Expansion Plans
- 18.2.6 Financial Performance and Investment
- 18.2.7 Market Share and Competitive Position
- 18.2.8 Technology and Innovation Capabilities
- 18.2.9 Strategic Alliances or Partnerships
- 18.2.10 Recent Developments
- 18.2.11 Growth Strategy and Outlook
- 18.3 HP Inc.
- 18.4 Ricoh Company, Ltd.
- 18.5 Konica Minolta, Inc.
- 18.6 FUJIFILM Holdings Corporation
- 18.7 SCREEN Holdings Co., Ltd.
- 18.8 Kyocera Corporation
- 18.9 Seiko Epson Corporation
- 18.10 Heidelberger Druckmaschinen AG
- 18.11 Xeikon
- 18.12 Other Relevant Market Participants
Note: Every listed company is profiled on the structure shown under the first company. The company list is preliminary and may change based on research findings, market developments, data availability and client requirements.
Chapter 19 Disclaimer
- 19.1 Research and Forecast Disclaimer
- 19.2 Data Source and Estimation Limitations
Note: The depth of individual sections depends on data availability for this market. Volume, capacity, trade and other unit-based metrics are included where applicable.

