
Radars, radios and EW suites anchor Indian military spending
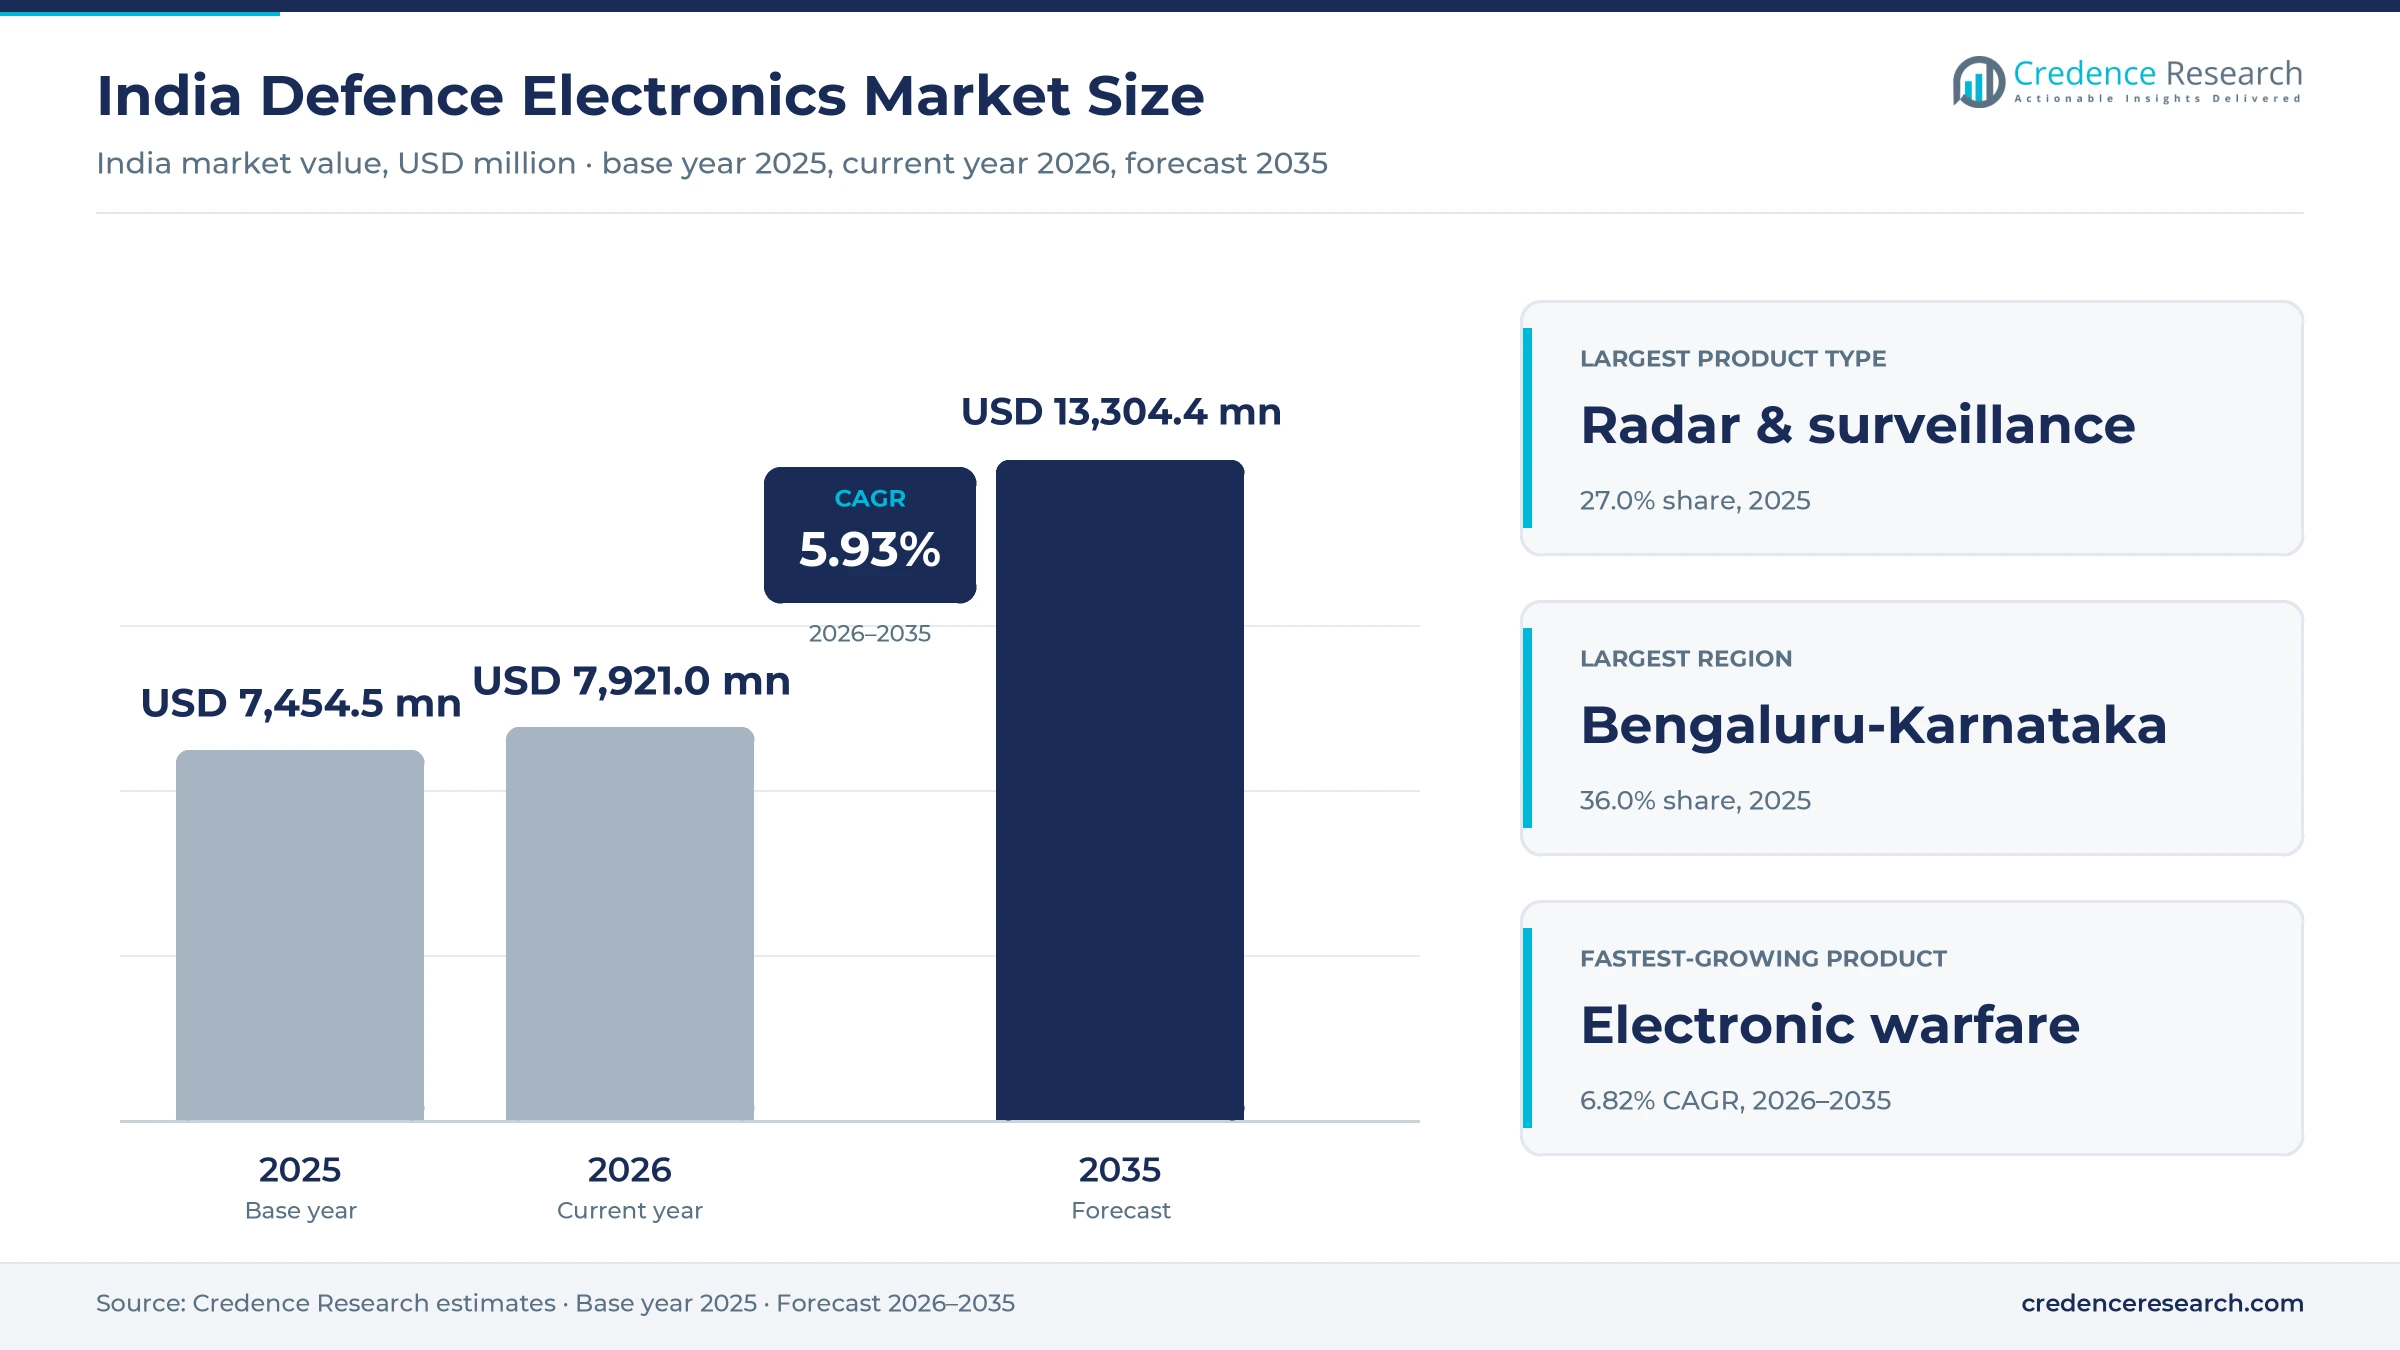
The India defence electronics market was valued at USD 7.45 billion in 2025 and is projected to increase from USD 7.92 billion in 2026 to USD 13.30 billion by 2035, registering a CAGR of 5.93% during 2026–2035. Demand comes from the Indian Army, Air Force, Navy and Coast Guard as they replace imported radars, radios and self-protection suites with systems designed and built in India. The Bengaluru-Karnataka Cluster held the largest regional share, 36.0% in 2025, because Bharat Electronics, Hindustan Aeronautics and several DRDO laboratories design and integrate systems there. The Uttar Pradesh Defence Corridor is the fastest-growing region at 7.26% a year, as new plants in Aligarh, Lucknow and Kanpur start production. Procurement policy has also tightened in favor of local suppliers, because about 75% of the capital acquisition budget for 2026-27 is reserved for domestic industry. As a result, private design houses now win more subsystem work alongside the large public sector producers.
What does the estimate count, from radar arrays to fire-control computers?
The estimate measures the value of radar and surveillance systems, communication and C4ISR systems, electronic warfare and countermeasure systems, electro-optics and fire-control systems, and avionics delivered by suppliers in India. Values are stated at the prices that the armed forces, the Coast Guard and foreign defense ministries pay through Ministry of Defence contracts, subcontracts from public sector producers and joint ventures, and export orders.
The estimate excludes airframes, hulls, vehicles, engines, missiles and munitions themselves, as well as civil electronics and police equipment. The value chain runs from RF components, printed circuit boards and embedded software through module and subsystem makers to system integrators, and onward to platform builders, depots and field units.
India Defence Electronics Market Insights
- The India defence electronics market was valued at USD 7.45 billion in 2025 and is projected to reach USD 13.30 billion by 2035, registering a CAGR of 5.93% during 2026–2035.
- The Bengaluru-Karnataka Cluster held a 36.0% share of 2025 value, because the state builds about 67% of aircraft and helicopters made for the armed forces.
- Radar and surveillance systems led with a 27.0% share of 2025 value, because air defense and border surveillance programs buy radars in large numbers.
- Defense production in India reached a record INR 1.78 lakh crore in 2025-26, up 15.6% from INR 1.54 lakh crore a year earlier.
- About 75% of the 2026-27 capital acquisition budget, or INR 1.39 lakh crore, is reserved for procurement from domestic defense industry.
Radar systems lead while electronic warfare grows fastest
Why do radar and surveillance systems lead product demand?
Based on product type, the market is categorized into radar and surveillance systems, communication and C4ISR systems, electronic warfare and countermeasure systems, electro-optics and fire-control systems, and avionics. Radar & Surveillance Systems led with a 27.0% share of 2025 value, because air defense and border programs buy radars in large numbers. Electronic Warfare & Countermeasure Systems grow fastest at 6.82% a year, as helicopters, fighters and ground units add jamming and self-protection suites.
Which platforms carry the most electronics value?
Based on platform, the market is categorized into land platforms, airborne platforms, naval platforms, plus space and strategic platforms. Land Platforms led with 35.0% of 2025 value, because the army fields radars, radios, fire-control systems and air defense networks across long borders. Space & Strategic Platforms grow fastest at 7.06% a year, as satellite communication, ground stations and strategic sensors receive more capital funding.
How do surveillance and electronic attack split the application mix?
Based on application, the market is categorized into surveillance and target acquisition, command, control and secure networking, electronic attack and protection, and weapons guidance and fire control. Surveillance & Target Acquisition led with 33.0% of 2025 value, because every air defense battery and border post depends on radar and optical detection. Electronic Attack & Protection grows fastest at 6.75% a year, as drone threats raise demand for jammers.
Which services account for the largest purchases?
Based on customer type, the market is categorized into the Indian Army, the Indian Air Force, the Indian Navy and Coast Guard, and export defense ministries. The Indian Army led with 37.0% of 2025 value, because it operates the largest number of radars, radios and air defense units. Export Defence Ministries grow fastest at 8.21% a year, as Indian suppliers win more orders from friendly foreign governments.
| Segment Group | Leading Sub-segment | Share, 2025 | Fastest-growing Sub-segment | CAGR, 2026–2035 |
|---|---|---|---|---|
| By Product Type | Radar & Surveillance Systems | 27.0% | Electronic Warfare & Countermeasure Systems | 6.82% |
| By Platform | Land Platforms | 35.0% | Space & Strategic Platforms | 7.06% |
| By Application | Surveillance & Target Acquisition | 33.0% | Electronic Attack & Protection | 6.75% |
| By Customer Type | Indian Army | 37.0% | Export Defence Ministries | 8.21% |
Request a Free Sample
Fill in your details and we'll send you a free sample report.
- Sample data tables & charts
- Research methodology
Local buying rules and record output lift electronics orders
How does the domestic procurement preference steer orders?
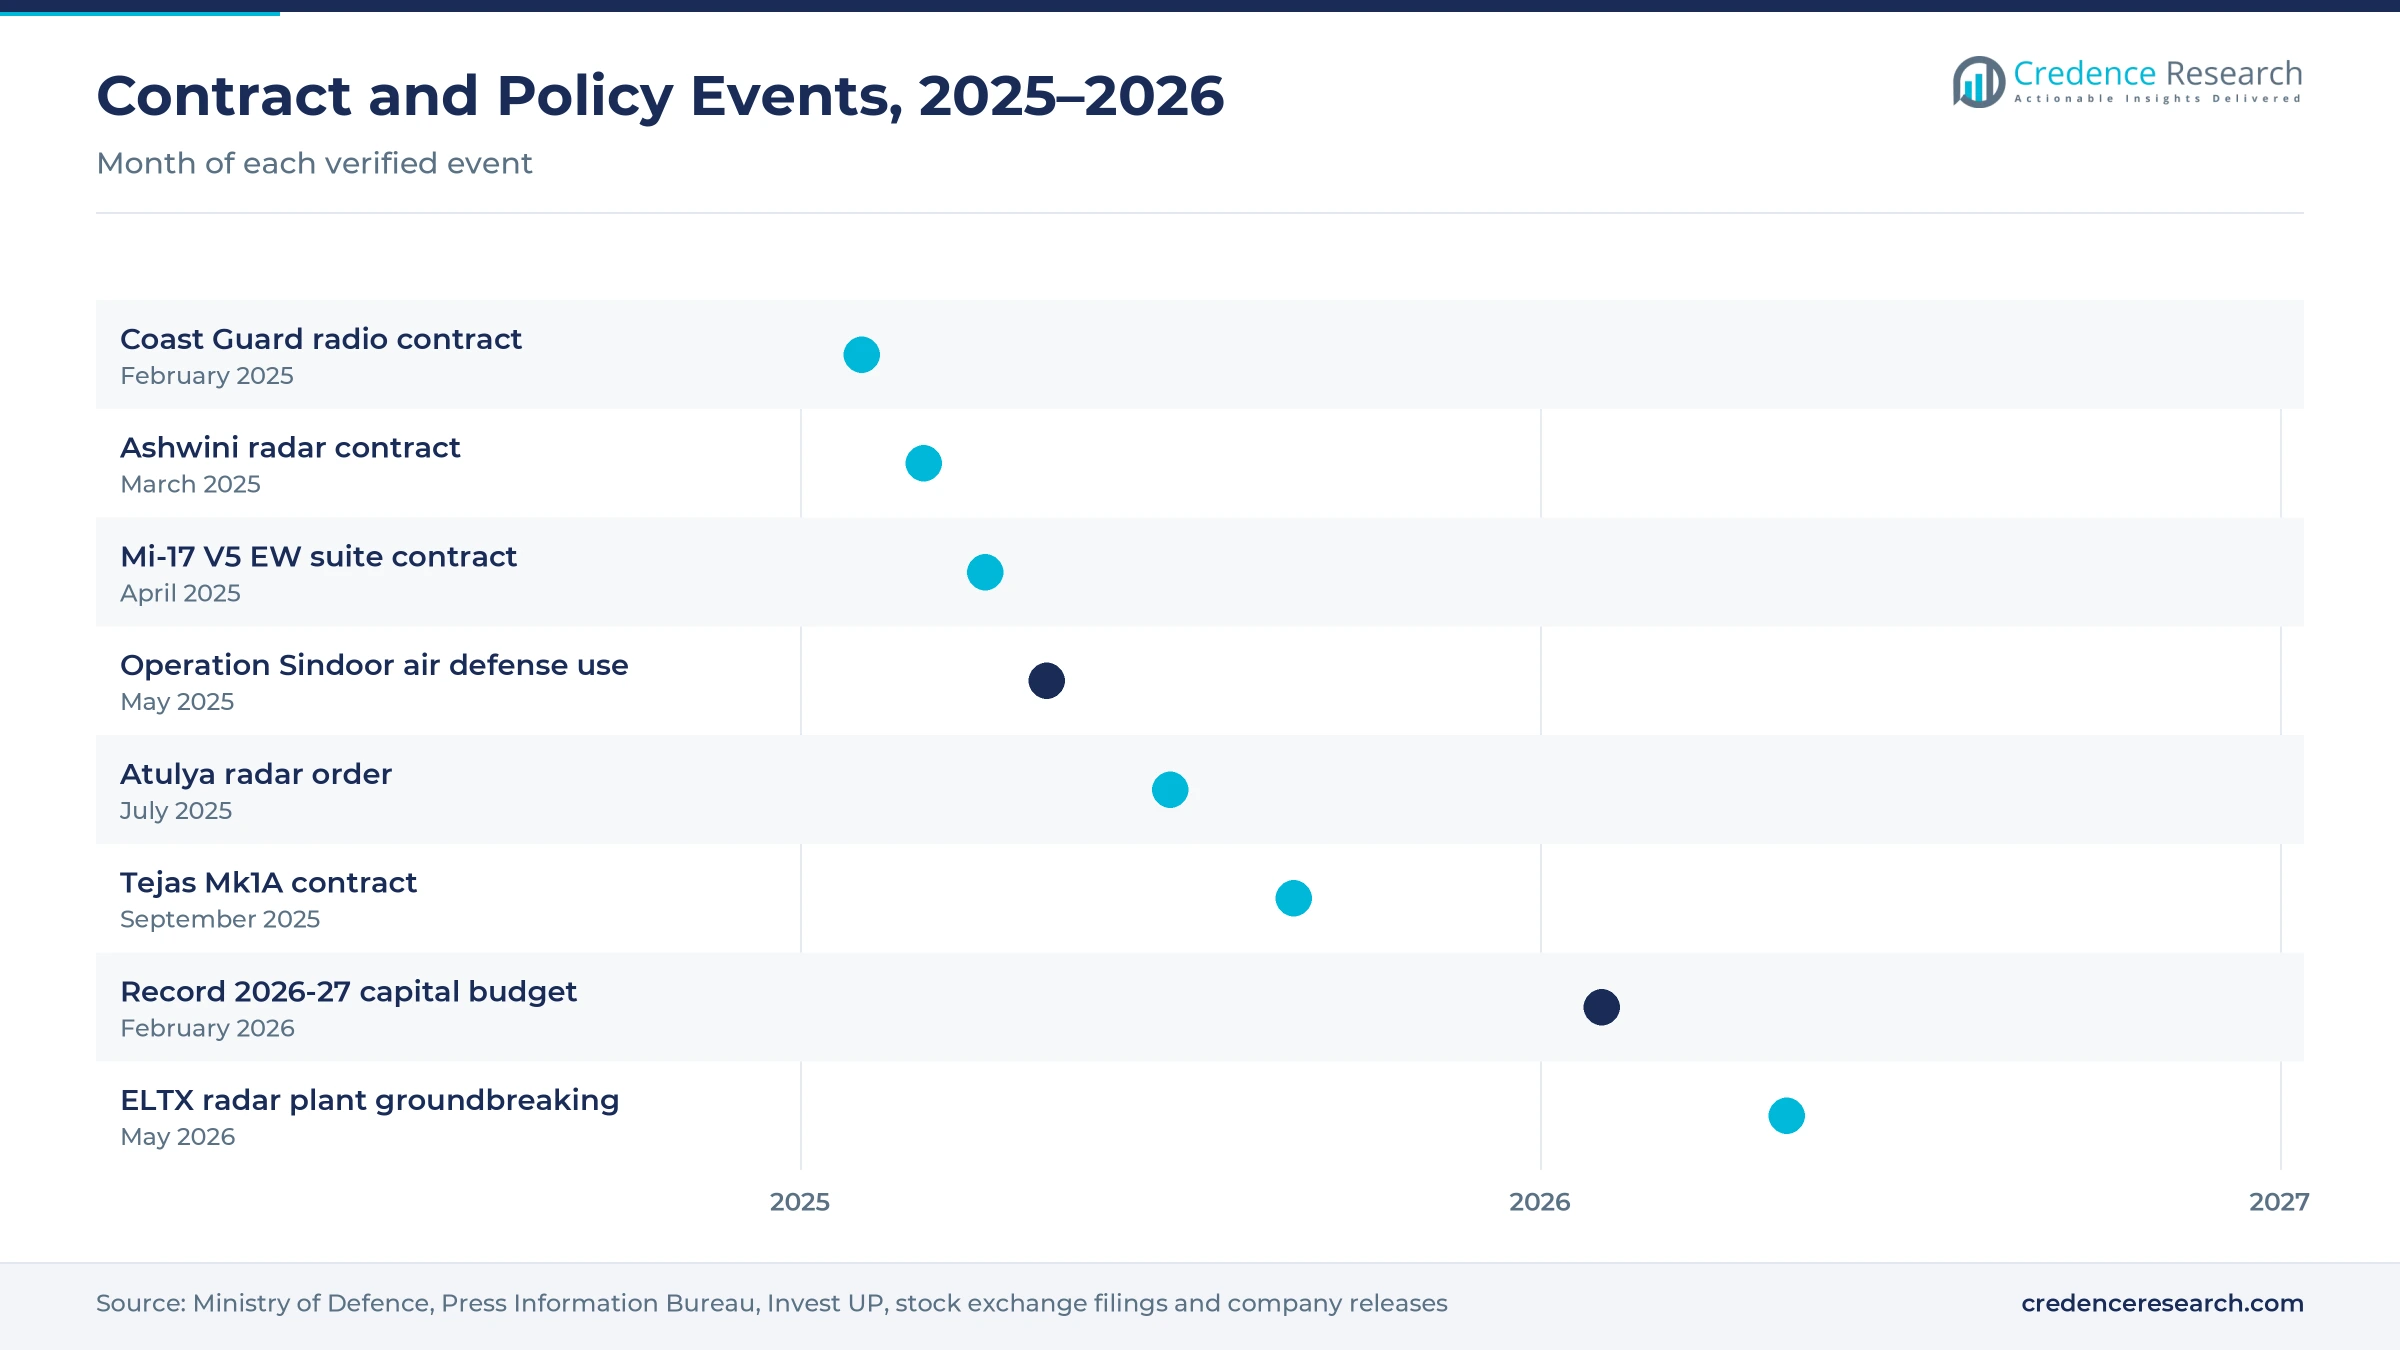
Procurement rules now reserve most modernization money for Indian suppliers, which channels electronics orders toward domestic design houses and factories. The Ministry of Defence earmarked INR 1.39 lakh crore for procurement from domestic industry in 2026-27, about 75% of the capital acquisition budget, according to the Press Information Bureau. In 2024-25, Indian vendors won 177 of 193 capital contracts, which accounted for 81% of contract value, according to an April 2025 ministry factsheet. The ministry also placed its INR 2,385.36 crore Mi-17 V5 electronic warfare suite contract with Bharat Electronics, signed on April 7, 2025, under the Buy Indian-IDDM category, and most subassemblies will come from Indian makers, according to the Ministry of Defence. As a result, local firms capture a rising share of spending that once went abroad.
Why does record production and modernization scale lift demand?
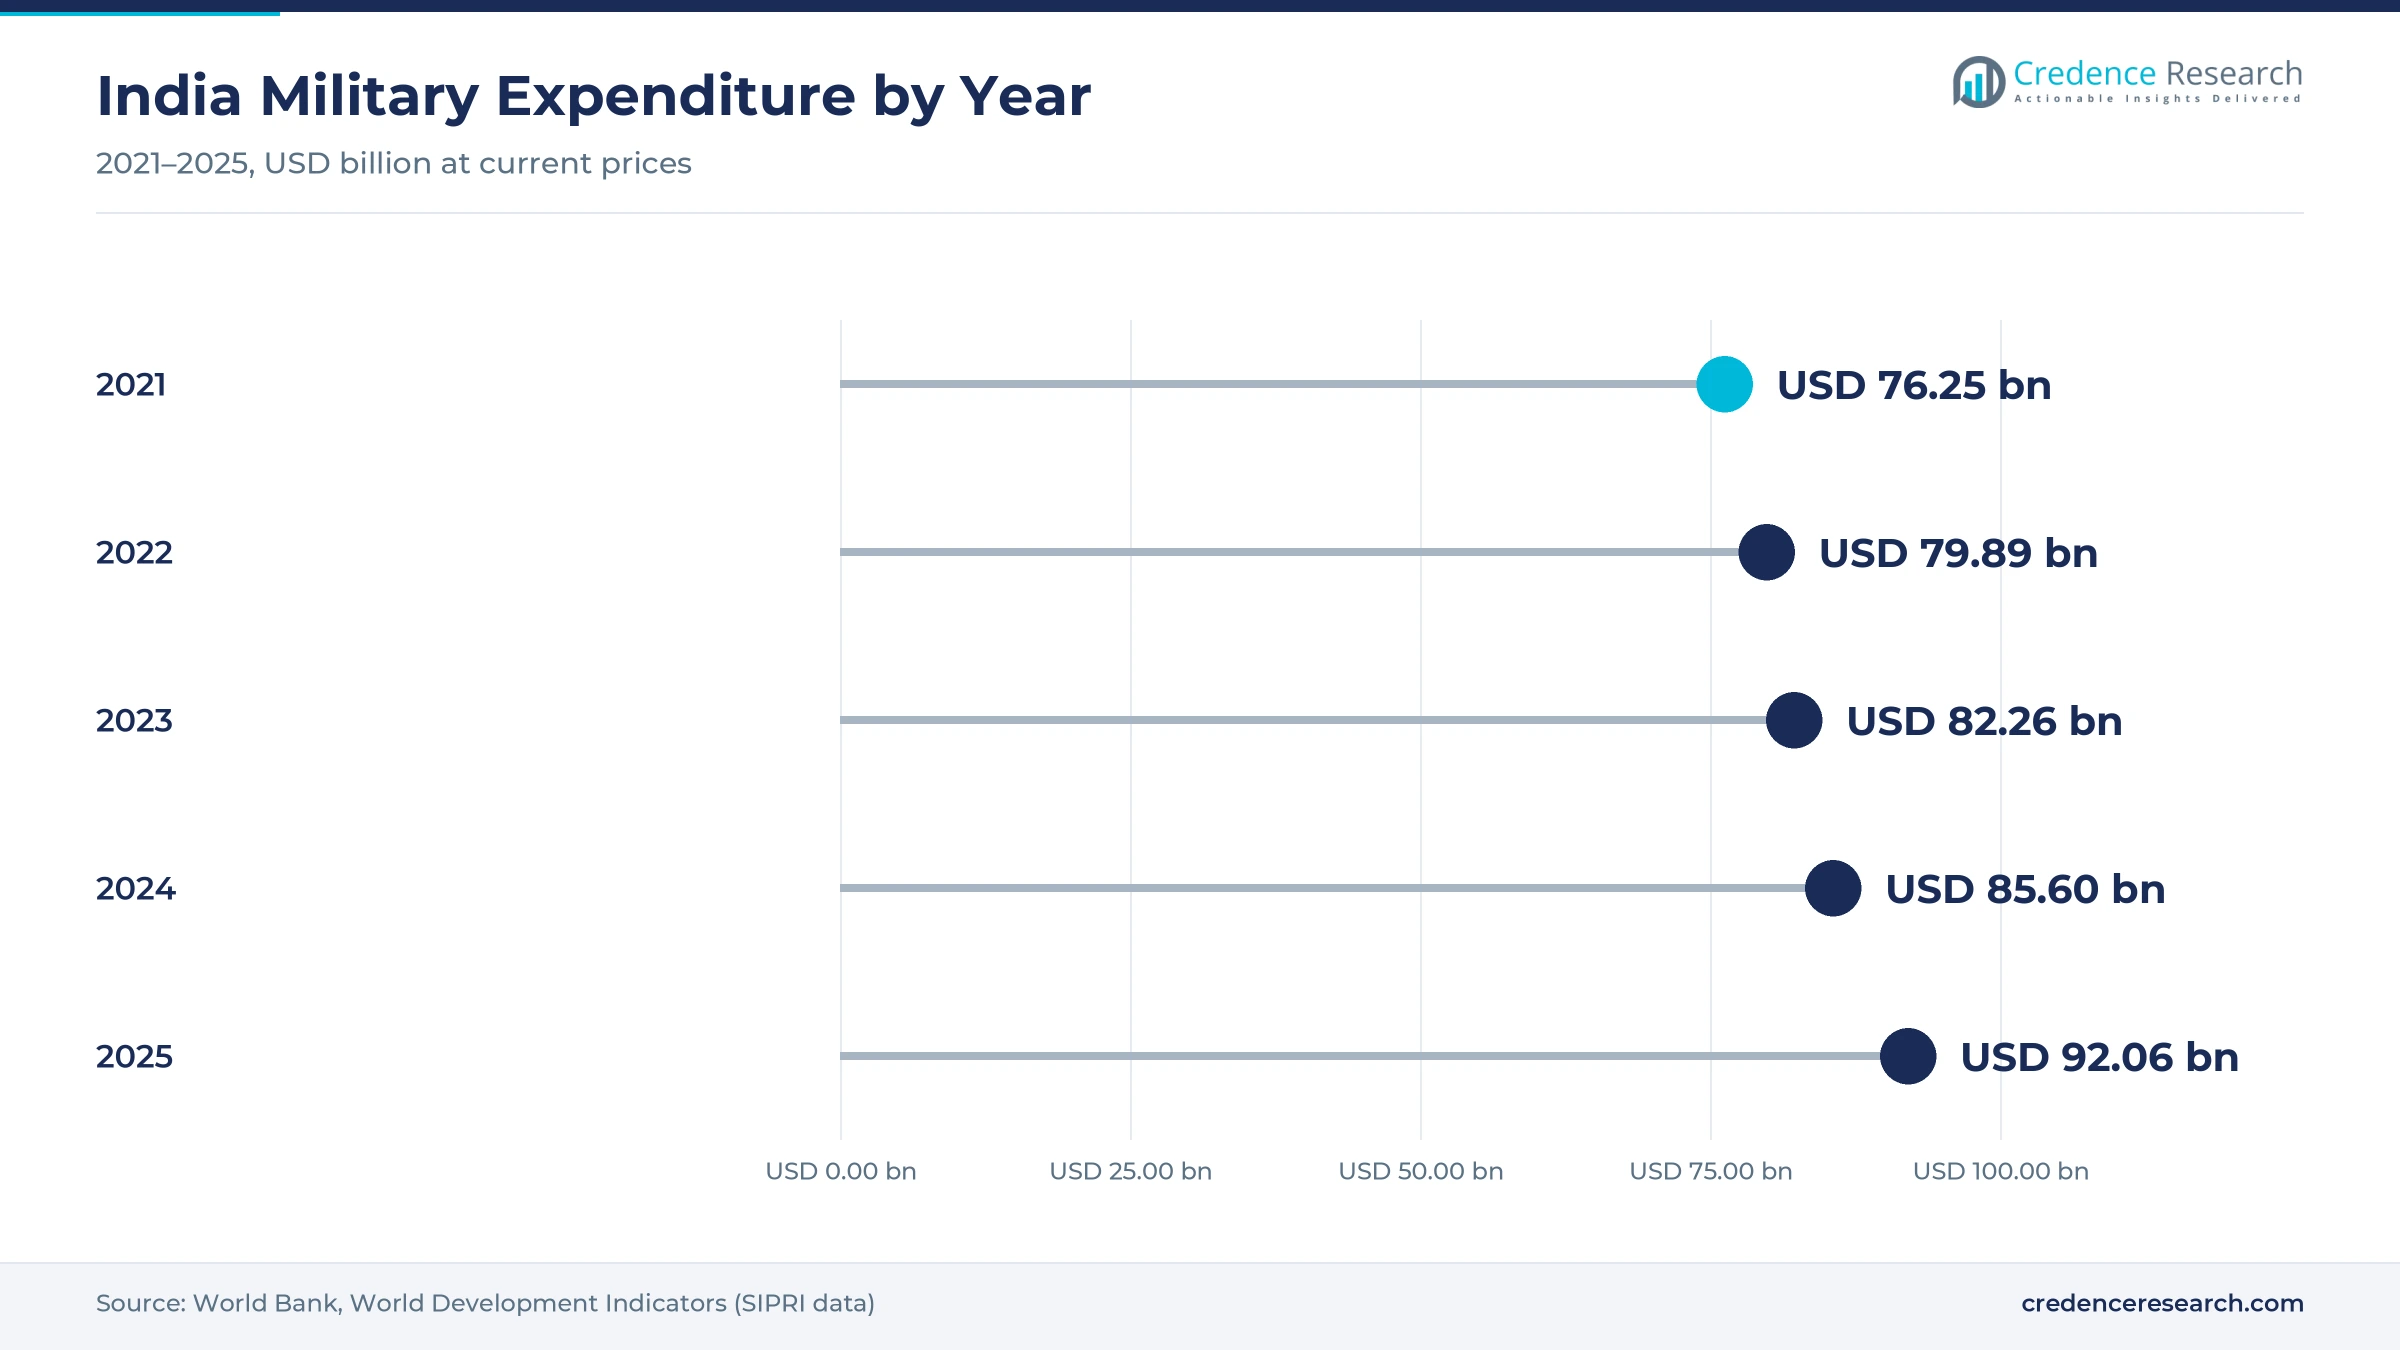
India's military spending reached USD 92.06 billion in 2025, up from USD 85.60 billion in 2024, according to World Bank data, and electronics ride on almost every platform it buys. Defense production reached a record INR 1.78 lakh crore in 2025-26, up 15.6% from INR 1.54 lakh crore a year earlier, according to the office of Defence Minister Rajnath Singh. Capital outlay for the armed forces rose 21.84% to more than INR 2.19 lakh crore in the 2026-27 budget. The ministry also signed an INR 62,370 crore contract with Hindustan Aeronautics on Sept. 25, 2025, for 97 Tejas Mk1A jets that carry the Uttam AESA radar and the Swayam Raksha Kavach suite, The Week reported. In turn, airborne platforms keep buying avionics suites and sensors through the decade.
How do export gains and prime contracts widen the order base?
Foreign sales and large subcontracts lengthen production runs for Indian suppliers and make their backlogs more predictable. Defense exports reached a record INR 38,424 crore in 2025-26, up 62.66% from the previous year, with private industry contributing 45.16%, Rajnath Singh said on April 2, 2026, as reported by ETV Bharat. The government has set an export target of INR 50,000 crore for 2029-30, which favors suppliers with proven radar and communication products. Data Patterns emerged as the lowest bidder for an INR 1,300 crore HAL order for airborne electronic warfare systems in July 2026, according to IDRW. As a result, export defense ministries grow fastest by customer type at 8.21% a year.
Why did Operation Sindoor raise priority for air defense networks?
Combat use in May 2025 showed the value of networked sensors, which pushed air defense radars and counter-drone electronics up the procurement list. Bharat Electronics' Akashteer system, bought under an INR 1,982 crore contract in March 2023, linked radars and command units to counter drone and missile attacks after Operation Sindoor began on May 7, 2025, according to The Hitavada. The Indian Army then placed an INR 1,640 crore order for Atulya air defense fire control radars, designed by DRDO and built by Bharat Electronics, in July 2025. Zen Technologies also won orders worth INR 289 crore on Oct. 31, 2025, to upgrade anti-drone systems. In turn, surveillance and target acquisition led applications with 33.0% of 2025 value.
AESA radars, secure networks and new plants reshape supply
Why is the shift to AESA radar production accelerating?
The armed forces are moving from mechanically scanned radars to active electronically scanned arrays, which raise the value of each radar through many transmit and receive modules. The ministry signed an INR 2,906 crore contract with Bharat Electronics on March 12, 2025, for Ashwini low-level transportable radars, an AESA design from DRDO's Electronics and Radar Development Establishment, the Press Information Bureau said. Centum Electronics won an HAL order on Feb. 24, 2026, to design an AESA radar for the maritime utility helicopter, with serial production indicated at about INR 500 crore. Astra Microwave also received an INR 135 crore DRDO order on Aug. 5, 2025, to upgrade a ground-based radar. As a result, military radar programs are becoming the largest source of module orders.
How is the rise of software-defined secure networks changing radios?
Services are replacing fixed-function radios with software-defined sets and secure data links, which shifts value toward waveform software, encryption and network management. The ministry signed an INR 1,220.12 crore contract with Bharat Electronics on Feb. 20, 2025, for 149 software defined radios for the Indian Coast Guard, the Press Information Bureau said. The 2026-27 budget also set aside INR 975 crore for an optical fiber network for the defense services. Bharat Electronics and Centum Electronics signed a memorandum on Aug. 19, 2025, to develop electronic warfare, radar and secure military communication modules in India, and Avantel won a satellite communication order from Mazagon Dock in June 2025. In turn, networked command systems are becoming a standard part of every new platform.
Can corridor plants open room for local radar and EW supply?
New industrial corridors give private and foreign suppliers land and incentives to build electronics plants close to their customers. The Uttar Pradesh corridor had attracted INR 33,896.16 crore of investment proposals by September 2025, with 62 companies allotted land and nine units in operation, according to Invest UP. Amitec Electronics invested INR 330 crore at Aligarh and now makes electronic warfare systems and satellite technology there. In Tamil Nadu, Israel Aerospace Industries' ELTA unit and DCX Systems broke ground on May 5, 2026, on an ELTX radar plant at Shoolagiri, with construction due by April 2027, Raksha Anirveda reported. As a result, corridor demand for locally built radar and jammer modules should rise steadily through 2030.
Is indigenous subsystem supply an opening for private firms?
Indigenization lists and supplier portals are moving thousands of imported parts to Indian makers, which opens room for smaller electronics firms. The Ministry of Defence reported that its five positive indigenization lists covered more than 5,500 items by February 2025, of which more than 3,000 had been indigenized. Its SRIJAN portal listed more than 38,000 items, and more than 14,000 had been indigenized. Private industry produced about 24% of defense output in 2025-26, up from 22% a year earlier, and Paras Defence and Space Technologies won an INR 71.68 crore DRDO order for two submarine optronic periscopes on Nov. 17, 2025, Business Standard reported. In turn, design houses that qualify modules early can move into larger system work.
Imported chips and long trials slow electronics programs
How does import reliance for chips and RF parts raise risk?
Many radars, radios and jammers still rely on imported FPGAs, processors, gallium nitride devices and connectors, because India makes few military-grade components. Lead times for these parts can stretch for months, and export licenses from supplier countries can delay deliveries. As a result, smaller module makers carry large inventories to protect schedules. Local semiconductor fabrication and packaging projects should ease this dependence gradually, although qualified military parts will take longer to arrive.
Why do long trials and approval cycles delay revenue?
New electronic systems must pass user trials, environmental tests and quality assurance before a contract is signed, and each step can take several years. Suppliers fund development and prototypes long before production orders arrive, which strains smaller design houses. In turn, delivery schedules often slip when trials need repeating after design changes. Faster trial rules and joint development contracts with DRDO laboratories help suppliers shorten the path from prototype to series production.
How do lumpy orders and working capital strain suppliers?
Large contracts arrive irregularly, and payments follow milestones such as factory acceptance, delivery and installation on the platform. Subcontractors that supply public sector integrators wait for their customers to be paid first, which ties up cash in work in progress. As a result, quarterly results swing widely for listed electronics makers. Suppliers manage this risk with mixed export and domestic order books, advance payments and tighter inventory planning.
Why do skills and test infrastructure limit scale?
Radar, electronic warfare and electro-optics work needs RF engineers, embedded software teams and costly anechoic chambers, environmental test rigs and ranges. Smaller firms cannot afford every facility, so they queue for shared test slots at public laboratories. In turn, development programs take longer and cost more than planned. Shared test centers funded under the defense testing infrastructure scheme, including electronic warfare and electro-optics facilities, are easing this constraint.
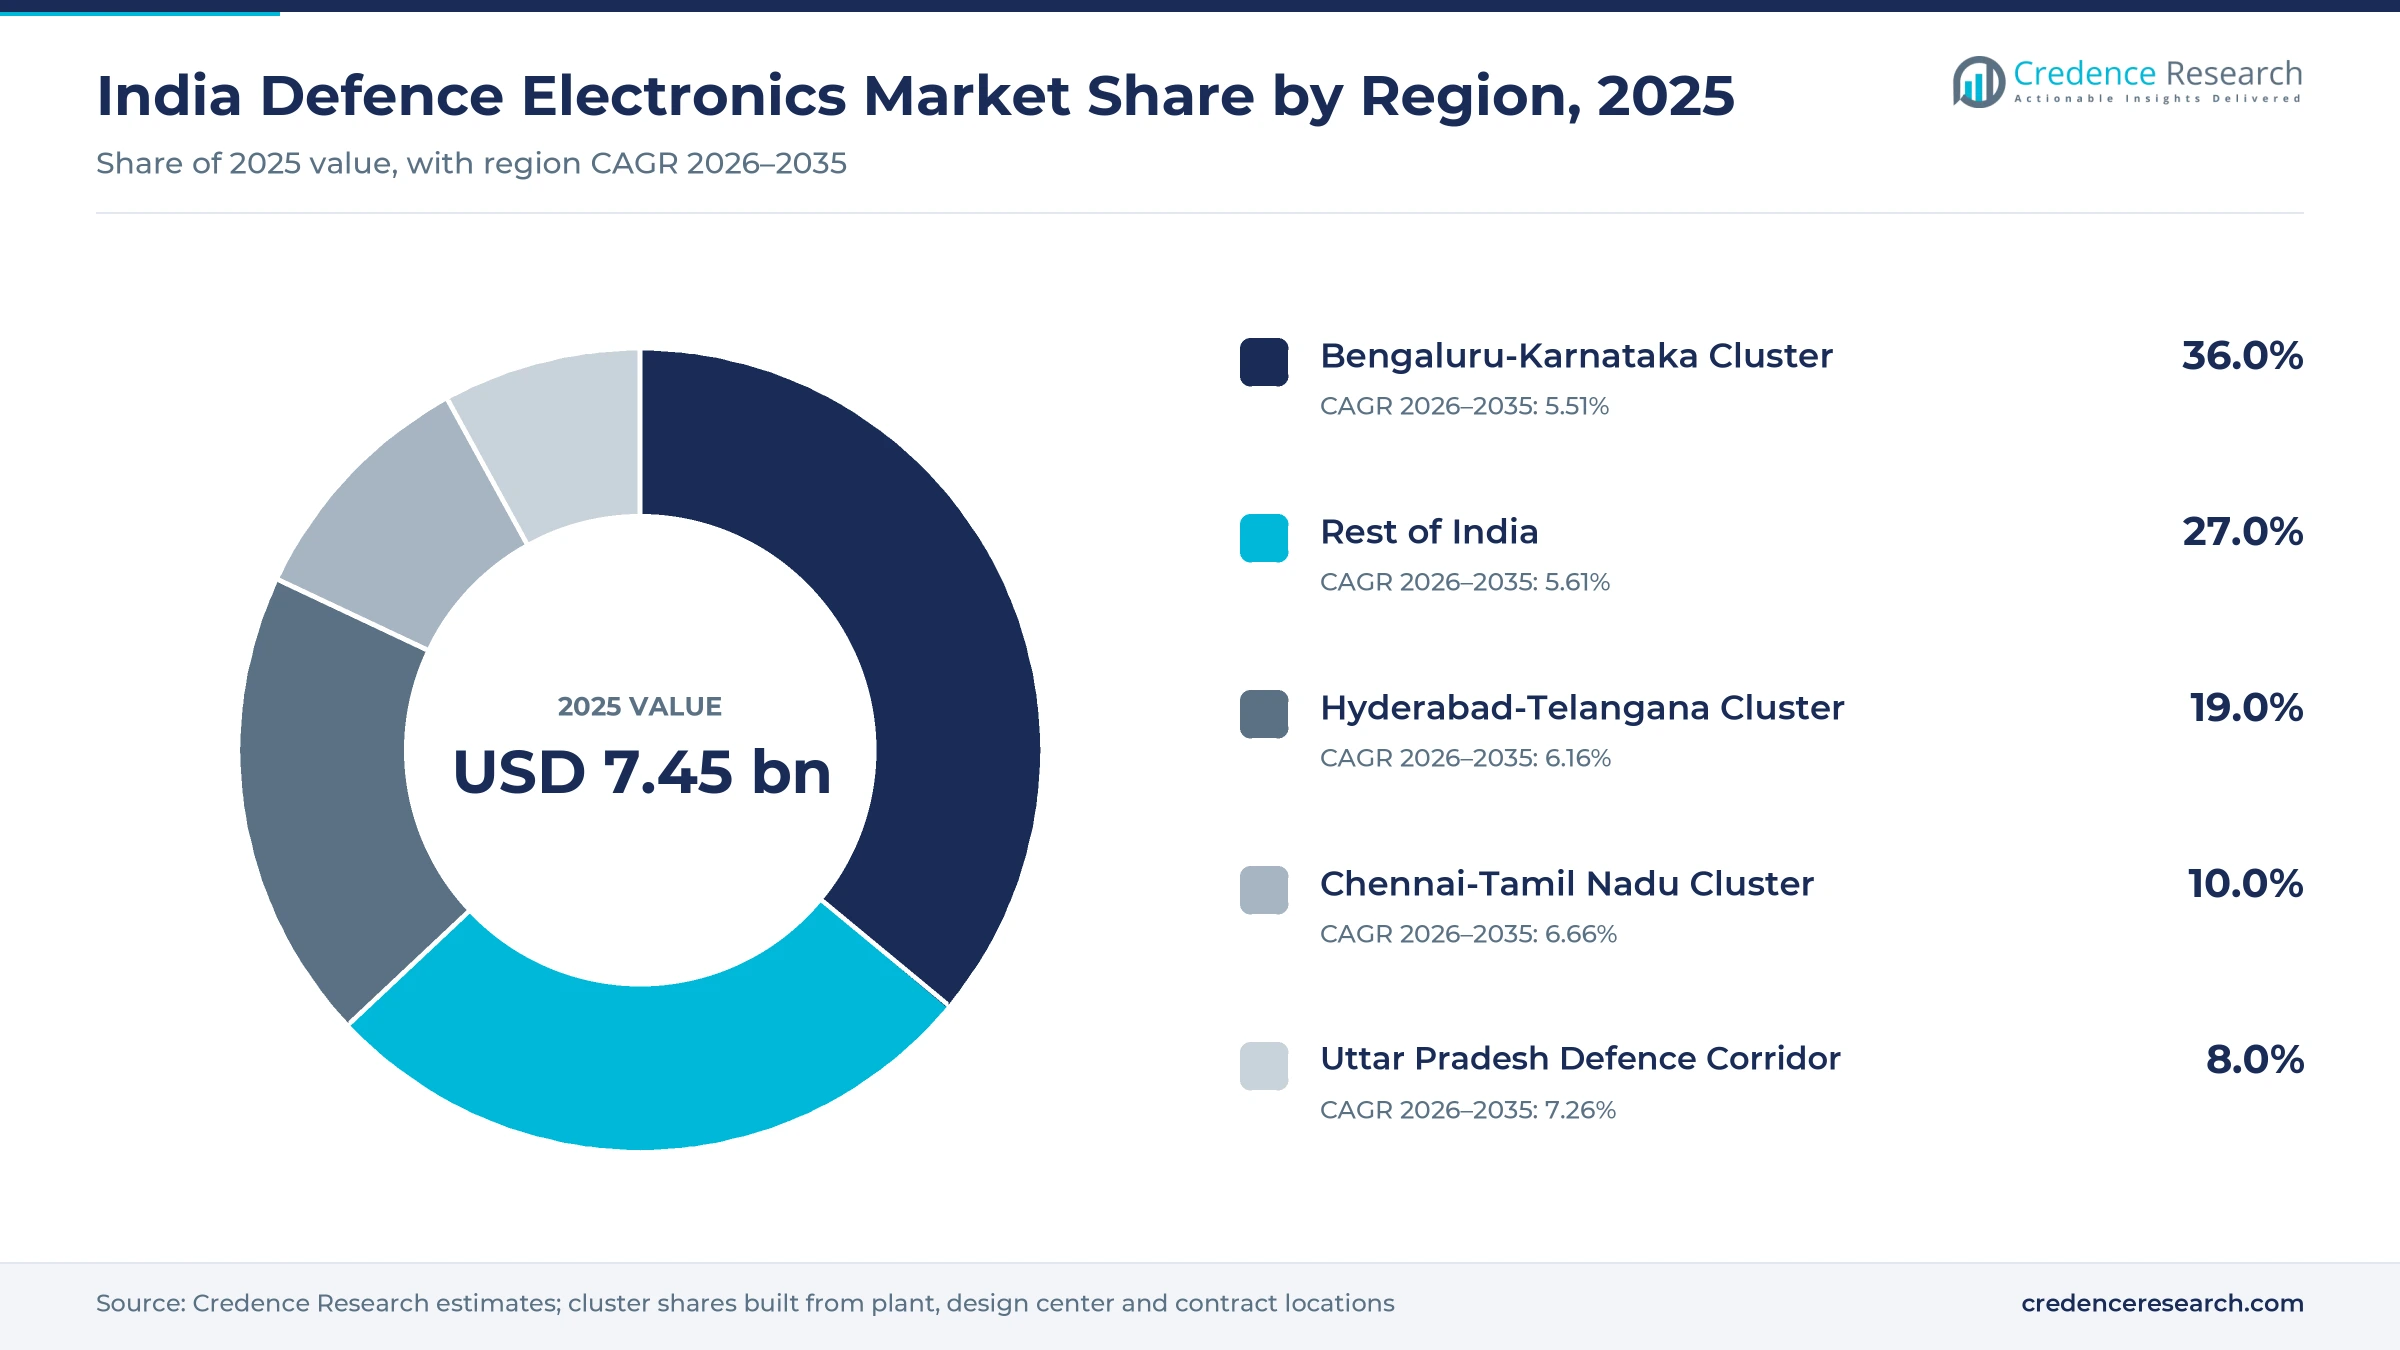
Bengaluru leads as the Uttar Pradesh corridor grows fastest
| Region | Value, 2025 (USD billion) | Share, 2025 | CAGR, 2026–2035 |
|---|---|---|---|
| Bengaluru-Karnataka Cluster | 2.68 | 36.0% | 5.51% |
| Rest of India | 2.01 | 27.0% | 5.61% |
| Hyderabad-Telangana Cluster | 1.42 | 19.0% | 6.16% |
| Chennai-Tamil Nadu Cluster | 0.75 | 10.0% | 6.66% |
| Uttar Pradesh Defence Corridor | 0.60 | 8.0% | 7.26% |
What gives the southern aerospace capital its lead?
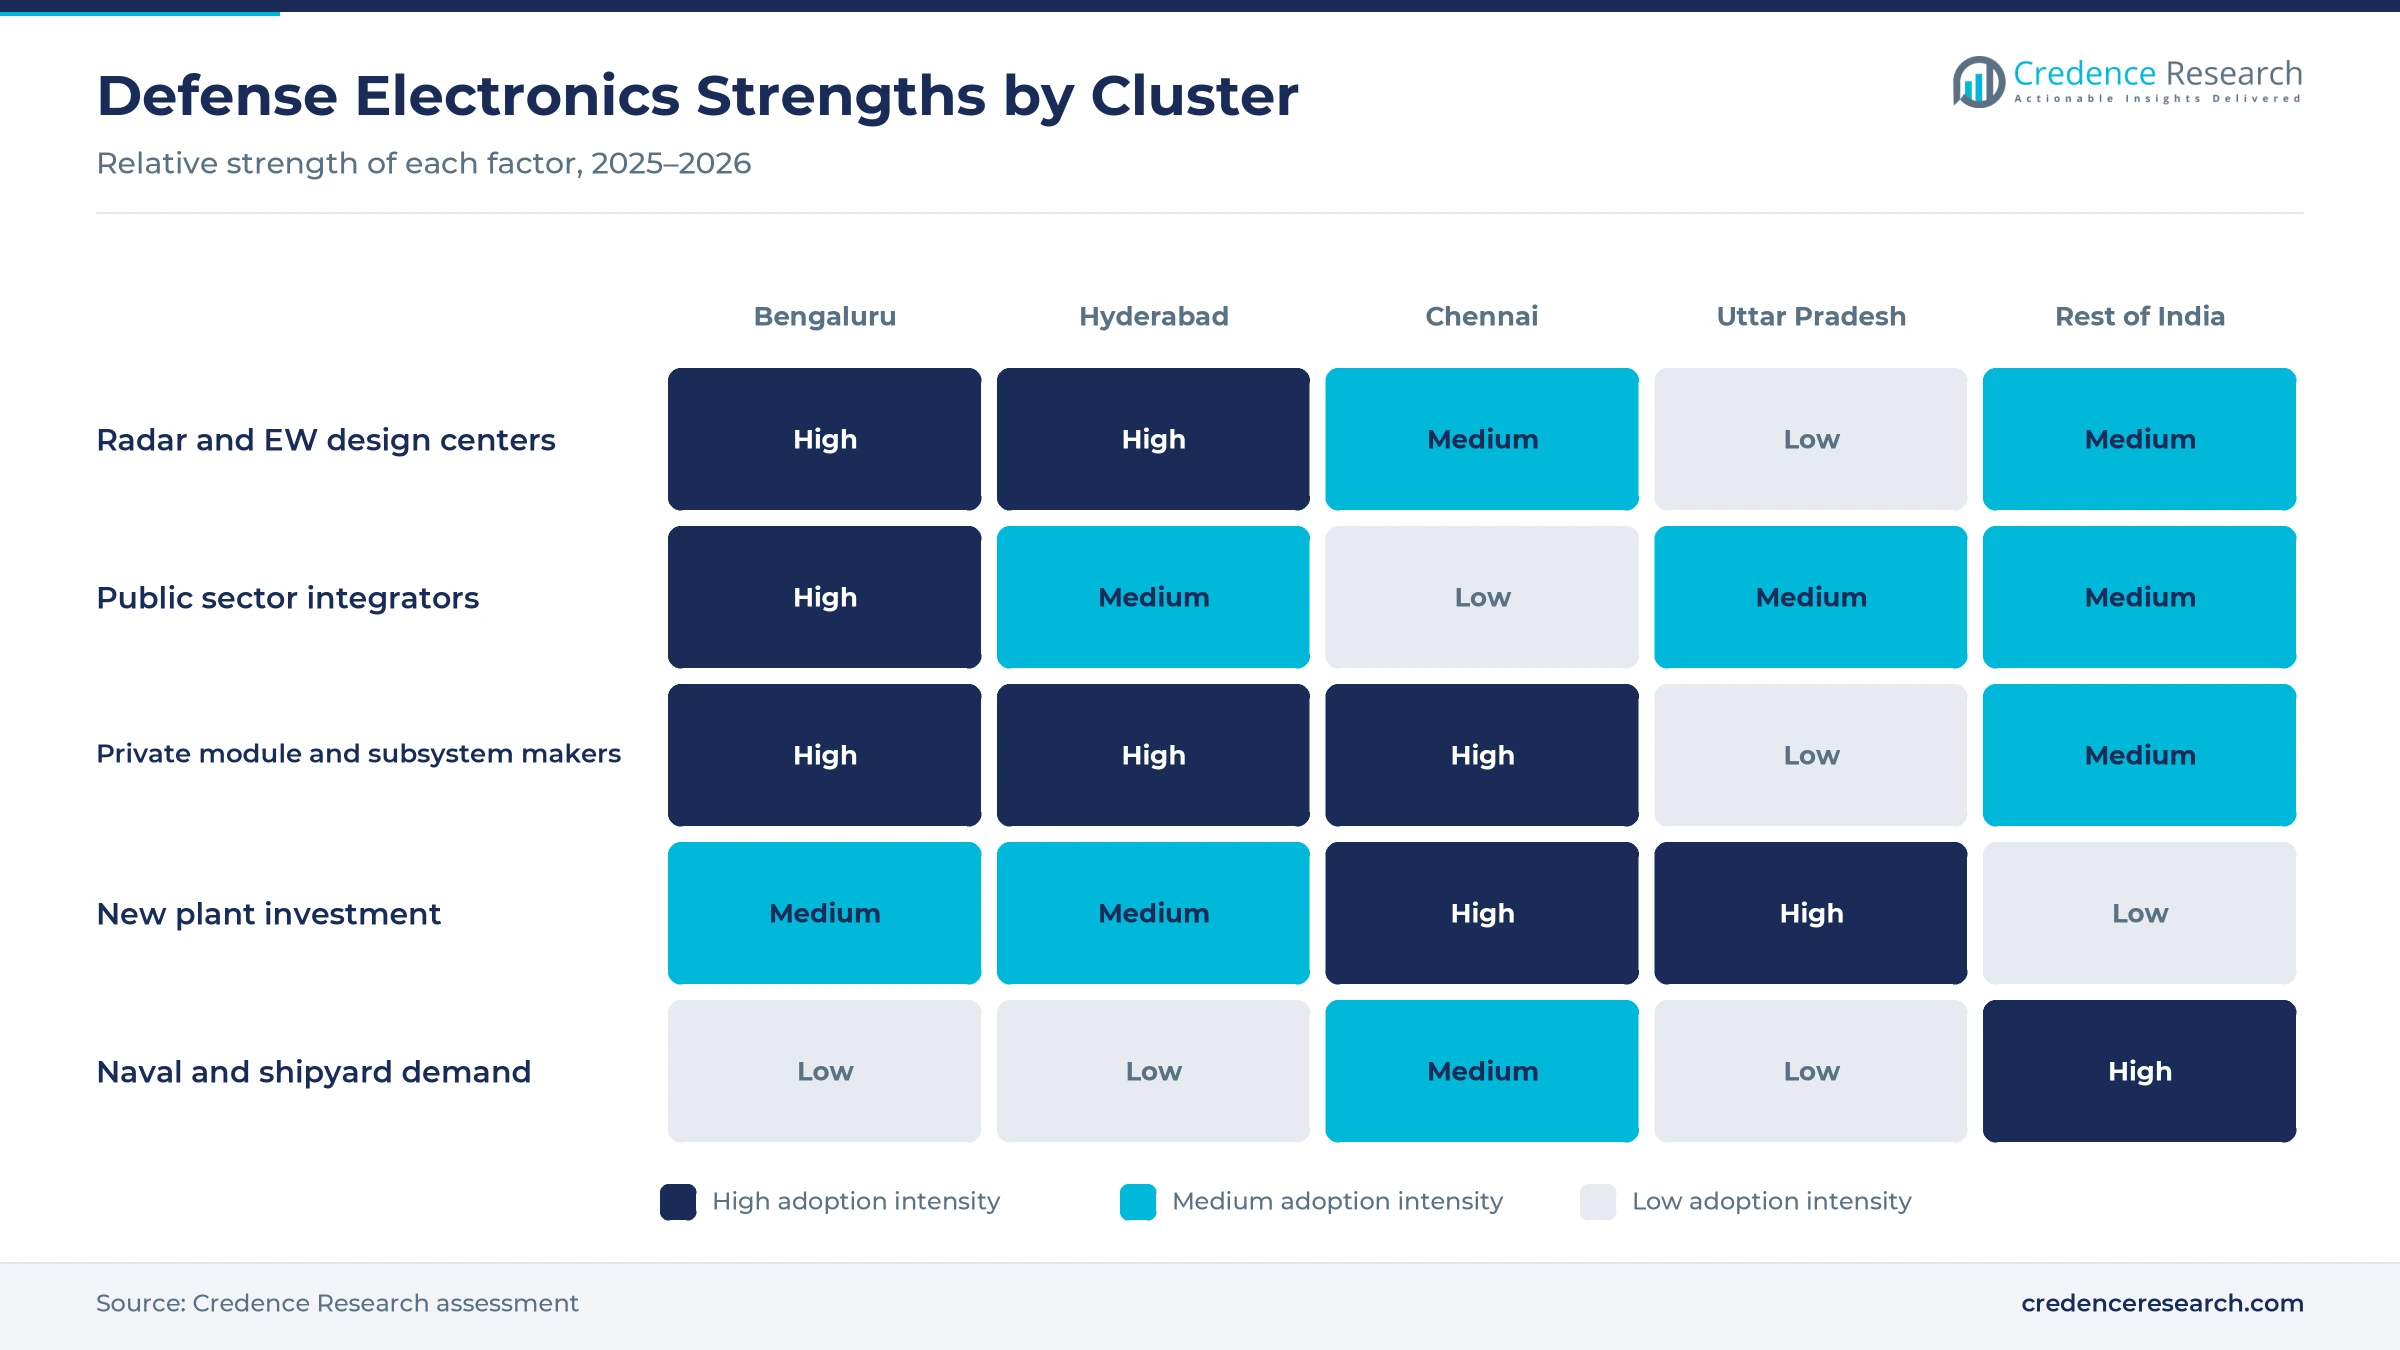
The Bengaluru-Karnataka Cluster held 36.0% of 2025 value and grows at 5.51% a year, because Bharat Electronics, Hindustan Aeronautics and several DRDO laboratories design and integrate systems there. Karnataka builds about 67% of aircraft and helicopters made for the armed forces, according to the Karnataka Aerospace and Defence Policy 2022-27. Bharat Electronics in Bengaluru holds the Coast Guard radio and Mi-17 V5 electronic warfare contracts, and Alpha Design Technologies has worked from the city since 2004. As a result, the cluster supplies most aircraft modernization electronics.
Which RF specialists anchor demand around Hyderabad?
The Hyderabad-Telangana Cluster held 19.0% of 2025 value and grows at 6.16% a year, because missile laboratories and RF specialists have built a deep supplier base in the city. More than 1,500 small businesses work in the Telangana aerospace and defense supply chain, a state minister said in May 2026, according to Siasat. Astra Microwave runs plants at Bollaram and Raviryala, while Zen Technologies, Apollo Micro Systems and Avantel also operate from Hyderabad. In turn, the cluster supplies microwave modules, simulators and anti-drone systems.
Why is final integration moving to Tamil Nadu?
The Chennai-Tamil Nadu Cluster held 10.0% of 2025 value and grows at 6.66% a year, because Chennai design houses and the Tamil Nadu Defence Industrial Corridor are adding radar and processor capacity. Data Patterns, based in Chennai, supplies radars, processors and electronic warfare subsystems. ELTX Systems, the radar venture of DCX Systems and Israel Aerospace Industries' ELTA unit, broke ground at Shoolagiri in May 2026. As a result, the state is adding final integration and testing work that was earlier done abroad.
Why is the Uttar Pradesh Defence Corridor growing fastest?
The Uttar Pradesh Defence Corridor held 8.0% of 2025 value and grows fastest at 7.26% a year, because new plants are starting across six nodes from Aligarh to Jhansi. The corridor had nine units in operation and 62 companies with allotted land by September 2025. Amitec Electronics invested INR 330 crore at Aligarh and makes electronic warfare systems and satellite technology there, while Bharat Electronics' Ghaziabad radar unit elsewhere in the state adds nearby supply. In turn, the corridor is turning from a land bank into a working supply base.
What sustains demand in the rest of India?
The Rest of India held 27.0% of 2025 value and grows at 5.61% a year, because shipyards, electronics plants and depots are spread across Maharashtra, Andhra Pradesh, Kerala, Haryana and Gujarat. Mazagon Dock in Mumbai buys satellite communication systems for the warships and submarines it builds, and Avantel also works from Visakhapatnam. Repair depots and naval dockyards also add steady upgrade and refit work every year. As a result, the zone stays large even though it grows more slowly than the newer clusters.
Radar, radio and EW contracts marked 2025 and 2026
| Development | Status and market relevance |
|---|---|
| In February 2025, the Ministry of Defence signed an INR 1,220.12 crore contract with Bharat Electronics for 149 software defined radios. | Equips the Indian Coast Guard with secure voice and data links |
| In April 2025, the ministry signed an INR 2,385.36 crore contract with Bharat Electronics for Mi-17 V5 electronic warfare suites. | Adds self-protection electronics to Air Force helicopters |
| In July 2025, the Indian Army placed an INR 1,640 crore order with Bharat Electronics for Atulya air defense fire control radars. | Strengthens gun-based air defense against aircraft and drones |
| In February 2026, Centum Electronics won an HAL order to design an AESA radar for the maritime utility helicopter. | Moves a private firm into airborne radar design |
| In May 2026, DCX Systems and the ELTA unit of Israel Aerospace Industries broke ground on a radar plant at Shoolagiri. | Builds local radar integration and testing capacity by 2027 |
Four technology families shape Indian military electronics
- AESA and GaN RF electronics spread transmit and receive modules across a flat array, which lets radars and jammers steer beams electronically and track many targets.
- Software-defined communication moves waveforms, encryption and networking into software, which lets radios receive new features without hardware changes.
- AI-enabled sensor fusion combines radar, optical and electronic support data into one air picture, which speeds decisions in air defense networks.
- Electro-optics and advanced sensing uses thermal imagers, lasers and optronic masts, which give day and night targeting for guns, vehicles and submarines.
Need a Custom Version of This Report?
Tailor the scope, geography, or segments to your exact requirements.
- Custom geography or segment scope
- Direct access to our analyst team
BEL leads as private design houses win subsystem work
Competition centers on design ownership, qualification history, delivery capacity and the ability to work with DRDO laboratories. Bharat Electronics leads as the main integrator of radars, radios, electronic warfare suites and air defense networks such as Akashteer and Atulya. Data Patterns and Alpha Design Technologies compete for radar, electronic warfare and processing subsystems, while Astra Microwave and Centum Electronics supply RF modules and are moving into full radar design. Paras Defence and Space Technologies focuses on optronics, Zen Technologies on simulators and anti-drone systems, and Avantel on satellite communication. DCX Systems and Apollo Micro Systems build cable assemblies, electronics and integrated subsystems, and DCX is adding radar work through its venture with Israel Aerospace Industries. Radar programs remain the largest single source of orders, so radar capacity still decides much of the market.
Companies profiled and their roles in this market
| Company | Type | Role in the market |
|---|---|---|
| Bharat Electronics Limited | Public sector integrator | Ashwini and Atulya radars, Coast Guard radios, Akashteer |
| Data Patterns (India) Limited | Electronics design house | Chennai base; radars, processors and EW subsystems |
| Astra Microwave Products Limited | RF and microwave maker | Hyderabad plants; DRDO radar upgrade order in 2025 |
| Centum Electronics Limited | Electronics design and manufacturing | HAL AESA radar design order in 2026 |
| Paras Defence and Space Technologies Limited | Optronics maker | DRDO submarine optronic periscope order in 2025 |
| Zen Technologies Limited | Simulator and anti-drone maker | Hyderabad; anti-drone upgrade orders in October 2025 |
| DCX Systems Limited | Electronics and integration supplier | ELTX radar venture with the ELTA unit of IAI |
| Apollo Micro Systems Limited | Electronics and subsystem maker | Expanding at Hardware Park Phase II, Hyderabad |
| Avantel Limited | Communication and radar subsystem maker | Satellite communication order from Mazagon Dock |
| Alpha Design Technologies Private Limited | Defense electronics maker | Bengaluru since 2004; EW, optronics and radar |
Credence Research view on Indian military electronics
Credence Research's view is that India defence electronics demand will grow steadily, because local buying rules, record production and rising capital budgets keep orders flowing to domestic suppliers. Radar and surveillance systems keep the largest share through the forecast, while electronic warfare and countermeasure systems gain ground as drone threats spread. Bharat Electronics remains the main integrator, but private design houses are winning more module and subsystem work. The Uttar Pradesh corridor should grow fastest as new plants start, while Bengaluru keeps its lead. Suppliers that own their designs and can pass trials quickly should gain the most share.
Budgets, contracts and production data anchor the model
The report uses 2025 as the base year on a calendar basis, and market values come from the Credence Research model. That model combines military expenditure statistics, defense budget documents, production and export figures, published contract values and company plant locations. Segment splits, cluster shares and growth rates are Credence Research estimates built from those inputs. Sources used are official statistics, government and ministry releases, state investment agency releases, stock exchange filings, trade press and company releases, and no interviews or surveys were used.
Air defense, EW and exports carry growth to 2035
India defence electronics sales are expected to reach USD 13.30 billion by 2035, a 5.93% CAGR during 2026–2035, as capital budgets, local buying rules and exports keep orders rising. Growth should stay firm through 2030 as AESA radars, air defense networks and software defined radios move into series production. After that, fighter, helicopter and warship programs will set the pace for avionics and naval electronics. Faster trials would favor private design houses, while budget pressure would slow new starts. Electronic warfare and countermeasure systems are expected to gain the most product share through 2035.
Frequently Asked Questions
How big is the India defence electronics market?
Which product type leads demand in India?
Which region leads the Indian market?
Which customer buys the most defense electronics?
How much of the capital budget goes to Indian industry?
How did Operation Sindoor affect electronics demand?
Who are the leading suppliers in India?
What are the main challenges for suppliers?
Table of Content
Chapter 1 Market Segmentation
- 1.1 Segmentation Framework
- 1.1.1 Product and Service Classification
- 1.1.2 Application and End-Use Classification
- 1.1.3 Technology and Solution Classification
- 1.1.4 Customer and Distribution Channel Classification
- 1.1.5 Geographic Segmentation
- 1.1.6 Market Segment Definitions and Boundaries
- 1.2 By Product Type
- 1.2.1 Radar & Surveillance Systems
- 1.2.2 Communication & C4ISR Systems
- 1.2.3 Electronic Warfare & Countermeasure Systems
- 1.2.4 Avionics
- 1.2.5 Electro-Optics & Fire-Control Systems
- 1.3 By Platform
- 1.3.1 Land Platforms
- 1.3.2 Airborne Platforms
- 1.3.3 Naval Platforms
- 1.3.4 Space & Strategic Platforms
- 1.4 By Application
- 1.4.1 Surveillance & Target Acquisition
- 1.4.2 Command, Control & Secure Networking
- 1.4.3 Electronic Attack & Protection
- 1.4.4 Weapons Guidance & Fire Control
- 1.5 By Customer Type
- 1.5.1 Indian Army
- 1.5.2 Indian Air Force
- 1.5.3 Indian Navy & Coast Guard
- 1.5.4 Export Defence Ministries
Chapter 2 Introduction
- 2.1 Report Objectives and Scope
- 2.2 Product Definition and Industry Terminology
- 2.3 Market Inclusions and Exclusions
- 2.4 Research Process
- 2.4.1 Primary Research and Expert Interviews
- 2.4.2 Secondary Research and Source Review
- 2.4.3 Top-Down and Bottom-Up Estimation
- 2.4.4 Data Triangulation and Verification
- 2.5 Market Size Measurement Basis
- 2.5.1 2025: USD 7.45 billion → 2035: USD 13.30 billion
- 2.6 Historical and Forecast Reference Periods
- 2.6.1 Historical Period: 2018-2025
- 2.6.2 Base Year: 2025
- 2.6.3 Forecast Period: 2025-2035
- 2.7 Research Assumptions and Limitations
Chapter 3 Executive Summary
- 3.1 Market Snapshot and Key Findings
- 3.2 Base-Year Market Size, 2025
- 3.3 Forecast Market Size, 2035
- 3.4 Revenue and Volume Growth Outlook
- 3.5 Key Demand and Supply Indicators
- 3.6 Leading Market Segments
- 3.7 Fastest-Growing Market Opportunities
- 3.8 Regional Performance Highlights
- 3.9 Technology and Industry Transformation
- 3.10 Competitive Landscape Summary
- 3.11 Analyst View and Strategic Implications
Chapter 4 India Defence Electronics Market Trends and Developments
- 4.1 Historical Industry Development, 2018-2025
- 4.2 Recent Market Trends and Developments
- 4.3 Demand and Customer Behavior Trends
- 4.4 Technology and Product Innovation
- 4.5 Artificial Intelligence, Automation and Digitalization
- 4.6 Local Manufacturing and Supply Chain Realignment
- 4.7 Industry Partnerships, Mergers and Acquisitions
- 4.8 Sustainability and Circular Economy Developments
- 4.9 Government and Private Sector Investment Trends
- 4.10 Emerging Business Models and Commercialization
- 4.11 Industry Developments and Announcements
Chapter 5 India Defence Electronics Market Production, Supply and Demand Analysis
- 5.1 Demand Trend and Consumption Analysis, 2018-2025
- 5.2 Demand Forecast, 2025-2035
- 5.3 Production and Output Trend, 2018-2025
- 5.4 Production and Output Forecast, 2025-2035
- 5.5 Installed Capacity and Capacity Utilization
- 5.6 Company-Wise Production Plants and Statistics
- 5.6.1 Installed Production Capacity
- 5.6.2 Actual Production
- 5.6.3 Planned Capacity and Expansion Targets
- 5.7 Supply Chain Structure and Procurement Trends
- 5.8 Supply-Demand Gap and Bottlenecks
- 5.9 Import Dependence and Sourcing Structure
- 5.10 Contract Manufacturing and Outsourcing
- 5.11 Regional Supply and Demand Concentration
Chapter 6 India Defence Electronics Market Pricing Analysis
- 6.1 Pricing Structure and Measurement
- 6.2 Historical Pricing Trends, 2018-2025
- 6.3 Pricing Outlook, 2025-2035
- 6.4 Average Selling Price and Unit Economics
- 6.5 Pricing by Product and Market Segment
- 6.6 Geographic Pricing Differences
- 6.7 Key Input, Energy, Labor and Logistics Costs
- 6.8 Contract Pricing and Purchasing Models
- 6.9 Pricing Sensitivity and Competitive Positioning
- 6.10 Price, Margin and Profitability Implications
Chapter 7 India Defence Electronics Market Dynamics
- 7.1 Market Growth Drivers
- 7.1.1 Demand-Side Drivers
- 7.1.2 Technology and Innovation Drivers
- 7.1.3 Infrastructure and Investment Drivers
- 7.1.4 Regulatory and Policy Drivers
- 7.2 Market Restraints
- 7.2.1 Cost and Affordability Constraints
- 7.2.2 Technology and Adoption Barriers
- 7.2.3 Supply Chain and Operational Constraints
- 7.3 Market Challenges
- 7.3.1 Competitive Pressure and Margin Erosion
- 7.3.2 Skills, Infrastructure and Implementation Gaps
- 7.4 Emerging Market Opportunities
- 7.5 Market Dynamics Impact and Time-Horizon Assessment
Chapter 8 India Defence Electronics Value Chain Analysis
- 8.1 Industry Value Chain Overview
- 8.2 Upstream Suppliers and Critical Inputs
- 8.3 Technology and Component Providers
- 8.4 Manufacturing or Service Delivery
- 8.5 Distribution, Channel Partners and Integrators
- 8.6 Downstream Applications and End Users
- 8.7 Value Addition and Profit Pools
- 8.8 Vertical Integration and Outsourcing
- 8.9 Supplier Concentration and Risk
- 8.10 Supply Chain Localization and Resilience
Chapter 9 India Defence Electronics Market Regulations and Policies
- 9.1 Relevant Laws, Standards and Compliance Frameworks
- 9.2 Product, Service, Safety and Quality Requirements
- 9.3 Government Policies, Incentives and Subsidies
- 9.4 Imports, Exports and Trade Barriers
- 9.5 Public Procurement and Local Content Requirements
- 9.6 Environmental and Sustainability Compliance
- 9.7 Upcoming Policy Changes and Market Implications
Chapter 10 India Defence Electronics Market Hotspots and Opportunities
- 10.1 Market Opportunity Mapping and Growth Hotspots
- 10.2 High-Growth Applications and Customer Groups
- 10.3 Underserved Markets and White-Space Opportunities
- 10.4 Emerging Technology and Product Opportunities
- 10.5 New Capacity and Investment Hotspots
- 10.6 Market Entry and Expansion Opportunities
- 10.7 Distribution and Partnership Opportunities
- 10.8 Near-Term and Long-Term Commercial Potential
- 10.9 Opportunity Attractiveness and Execution Risks
Chapter 11 India Defence Electronics Market Outlook, 2025-2035
- 11.1 Market Size and Analysis
- 11.1.1 Revenue (Market Measurement: 2025: USD 7.45 billion → 2035: USD 13.30 billion)
- 11.1.2 Market Volume and Quantity Sold
- 11.1.3 Historical Market Size, 2018-2025
- 11.1.4 Base-Year Market Size, 2025
- 11.2 Market Forecast, 2025-2035
- 11.2.1 Revenue Forecast to 2035
- 11.2.2 Volume Forecast to 2035
- 11.2.3 CAGR and Year-on-Year Growth
- 11.2.4 Incremental Revenue Opportunity
- 11.3 Forecast Assumptions and Scenario Analysis
- 11.3.1 Base-Case Forecast
- 11.3.2 Optimistic and Conservative Scenarios
- 11.3.3 Technology, Pricing and Policy Sensitivities
- 11.4 Market Attractiveness and Growth Outlook
Chapter 12 India Defence Electronics Market Segmentation and Outlook
- 12.1 Segmentation Summary and Market Shares, 2025
- 12.2 Largest and Fastest-Growing Segments
- 12.3 By Product Type - Market Size and Forecast, 2025-2035
- 12.3.1 Segment Definition and Scope
- 12.3.2 Historical Market Size, 2018-2025
- 12.3.3 Revenue Forecast, 2025-2035
- 12.3.4 Volume Forecast, 2025-2035
- 12.3.5 Base-Year Market Share, 2025
- 12.3.6 Segment CAGR and Growth Drivers
- 12.3.7 Subsegment Market Size and Forecast
- 12.3.7.1 Radar & Surveillance Systems
- 12.3.7.2 Communication & C4ISR Systems
- 12.3.7.3 Electronic Warfare & Countermeasure Systems
- 12.3.7.4 Avionics
- 12.3.7.5 Electro-Optics & Fire-Control Systems
- 12.3.8 Subsegment Pricing and Adoption Trends
- 12.3.9 Leading Suppliers and Competition
- 12.3.10 Regional Demand and Opportunities
- 12.4 By Platform - Market Size and Forecast, 2025-2035
- 12.4.1 Segment Definition and Scope
- 12.4.2 Historical Market Size, 2018-2025
- 12.4.3 Revenue Forecast, 2025-2035
- 12.4.4 Volume Forecast, 2025-2035
- 12.4.5 Base-Year Market Share, 2025
- 12.4.6 Segment CAGR and Growth Drivers
- 12.4.7 Subsegment Market Size and Forecast
- 12.4.7.1 Land Platforms
- 12.4.7.2 Airborne Platforms
- 12.4.7.3 Naval Platforms
- 12.4.7.4 Space & Strategic Platforms
- 12.4.8 Subsegment Pricing and Adoption Trends
- 12.4.9 Leading Suppliers and Competition
- 12.4.10 Regional Demand and Opportunities
- 12.5 By Application - Market Size and Forecast, 2025-2035
- 12.5.1 Segment Definition and Scope
- 12.5.2 Historical Market Size, 2018-2025
- 12.5.3 Revenue Forecast, 2025-2035
- 12.5.4 Volume Forecast, 2025-2035
- 12.5.5 Base-Year Market Share, 2025
- 12.5.6 Segment CAGR and Growth Drivers
- 12.5.7 Subsegment Market Size and Forecast
- 12.5.7.1 Surveillance & Target Acquisition
- 12.5.7.2 Command, Control & Secure Networking
- 12.5.7.3 Electronic Attack & Protection
- 12.5.7.4 Weapons Guidance & Fire Control
- 12.5.8 Subsegment Pricing and Adoption Trends
- 12.5.9 Leading Suppliers and Competition
- 12.5.10 Regional Demand and Opportunities
- 12.6 By Customer Type - Market Size and Forecast, 2025-2035
- 12.6.1 Segment Definition and Scope
- 12.6.2 Historical Market Size, 2018-2025
- 12.6.3 Revenue Forecast, 2025-2035
- 12.6.4 Volume Forecast, 2025-2035
- 12.6.5 Base-Year Market Share, 2025
- 12.6.6 Segment CAGR and Growth Drivers
- 12.6.7 Subsegment Market Size and Forecast
- 12.6.7.1 Indian Army
- 12.6.7.2 Indian Air Force
- 12.6.7.3 Indian Navy & Coast Guard
- 12.6.7.4 Export Defence Ministries
- 12.6.8 Subsegment Pricing and Adoption Trends
- 12.6.9 Leading Suppliers and Competition
- 12.6.10 Regional Demand and Opportunities
- 12.7 Segment Growth Comparison
- 12.8 Segment Attractiveness and Priority Matrix
Chapter 13 India Defence Electronics End-Use and Application Market Outlook
- 13.1 End-Use Industry and Customer Demand Structure
- 13.2 Leading Applications and Customer Groups
- 13.3 End-Use Market Size, Share and Forecast
- 13.4 Major End-Use Industry Deep Dives
- 13.4.1 Customer Requirements and Use Cases
- 13.4.2 Demand and Replacement Cycles
- 13.4.3 Technical and Regulatory Considerations
- 13.4.4 Purchasing and Procurement Models
- 13.4.5 Leading Vendors and Distribution Channels
- 13.4.6 Forecast and Commercial Opportunities
- 13.5 Emerging Applications and Cross-Segment Demand
- 13.6 End-Use Industry Investment Priorities
Chapter 14 India Defence Electronics Geographic Market Outlook, 2025-2035
- 14.1 Domestic Market Distribution and Demand Clusters
- 14.2 State- or Province-Wise Market Size and Forecast, 2025-2035
- 14.3 City and Metropolitan Market Outlook
- 14.4 Industrial, Manufacturing and Commercial Clusters
- 14.5 Geographic Concentration of Key End Users
- 14.6 Local Pricing and Purchasing Differences
- 14.7 Domestic Production Facilities and Capacity Map
- 14.8 Local Infrastructure and Project Pipeline
- 14.9 State-Level Policy and Incentive Differences
- 14.10 Subnational Investment Hotspots and Opportunities
- 14.11 Distribution and Logistics Networks
- 14.12 Domestic Competitive Footprint
Chapter 15 India Defence Electronics Technology, Innovation and Sustainability Outlook
- 15.1 Technology Landscape and Maturity
- 15.2 Product, Process and Service Innovation
- 15.3 AI, Automation and Digital Tools in the Industry
- 15.4 Technology Adoption and Performance Benchmarking
- 15.5 Innovation Pipeline and R&D Investment
- 15.6 Patent and Intellectual Property Trends
- 15.7 Energy Efficiency and Resource Management
- 15.8 Sustainability, Recycling and Circularity
- 15.9 Technology Roadmap, 2025-2035
- 15.10 Risks of Obsolescence and Technology Substitution
Chapter 16 India Defence Electronics Market Key Strategic Imperatives
- 16.1 Growth and Market Entry Priorities
- 16.2 High-Return Products and Segments
- 16.3 Pricing, Profitability and Cost Optimization
- 16.4 Technology Investment and Product Differentiation
- 16.5 Supply Chain Localization and Resilience
- 16.6 Distribution and Customer Acquisition
- 16.7 Partnership, Acquisition and Capacity Strategy
- 16.8 Regional Expansion Priorities
- 16.9 Short-, Medium- and Long-Term Actions
Chapter 17 Competition Outlook
- 17.1 Industry Competition Characteristics
- 17.2 Market Structure and Concentration
- 17.3 Market Share and Competitive Positioning, 2025
- 17.4 Company-Wise Revenue and Product Benchmarking
- 17.5 Production and Service Capacity Benchmarking
- 17.6 Technology, Pricing and Differentiation
- 17.7 Regional Footprint and Distribution Strength
- 17.8 Mergers, Acquisitions and Strategic Alliances
- 17.9 New Entrants and Competitive Threats
- 17.10 Porter's Five Forces and Industry Attractiveness
- 17.11 Competitive Outlook, 2025-2035
Chapter 18 Company Profiles
- 18.1 Company Coverage and Selection Criteria
- 18.2 Bharat Electronics Limited
- 18.2.1 Business Description
- 18.2.2 Company Ownership and Geographic Presence
- 18.2.3 Product and Service Portfolio
- 18.2.4 Manufacturing and Operating Footprint
- 18.2.5 Production Capacity and Expansion Plans
- 18.2.6 Financial Performance and Investment
- 18.2.7 Market Share and Competitive Position
- 18.2.8 Technology and Innovation Capabilities
- 18.2.9 Strategic Alliances or Partnerships
- 18.2.10 Recent Developments
- 18.2.11 Growth Strategy and Outlook
- 18.3 Data Patterns (India) Limited
- 18.4 Astra Microwave Products Limited
- 18.5 Centum Electronics Limited
- 18.6 Paras Defence and Space Technologies Limited
- 18.7 Zen Technologies Limited
- 18.8 DCX Systems Limited
- 18.9 Apollo Micro Systems Limited
- 18.10 Avantel Limited
- 18.11 Alpha Design Technologies Private Limited
- 18.12 Other Relevant Market Participants
Note: Every listed company is profiled on the structure shown under the first company. The company list is preliminary and may change based on research findings, market developments, data availability and client requirements.
Chapter 19 Disclaimer
- 19.1 Research and Forecast Disclaimer
- 19.2 Data Source and Estimation Limitations
Note: The depth of individual sections depends on data availability for this market. Volume, capacity, trade and other unit-based metrics are included where applicable.

