Market Overview
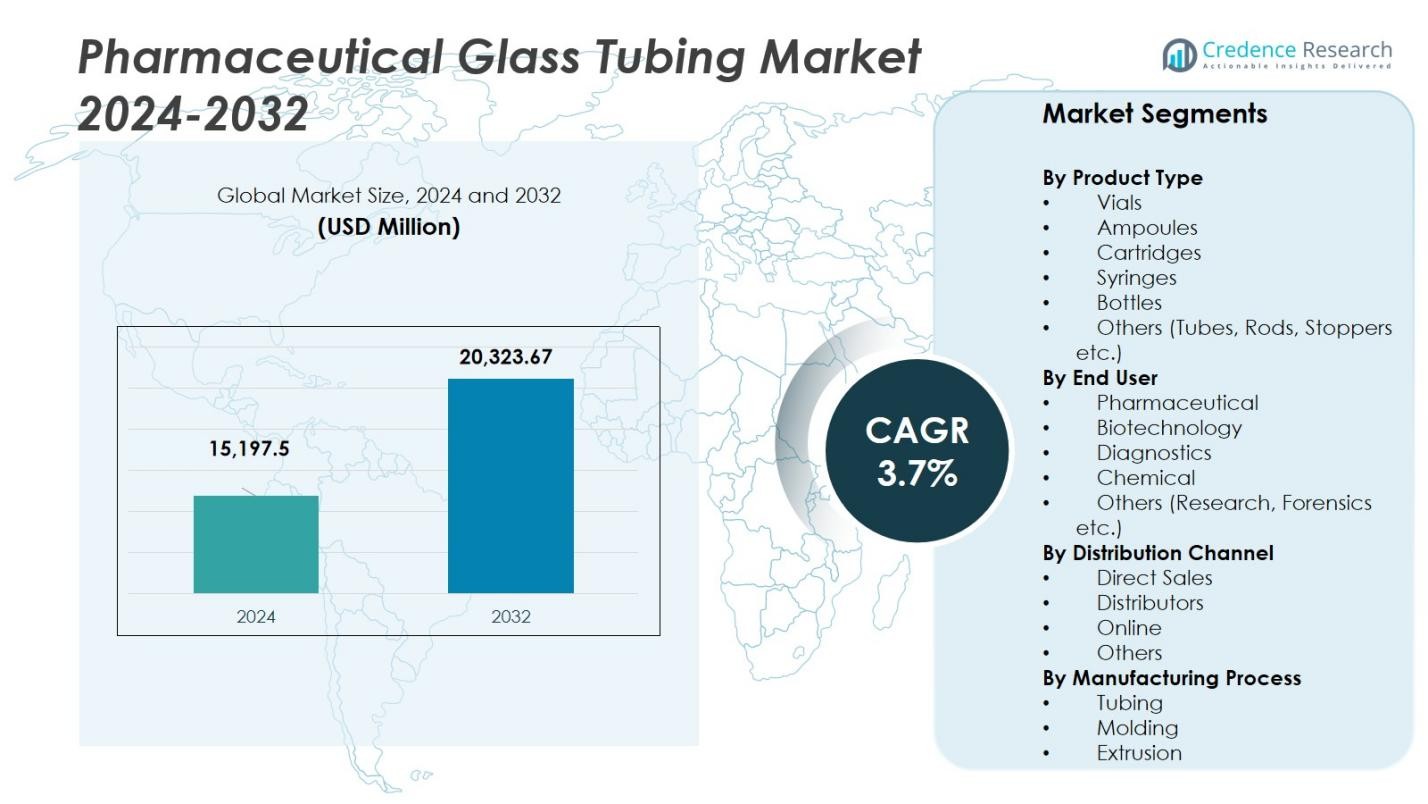
The pharmaceutical glass tubing market size was valued at USD 15,197.5 million in 2024 and is anticipated to reach USD 20,323.67 million by 2032, growing at a CAGR of 3.7% during the forecast period.
| REPORT ATTRIBUTE |
DETAILS |
| Historical Period |
2020-2023 |
| Base Year |
2024 |
| Forecast Period |
2025-2032 |
| Pharmaceutical Glass Tubing Market Size 2024 |
USD 15,197.5 Million |
| Pharmaceutical Glass Tubing Market, CAGR |
3.7% |
| Pharmaceutical Glass Tubing Market Size 2032 |
USD 20,323.67 Million |
The Pharmaceutical glass tubing market is characterized by key players such as Schott AG, Nipro Pharma Corporation, Corning Incorporated, NEG Glass, PreCision Glass & Packaging, Shandong Pharmaceutical Glass Co., Ltd., Borosil Glass Works Ltd., Thermo Fisher Scientific, Richland Glass, and Haldyn Glass Ltd. These companies dominate the market through continuous innovation in production processes, strategic investments in sustainability, and expansion of their manufacturing capabilities to cater to growing global demand for injectable drugs and biologics. The leading region in the Pharmaceutical glass tubing market is North America, which holds a dominant market share of 39.54% in 2024. This is driven by the region’s established pharmaceutical industry, heavy investment in biotechnology, and stringent regulatory frameworks that ensure the quality of pharmaceutical packaging. Europe ranks second with a market share of 28.2%, supported by its strong glass manufacturing heritage and emphasis on sustainable packaging solutions. The Asia-Pacific region is the fastest-growing, capturing 22.6% of the market share.
 Market Insights
- The market size of the Pharmaceutical glass tubing market stood at USD 15,197.5 million in 2024 and is expected to grow at a CAGR of 3.7% through the forecast period.
- Growth is being driven by the rising demand for biologics, injectable therapies and vaccines, which require high‑performance glass tubing for secure, sterile pharmaceutical packaging.
- Trends include a shift toward sustainable and eco‑friendly packaging solutions and increasing use of online and digital distribution channels that enhance reach and efficiency.
- Restraints arise from high production and raw‑material costs—such as increased energy consumption and fl uctuations in silica and soda ash prices—which challenge profitability and entry for smaller manufacturers.
- Regional analysis shows North America leading with a market share of 39.54%, Europe at approximately 28.2%, and Asia‑Pacific at around 22.6%, while product type segmentation indicates the vials sub‑segment holds roughly 30% of the total market.
Access crucial information at unmatched prices!
Request your sample report today & start making informed decisions powered by Credence Research Inc.!
Download Sample
Market Segmentation Analysis:
By Product Type:
The pharmaceutical glass tubing market is segmented by product type into vials, ampoules, cartridges, syringes, bottles, and others (such as tubes, rods, stoppers, etc.). Among these, vials hold the dominant market share, accounting for approximately 30% of the total market. This dominance is driven by their widespread use in packaging injectable drugs and vaccines, which are increasingly in demand due to the growing prevalence of chronic diseases and the ongoing need for COVID-19 vaccination campaigns. The vials’ ability to provide secure and sterile storage for biologic and pharmaceutical products further propels their market share.
- For instance, companies like Schott AG and Corning produce pharmaceutical glass vials known for their high barrier properties and sterile storage capabilities, critical for biologic and injectable formulations.
By End User:
The end-user segment of the pharmaceutical glass tubing market includes pharmaceutical, biotechnology, diagnostics, chemical, and others (such as research and forensics). The pharmaceutical sector dominates this segment with a share of about 45%, reflecting the large-scale demand for glass packaging solutions to store and distribute various drug formulations. The growth of this sub-segment is primarily fueled by the increasing need for injectable medications, vaccines, and biologics, all of which require reliable and sterile packaging materials like glass tubing. Furthermore, regulatory requirements for the safe storage and transport of pharmaceuticals further support this dominance.
- For instance, manufacturers like Gerresheimer and SCHOTT supply high-quality glass tubing that meets stringent regulatory standards for sterility and safety, crucial for pharmaceutical applications.
By Distribution Channel:
The distribution channel segment of the pharmaceutical glass tubing market is categorized into direct sales, distributors, online platforms, and others. Distributors lead this segment with a market share of roughly 40%, as they play a crucial role in ensuring the widespread availability of pharmaceutical glass products to manufacturers and end-users. Distributors’ extensive networks and logistics capabilities are key drivers of this segment’s growth. Additionally, the increasing shift towards e-commerce and online sales channels is contributing to the expansion of this segment, offering convenience and broader market access.
Key Growth Drivers
Rising Demand for Biologics and Injectables
The increasing prevalence of chronic diseases, cancer, and autoimmune disorders has significantly fueled the demand for biologics and injectable medications. These treatments, which require secure, sterile packaging, have driven the growth of the pharmaceutical glass tubing market. Glass tubes, such as vials and ampoules, offer superior protection against contamination, ensuring product integrity and safety. This trend, combined with the global shift towards biologic therapies and vaccine production, is expected to continue propelling the demand for pharmaceutical glass packaging.
- For instance, SCHOTT Pharma offers its adaptiQ® sterile glass vials made from FIOLAX® borosilicate glass, designed specifically for biologics, proteins, and chemicals to maintain drug integrity and protect against contamination.
Advancements in Pharmaceutical and Vaccine Production
The global emphasis on vaccine development, especially following the COVID-19 pandemic, has acted as a key driver for the pharmaceutical glass tubing market. Glass tubing products, such as vials and ampoules, are crucial for the packaging and storage of vaccines. The continuous advancements in pharmaceutical manufacturing processes, particularly in the production of injectable vaccines and biologics, are anticipated to fuel the market further. This growth is supported by investments in biotechnology and the increasing number of clinical trials, all of which demand high-quality glass packaging solutions.
- For instance, Nipro launched its innovative Direct-to-Fill (D2F™) glass vials, supporting seamless aseptic filling operations and enhanced mechanical durability through unique nest and tub packaging formats.
Strict Regulatory Standards for Pharmaceutical Packaging
Government regulations for pharmaceutical packaging have become more stringent, particularly in terms of safety and quality. Glass is considered an ideal material for packaging injectable drugs due to its ability to preserve drug stability, maintain sterility, and provide tamper-evident features. Regulatory agencies, such as the FDA and EMA, enforce stringent requirements for pharmaceutical packaging materials, which encourages manufacturers to adopt glass tubing solutions. Compliance with these regulations boosts the demand for high-quality, reliable glass containers across the pharmaceutical sector, fostering market growth.
Key Trends & Opportunities
Shift Towards Sustainable and Eco-Friendly Packaging
The growing demand for sustainable packaging solutions presents a significant opportunity for the pharmaceutical glass tubing market. As environmental concerns rise, companies are focusing on reducing the carbon footprint of their products. Glass is a fully recyclable material, making it a preferred choice for eco-conscious pharmaceutical manufacturers. This trend towards sustainability offers an opportunity for growth, particularly in regions with stringent environmental regulations. Manufacturers investing in environmentally friendly glass packaging solutions are well-positioned to capitalize on this growing consumer preference for green products.
- For instance, SCHOTT has developed FIOLAX Pro and OCF (optimised chemical formulation) glasses, which lower carbon emissions during production while maintaining high product quality.
Growth of Online Distribution Channels
The rise of e-commerce is reshaping the pharmaceutical glass tubing market, presenting new opportunities for growth. As online retail and distribution channels become more prevalent, pharmaceutical glass tubing manufacturers are increasingly adopting digital platforms to reach a broader customer base. E-commerce platforms facilitate direct sales, offering convenience and improving market access for both large manufacturers and small-scale pharmaceutical companies. The expanding online distribution network offers cost-effective solutions and greater accessibility, particularly in emerging markets where traditional distribution channels may be less established.
- For instance, SGD Pharma’s recent acquisition of Alphial, an Italy-based tubular glass manufacturer, strengthens its global supply chain by expanding ready-to-use glass packaging capacity and enhancing access in Europe through digital sales and distribution networks.
Key Challenges
High Production and Material Costs
One of the significant challenges in the pharmaceutical glass tubing market is the high cost of raw materials and production processes. Glass manufacturing requires high-energy consumption, and the cost of raw materials such as silica sand, soda ash, and limestone has fluctuated, leading to higher production costs. Additionally, the specialized nature of pharmaceutical-grade glass tubing, which requires stringent quality control, increases the overall manufacturing expenses. These rising costs could put pressure on small and medium-sized companies to compete, potentially limiting market entry and expansion.
Risk of Breakage and Safety Concerns
While glass is highly regarded for its safety and preservation properties, the inherent risk of breakage remains a significant challenge in the pharmaceutical glass tubing market. Fragility during transportation and handling poses a safety concern for pharmaceutical manufacturers. Any breakage or contamination could lead to product loss, delays in distribution, and potential safety hazards. To address this challenge, manufacturers are increasingly exploring alternative materials, but glass still remains the standard for high-value pharmaceutical packaging, balancing safety concerns with the material’s benefits.
Regional Analysis
North America
North America holds a significant portion of the global pharmaceutical glass tubing market, with a share of 39.54 % in 2024. This region has large demand for premium injectable therapies and biologics, supported by a mature healthcare infrastructure and stringent packaging regulations. Manufacturers are increasing local production capacity and enhancing supply‑chain resilience to meet rising demand from domestic and export markets. Investments in advanced manufacturing technologies and automation in the U.S. and Canada further strengthen the region’s leadership position in high‑quality glass tubing solutions.
Europe
Europe accounted for over 28.2 % of the pharmaceutical glass tubing market in 2025 and remains the second‑largest region. The market is supported by a strong biopharmaceutical sector, long‑standing glass manufacturing expertise, and rigorous regulatory frameworks that emphasise material quality and sustainability. Glass tubing producers are adapting to EU circular‑economy policies and targeting recyclability and carbon‑neutral furnace operations. Thus, Europe remains a key hub for innovation and premium packaged injectable therapies, underlining its pivotal role in the global market.
Asia‑Pacific
Asia‑Pacific captures approximately 22.6 % of the global pharmaceutical glass tubing market and is the fastest‑growing region. Growth is driven by rapid expansion of pharmaceutical manufacturing in China and India, increased investments in biotechnology, regulatory alignment with global standards, and rising healthcare access. Local manufacturers are scaling production to serve both domestic and export demand. As a result, the region offers major opportunities for volume growth and cost optimisation in the global glass tubing value chain.
Latin America, Middle East & Africa (LAMEA)
The Latin America, Middle East & Africa region accounts for the remaining share of the global pharmaceutical glass tubing market and is gradually gaining traction. Demand is growing due to increasing access to healthcare, a rise in generic injectable drug manufacturing, and expanding local pharmaceutical infrastructure. Despite lower per‑capita consumption compared to North America, Europe and Asia‑Pacific, the region presents attractive growth prospects as glass tubing producers seek to establish local production and distribution networks to support localized supply‑chains.
Market Segmentations:
By Product Type
- Vials
- Ampoules
- Cartridges
- Syringes
- Bottles
- Others (Tubes, Rods, Stoppers etc.)
By End User
- Pharmaceutical
- Biotechnology
- Diagnostics
- Chemical
- Others (Research, Forensics etc.)
By Distribution Channel
- Direct Sales
- Distributors
- Online
- Others
By Manufacturing Process
By Region
- North America
- Europe
- Germany
- France
- U.K.
- Italy
- Spain
- Rest of Europe
- Asia Pacific
- China
- Japan
- India
- South Korea
- South-east Asia
- Rest of Asia Pacific
- Latin America
- Brazil
- Argentina
- Rest of Latin America
- Middle East & Africa
- GCC Countries
- South Africa
- Rest of the Middle East and Africa
Competitive Landscape
The competitive landscape of the pharmaceutical glass tubing market features major key players such as Schott AG, Nipro Pharma Corporation, Corning Incorporated, NEG Glass and PreCision Glass & Packaging, among others. The market is moderately consolidated, with a handful of global players commanding significant production capacity and technological advantage. These firms compete through investment in advanced manufacturing facilities, expansion into emerging geographies and adoption of new materials and coatings to meet regulatory and packaging requirements. Competitive differentiation increasingly revolves around sustainability credentials, supply‑chain resilience and value‑added service offerings rather than simple pricing. Mid‑tier and regional manufacturers face pressure from raw‑material costs, regulatory compliance burdens and the need to scale rapidly to remain relevant.
Key Player Analysis
Recent Developments
- In August 2025, SGD Pharma acquired Alphial S.r.l., an Italian manufacturer specializing in tubular vials and ampoules.
- In August 2025, Schott AG launched local production of high‑precision syringe and cartridge glass tubing in India, expanding its manufacturing capabilities in Jambusar, Gujarat.
- In March 2023, SCHOTT AG launched production of its FIOLAX® amber pharmaceutical glass tubing at its facility in Jambusar, India, to address demand for light‑sensitive drug packaging in the Asia region.
- In June 2023, Corning announced a joint venture with SGD Pharma to establish a new glass tubing facility in India, further expanding access to Corning’s Velocity Vial technology in the region.
Shape Your Report to Specific Countries or Regions & Enjoy 30% Off!
Report Coverage
The research report offers an in-depth analysis based on Product Type, End User, Distribution Channel, Manufacturing Process and Region. It details leading market players, providing an overview of their business, product offerings, investments, revenue streams, and key applications. Additionally, the report includes insights into the competitive environment, SWOT analysis, current market trends, as well as the primary drivers and constraints. Furthermore, it discusses various factors that have driven market expansion in recent years. The report also explores market dynamics, regulatory scenarios, and technological advancements that are shaping the industry. It assesses the impact of external factors and global economic changes on market growth. Lastly, it provides strategic recommendations for new entrants and established companies to navigate the complexities of the market.
Future Outlook
- Growth in demand will accelerate as injectable therapies, biologics and vaccines increase globally and continue to dominate treatment protocols.
- Manufacturers will expand capacity in regions with emerging pharmaceutical production, supporting localisation of supply chains and shortening lead times.
- Regulatory favour for Type I borosilicate glass and other high‑performance glass materials will strengthen, reinforcing glass tubing as preferred over many alternative materials.
- Sustainability imperatives will drive increased use of recycled content, closed‑loop glass manufacturing and energy‑efficient processes, offering differentiation.
- Digitalisation of manufacturing and smart packaging (e.g., embedded sensors, RFID tags) will enable value‑added glass tubing solutions and open new revenue opportunities.
- Adoption of ready‑to‑use (RTU) packaging formats will rise, simplifying fill‑finish operations and increasing demand for pre‑qualified glass tubing.
- Asia‑Pacific and other emerging markets will represent major incremental value, fueled by rising healthcare access, domestic production and regulatory convergence.
- Cost pressures from raw‑material volatility and energy intensity will push manufacturers to adopt automation, economies of scale and vertical integration.
- Competitive dynamics will shift from commodity supply toward innovation, service‑oriented contracts and supply‑chain reliability as key differentiators.
- Alternative materials such as polymer or hybrid systems will pose substitution risk in certain low‑value segments, making product quality, regulation and performance critical for glass tubing manufacturers.


