
Payer rules and employer plans anchor remote advice demand
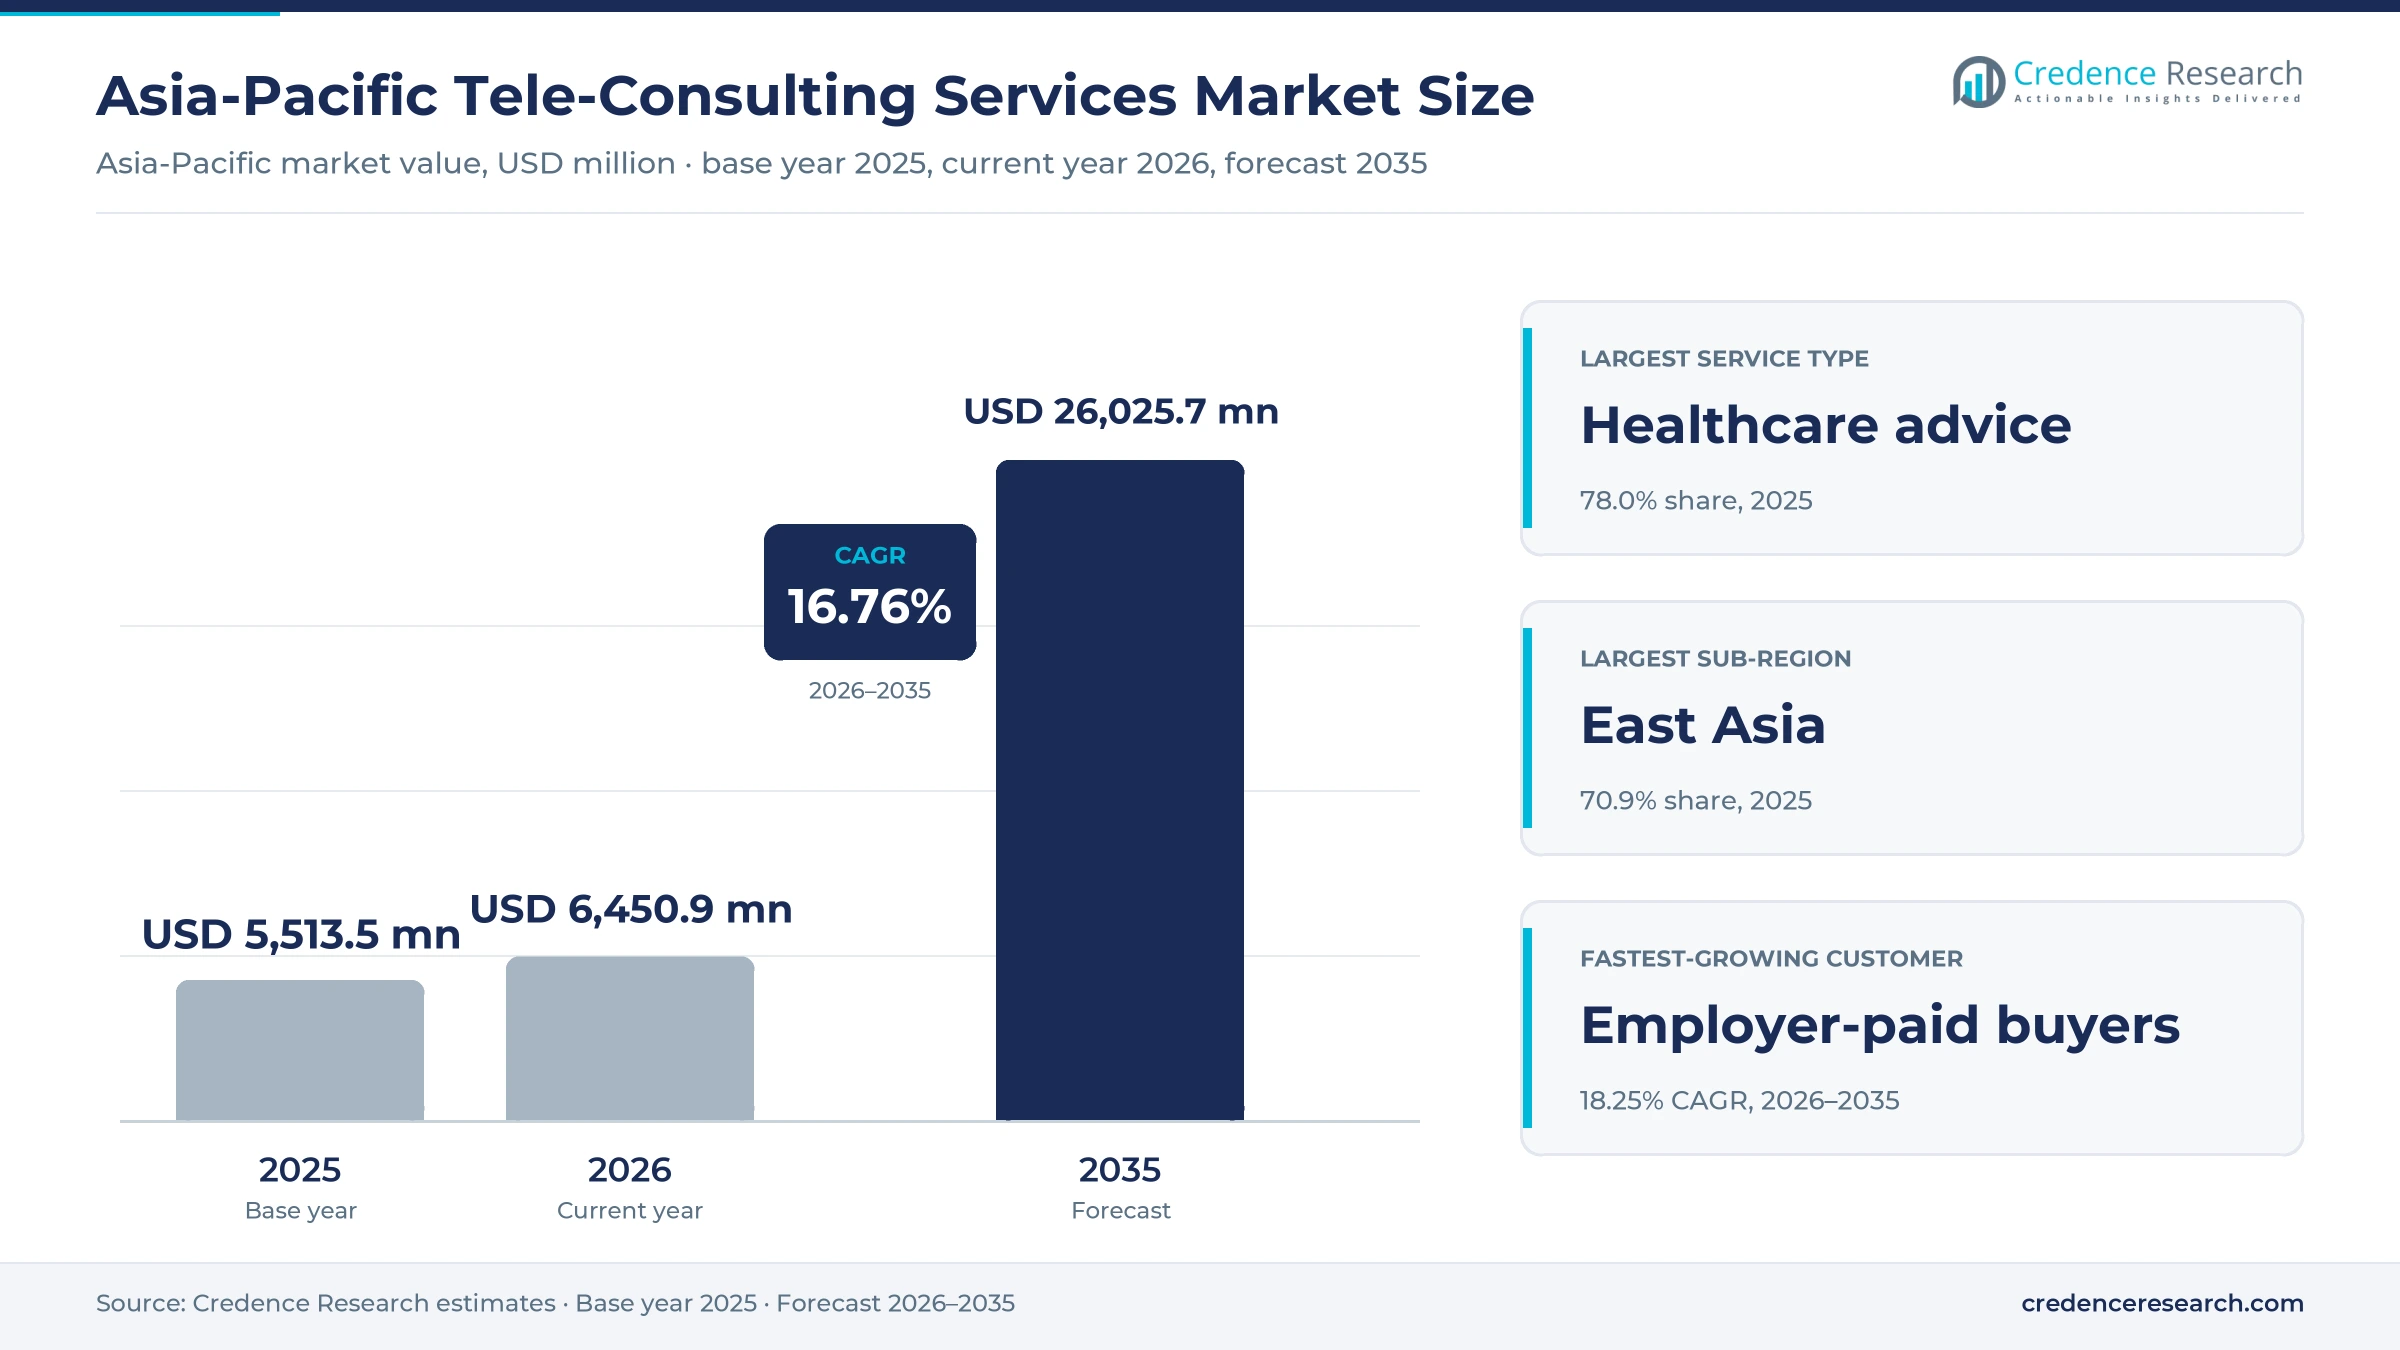
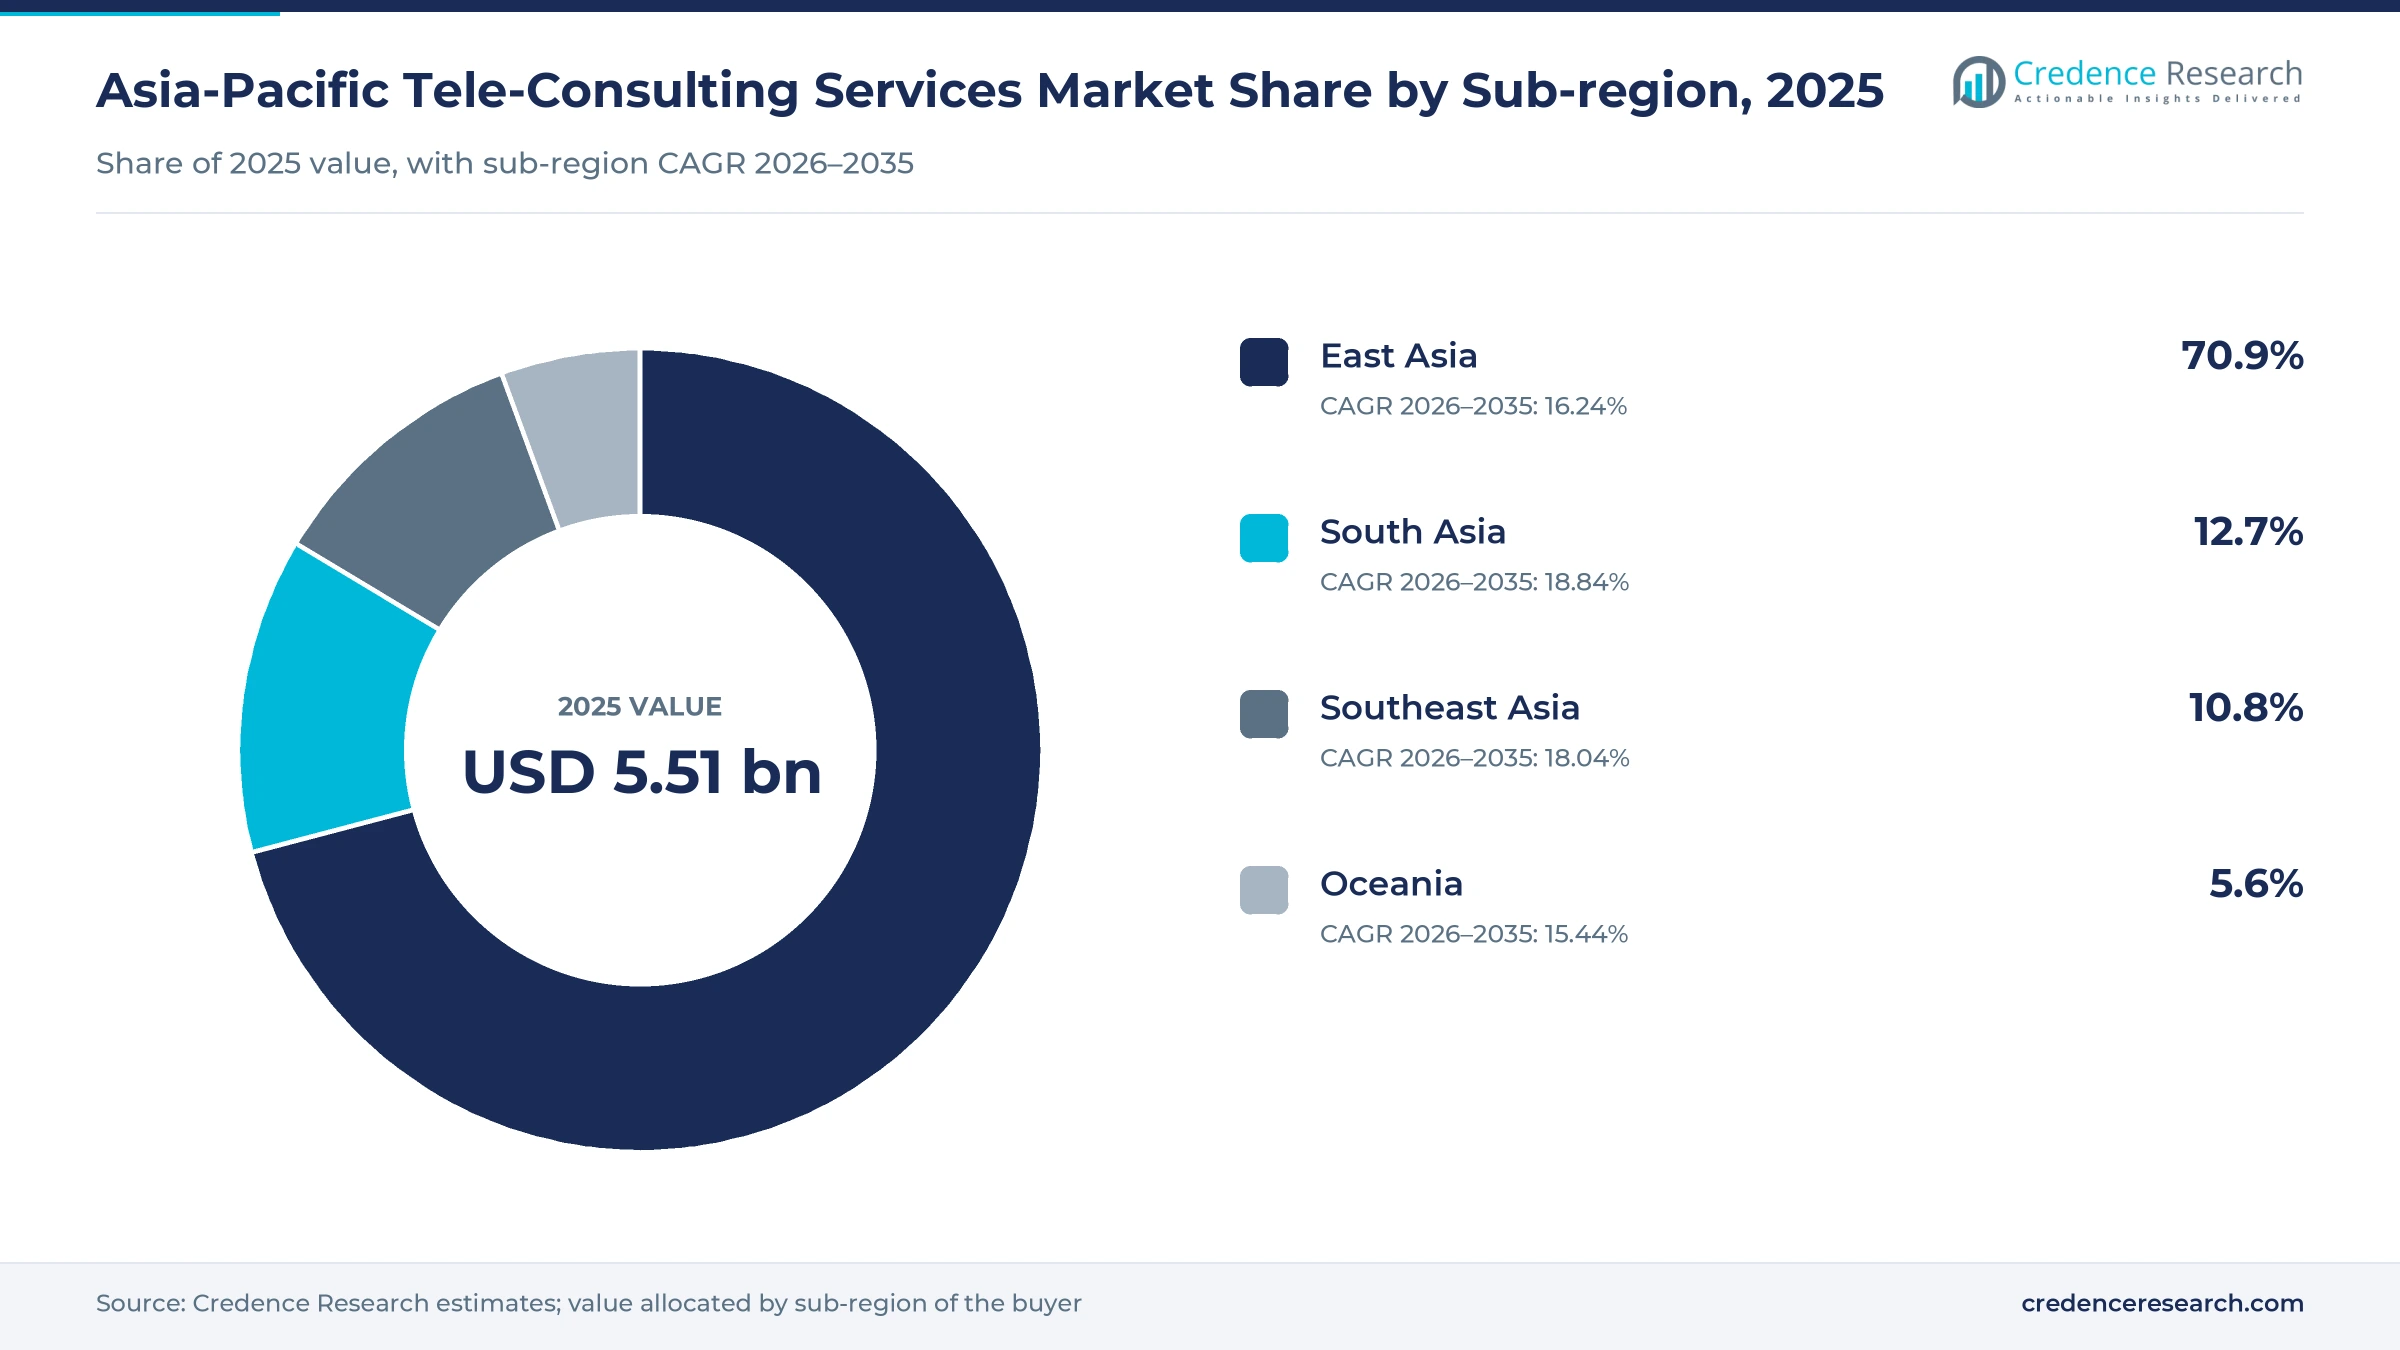
The Asia-Pacific tele-consulting services market was valued at USD 5.51 billion in 2025 and is projected to increase from USD 6.45 billion in 2026 to USD 26.03 billion by 2035, registering a CAGR of 16.76% during 2026–2035. Demand comes from patients who want quick access to doctors, employers that buy remote care for staff, and insurers and public payers that fund follow-up visits by video, phone or text. East Asia held the largest sub-regional share, 70.9% in 2025, because China runs thousands of internet hospitals and large platform networks. South Asia is the fastest-growing sub-region at 18.84% a year, as public programs in India bring free remote consultations to villages. Southeast Asia and Oceania add demand from insurer-backed apps and payer-funded follow-up care. South Korea also passed a law on Dec. 2, 2025, that makes remote medical care a permanent part of its health system after a long pilot period.
Which remote advice services does the regional estimate cover?
The estimate measures spending on professional advice delivered at a distance by video, telephone or asynchronous text across the Asia-Pacific region. It covers healthcare consultations with licensed doctors, as well as business, legal and financial advice sessions sold to individuals, employers, insurers and public payers. Values are measured as fees, subscriptions and contracted program payments received by the service operator.
The estimate excludes drug sales, remote patient monitoring devices, laboratory tests and general software licenses that are sold without a live or written consultation. The value chain runs from video and messaging technology providers through platforms, clinic groups and practitioner networks to the patients, employers, insurers and government programs that pay for each session in East Asia, South Asia, Southeast Asia and Oceania.
Asia-Pacific Tele-Consulting Services Market Insights
- The Asia-Pacific tele-consulting services market was valued at USD 5.51 billion in 2025 and is projected to reach USD 26.03 billion by 2035, registering a CAGR of 16.76% during 2026–2035.
- East Asia held a 70.9% share of 2025 value, because China ran 3,756 internet hospitals at the end of 2024.
- Healthcare teleconsultation led service demand with a 78.0% share of 2025 value, because medical follow-up is the most frequent remote session.
- South Korea passed a law on Dec. 2, 2025, that turns its long pilot of remote medical care into a permanent service.
- Ping An Good Doctor reported more than 6,700 paying corporate clients for 2025, up 83.1% from the year before.
Healthcare advice leads while legal advice grows fastest
Why does healthcare advice dominate service demand?
Based on service type, the market is categorized into healthcare teleconsultation, business and management teleconsulting, legal teleconsulting and financial teleconsulting. Healthcare Teleconsultation led with a 78.0% share of 2025 value, because medical follow-up visits happen far more often than other advice sessions. Legal Teleconsulting grows fastest at 18.15% a year, as public legal aid programs and law firms move first advice sessions to phone and video.
How do self-paying individuals shape customer demand?
Based on customer type, the market is categorized into self-paying individuals, employer-paid buyers and insurer and public-payer buyers. Self-Paying Individuals led with a 46.0% share of 2025 value, because many patients in China and Southeast Asia pay platform fees from their own pockets. Employer-Paid Buyers grow fastest at 18.25% a year, as companies add remote doctors to staff health benefits.
Why do video sessions lead delivery?
Based on delivery model, the market is categorized into video consultations, telephone consultations and asynchronous text consultations. Video Consultations led with a 40.0% share of 2025 value, because payers such as Medicare in Australia treat video as the preferred option. Asynchronous Text Consultations grow fastest at 17.48% a year, as AI tools draft histories and replies that doctors then review.
How does direct consumer acquisition lead sales?
Based on sales channel, the market is categorized into direct consumer acquisition, enterprise procurement and institutional referral. Direct Consumer Acquisition led with a 50.0% share of 2025 value, because large e-commerce and insurance apps reach patients directly on their phones. Enterprise Procurement grows fastest at 17.98% a year, as employers and insurers sign contracts that bundle remote doctors into benefit plans.
| Segment Group | Leading Sub-segment | Share, 2025 | Fastest-growing Sub-segment | CAGR, 2026–2035 |
|---|---|---|---|---|
| By Service Type | Healthcare Teleconsultation | 78.0% | Legal Teleconsulting | 18.15% |
| By Customer Type | Self-Paying Individuals | 46.0% | Employer-Paid Buyers | 18.25% |
| By Delivery Model | Video Consultations | 40.0% | Asynchronous Text Consultations | 17.48% |
| By Sales Channel | Direct Consumer Acquisition | 50.0% | Enterprise Procurement | 17.98% |
Request a Free Sample
Fill in your details and we'll send you a free sample report.
- Sample data tables & charts
- Research methodology
Reimbursement, employer plans and public programs lift use
How does reimbursable continuity of care lift demand?
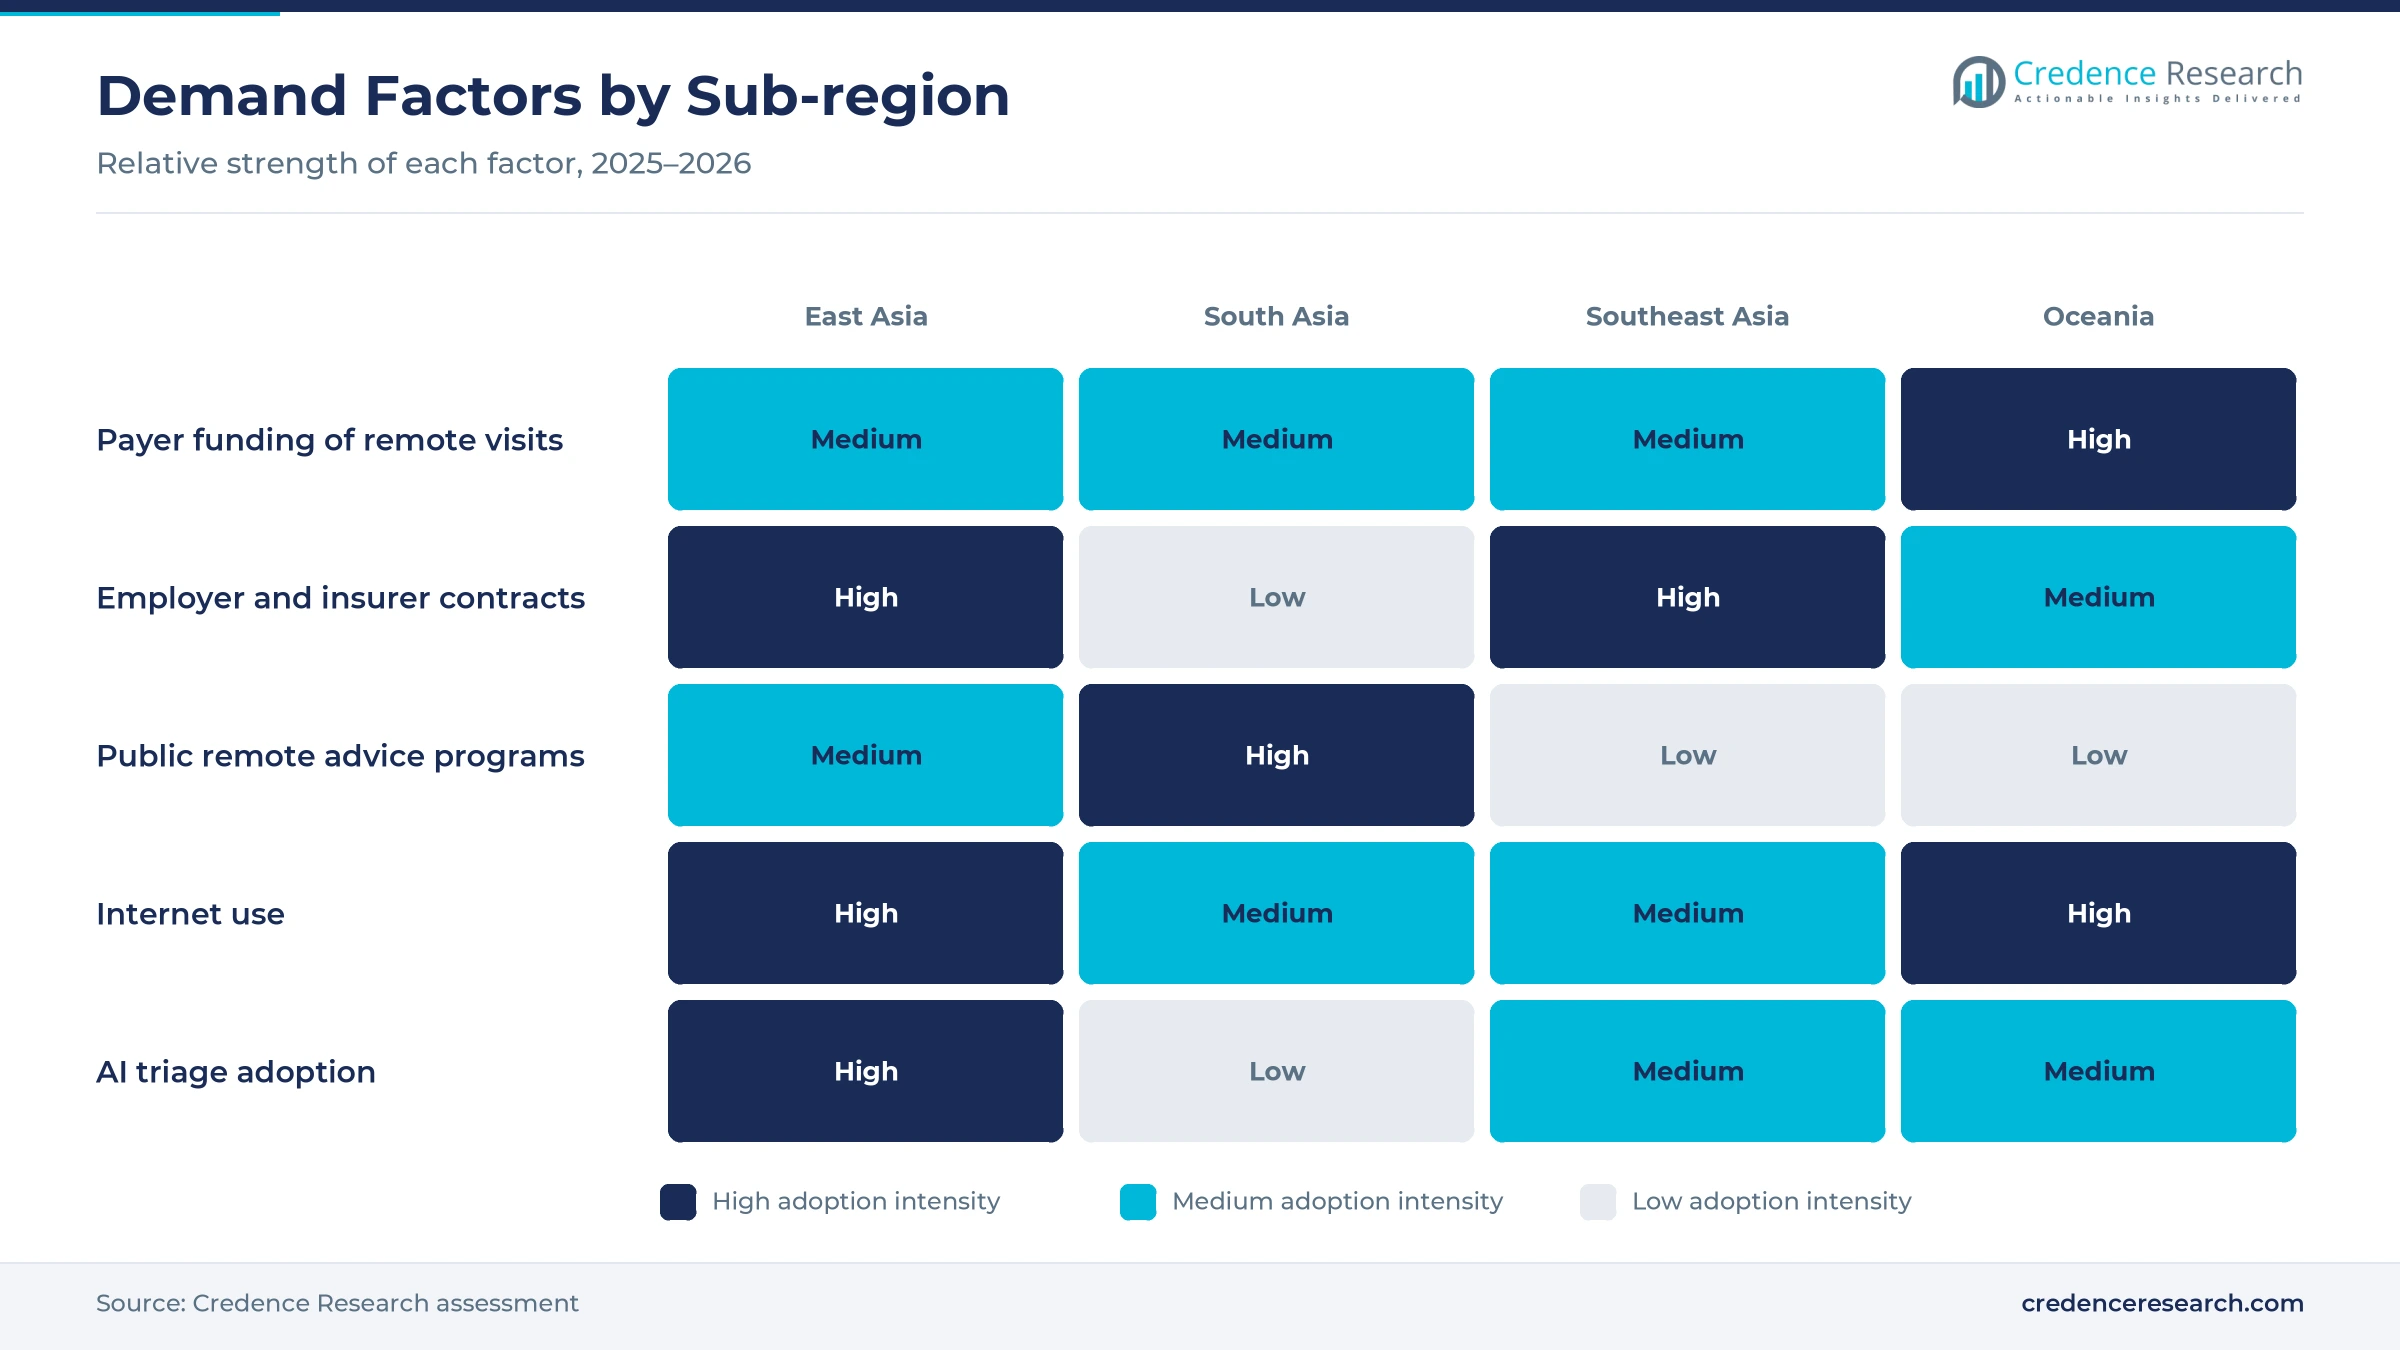
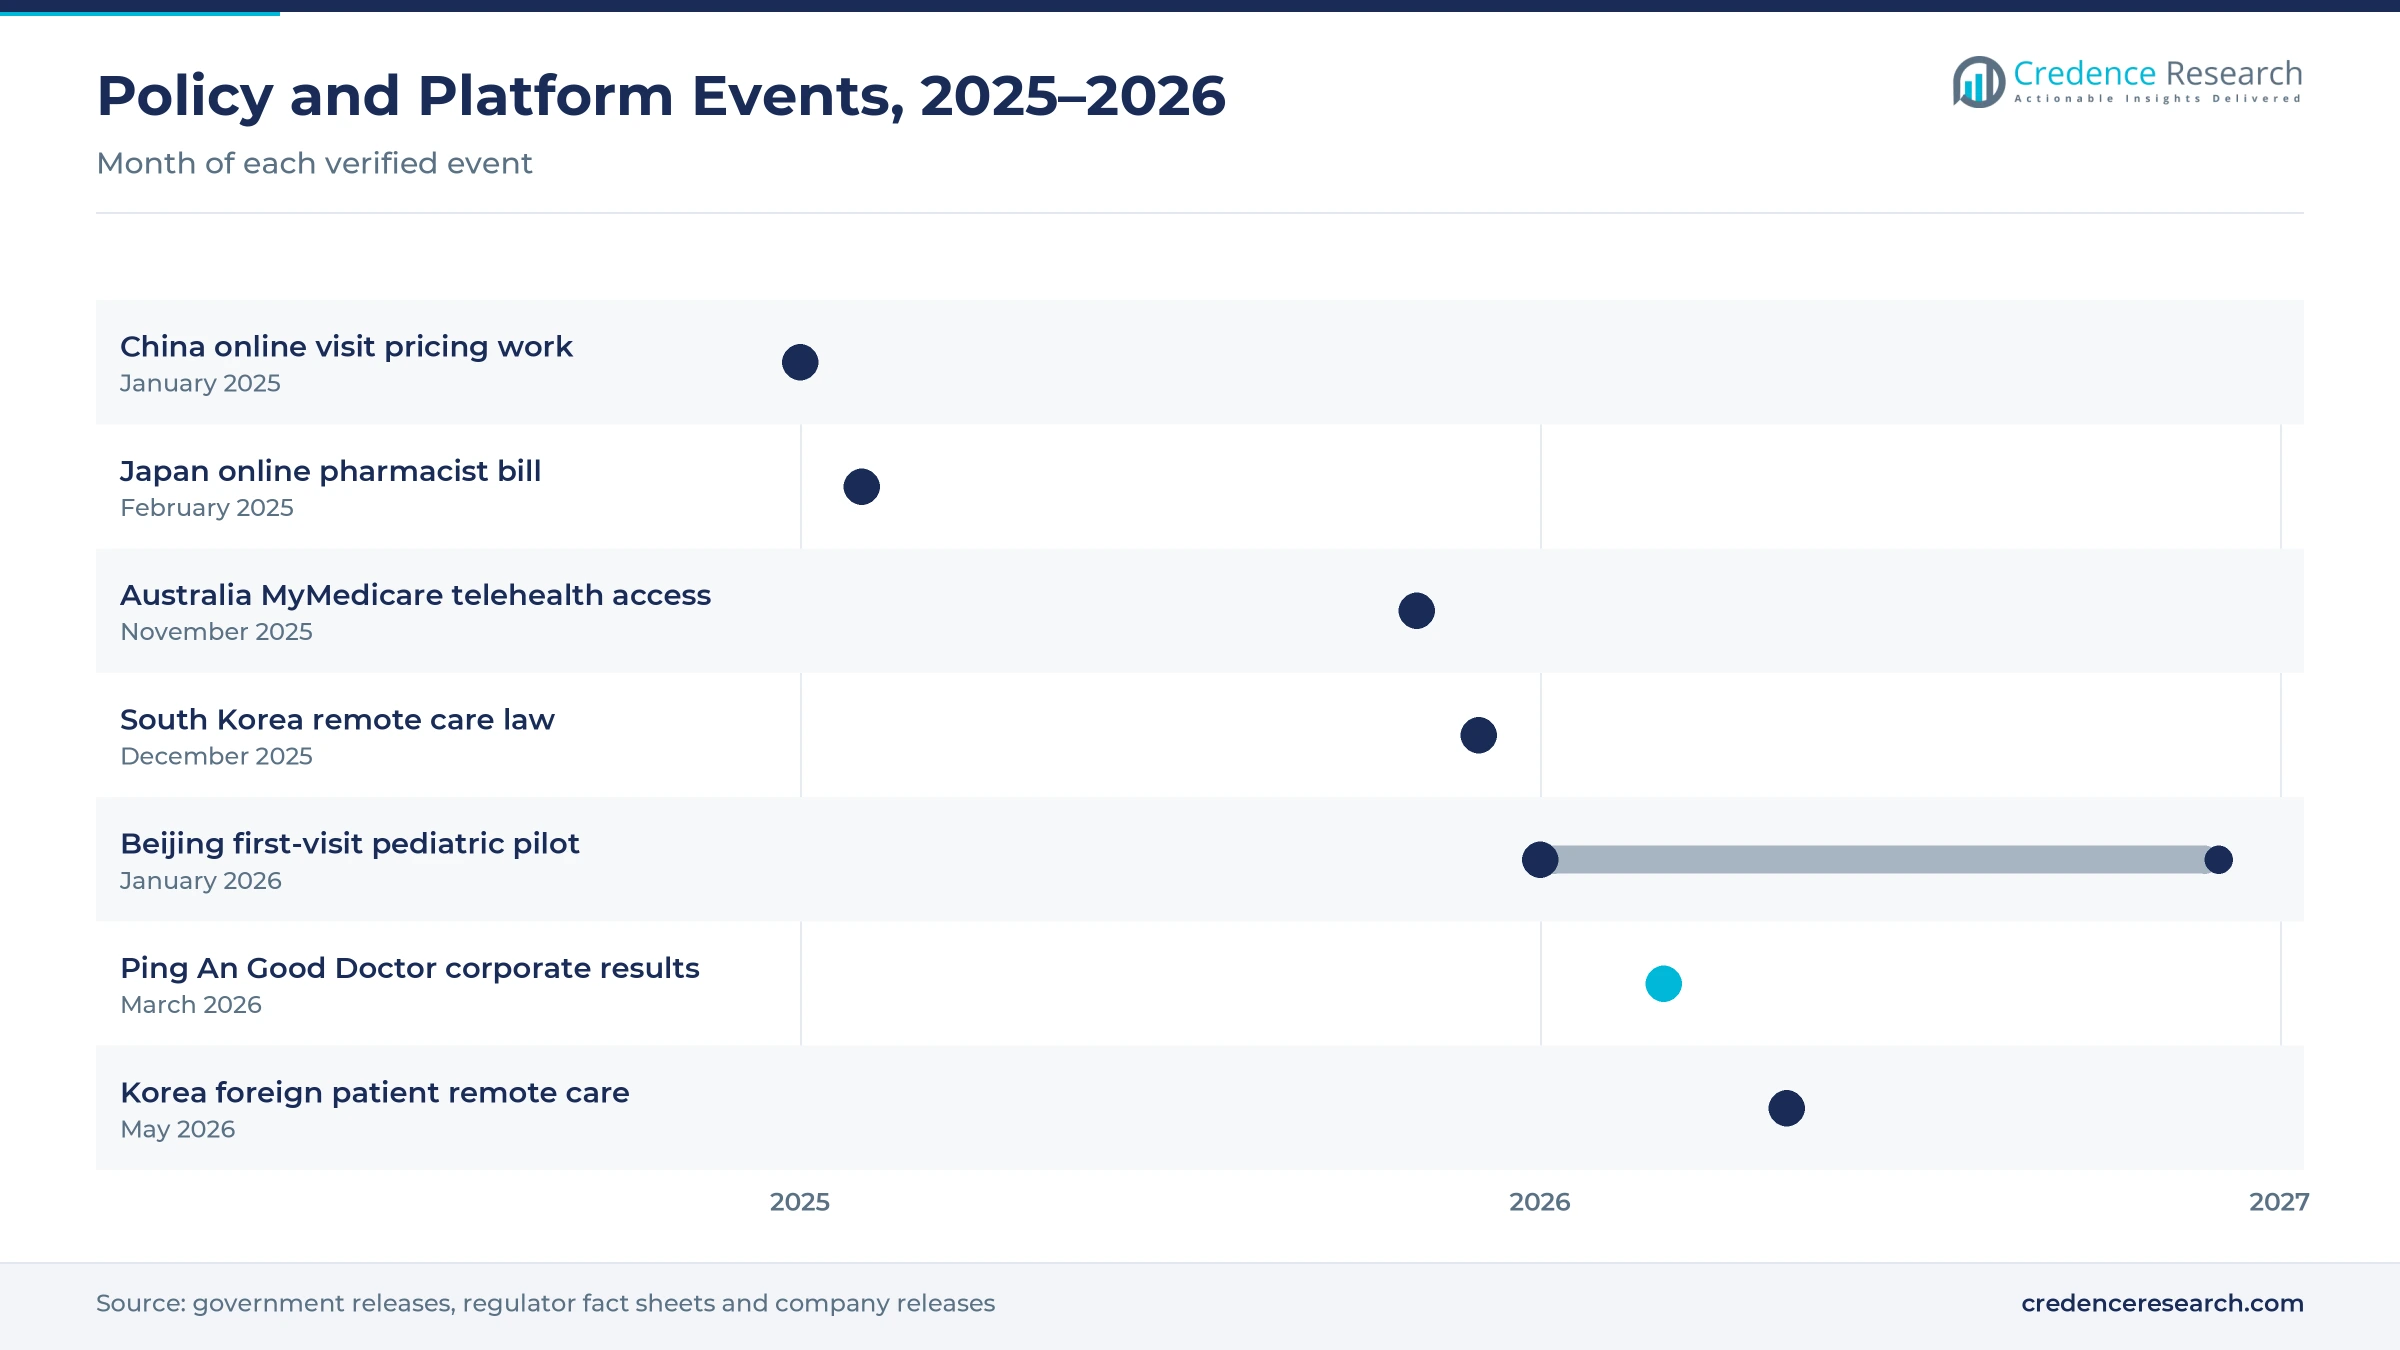
Payers now fund remote follow-up visits with a known doctor or practice, which turns occasional sessions into regular, reimbursed care. In Australia, Medicare telehealth items require a face-to-face service within the prior 12 months, and from Nov. 1, 2025, patients registered in MyMedicare can access all listed telehealth services through their practice, according to a health department fact sheet. China's National Healthcare Security Administration said in January 2025 that it had begun setting price guidelines for initial online consultations. South Korea's National Assembly also passed a Medical Service Act revision on Dec. 2, 2025, that treats remote care as a supplement to in-person treatment. As a result, insurer and public-payer buyers hold a meaningful part of customer demand, while video sessions lead delivery with a 40.0% share.
Why does employer-sponsored access widen the buyer base?
Companies now buy remote doctor access as a staff benefit and pay for it under annual contracts, which adds a large group of buyers. Ping An Good Doctor reported more than 6,700 paying corporate clients for 2025, up 83.1% from 2024, according to its annual results release dated March 24, 2026. The company also said its team of about 50,000 in-house and contracted doctors supports these programs. Doctor Anywhere became the telehealth partner of Allianz Partners in 2023, which gave insured members in Singapore, Malaysia, Thailand and the Philippines video consultations with local doctors. In turn, employer-paid buyers grow fastest at 18.25% a year, and enterprise procurement grows at 17.98% a year.
How do digital access and assisted workflows cut costs?
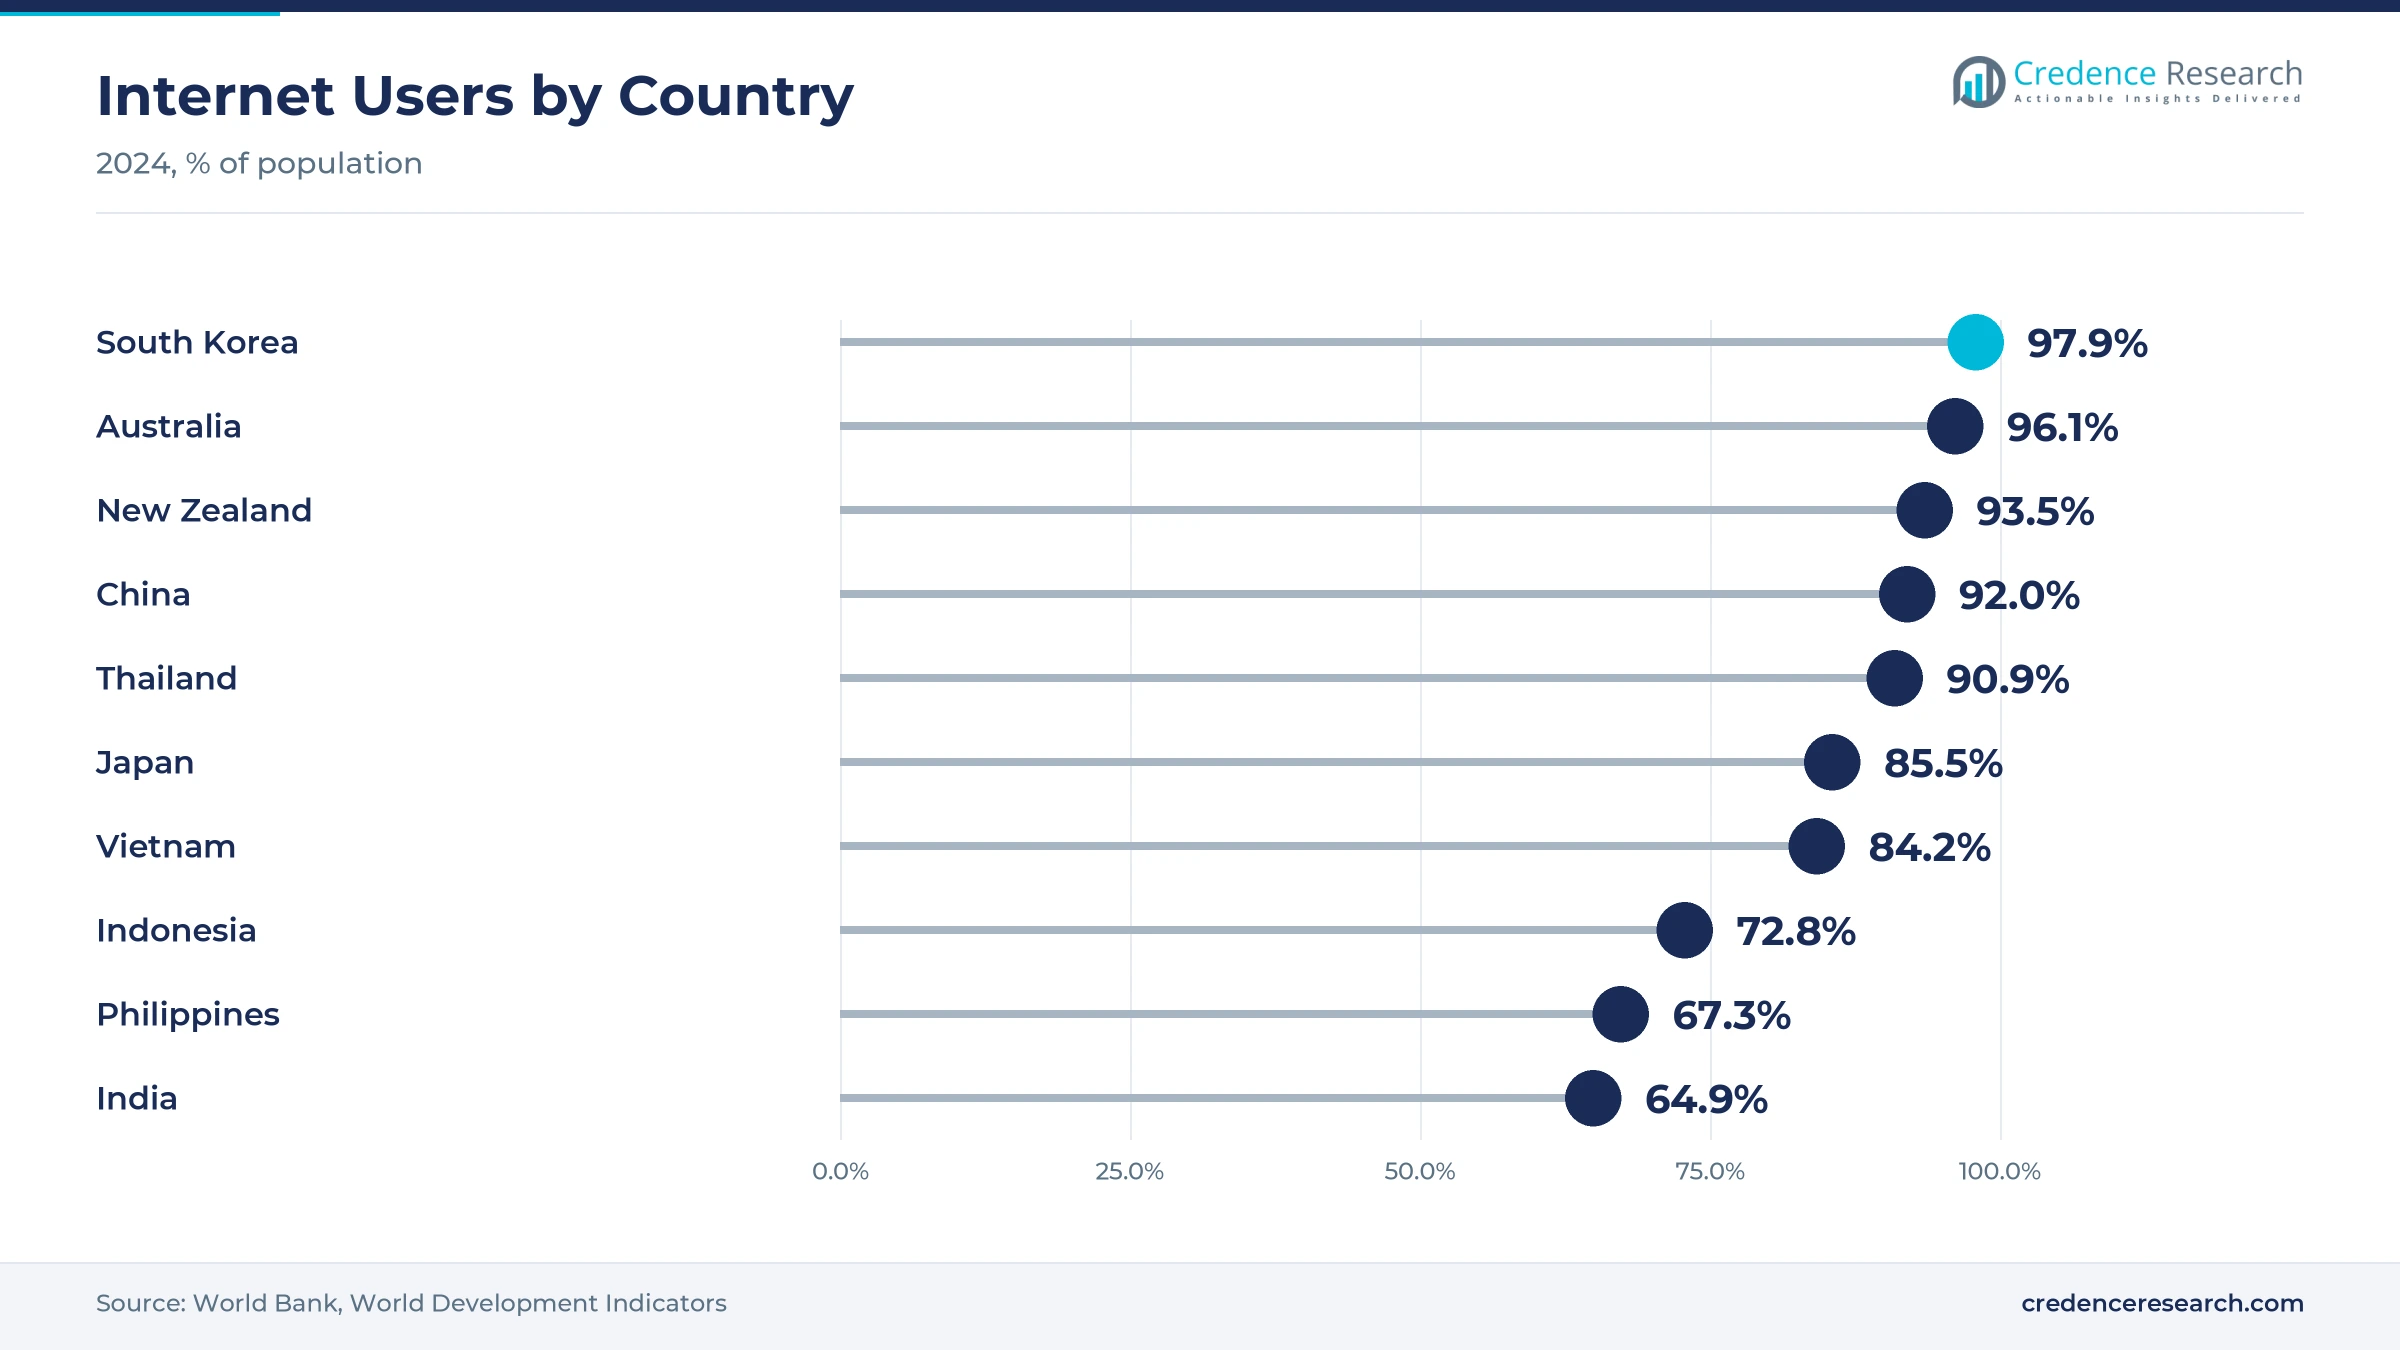
More people are online, and AI tools now handle intake and triage, which lowers the cost of each remote session. Internet use reached 92% of people in China and about 98% in South Korea in 2024, while India stood near 65%, according to World Bank data. Ping An Good Doctor said its cost per consultation fell about 45% in the fourth quarter of 2025 from a year earlier. JD Health also launched its AI Jingyi health system in 2025 with more than 10 types of agents, including AI doctors and AI pharmacists. As a result, asynchronous text consultations grow fastest among delivery models at 17.48% a year, which also supports lower prices for self-paying users.
Why do public remote advice programs build volume?
Governments use phone and video links to reach rural people who live far from doctors and lawyers, which builds large session volumes. India's eSanjeevani service passed 50 crore teleconsultations and handles about 2.5 to 3 lakh consultations a day, according to All India Radio News in October 2026. India's Tele-Law program had given pre-litigation advice to more than 1.12 crore beneficiaries by Dec. 31, 2025, according to a Department of Justice year-end review. The Tele MANAS mental health helpline had also handled more than 18.13 lakh calls by February 2025. In turn, South Asia holds a 12.7% share of 2025 value, and legal teleconsulting grows at 18.15% a year.
AI triage, first-visit pilots and cross-border care emerge
How is the shift to AI-assisted triage changing platforms?
Operators increasingly use AI agents to take histories and answer simple questions before a doctor joins the session. Ping An Good Doctor said nearly 12 million people used its AI Doctor in 2025, and its AI-aided diagnosis covers more than 11,300 diseases. JD Health reported 218 million active users at the end of 2025, and its AI doctor agent Dr. Da Wei offers round-the-clock health advice based on clinical guidelines. Alibaba Health had more than 250,000 licensed physicians, pharmacists and nutritionists contracted as of Sept. 30, 2025, who review cases that AI tools route to them. As a result, text sessions gain share against phone calls, which grow slowest.
Why are first-visit online pilots on the rise?
Regulators now test remote care for patients who have not met the doctor in person, starting with low-risk conditions. China's National Health Commission announced a Beijing pilot that allows first online visits for some pediatric conditions through the end of 2026, according to China Daily. Beijing Children's Hospital and the Capital Institute of Pediatrics opened bookings on Jan. 31 through their WeChat accounts. China already had 3,756 internet hospitals at the end of 2024, and they conducted 130 million online consultations that year. In turn, wider first-visit rules would add new patients in East Asia on top of existing follow-up demand.
Can cross-border remote care open new revenue?
Hospitals want to follow up with foreign patients after they return home, which creates paid remote sessions across borders. South Korea's Ministry of Health and Welfare amended its law on international patients in May 2026 so that doctors can consult, diagnose and prescribe remotely for foreign patients. The minister linked the change to the era of 2 million foreign patients, according to Korea.net. Doctor Anywhere also serves more than 2.8 million users across Southeast Asia and works with an international insurer to serve expatriate members. As a result, institutional referral, with its links to hospitals and insurers, gains new contracts in East Asia and Southeast Asia, where Southeast Asia grows at 18.04% a year.
Is there room for growth in pharmacist and senior care advice?
Aging populations need frequent check-ins that do not always require a doctor, which opens demand for pharmacist and care advice. Japan approved a proposed drug law amendment on Feb. 12, 2025, that lets some nonprescription drugs be sold after an online pharmacist consultation, according to the Chambers digital health guide. People aged 65 and over made up about 30% of Japan's population in 2024, the World Bank reports. Ping An Good Doctor also said more than 240,000 customers were entitled to its home-based senior care service in 2025. In turn, insurer and public-payer buyers and corporate wellness programs gain new reasons to fund regular remote sessions.
Prescribing limits, price pressure and trust slow growth
How do prescribing limits restrict remote care?
Many regulators cap what a doctor can prescribe without an in-person visit, which keeps some cases in clinics. South Korea bans controlled substances in remote consultations and may limit drug types and prescription length for new patients. As a result, platforms lose some cases to clinics, and patients who need regular medicines may avoid remote visits. Platforms respond by focusing on follow-up care and by working with pharmacies and online drug sellers on approved delivery routes.
Why does price pressure squeeze platform margins?
Free public programs set low price expectations for patients, which squeezes the margins of private platforms. India's eSanjeevani offers remote consultations at public health centers, while many private apps compete on low session fees. In turn, private operators struggle to charge enough to cover doctor time and technology costs. Operators respond by selling subscriptions to employers and insurers, and by using AI triage to shorten each session. These steps can lower costs, but they also need careful clinical oversight.
How do trust and quality concerns slow uptake?
Some patients and doctors doubt that a remote session can match an in-person exam, which slows uptake in several countries. Medical groups in South Korea want limits on first-visit prescriptions for safety reasons. As a result, rules for new patients are still being written in several countries. Platforms respond with licensed doctor networks, clear referral rules and quality audits. Australia also uses its 30/20 rule to review doctors who bill very large numbers of phone services.
Why do fragmented national rules raise operating costs?
Each country sets its own licensing, data and payment terms, which raises costs for operators that serve several markets. Singapore has required licenses for teleconsultation providers under its Healthcare Services Act since June 26, 2023. In turn, platforms that serve several Southeast Asian countries must keep separate licenses, doctor pools and record systems. Operators respond by building local teams and partnering with insurers that already hold licenses. This approach slows expansion but lowers the risk of penalties.
East Asia leads while South Asia grows fastest
| Sub-region | Value, 2025 (USD billion) | Share, 2025 | CAGR, 2026–2035 |
|---|---|---|---|
| East Asia | 3.91 | 70.9% | 16.24% |
| South Asia | 0.70 | 12.7% | 18.84% |
| Southeast Asia | 0.60 | 10.8% | 18.04% |
| Oceania | 0.31 | 5.6% | 15.44% |
Why does East Asia hold the largest share?
East Asia held a 70.9% share of 2025 value and grows at 16.24% a year, because China has the largest network of internet hospitals and platforms in the region. China had 3,756 internet hospitals at the end of 2024, and they ran 130 million online consultations that year. South Korea adds demand after its December 2025 law, while Japan widens online pharmacist advice for an aging population.
Why is South Asia the fastest-growing sub-region?
South Asia held a 12.7% share of 2025 value and grows fastest at 18.84% a year, because public programs in India have made remote advice familiar to rural users. eSanjeevani has passed 50 crore teleconsultations through more than 1.42 lakh health center spokes. Tele-Law also covers 2.5 lakh Gram Panchayats across 776 districts, which brings legal advice to villages by phone and video.
How does Southeast Asia build insurer-backed demand?
Southeast Asia held a 10.8% share of 2025 value and grows at 18.04% a year, because insurers and employers fund app-based virtual care for members. Doctor Anywhere serves more than 2.8 million users across the sub-region and offers video consultations for Allianz Partners members. Singapore also licenses teleconsultation providers under its Healthcare Services Act, which gives buyers clear quality rules.
What shapes payer-funded demand in Oceania?
Oceania held a 5.6% share of 2025 value and grows at 15.44% a year, because Medicare in Australia funds telehealth visits within clear rules. Patients registered in MyMedicare gained access to all listed telehealth services through their practice from Nov. 1, 2025. Internet use stood at about 96% in Australia in 2024, and Australian digital health spending supports these services.
Law changes, pilots and platform milestones, 2025 to 2026
| Development | Status and market relevance |
|---|---|
| In November 2025, Alibaba Health reported more than 250,000 licensed physicians, pharmacists and nutritionists contracted with the group. | Expands the professional pool behind online advice |
| In December 2025, South Korea passed a Medical Service Act revision that makes remote medical care permanent. | Ends a pilot that began in 2020 |
| In January 2026, Beijing hospitals opened bookings for first online pediatric visits under a national pilot. | Tests first-visit remote care in China |
| In March 2026, Ping An Good Doctor reported more than 6,700 paying corporate clients for 2025. | Shows rising employer demand for remote doctors |
| In May 2026, South Korea amended its law to allow remote care for foreign patients. | Opens cross-border follow-up services |
AI triage, video links and e-prescribing shape delivery
- AI triage agents take patient histories and sort cases by urgency, which lets doctors spend more time on complex questions.
- Video links connect patients with doctors, lawyers or advisers on ordinary phones, which reduces travel for people in rural areas.
- Electronic prescribing sends prescriptions from the session to a pharmacy, which lets patients receive medicines at home where rules allow.
- Hub and spoke networks link village health centers with specialists in larger hospitals, which spreads scarce expertise across wide areas.
Need a Custom Version of This Report?
Tailor the scope, geography, or segments to your exact requirements.
- Custom geography or segment scope
- Direct access to our analyst team
Platforms compete on doctor networks, payers and AI
Competition in tele-consulting services combines large Chinese health platforms with regional app operators, insurer-backed services and public programs. Ping An Good Doctor sells remote doctor access to corporate clients and reported more than 6,700 paying corporate clients for 2025. JD Health links online consultations with its pharmacy network and reported 218 million active users at the end of 2025. Alibaba Health contracts more than 250,000 licensed professionals for online advice, while WeDoctor runs AI-enabled health services and has revived its plan to list in Hong Kong. Doctor Anywhere competes in Southeast Asia through insurer and employer contracts. Companies compete on the size of their doctor networks, payer contracts and AI tools that lower the cost of each session. Public programs such as eSanjeevani also shape prices, because they offer free sessions to large rural populations.
Companies profiled and their roles in this market
| Company | Type | Role in the market |
|---|---|---|
| Ping An Good Doctor | Health platform | Sells remote doctor access to more than 6,700 corporate clients |
| JD Health | Health platform | Links online consultations with pharmacy sales and AI health agents |
| Alibaba Health | Health platform | Contracts more than 250,000 licensed professionals for online advice |
| WeDoctor | Health platform | Runs AI-enabled health services and plans a Hong Kong listing |
| Doctor Anywhere | Regional telehealth operator | Serves insurer and employer members across Southeast Asia |
Credence Research view on remote advice demand in the region
Credence Research's view is that demand for tele-consulting services in the Asia-Pacific region will grow strongly because payers, employers and governments all now fund sessions that patients once paid for alone. Healthcare teleconsultation stays the largest service, while legal advice grows fastest from a small base. East Asia keeps the largest share, and South Asia grows fastest on the back of public programs. However, prescribing limits, low prices and separate national rules will slow some operators. Platforms that combine payer contracts with AI triage should gain share fastest.
How the regional remote advice estimate was built
The report uses 2025 as the base year on a calendar basis, and market values come from the Credence Research model. That model combines consultation volumes, internet use statistics, payer rules, public program data and company information on users, doctor networks and contracts. Segment splits and sub-regional growth rates are Credence Research estimates, while sub-regional shares follow the client-defined split. Sources used are official statistics, government releases, regulator fact sheets, company releases and news reports, and no interviews or surveys were used.
Payer funding and AI-assisted triage carry growth to 2035
Regional value for tele-consulting services is expected to reach USD 26.03 billion by 2035, a 16.76% CAGR during 2026–2035, as payers and employers fund more sessions. Growth should be strongest through 2030 while South Korea starts its permanent framework and China tests first-visit rules. After that, AI-assisted text sessions and employer contracts will carry more growth as costs per session fall. Wider first-visit rules would raise this outlook, while tight prescribing limits would lower it.
Frequently Asked Questions
How big is the Asia-Pacific tele-consulting services market?
Which service type leads regional demand?
Which sub-region leads the regional market?
Why do employer-paid buyers grow fastest?
How do payer rules affect adoption?
Which delivery model leads the market?
Who are the leading companies in the region?
What are the main challenges for operators?
Table of Content
Chapter 1 Market Segmentation
- 1.1 Segmentation Framework
- 1.1.1 Product and Service Classification
- 1.1.2 Application and End-Use Classification
- 1.1.3 Technology and Solution Classification
- 1.1.4 Customer and Distribution Channel Classification
- 1.1.5 Geographic Segmentation
- 1.1.6 Market Segment Definitions and Boundaries
- 1.2 By Service Type
- 1.2.1 Healthcare Teleconsultation
- 1.2.2 Business and Management Teleconsulting
- 1.2.3 Legal Teleconsulting
- 1.2.4 Financial Teleconsulting
- 1.3 By Customer Type
- 1.3.1 Self-Paying Individuals
- 1.3.2 Employer-Paid Buyers
- 1.3.3 Insurer and Public-Payer Buyers
- 1.4 By Delivery Model
- 1.4.1 Video Consultations
- 1.4.2 Telephone Consultations
- 1.4.3 Asynchronous Text Consultations
- 1.5 By Sales Channel
- 1.5.1 Direct Consumer Acquisition
- 1.5.2 Enterprise Procurement
- 1.5.3 Institutional Referral
- 1.6 By Sub-region
- 1.6.1 East Asia
- 1.6.2 South Asia
- 1.6.3 Southeast Asia
- 1.6.4 Oceania
Chapter 2 Introduction
- 2.1 Report Objectives and Scope
- 2.2 Product Definition and Industry Terminology
- 2.3 Market Inclusions and Exclusions
- 2.4 Research Process
- 2.4.1 Primary Research and Expert Interviews
- 2.4.2 Secondary Research and Source Review
- 2.4.3 Top-Down and Bottom-Up Estimation
- 2.4.4 Data Triangulation and Verification
- 2.5 Market Size Measurement Basis
- 2.5.1 2025: USD 5.51 billion → 2035: USD 26.03 billion
- 2.6 Historical and Forecast Reference Periods
- 2.6.1 Historical Period: 2018-2025
- 2.6.2 Base Year: 2025
- 2.6.3 Forecast Period: 2025-2035
- 2.7 Research Assumptions and Limitations
Chapter 3 Executive Summary
- 3.1 Market Snapshot and Key Findings
- 3.2 Base-Year Market Size, 2025
- 3.3 Forecast Market Size, 2035
- 3.4 Revenue and Volume Growth Outlook
- 3.5 Key Demand and Supply Indicators
- 3.6 Leading Market Segments
- 3.7 Fastest-Growing Market Opportunities
- 3.8 Regional Performance Highlights
- 3.9 Technology and Industry Transformation
- 3.10 Competitive Landscape Summary
- 3.11 Analyst View and Strategic Implications
Chapter 4 Asia-Pacific Tele-Consulting Services Market Trends and Developments
- 4.1 Historical Industry Development, 2018-2025
- 4.2 Recent Market Trends and Developments
- 4.3 Demand and Customer Behavior Trends
- 4.4 Technology and Product Innovation
- 4.5 Artificial Intelligence, Automation and Digitalization
- 4.6 Local Manufacturing and Supply Chain Realignment
- 4.7 Industry Partnerships, Mergers and Acquisitions
- 4.8 Sustainability and Circular Economy Developments
- 4.9 Government and Private Sector Investment Trends
- 4.10 Emerging Business Models and Commercialization
- 4.11 Industry Developments and Announcements
Chapter 5 Asia-Pacific Tele-Consulting Services Market Supply and Demand Analysis
- 5.1 Demand Trend and Consumption Analysis, 2018-2025
- 5.2 Demand Forecast, 2025-2035
- 5.3 Supply Chain Structure and Procurement Trends
- 5.4 Supply-Demand Gap and Bottlenecks
- 5.5 Import Dependence and Sourcing Structure
- 5.6 Regional Supply and Demand Concentration
Chapter 6 Asia-Pacific Tele-Consulting Services Market Pricing Analysis
- 6.1 Pricing Structure and Measurement
- 6.2 Historical Pricing Trends, 2018-2025
- 6.3 Pricing Outlook, 2025-2035
- 6.4 Pricing by Product and Market Segment
- 6.5 Geographic Pricing Differences
- 6.6 Key Input, Energy, Labor and Logistics Costs
- 6.7 Contract Pricing and Purchasing Models
- 6.8 Pricing Sensitivity and Competitive Positioning
- 6.9 Price, Margin and Profitability Implications
Chapter 7 Asia-Pacific Tele-Consulting Services Market Dynamics
- 7.1 Market Growth Drivers
- 7.1.1 Demand-Side Drivers
- 7.1.2 Technology and Innovation Drivers
- 7.1.3 Infrastructure and Investment Drivers
- 7.1.4 Regulatory and Policy Drivers
- 7.2 Market Restraints
- 7.2.1 Cost and Affordability Constraints
- 7.2.2 Technology and Adoption Barriers
- 7.2.3 Supply Chain and Operational Constraints
- 7.3 Market Challenges
- 7.3.1 Competitive Pressure and Margin Erosion
- 7.3.2 Skills, Infrastructure and Implementation Gaps
- 7.4 Emerging Market Opportunities
- 7.5 Market Dynamics Impact and Time-Horizon Assessment
Chapter 8 Asia-Pacific Tele-Consulting Services Value Chain Analysis
- 8.1 Industry Value Chain Overview
- 8.2 Upstream Suppliers and Critical Inputs
- 8.3 Technology and Component Providers
- 8.4 Manufacturing or Service Delivery
- 8.5 Distribution, Channel Partners and Integrators
- 8.6 Downstream Applications and End Users
- 8.7 Value Addition and Profit Pools
- 8.8 Vertical Integration and Outsourcing
- 8.9 Supplier Concentration and Risk
- 8.10 Supply Chain Localization and Resilience
Chapter 9 Asia-Pacific Tele-Consulting Services Market Regulations and Policies
- 9.1 Relevant Laws, Standards and Compliance Frameworks
- 9.2 Product, Service, Safety and Quality Requirements
- 9.3 Government Policies, Incentives and Subsidies
- 9.4 Imports, Exports and Trade Barriers
- 9.5 Public Procurement and Local Content Requirements
- 9.6 Data Protection, AI and Cybersecurity Compliance
- 9.7 Upcoming Policy Changes and Market Implications
Chapter 10 Asia-Pacific Tele-Consulting Services Market Hotspots and Opportunities
- 10.1 Market Opportunity Mapping and Growth Hotspots
- 10.2 High-Growth Applications and Customer Groups
- 10.3 Underserved Markets and White-Space Opportunities
- 10.4 Emerging Technology and Product Opportunities
- 10.5 New Capacity and Investment Hotspots
- 10.6 Market Entry and Expansion Opportunities
- 10.7 Distribution and Partnership Opportunities
- 10.8 Near-Term and Long-Term Commercial Potential
- 10.9 Opportunity Attractiveness and Execution Risks
Chapter 11 Asia-Pacific Tele-Consulting Services Market Outlook, 2025-2035
- 11.1 Market Size and Analysis
- 11.1.1 Revenue (Market Measurement: 2025: USD 5.51 billion → 2035: USD 26.03 billion)
- 11.1.2 Historical Market Size, 2018-2025
- 11.1.3 Base-Year Market Size, 2025
- 11.2 Market Forecast, 2025-2035
- 11.2.1 Revenue Forecast to 2035
- 11.2.2 CAGR and Year-on-Year Growth
- 11.2.3 Incremental Revenue Opportunity
- 11.3 Forecast Assumptions and Scenario Analysis
- 11.3.1 Base-Case Forecast
- 11.3.2 Optimistic and Conservative Scenarios
- 11.3.3 Technology, Pricing and Policy Sensitivities
- 11.4 Market Attractiveness and Growth Outlook
Chapter 12 Asia-Pacific Tele-Consulting Services Market Segmentation and Outlook
- 12.1 Segmentation Summary and Market Shares, 2025
- 12.2 Largest and Fastest-Growing Segments
- 12.3 By Service Type - Market Size and Forecast, 2025-2035
- 12.3.1 Segment Definition and Scope
- 12.3.2 Historical Market Size, 2018-2025
- 12.3.3 Revenue Forecast, 2025-2035
- 12.3.4 Base-Year Market Share, 2025
- 12.3.5 Segment CAGR and Growth Drivers
- 12.3.6 Subsegment Market Size and Forecast
- 12.3.6.1 Healthcare Teleconsultation
- 12.3.6.2 Business and Management Teleconsulting
- 12.3.6.3 Legal Teleconsulting
- 12.3.6.4 Financial Teleconsulting
- 12.3.7 Subsegment Pricing and Adoption Trends
- 12.3.8 Leading Suppliers and Competition
- 12.3.9 Regional Demand and Opportunities
- 12.4 By Customer Type - Market Size and Forecast, 2025-2035
- 12.4.1 Segment Definition and Scope
- 12.4.2 Historical Market Size, 2018-2025
- 12.4.3 Revenue Forecast, 2025-2035
- 12.4.4 Base-Year Market Share, 2025
- 12.4.5 Segment CAGR and Growth Drivers
- 12.4.6 Subsegment Market Size and Forecast
- 12.4.6.1 Self-Paying Individuals
- 12.4.6.2 Employer-Paid Buyers
- 12.4.6.3 Insurer and Public-Payer Buyers
- 12.4.7 Subsegment Pricing and Adoption Trends
- 12.4.8 Leading Suppliers and Competition
- 12.4.9 Regional Demand and Opportunities
- 12.5 By Delivery Model - Market Size and Forecast, 2025-2035
- 12.5.1 Segment Definition and Scope
- 12.5.2 Historical Market Size, 2018-2025
- 12.5.3 Revenue Forecast, 2025-2035
- 12.5.4 Base-Year Market Share, 2025
- 12.5.5 Segment CAGR and Growth Drivers
- 12.5.6 Subsegment Market Size and Forecast
- 12.5.6.1 Video Consultations
- 12.5.6.2 Telephone Consultations
- 12.5.6.3 Asynchronous Text Consultations
- 12.5.7 Subsegment Pricing and Adoption Trends
- 12.5.8 Leading Suppliers and Competition
- 12.5.9 Regional Demand and Opportunities
- 12.6 By Sales Channel - Market Size and Forecast, 2025-2035
- 12.6.1 Segment Definition and Scope
- 12.6.2 Historical Market Size, 2018-2025
- 12.6.3 Revenue Forecast, 2025-2035
- 12.6.4 Base-Year Market Share, 2025
- 12.6.5 Segment CAGR and Growth Drivers
- 12.6.6 Subsegment Market Size and Forecast
- 12.6.6.1 Direct Consumer Acquisition
- 12.6.6.2 Enterprise Procurement
- 12.6.6.3 Institutional Referral
- 12.6.7 Subsegment Pricing and Adoption Trends
- 12.6.8 Leading Suppliers and Competition
- 12.6.9 Regional Demand and Opportunities
- 12.7 By Sub-region - Market Size and Forecast, 2025-2035
- 12.7.1 Segment Definition and Scope
- 12.7.2 Historical Market Size, 2018-2025
- 12.7.3 Revenue Forecast, 2025-2035
- 12.7.4 Base-Year Market Share, 2025
- 12.7.5 Segment CAGR and Growth Drivers
- 12.7.6 Subsegment Market Size and Forecast
- 12.7.6.1 East Asia
- 12.7.6.2 South Asia
- 12.7.6.3 Southeast Asia
- 12.7.6.4 Oceania
- 12.7.7 Subsegment Pricing and Adoption Trends
- 12.7.8 Leading Suppliers and Competition
- 12.7.9 Regional Demand and Opportunities
- 12.8 Segment Growth Comparison
- 12.9 Segment Attractiveness and Priority Matrix
Chapter 13 Asia-Pacific Tele-Consulting Services End-Use and Application Market Outlook
- 13.1 End-Use Industry and Customer Demand Structure
- 13.2 Leading Applications and Customer Groups
- 13.3 End-Use Market Size, Share and Forecast
- 13.4 Major End-Use Industry Deep Dives
- 13.4.1 Customer Requirements and Use Cases
- 13.4.2 Demand and Replacement Cycles
- 13.4.3 Technical and Regulatory Considerations
- 13.4.4 Purchasing and Procurement Models
- 13.4.5 Leading Vendors and Distribution Channels
- 13.4.6 Forecast and Commercial Opportunities
- 13.5 Emerging Applications and Cross-Segment Demand
- 13.6 End-Use Industry Investment Priorities
Chapter 14 Asia-Pacific Tele-Consulting Services Geographic Market Outlook, 2025-2035
- 14.1 Regional Market Size and Country-Level Shares, 2025
- 14.2 Country Market Size Comparison, 2025
- 14.3 Country Market Forecasts, 2025-2035
- 14.4 Subregional Industrial and Demand Clusters
- 14.5 Intra-Regional Pricing and Cost Differences
- 14.6 Cross-Border Trade and Supply Networks
- 14.7 Regional Supply and Demand Balances
- 14.8 Country Opportunity Comparison and Prioritization
Note: Every listed country is covered on the structure shown under the first country.
Chapter 15 Asia-Pacific Tele-Consulting Services Technology, Innovation and Sustainability Outlook
- 15.1 Technology Landscape and Maturity
- 15.2 Product, Process and Service Innovation
- 15.3 AI, Automation and Digital Tools in the Industry
- 15.4 Technology Adoption and Performance Benchmarking
- 15.5 Innovation Pipeline and R&D Investment
- 15.6 Energy Efficiency and Resource Management
- 15.7 Sustainability, Recycling and Circularity
- 15.8 Technology Roadmap, 2025-2035
- 15.9 Risks of Obsolescence and Technology Substitution
Chapter 16 Asia-Pacific Tele-Consulting Services Market Key Strategic Imperatives
- 16.1 Growth and Market Entry Priorities
- 16.2 High-Return Products and Segments
- 16.3 Pricing, Profitability and Cost Optimization
- 16.4 Technology Investment and Product Differentiation
- 16.5 Supply Chain Localization and Resilience
- 16.6 Distribution and Customer Acquisition
- 16.7 Partnership, Acquisition and Capacity Strategy
- 16.8 Regional Expansion Priorities
- 16.9 Short-, Medium- and Long-Term Actions
Chapter 17 Competition Outlook
- 17.1 Industry Competition Characteristics
- 17.2 Market Structure and Concentration
- 17.3 Market Share and Competitive Positioning, 2025
- 17.4 Company-Wise Revenue and Product Benchmarking
- 17.5 Production and Service Capacity Benchmarking
- 17.6 Technology, Pricing and Differentiation
- 17.7 Regional Footprint and Distribution Strength
- 17.8 Mergers, Acquisitions and Strategic Alliances
- 17.9 New Entrants and Competitive Threats
- 17.10 Porter's Five Forces and Industry Attractiveness
- 17.11 Competitive Outlook, 2025-2035
Chapter 18 Company Profiles
- 18.1 Company Coverage and Selection Criteria
- 18.2 JD Health
- 18.2.1 Business Description
- 18.2.2 Company Ownership and Geographic Presence
- 18.2.3 Product and Service Portfolio
- 18.2.4 Manufacturing and Operating Footprint
- 18.2.5 Financial Performance and Investment
- 18.2.6 Market Share and Competitive Position
- 18.2.7 Technology and Innovation Capabilities
- 18.2.8 Strategic Alliances or Partnerships
- 18.2.9 Recent Developments
- 18.2.10 Growth Strategy and Outlook
- 18.3 WeDoctor
- 18.4 Ping An Good Doctor
- 18.5 Alibaba Health
- 18.6 Doctor Anywhere
- 18.7 Other Relevant Market Participants
Note: Every listed company is profiled on the structure shown under the first company. The company list is preliminary and may change based on research findings, market developments, data availability and client requirements.
Chapter 19 Disclaimer
- 19.1 Research and Forecast Disclaimer
- 19.2 Data Source and Estimation Limitations
Note: The depth of individual sections depends on data availability for this market. Volume, capacity, trade and other unit-based metrics are included where applicable.

