
Ledger automation moves into claims, consent and supply
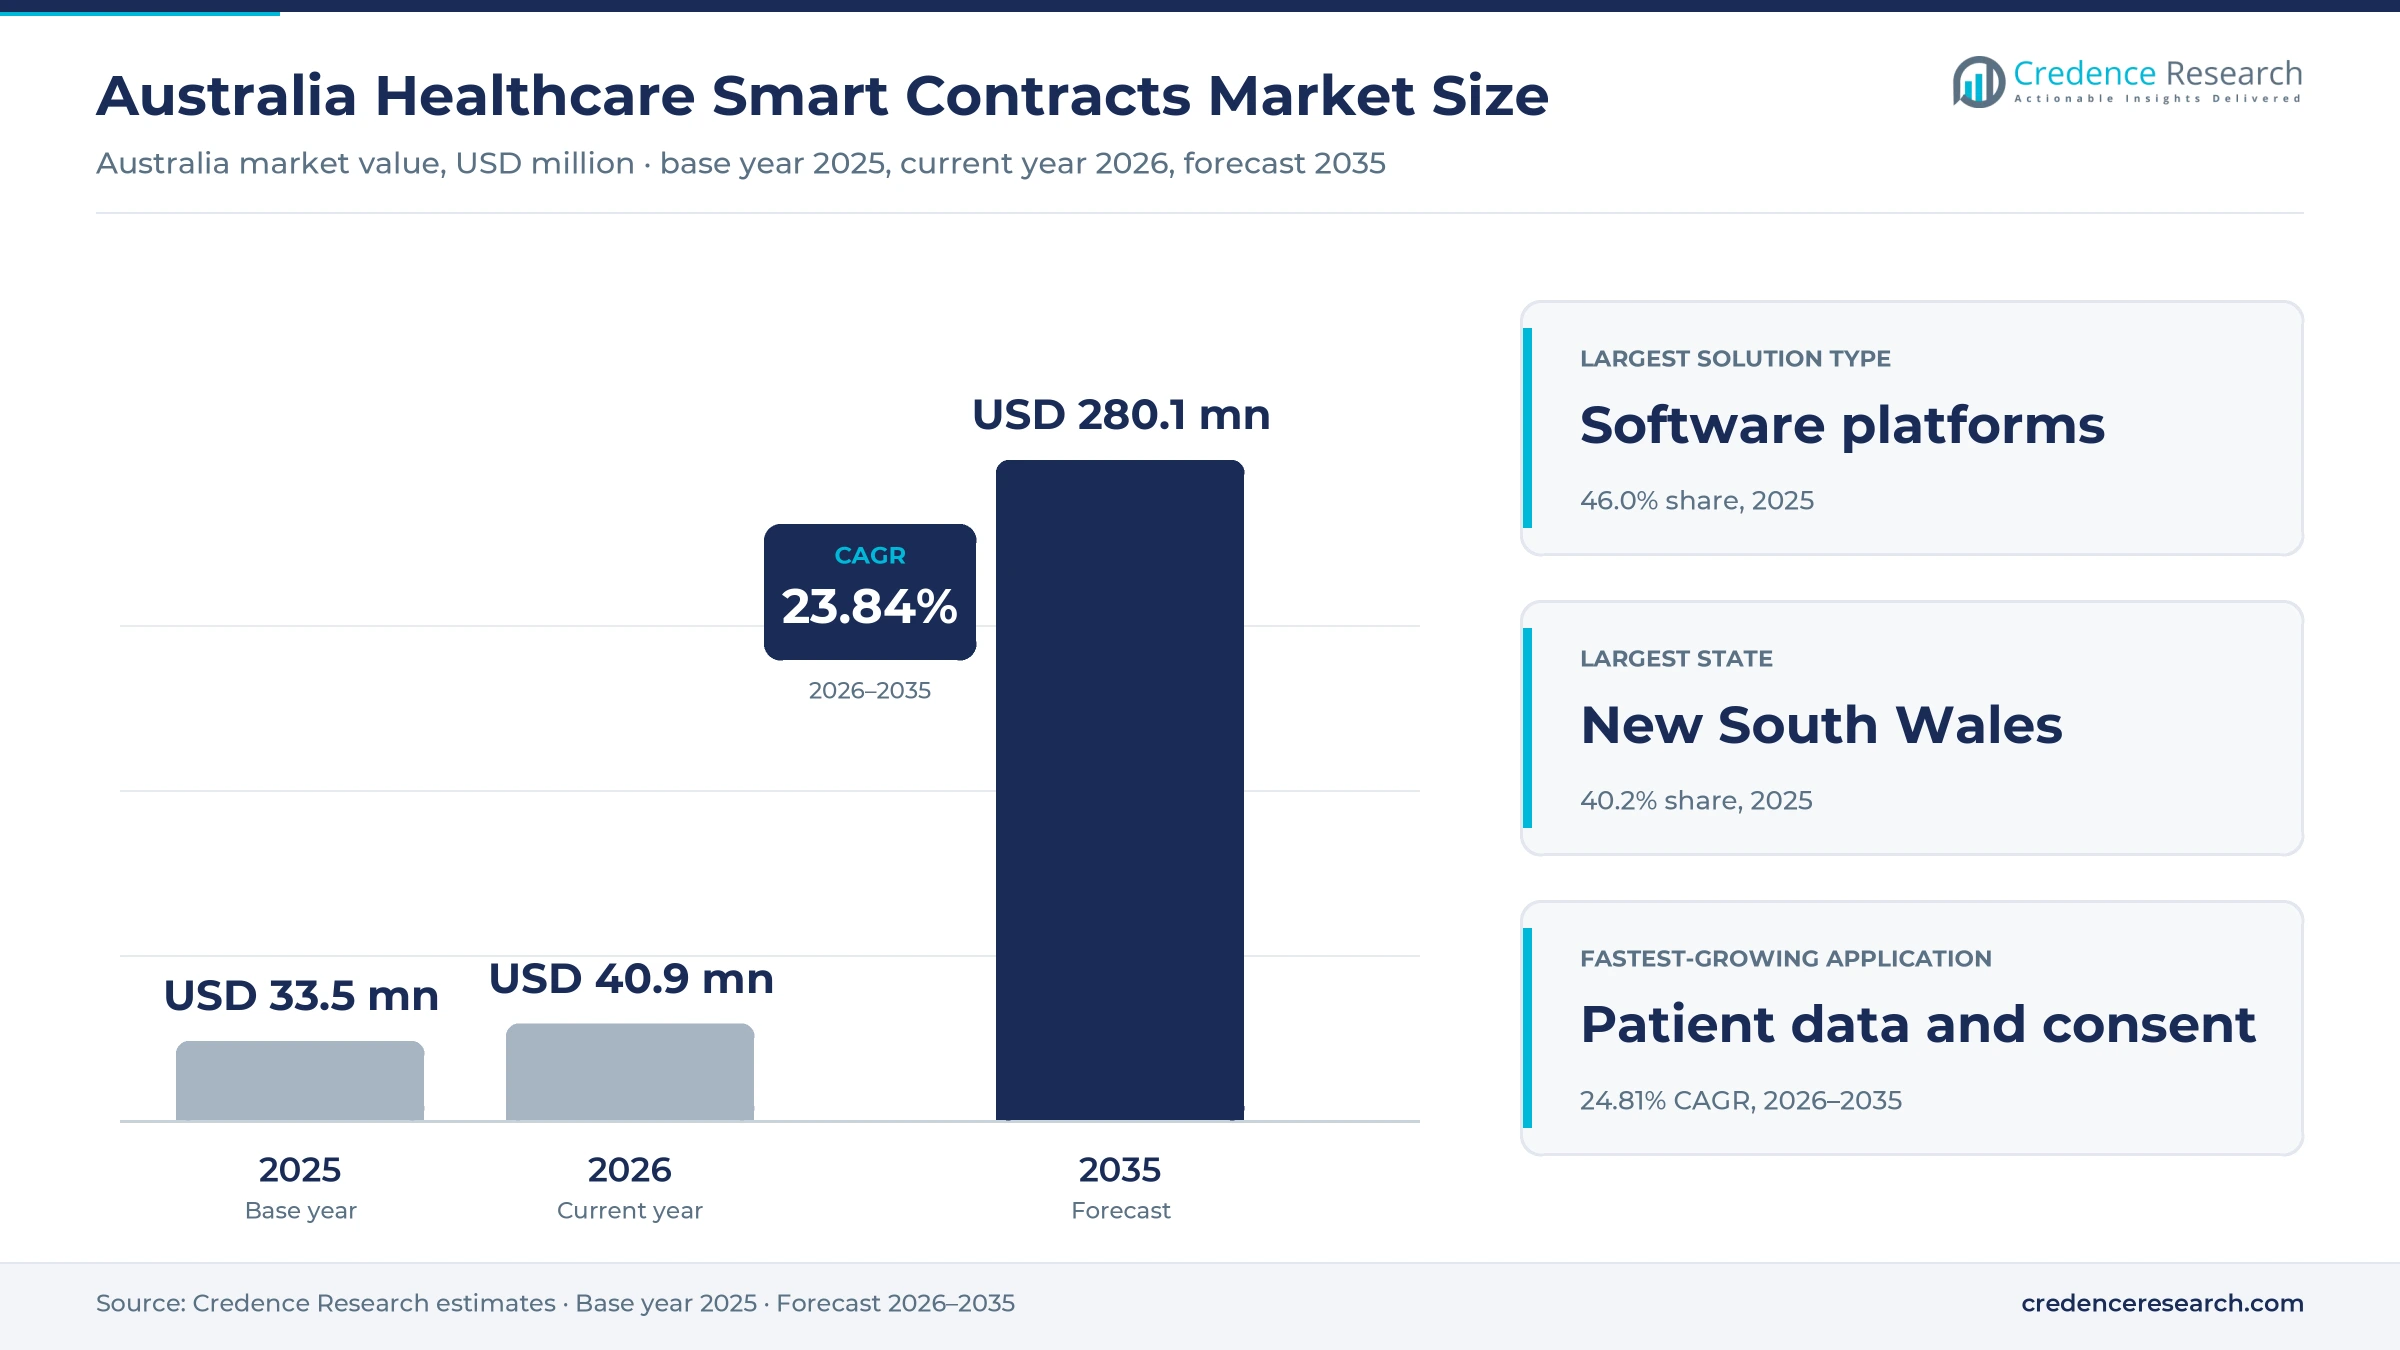
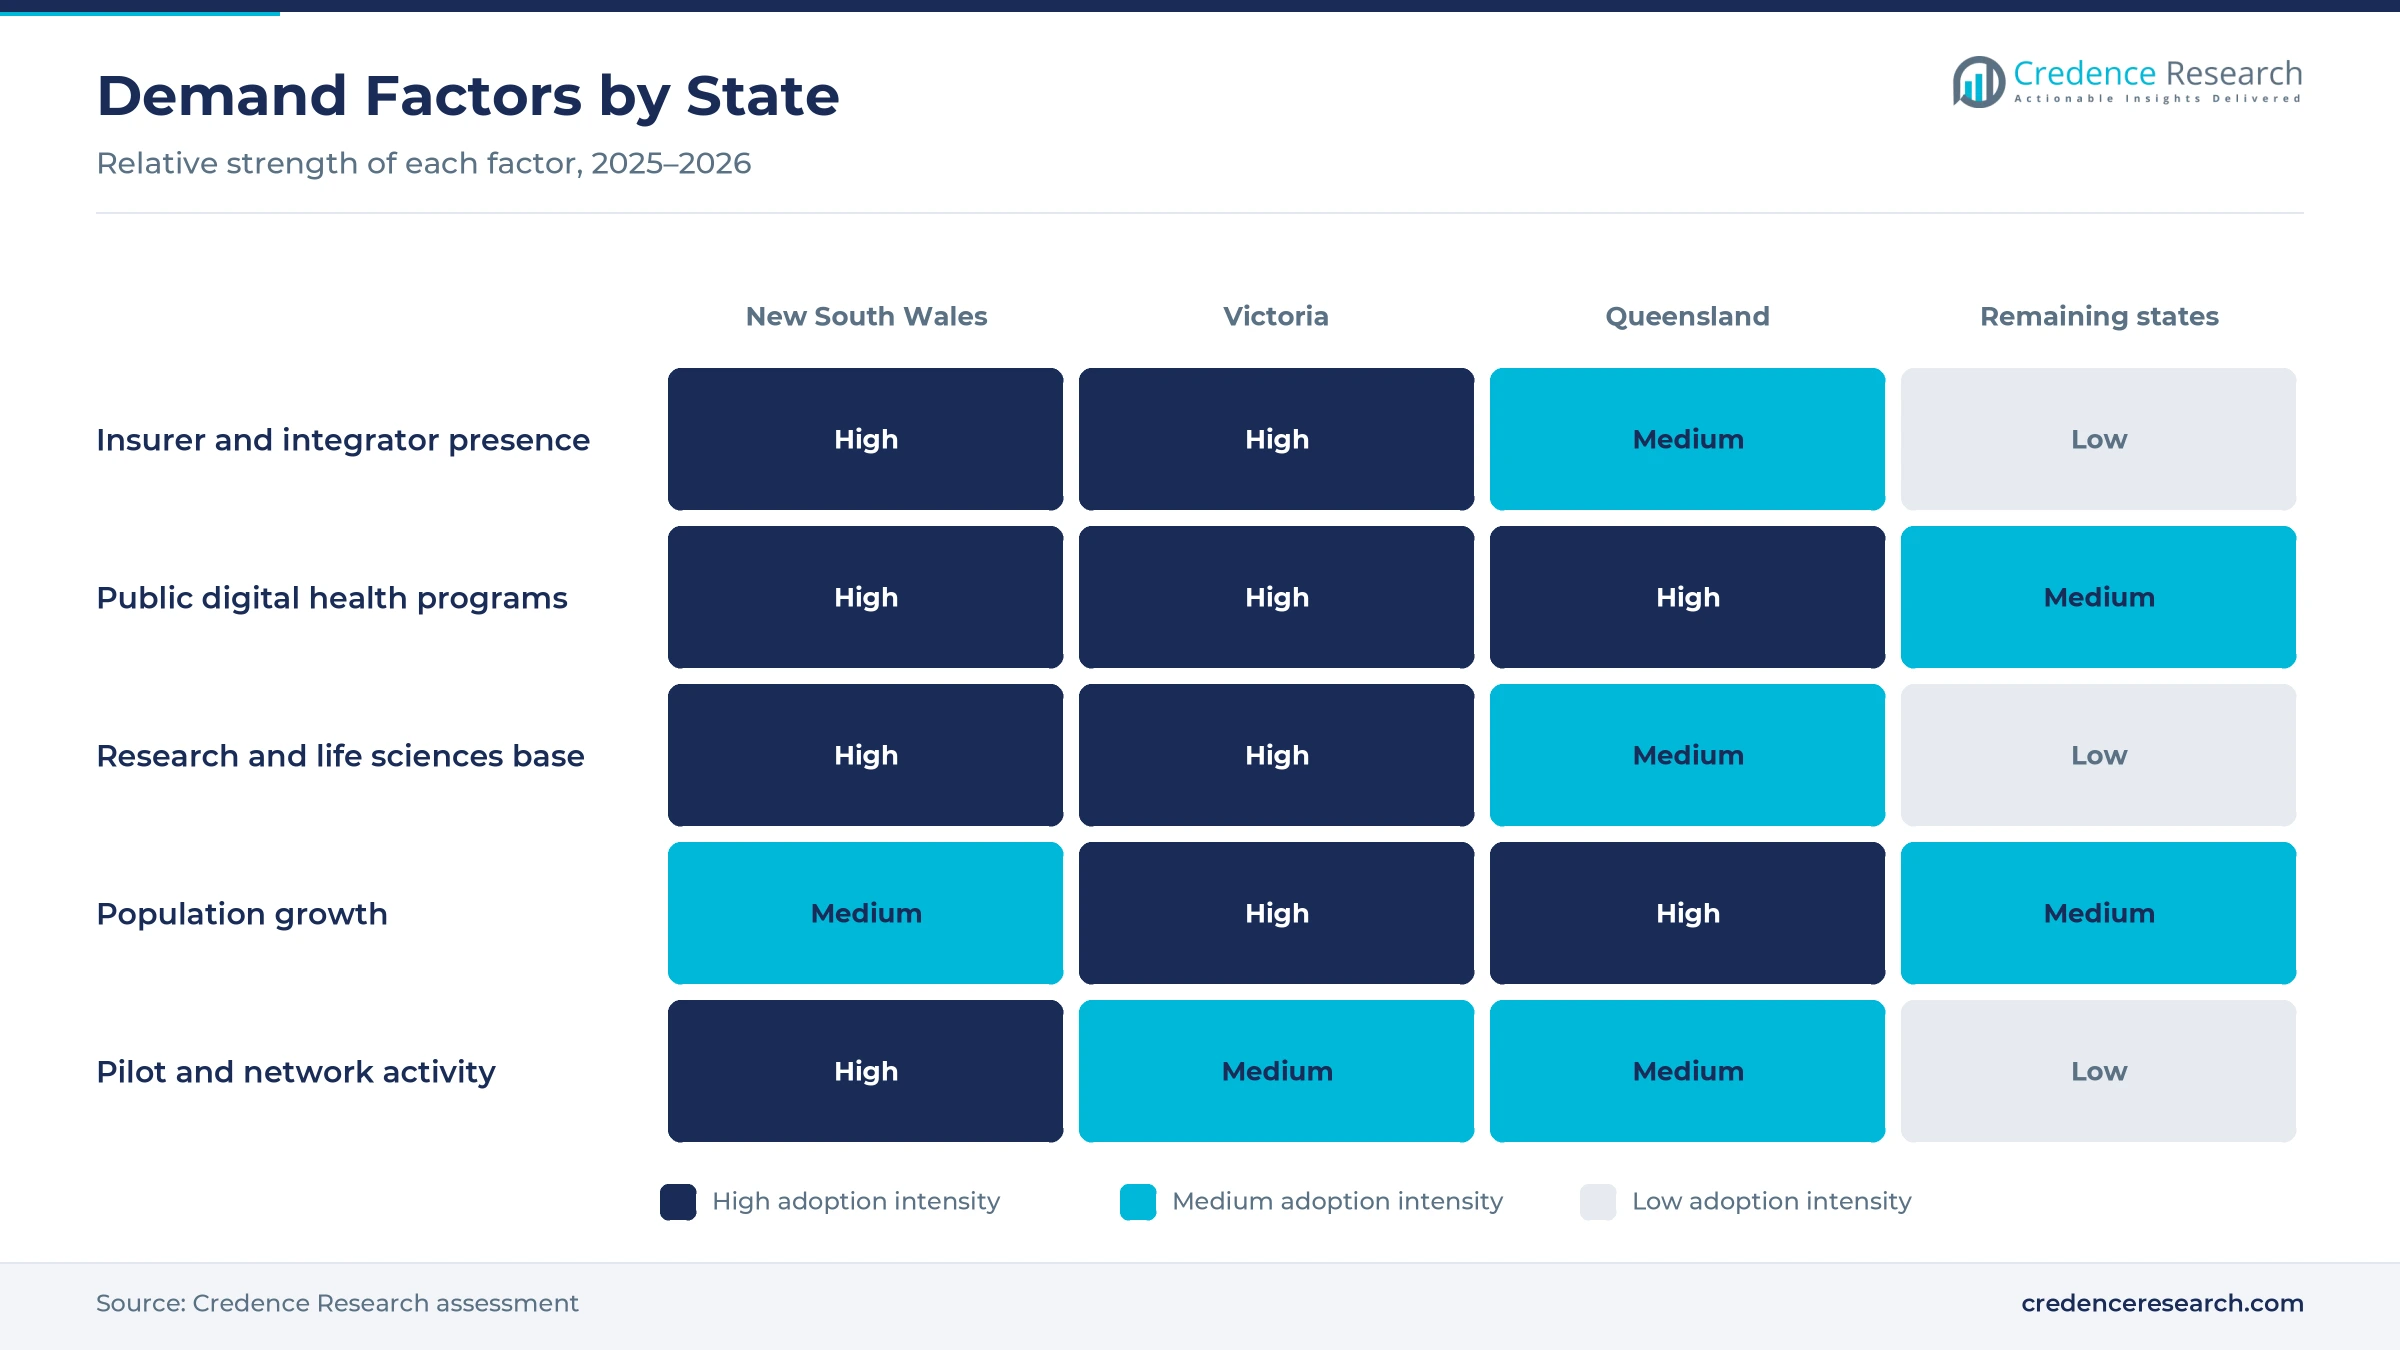
The Australia healthcare smart contracts market was valued at USD 11.0 million in 2025 and is projected to increase from USD 13.6 million in 2026 to USD 93.3 million by 2035, registering a CAGR of 23.84% during 2026–2035. Demand comes from private health insurers, hospital operators, pharmaceutical suppliers and research bodies that want rule-based records of who accessed data, which claim was paid and where a medicine moved. New South Wales held the largest state share, 40.2% in 2025, because Sydney concentrates insurer head offices, state health technology programs and national consulting teams. Queensland is the fastest-growing state at 24.37% a year, as its public health services and research groups expand digital programs. In turn, the Privacy and Other Legislation Amendment Act 2024 now states that reasonable security steps include technical and organisational measures, which raises the value of tamper-evident audit trails for health data.
Which ledger-based health contracts does the estimate cover?
The estimate measures spending by health organizations in Australia on self-executing contract logic that runs on distributed ledgers. It covers software platforms, professional services for design and integration and managed services that operate the networks for buyers. Values include subscriptions, project fees and usage-based charges paid by insurers, providers, life sciences companies and public bodies.
The estimate excludes cryptocurrency trading, general enterprise blockchain projects outside health and the wider electronic record systems that ledger tools connect to. The value chain runs from ledger protocol developers and cloud providers through platform vendors and systems integrators to insurers, hospitals, pharmaceutical suppliers and research organizations that sign the contracts.
Australia Healthcare Smart Contracts Market Insights
- The Australia healthcare smart contracts market was valued at USD 11.0 million in 2025 and is projected to reach USD 93.3 million by 2035, registering a CAGR of 23.84% during 2026–2035.
- New South Wales held a 40.2% share of 2025 value, because Sydney hosts insurer head offices, state health technology programs and national integrator teams.
- Software platforms led with a 46.0% share of 2025 value, because buyers license ledger and contract engines before they buy operating services.
- My Health Record held 2.4 billion documents by July 2026, and the cumulative number of pathology reports uploaded rose 35% in a year to 874 million.
- Health service providers made 225 of the 1,205 data breach notifications in 2025, which keeps auditable access controls high on buyer agendas.
Software platforms lead while managed services rise
Why do software platforms hold the largest solution share?
Based on solution type, the market is categorized into software platforms, professional services and managed services. Software platforms led with a 46.0% share of 2025 value, because insurers and health services first license the ledger and contract engine that records each rule and event. Managed services grow fastest at 24.98% a year, as buyers without ledger skills pay vendors to run nodes, keys and upgrades for them.
Why does claims adjudication lead application spending?
Based on application, the market is categorized into claims adjudication and billing, patient data and consent, pharmaceutical supply chains and clinical and workforce automation. Claims adjudication and billing led with a 36.0% share of 2025 value, because insurers process millions of hospital and medical claims against fixed policy rules. Patient data and consent grows fastest at 24.81% a year, as stricter privacy duties reward a clear record of every access.
Why do health insurers spend the most on contract automation?
Based on customer type, the market is categorized into healthcare payers, healthcare providers, life sciences companies and public health and research organisations. Healthcare payers led with a 38.0% share of 2025 value, because insurers can link automated rules directly to benefit payments. Healthcare providers grow fastest at 24.54% a year, as hospitals connect consent, referral and credential checks to shared records.
Why do permissioned networks dominate health deployments?
Based on technology, the market is categorized into permissioned networks, consortium networks and public networks. Permissioned networks led with a 58.0% share of 2025 value, because health buyers must control who runs nodes and who can read records. Consortium networks grow fastest at 24.82% a year, as insurers, wholesalers and hospitals share one ledger without handing control to a single owner.
| Segment Group | Leading Sub-segment | Share, 2025 | Fastest-growing Sub-segment | CAGR, 2026–2035 |
|---|---|---|---|---|
| By Solution Type | Software platforms | 46.0% | Managed services | 24.98% |
| By Application | Claims adjudication and billing | 36.0% | Patient data and consent | 24.81% |
| By Customer Type | Healthcare payers | 38.0% | Healthcare providers | 24.54% |
| By Technology | Permissioned networks | 58.0% | Consortium networks | 24.82% |
Request a Free Sample
Fill in your details and we'll send you a free sample report.
- Sample data tables & charts
- Research methodology
Interoperability, privacy duties and claims volume drive use
How does standards-based integration widen use cases?
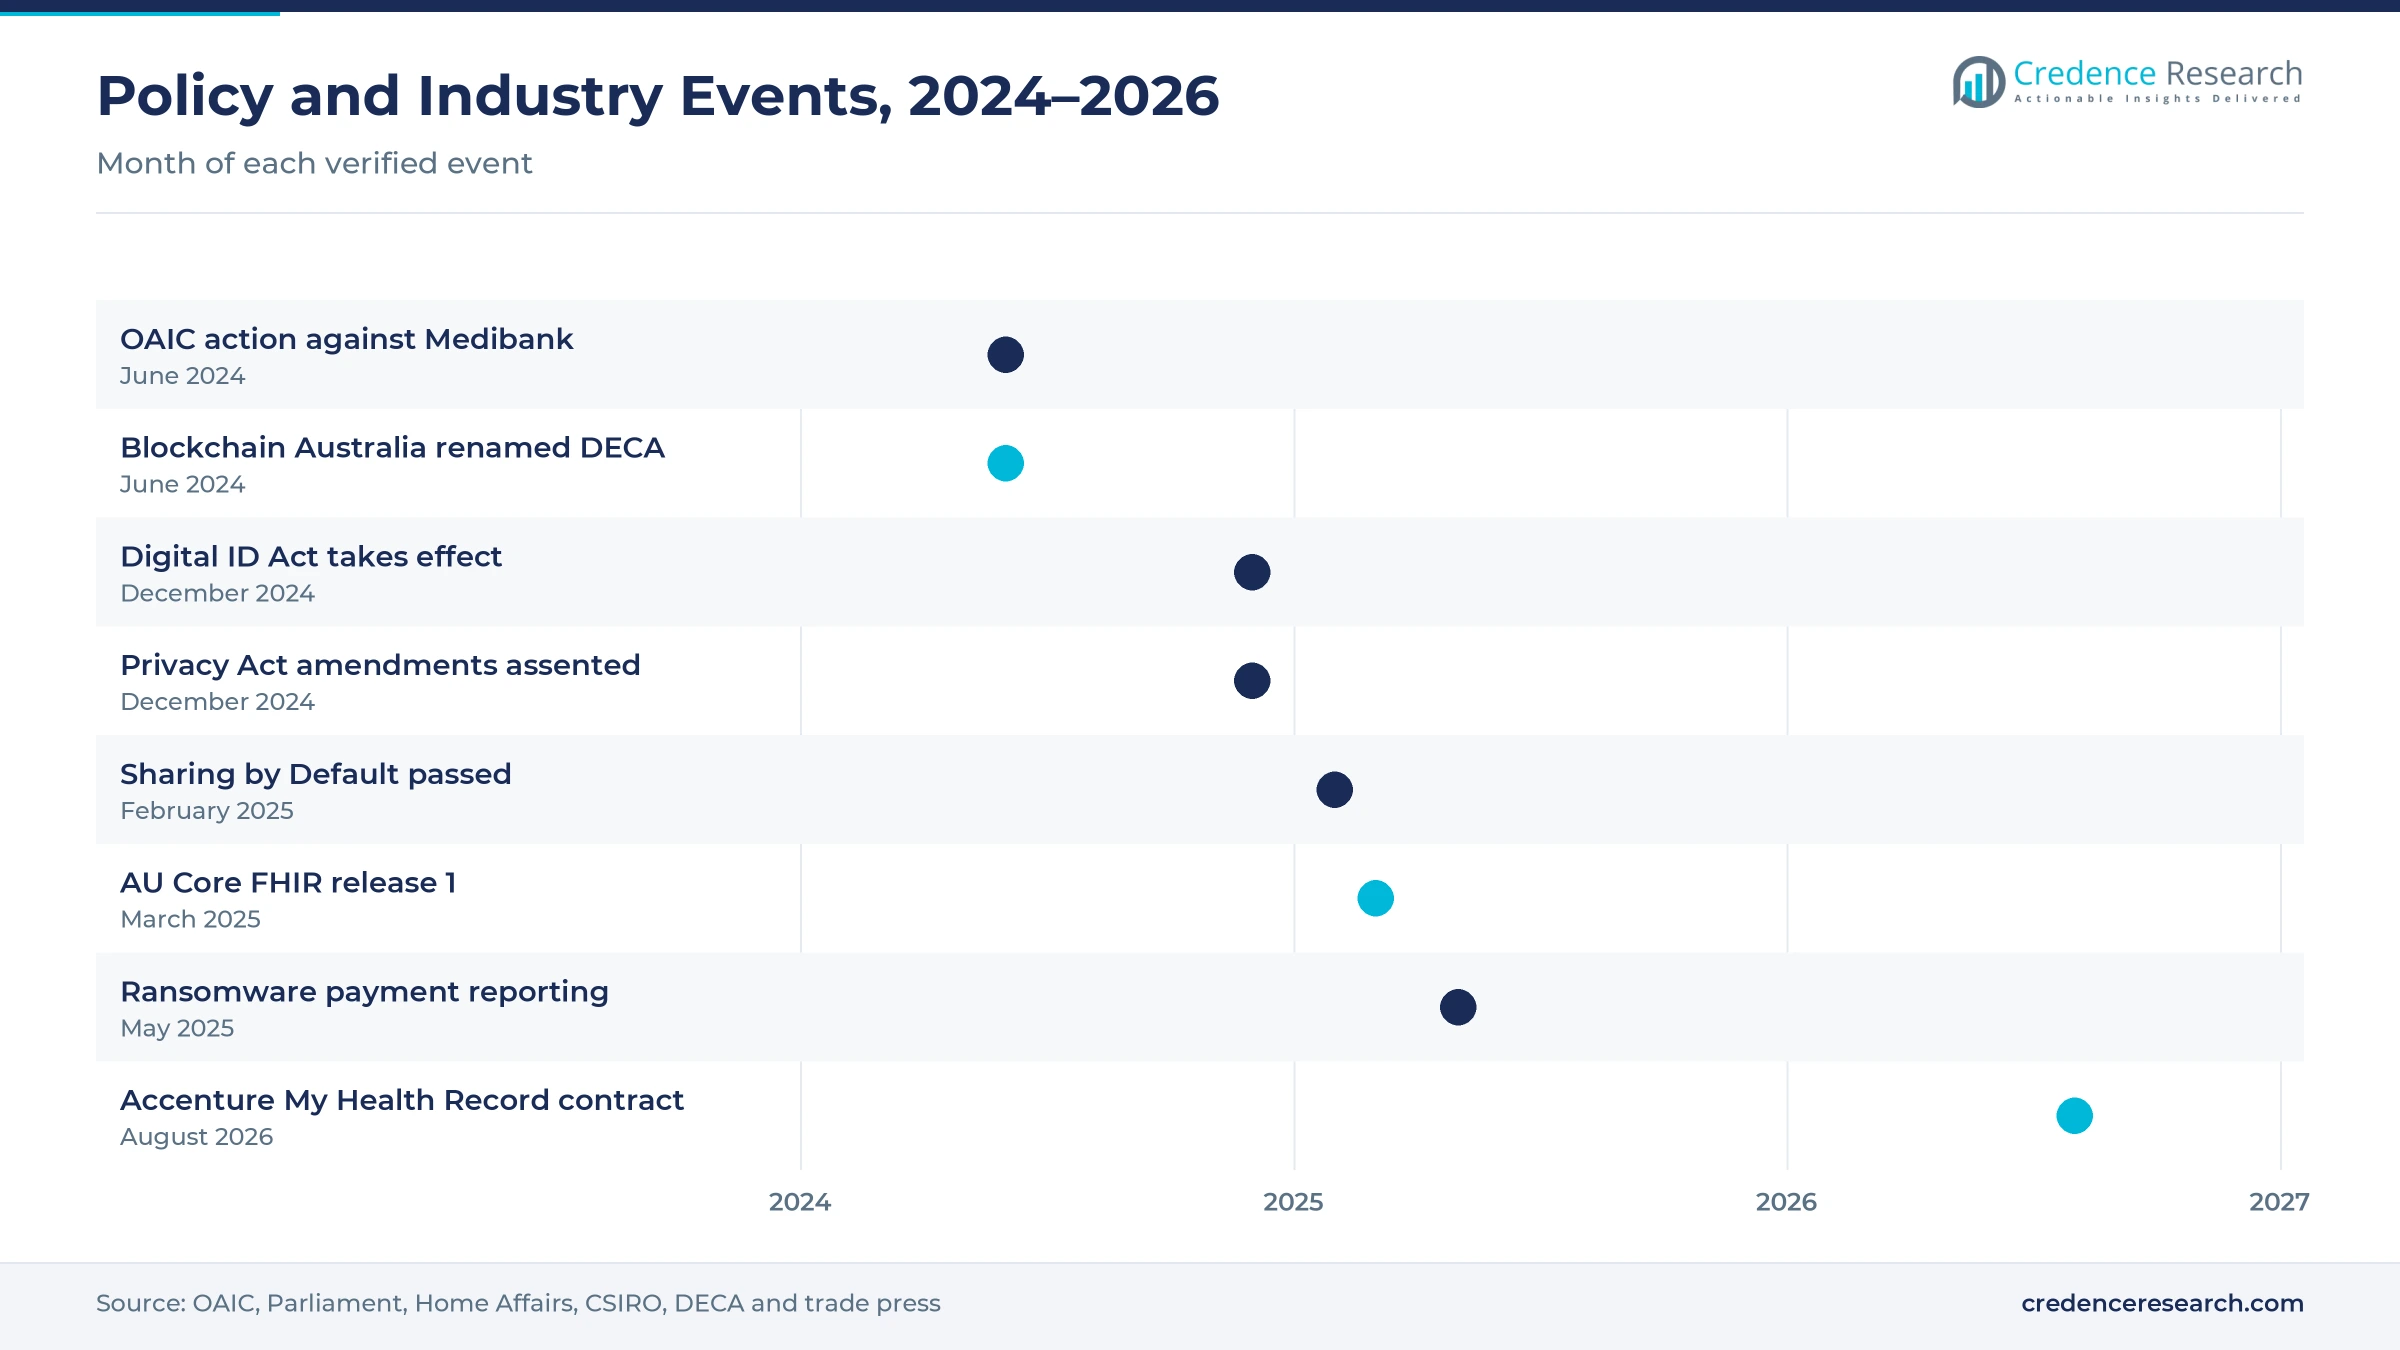
Contract logic only pays off when it can read and write the same data that clinical and billing systems already use, so shared standards lower the cost of every new use case. The Sparked FHIR accelerator, run by CSIRO for the Department of Health and Aged Care, the Australian Digital Health Agency and HL7 Australia, published AU Core release 1 in March 2025 after more than 6,000 hours of community work. The National Healthcare Interoperability Plan, released in July 2023 with 44 actions, was about 75% complete by May 2026. In turn, Deloitte was selected in July 2021 to build the FHIR-based Health Information Gateway, which gives contract platforms a standard route into national services.
Why does demand for controlled data access keep rising?
Patients, clinicians and researchers now expect fine-grained control over who sees which record, which suits contract rules that grant and revoke access automatically. Australia had more than 25 million My Health Records and 2.4 billion documents by July 2026, while the cumulative number of pathology reports uploaded rose 35% in a year to 874 million. Parliament passed the Sharing by Default legislation in February 2025, which makes pathology and diagnostic imaging results flow to the national record by default. The Digital ID Act 2024 also took effect on Dec. 1, 2024, creating accredited identity checks that consent tools can call. As a result, patient data and consent grows at 24.81% a year, the fastest application rate.
How do APP 11 security duties reward tamper-evident records?
Australian Privacy Principle 11 requires entities to take reasonable steps to protect personal information from misuse, interference, loss and unauthorised access, which pushes health data holders toward provable controls. The OAIC guidelines note that APP 11.3, added by the Privacy and Other Legislation Amendment Act 2024, applies from Dec. 11, 2024 and names technical and organisational measures. The same act received Royal Assent on Dec. 10, 2024 and added mid-tier penalties of up to AUD 3.3 million for companies. The OAIC also began civil penalty action against Medibank in June 2024 over a breach affecting 9.7 million people. In turn, buyers value ledgers that log every access and change.
Why does high claims volume favor rule-based automation?
Insurers and public payers process very large numbers of routine claims against fixed rules, which makes automated adjudication a direct cost saving. Services Australia processed 480.6 million Medicare services in 2024-25, and 479.6 million were digital services, according to its annual report. Private hospital cover reached 12.82 million people, or 45.8% of the population, at June 30, 2026, and APRA data show hospital benefits of $5.33 billion in that quarter alone. Those hospital benefits included $770.81 million paid for medical services during the June 2026 quarter. As a result, healthcare payers hold a 38.0% share of 2025 value, the largest customer share.
Closed ledgers, breach rules and traceability shape demand
How is the shift to permissioned ledgers shaping projects?
Health buyers in Australia favor networks where every participant is known, because privacy law and clinical governance leave little room for anonymous validators. Standards Australia manages the secretariat of ISO/TC 307, the international committee for blockchain and distributed ledger standards, which lists smart contracts among its work areas. The Reserve Bank of Australia and the Digital Finance Cooperative Research Centre released Project Acacia findings on May 18, 2026, after industry tested 20 tokenized asset use cases on public and private ledgers. Blockchain Australia also became the Digital Economy Council of Australia in June 2024, reflecting a broader enterprise focus. As a result, permissioned networks hold a 58.0% share of 2025 value, while blockchain technology vendors adapt products for closed health networks.
Why is the rise of breach accountability changing budgets?
Health organizations now face more frequent breach reporting and tougher scrutiny, which moves auditable access control from a technical choice to a board-level priority. The OAIC received 1,205 data breach notifications in 2025, an all-time high, and health service providers made 225 of them, or 19%. Malicious or criminal attacks caused 59% of breaches reported in the first half of 2025. The Cyber Security Act 2024 then required ransomware payment reporting from May 30, 2025. In turn, insurers and hospitals add immutable access logs to their electronic health records instead of relying only on perimeter security.
Can device and medicine traceability open new contract value?
Traceability rules create a natural role for shared ledgers, because suppliers, wholesalers and hospitals must agree on one record of each product movement. The TGA unique device identification framework came into effect in 2025, with the Australian UDI database linking device identifiers to the Australian Register of Therapeutic Goods, as Emergo by UL reported in April 2025. Services Australia also processed 250.9 million Pharmaceutical Benefits Scheme services in 2024-25. Diagnostic imaging reports in My Health Record rose 39% in a year to 80 million. As a result, pharmaceutical supply chain ledgers offer suppliers an opening to automate recalls and rebates.
Is there room to automate private insurer claims and billing?
Private insurers still reconcile many hospital and medical claims through manual checks, which leaves an opening for contract rules that pay agreed items automatically. Hospital cover reached 12.82 million people in June 2026, and the quarter recorded 1.35 million hospital episodes. General treatment cover also reached 15.5 million people, adding dental and allied health claims to the volume insurers must settle. Current health spending also reached 10.4% of gross domestic product in 2023, according to World Bank data, which shows how much payment activity flows through the system. In turn, vendors that link contract logic to medical billing workflows can win multi-year insurer deals.
Legal doubt, legacy systems and erasure duties slow uptake
Why does legal uncertainty slow contract automation?
Australian contract and consumer law was written for human agreements, so buyers worry about who bears liability when coded rules pay or reject a claim in error. Insurers must still meet complaint and dispute obligations for every member decision, even when software makes it. As a result, many projects keep humans in the approval loop, which reduces the savings that automation promises. Vendors respond with hybrid designs that log decisions on the ledger while staff confirm exceptions.
How do legacy systems raise integration costs?
Many hospitals, insurers and wholesalers still run older billing and record systems that cannot call ledger services directly. Linking them needs custom interfaces, data mapping and testing, which lengthens projects and raises professional service fees. However, the national move to FHIR reduces this burden over time, because more systems now share the same data profiles. Vendors respond with prebuilt FHIR connectors and managed services that hide ledger complexity from buyers.
Why do erasure duties conflict with immutable ledgers?
APP 11.2 requires entities to destroy or de-identify personal information once it is no longer needed, while a ledger is designed never to delete entries. Writing health data directly on chain would therefore create a compliance risk for every participant. As a result, architects keep personal data off the ledger and store only hashes, consent flags and event records. This design adds storage layers and governance work that small buyers find costly and slow to approve.
How do skills gaps and small pilots limit scale?
Few health organizations employ staff who can design contract logic, manage keys and audit ledger code, so projects depend on outside specialists. Many initiatives also stay at pilot scale because one organization cannot capture the benefit alone. In turn, return on investment remains unclear for buyers who lack network partners. Integrators respond with consortium models, shared governance templates and fixed-price pilots that move to subscription pricing once claim or consent volumes grow.
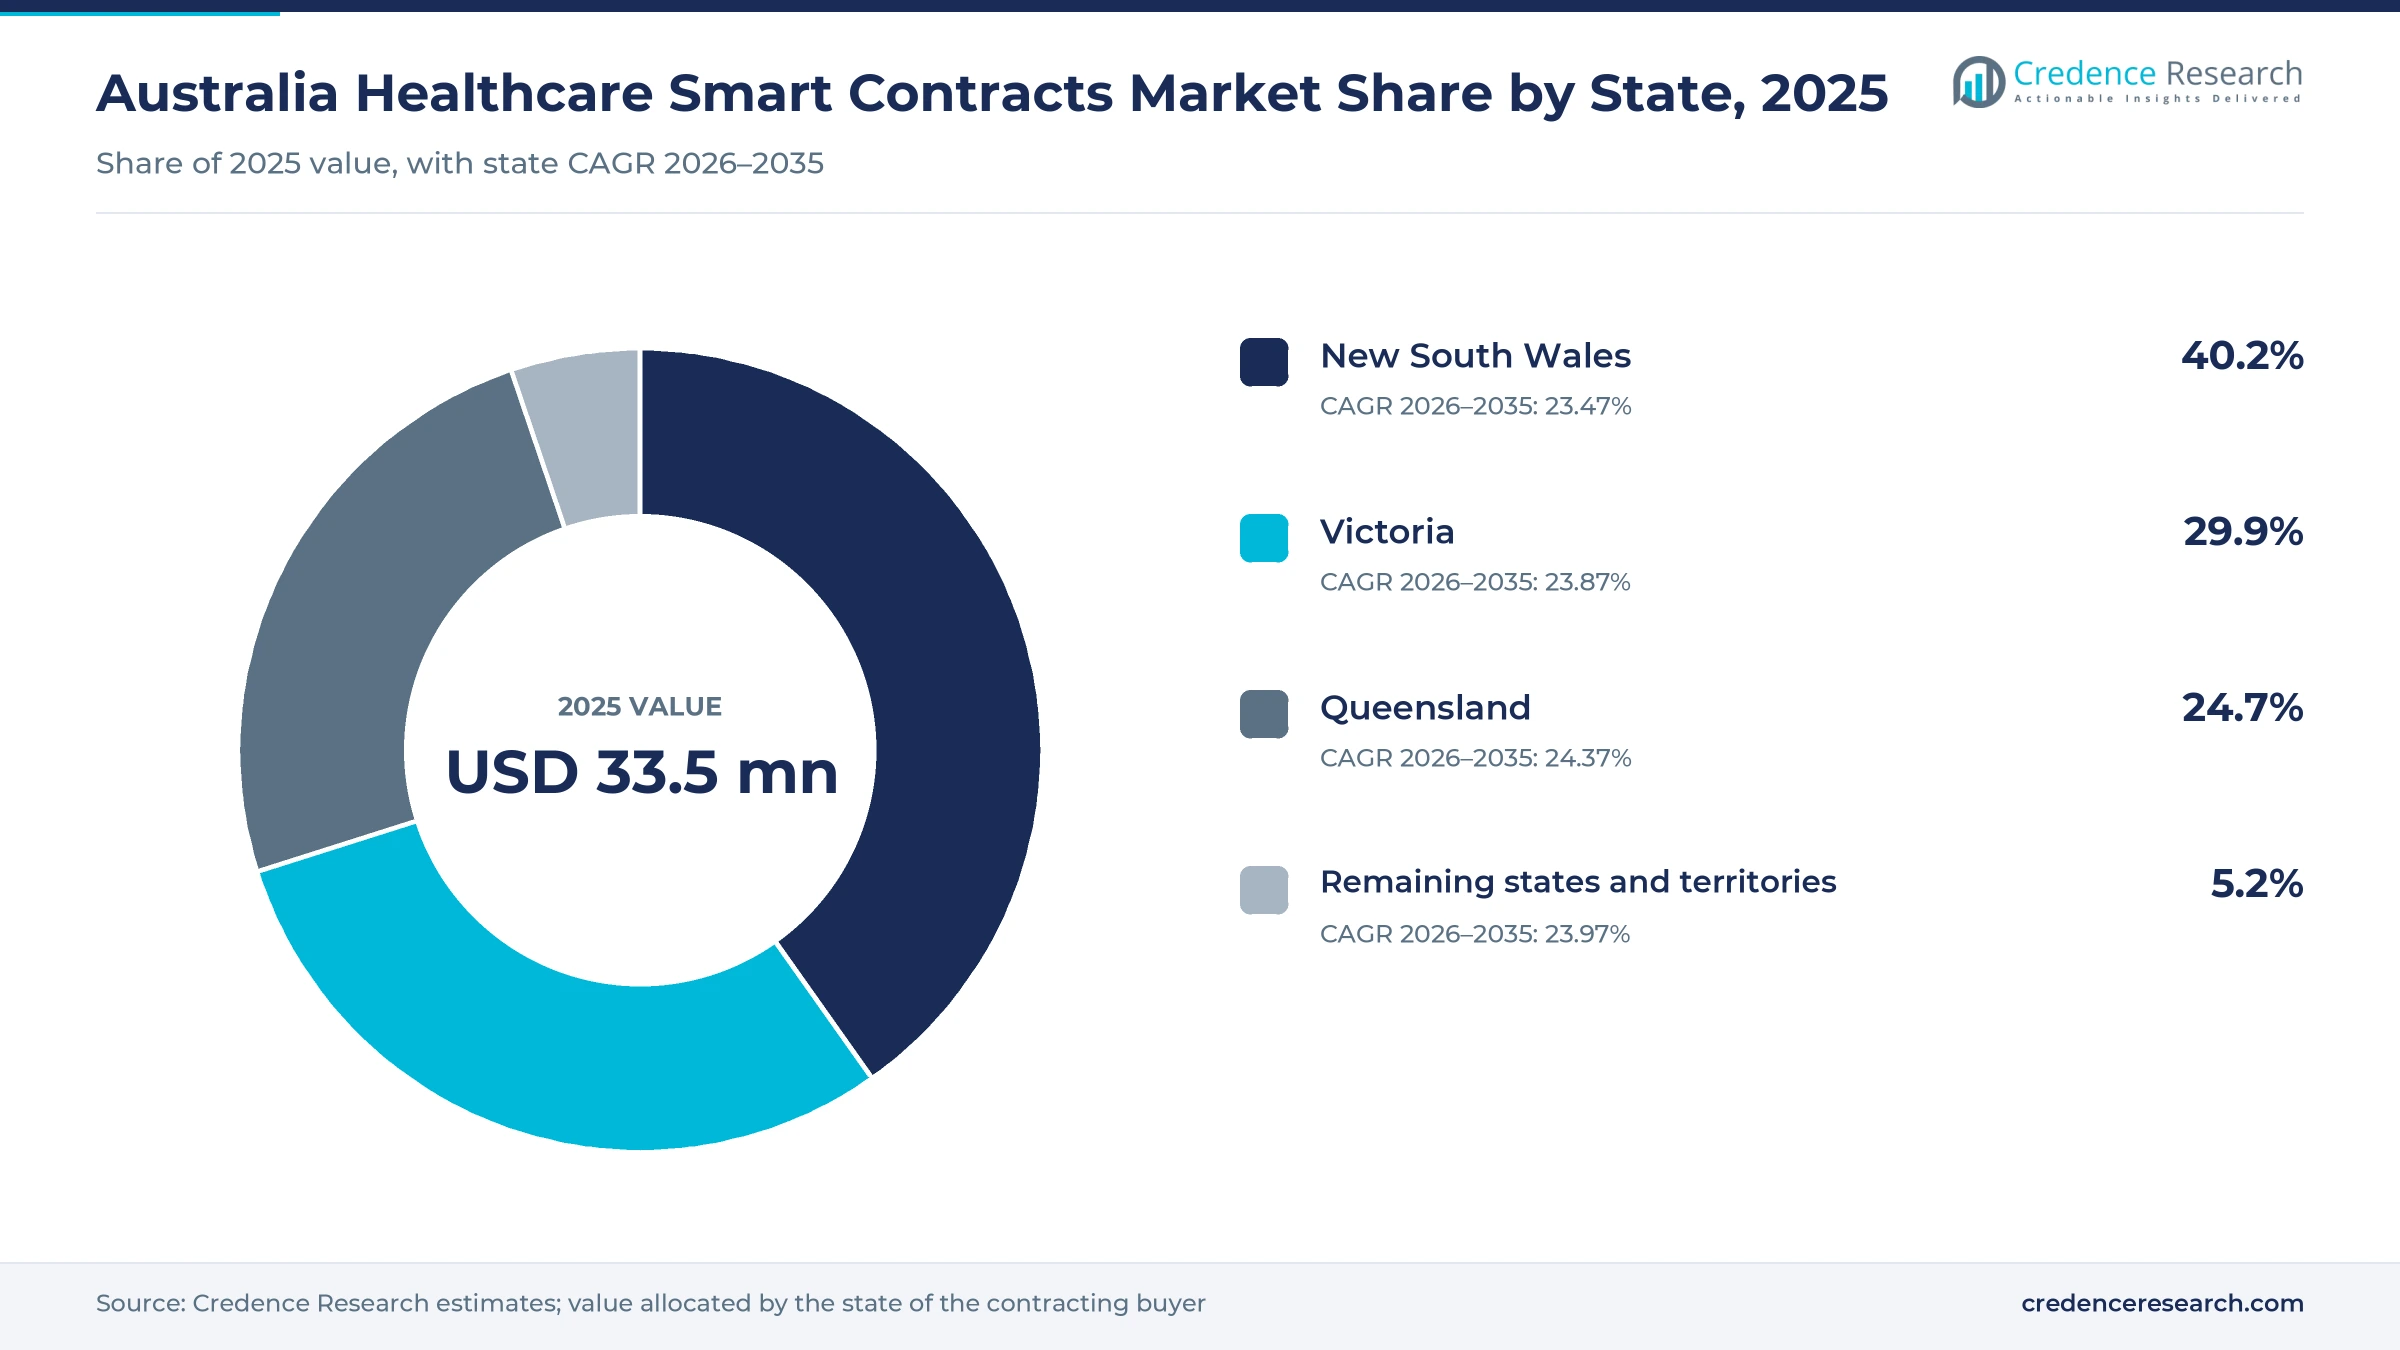
New South Wales leads while Queensland grows fastest
| State | Value, 2025 (USD million) | Share, 2025 | CAGR, 2026–2035 |
|---|---|---|---|
| New South Wales | 4.4 | 40.2% | 23.47% |
| Victoria | 3.3 | 29.9% | 23.87% |
| Queensland | 2.7 | 24.7% | 24.37% |
| Remaining states and territories | 0.6 | 5.2% | 23.97% |
Why does New South Wales hold the largest state share?
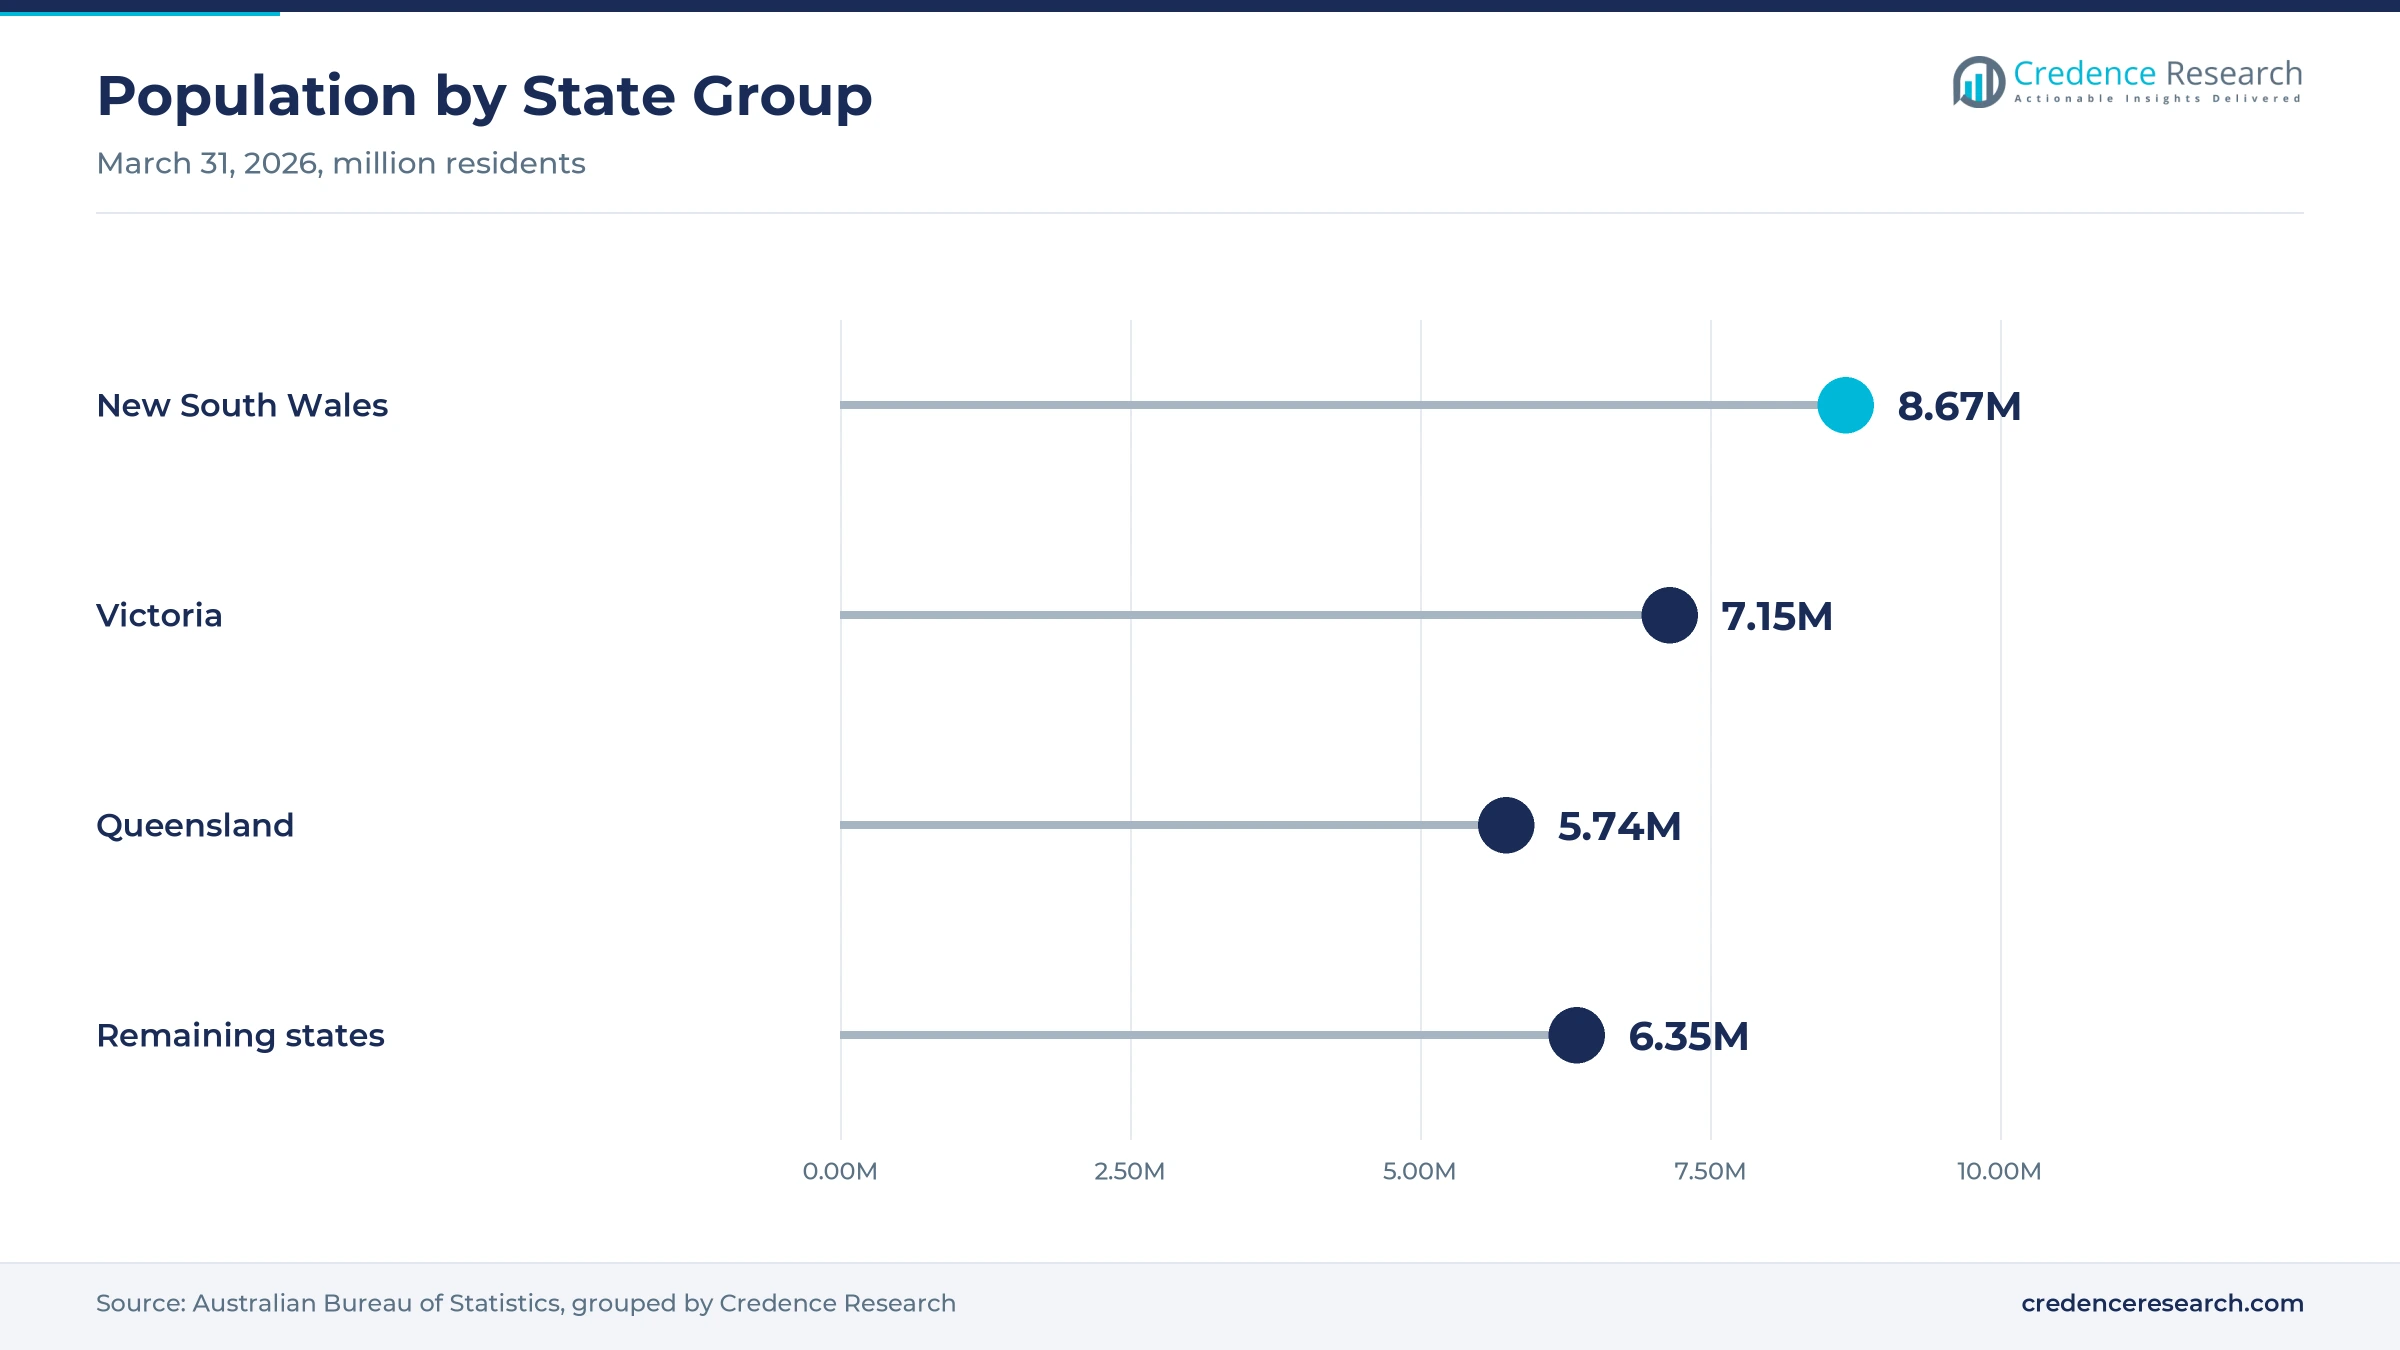
New South Wales held a 40.2% share of 2025 value and grows at 23.47% a year, because Sydney, the capital of New South Wales, hosts insurer head offices, state health technology programs and the national teams of large integrators. The state had about 8.67 million residents at March 31, 2026, the largest population in the country. However, growth is slightly slower than the national rate, because many large buyers already run pilots and now move more slowly into full production.
What supports demand in Victoria?
Victoria held a 29.9% share of 2025 value and grows at 23.87% a year, because Melbourne hosts large hospital networks, pharmaceutical suppliers and medical research institutes. The state had about 7.15 million residents at March 31, 2026, after adding about 109,500 people in a year. As a result, research consent and clinical trial data projects add steady demand alongside insurer and hospital programs.
Why does Queensland grow faster than other states?
Queensland held a 24.7% share of 2025 value and grows fastest at 24.37% a year, because its public health services and universities are expanding digital programs across a fast-growing population. The state had about 5.74 million residents at March 31, 2026, after growth of 1.6% over the year. In turn, regional hospitals and remote services create demand for shared records that work across many separate sites.
How do the remaining states and territories contribute?
The remaining states and territories held a 5.2% share of 2025 value and grow at 23.97% a year, despite about 6.35 million residents across Western Australia, South Australia, Tasmania, the Northern Territory and the Australian Capital Territory. This gap exists because insurers, integrators and pilots concentrate on the east coast. Western Australia grew 2.1% in the year to March 2026, which supports later uptake.
Privacy, cyber and interoperability milestones, 2024 to 2026
| Development | Status and market relevance |
|---|---|
| In June 2024, the OAIC began civil penalty proceedings against Medibank over a breach affecting 9.7 million Australians. | Raised the cost of weak security controls for health data holders |
| In June 2024, Blockchain Australia announced its new name, the Digital Economy Council of Australia, during Blockchain Week in Sydney. | Broadened the industry body beyond blockchain to the wider digital economy |
| In December 2024, the Privacy and Other Legislation Amendment Act 2024 received Royal Assent. | Added APP 11.3 on technical and organisational measures |
| In March 2025, the Sparked program launched AU Core FHIR Implementation Guide release 1. | Gives contract platforms a common national data standard |
| In August 2026, Accenture began a contract worth about $161.6 million to support My Health Record. | Runs to August 2029 with one extension option |
Permissioned ledgers, FHIR links and identity tools
- Permissioned ledgers limit node operation to known insurers, providers and suppliers, which fits privacy and clinical governance rules and keeps validator identities on record.
- FHIR interfaces let contract logic read and write the same patient, claim and medication resources used by clinical and billing systems, following the AU Core profiles.
- Off-chain storage with hashes keeps personal data in secure stores while the ledger proves that records were not altered, which helps buyers meet APP 11.2 destruction duties.
- Digital identity services confirm who a patient or clinician is before a contract grants or revokes access, using accredited providers under the Digital ID Act 2024.
Need a Custom Version of This Report?
Tailor the scope, geography, or segments to your exact requirements.
- Custom geography or segment scope
- Direct access to our analyst team
Integrators and platform vendors compete on trust and fit
No vendor has disclosed a large production smart contract network in Australian healthcare, so competition centers on technology and consulting firms that already run national health data systems. Accenture has run My Health Record infrastructure since 2012 and signed a new support agreement that began in August 2026. Deloitte was selected in 2021 to build the FHIR-based Health Information Gateway for the Australian Digital Health Agency. The Digital Transformation Agency announced a new whole-of-government arrangement with IBM Australia in January 2023 that covers Services Australia, while Oracle, through Oracle Health, supplies electronic records and announced an AI roadmap with Australia and New Zealand capabilities in September 2026. The Digital Economy Council of Australia, formerly Blockchain Australia, represents local ledger developers. Rivals compete on privacy compliance, FHIR integration, local data hosting and the ability to form multi-party networks.
Companies profiled and their roles in this market
| Company | Type | Role in the market |
|---|---|---|
| Accenture | Systems integrator | Supports My Health Record under a contract that began in August 2026 |
| Deloitte | Consulting and integration firm | Selected in 2021 to build the FHIR-based Health Information Gateway |
| IBM | Technology and consulting vendor | Whole-of-government arrangement from January 2023 covering Services Australia |
| Oracle | Cloud and health records vendor | Outlined healthcare AI plans with Australia and New Zealand capabilities in 2026 |
| Digital Economy Council of Australia | Industry body | Renamed from Blockchain Australia in June 2024 |
Credence Research view on Australian ledger-based automation
Credence Research's view is that ledger-based health contracts in Australia will grow from a small base as privacy duties, national data standards and claims volumes make automated, auditable rules more valuable. Claims adjudication keeps the largest share because insurers see direct savings, while consent management grows fastest under stricter security rules. Permissioned and consortium networks will carry most projects, because health buyers must control who reads each record. Integrators that pair FHIR skills with privacy compliance should gain the most share.
How the Australian ledger automation estimate was built
The report uses 2025 as the base year on a calendar basis, and market values come from the Credence Research model. That model combines official population and health statistics, regulator guidance, legislation, national digital health program reports, insurer statistics and company releases on contracts and launches. Segment splits and state growth rates are Credence Research estimates, while state shares follow the client-defined split. Sources used are public reports, official statistics, trade press, government releases and company releases, and no interviews or surveys were used.
Consent, claims and traceability carry growth to 2035
Ledger-based health contract value is expected to reach USD 93.3 million by 2035, a 23.84% CAGR during 2026–2035, as insurers, hospitals and suppliers move from pilots to shared production networks. Growth should be strongest where consent, claims and product traceability already follow national standards. After that, managed services will take a larger share as buyers hand operations to specialists. Clear legal guidance on automated decisions would speed adoption, while a serious ledger failure or privacy incident could slow public programs.
Frequently Asked Questions
How big is the Australia healthcare smart contracts market?
Which solution type leads ledger-based health contract value in Australia?
Which state leads the Australia healthcare smart contracts market?
How does APP 11 affect health data holders in Australia?
How many data breaches did Australian health providers report in 2025?
Which application grows fastest in this market?
Who are the leading companies in the Australian market?
What are the main challenges for ledger-based health contracts?
Table of Content
Chapter 1 Market Segmentation
- 1.1 Segmentation Framework
- 1.1.1 Product and Service Classification
- 1.1.2 Application and End-Use Classification
- 1.1.3 Technology and Solution Classification
- 1.1.4 Customer and Distribution Channel Classification
- 1.1.5 Geographic Segmentation
- 1.1.6 Market Segment Definitions and Boundaries
- 1.2 By Solution Type
- 1.2.1 Software platforms
- 1.2.2 Professional services
- 1.2.3 Managed services
- 1.3 By Application
- 1.3.1 Claims adjudication and billing
- 1.3.2 Patient data and consent
- 1.3.3 Pharmaceutical supply chains
- 1.3.4 Clinical and workforce automation
- 1.4 By Customer Type
- 1.4.1 Healthcare payers
- 1.4.2 Healthcare providers
- 1.4.3 Life sciences companies
- 1.4.4 Public health and research organisations
- 1.5 By Technology
- 1.5.1 Permissioned networks
- 1.5.2 Consortium networks
- 1.5.3 Public networks
- 1.6 By State
- 1.6.1 New South Wales
- 1.6.2 Victoria
- 1.6.3 Queensland
- 1.6.4 Remaining states and territories
Chapter 2 Introduction
- 2.1 Report Objectives and Scope
- 2.2 Product Definition and Industry Terminology
- 2.3 Market Inclusions and Exclusions
- 2.4 Research Process
- 2.4.1 Primary Research and Expert Interviews
- 2.4.2 Secondary Research and Source Review
- 2.4.3 Top-Down and Bottom-Up Estimation
- 2.4.4 Data Triangulation and Verification
- 2.5 Market Size Measurement Basis
- 2.5.1 2025: USD 11.0 million → 2035: USD 93.3 million
- 2.6 Historical and Forecast Reference Periods
- 2.6.1 Historical Period: 2018-2025
- 2.6.2 Base Year: 2025
- 2.6.3 Forecast Period: 2025-2035
- 2.7 Research Assumptions and Limitations
Chapter 3 Executive Summary
- 3.1 Market Snapshot and Key Findings
- 3.2 Base-Year Market Size, 2025
- 3.3 Forecast Market Size, 2035
- 3.4 Revenue and Volume Growth Outlook
- 3.5 Key Demand and Supply Indicators
- 3.6 Leading Market Segments
- 3.7 Fastest-Growing Market Opportunities
- 3.8 Regional Performance Highlights
- 3.9 Technology and Industry Transformation
- 3.10 Competitive Landscape Summary
- 3.11 Analyst View and Strategic Implications
Chapter 4 Australia Healthcare Smart Contracts Market Trends and Developments
- 4.1 Historical Industry Development, 2018-2025
- 4.2 Recent Market Trends and Developments
- 4.3 Demand and Customer Behavior Trends
- 4.4 Technology and Product Innovation
- 4.5 Artificial Intelligence, Automation and Digitalization
- 4.6 Local Manufacturing and Supply Chain Realignment
- 4.7 Industry Partnerships, Mergers and Acquisitions
- 4.8 Sustainability and Circular Economy Developments
- 4.9 Government and Private Sector Investment Trends
- 4.10 Emerging Business Models and Commercialization
- 4.11 Industry Developments and Announcements
Chapter 5 Australia Healthcare Smart Contracts Market Production, Supply and Demand Analysis
- 5.1 Demand Trend and Consumption Analysis, 2018-2025
- 5.2 Demand Forecast, 2025-2035
- 5.3 Production and Output Trend, 2018-2025
- 5.4 Production and Output Forecast, 2025-2035
- 5.5 Installed Capacity and Capacity Utilization
- 5.6 Company-Wise Production Plants and Statistics
- 5.6.1 Installed Production Capacity
- 5.6.2 Actual Production
- 5.6.3 Planned Capacity and Expansion Targets
- 5.7 Supply Chain Structure and Procurement Trends
- 5.8 Supply-Demand Gap and Bottlenecks
- 5.9 Import Dependence and Sourcing Structure
- 5.10 Contract Manufacturing and Outsourcing
- 5.11 Regional Supply and Demand Concentration
Chapter 6 Australia Healthcare Smart Contracts Market Pricing Analysis
- 6.1 Pricing Structure and Measurement
- 6.2 Historical Pricing Trends, 2018-2025
- 6.3 Pricing Outlook, 2025-2035
- 6.4 Average Selling Price and Unit Economics
- 6.5 Pricing by Product and Market Segment
- 6.6 Geographic Pricing Differences
- 6.7 Key Input, Energy, Labor and Logistics Costs
- 6.8 Contract Pricing and Purchasing Models
- 6.9 Pricing Sensitivity and Competitive Positioning
- 6.10 Price, Margin and Profitability Implications
Chapter 7 Australia Healthcare Smart Contracts Market Dynamics
- 7.1 Market Growth Drivers
- 7.1.1 Demand-Side Drivers
- 7.1.2 Technology and Innovation Drivers
- 7.1.3 Infrastructure and Investment Drivers
- 7.1.4 Regulatory and Policy Drivers
- 7.2 Market Restraints
- 7.2.1 Cost and Affordability Constraints
- 7.2.2 Technology and Adoption Barriers
- 7.2.3 Supply Chain and Operational Constraints
- 7.3 Market Challenges
- 7.3.1 Competitive Pressure and Margin Erosion
- 7.3.2 Skills, Infrastructure and Implementation Gaps
- 7.4 Emerging Market Opportunities
- 7.5 Market Dynamics Impact and Time-Horizon Assessment
Chapter 8 Australia Healthcare Smart Contracts Value Chain Analysis
- 8.1 Industry Value Chain Overview
- 8.2 Upstream Suppliers and Critical Inputs
- 8.3 Technology and Component Providers
- 8.4 Manufacturing or Service Delivery
- 8.5 Distribution, Channel Partners and Integrators
- 8.6 Downstream Applications and End Users
- 8.7 Value Addition and Profit Pools
- 8.8 Vertical Integration and Outsourcing
- 8.9 Supplier Concentration and Risk
- 8.10 Supply Chain Localization and Resilience
Chapter 9 Australia Healthcare Smart Contracts Market Regulations and Policies
- 9.1 Relevant Laws, Standards and Compliance Frameworks
- 9.2 Product, Service, Safety and Quality Requirements
- 9.3 Government Policies, Incentives and Subsidies
- 9.4 Imports, Exports and Trade Barriers
- 9.5 Public Procurement and Local Content Requirements
- 9.6 Environmental and Sustainability Compliance
- 9.7 Upcoming Policy Changes and Market Implications
Chapter 10 Australia Healthcare Smart Contracts Market Hotspots and Opportunities
- 10.1 Market Opportunity Mapping and Growth Hotspots
- 10.2 High-Growth Applications and Customer Groups
- 10.3 Underserved Markets and White-Space Opportunities
- 10.4 Emerging Technology and Product Opportunities
- 10.5 New Capacity and Investment Hotspots
- 10.6 Market Entry and Expansion Opportunities
- 10.7 Distribution and Partnership Opportunities
- 10.8 Near-Term and Long-Term Commercial Potential
- 10.9 Opportunity Attractiveness and Execution Risks
Chapter 11 Australia Healthcare Smart Contracts Market Outlook, 2025-2035
- 11.1 Market Size and Analysis
- 11.1.1 Revenue (Market Measurement: 2025: USD 11.0 million → 2035: USD 93.3 million)
- 11.1.2 Market Volume and Quantity Sold
- 11.1.3 Historical Market Size, 2018-2025
- 11.1.4 Base-Year Market Size, 2025
- 11.2 Market Forecast, 2025-2035
- 11.2.1 Revenue Forecast to 2035
- 11.2.2 Volume Forecast to 2035
- 11.2.3 CAGR and Year-on-Year Growth
- 11.2.4 Incremental Revenue Opportunity
- 11.3 Forecast Assumptions and Scenario Analysis
- 11.3.1 Base-Case Forecast
- 11.3.2 Optimistic and Conservative Scenarios
- 11.3.3 Technology, Pricing and Policy Sensitivities
- 11.4 Market Attractiveness and Growth Outlook
Chapter 12 Australia Healthcare Smart Contracts Market Segmentation and Outlook
- 12.1 Segmentation Summary and Market Shares, 2025
- 12.2 Largest and Fastest-Growing Segments
- 12.3 By Solution Type - Market Size and Forecast, 2025-2035
- 12.3.1 Segment Definition and Scope
- 12.3.2 Historical Market Size, 2018-2025
- 12.3.3 Revenue Forecast, 2025-2035
- 12.3.4 Volume Forecast, 2025-2035
- 12.3.5 Base-Year Market Share, 2025
- 12.3.6 Segment CAGR and Growth Drivers
- 12.3.7 Subsegment Market Size and Forecast
- 12.3.7.1 Software platforms
- 12.3.7.2 Professional services
- 12.3.7.3 Managed services
- 12.3.8 Subsegment Pricing and Adoption Trends
- 12.3.9 Leading Suppliers and Competition
- 12.3.10 Regional Demand and Opportunities
- 12.4 By Application - Market Size and Forecast, 2025-2035
- 12.4.1 Segment Definition and Scope
- 12.4.2 Historical Market Size, 2018-2025
- 12.4.3 Revenue Forecast, 2025-2035
- 12.4.4 Volume Forecast, 2025-2035
- 12.4.5 Base-Year Market Share, 2025
- 12.4.6 Segment CAGR and Growth Drivers
- 12.4.7 Subsegment Market Size and Forecast
- 12.4.7.1 Claims adjudication and billing
- 12.4.7.2 Patient data and consent
- 12.4.7.3 Pharmaceutical supply chains
- 12.4.7.4 Clinical and workforce automation
- 12.4.8 Subsegment Pricing and Adoption Trends
- 12.4.9 Leading Suppliers and Competition
- 12.4.10 Regional Demand and Opportunities
- 12.5 By Customer Type - Market Size and Forecast, 2025-2035
- 12.5.1 Segment Definition and Scope
- 12.5.2 Historical Market Size, 2018-2025
- 12.5.3 Revenue Forecast, 2025-2035
- 12.5.4 Volume Forecast, 2025-2035
- 12.5.5 Base-Year Market Share, 2025
- 12.5.6 Segment CAGR and Growth Drivers
- 12.5.7 Subsegment Market Size and Forecast
- 12.5.7.1 Healthcare payers
- 12.5.7.2 Healthcare providers
- 12.5.7.3 Life sciences companies
- 12.5.7.4 Public health and research organisations
- 12.5.8 Subsegment Pricing and Adoption Trends
- 12.5.9 Leading Suppliers and Competition
- 12.5.10 Regional Demand and Opportunities
- 12.6 By Technology - Market Size and Forecast, 2025-2035
- 12.6.1 Segment Definition and Scope
- 12.6.2 Historical Market Size, 2018-2025
- 12.6.3 Revenue Forecast, 2025-2035
- 12.6.4 Volume Forecast, 2025-2035
- 12.6.5 Base-Year Market Share, 2025
- 12.6.6 Segment CAGR and Growth Drivers
- 12.6.7 Subsegment Market Size and Forecast
- 12.6.7.1 Permissioned networks
- 12.6.7.2 Consortium networks
- 12.6.7.3 Public networks
- 12.6.8 Subsegment Pricing and Adoption Trends
- 12.6.9 Leading Suppliers and Competition
- 12.6.10 Regional Demand and Opportunities
- 12.7 By State - Market Size and Forecast, 2025-2035
- 12.7.1 Segment Definition and Scope
- 12.7.2 Historical Market Size, 2018-2025
- 12.7.3 Revenue Forecast, 2025-2035
- 12.7.4 Volume Forecast, 2025-2035
- 12.7.5 Base-Year Market Share, 2025
- 12.7.6 Segment CAGR and Growth Drivers
- 12.7.7 Subsegment Market Size and Forecast
- 12.7.7.1 New South Wales
- 12.7.7.2 Victoria
- 12.7.7.3 Queensland
- 12.7.7.4 Remaining states and territories
- 12.7.8 Subsegment Pricing and Adoption Trends
- 12.7.9 Leading Suppliers and Competition
- 12.7.10 Regional Demand and Opportunities
- 12.8 Segment Growth Comparison
- 12.9 Segment Attractiveness and Priority Matrix
Chapter 13 Australia Healthcare Smart Contracts End-Use and Application Market Outlook
- 13.1 End-Use Industry and Customer Demand Structure
- 13.2 Leading Applications and Customer Groups
- 13.3 End-Use Market Size, Share and Forecast
- 13.4 Major End-Use Industry Deep Dives
- 13.4.1 Customer Requirements and Use Cases
- 13.4.2 Demand and Replacement Cycles
- 13.4.3 Technical and Regulatory Considerations
- 13.4.4 Purchasing and Procurement Models
- 13.4.5 Leading Vendors and Distribution Channels
- 13.4.6 Forecast and Commercial Opportunities
- 13.5 Emerging Applications and Cross-Segment Demand
- 13.6 End-Use Industry Investment Priorities
Chapter 14 Australia Healthcare Smart Contracts Geographic Market Outlook, 2025-2035
- 14.1 Domestic Market Distribution and Demand Clusters
- 14.2 State- or Province-Wise Market Size and Forecast, 2025-2035
- 14.3 City and Metropolitan Market Outlook
- 14.4 Industrial, Manufacturing and Commercial Clusters
- 14.5 Geographic Concentration of Key End Users
- 14.6 Local Pricing and Purchasing Differences
- 14.7 Domestic Production Facilities and Capacity Map
- 14.8 Local Infrastructure and Project Pipeline
- 14.9 State-Level Policy and Incentive Differences
- 14.10 Subnational Investment Hotspots and Opportunities
- 14.11 Distribution and Logistics Networks
- 14.12 Domestic Competitive Footprint
Chapter 15 Australia Healthcare Smart Contracts Technology, Innovation and Sustainability Outlook
- 15.1 Technology Landscape and Maturity
- 15.2 Product, Process and Service Innovation
- 15.3 AI, Automation and Digital Tools in the Industry
- 15.4 Technology Adoption and Performance Benchmarking
- 15.5 Innovation Pipeline and R&D Investment
- 15.6 Patent and Intellectual Property Trends
- 15.7 Energy Efficiency and Resource Management
- 15.8 Sustainability, Recycling and Circularity
- 15.9 Technology Roadmap, 2025-2035
- 15.10 Risks of Obsolescence and Technology Substitution
Chapter 16 Australia Healthcare Smart Contracts Market Key Strategic Imperatives
- 16.1 Growth and Market Entry Priorities
- 16.2 High-Return Products and Segments
- 16.3 Pricing, Profitability and Cost Optimization
- 16.4 Technology Investment and Product Differentiation
- 16.5 Supply Chain Localization and Resilience
- 16.6 Distribution and Customer Acquisition
- 16.7 Partnership, Acquisition and Capacity Strategy
- 16.8 Regional Expansion Priorities
- 16.9 Short-, Medium- and Long-Term Actions
Chapter 17 Competition Outlook
- 17.1 Industry Competition Characteristics
- 17.2 Market Structure and Concentration
- 17.3 Market Share and Competitive Positioning, 2025
- 17.4 Company-Wise Revenue and Product Benchmarking
- 17.5 Production and Service Capacity Benchmarking
- 17.6 Technology, Pricing and Differentiation
- 17.7 Regional Footprint and Distribution Strength
- 17.8 Mergers, Acquisitions and Strategic Alliances
- 17.9 New Entrants and Competitive Threats
- 17.10 Porter's Five Forces and Industry Attractiveness
- 17.11 Competitive Outlook, 2025-2035
Chapter 18 Company Profiles
- 18.1 Company Coverage and Selection Criteria
- 18.2 IBM
- 18.2.1 Business Description
- 18.2.2 Company Ownership and Geographic Presence
- 18.2.3 Product and Service Portfolio
- 18.2.4 Manufacturing and Operating Footprint
- 18.2.5 Production Capacity and Expansion Plans
- 18.2.6 Financial Performance and Investment
- 18.2.7 Market Share and Competitive Position
- 18.2.8 Technology and Innovation Capabilities
- 18.2.9 Strategic Alliances or Partnerships
- 18.2.10 Recent Developments
- 18.2.11 Growth Strategy and Outlook
- 18.3 Oracle
- 18.4 Accenture
- 18.5 Deloitte
- 18.6 Blockchain Australia (now DECA)
- 18.7 Other Relevant Market Participants
Note: Every listed company is profiled on the structure shown under the first company. The company list is preliminary and may change based on research findings, market developments, data availability and client requirements.
Chapter 19 Disclaimer
- 19.1 Research and Forecast Disclaimer
- 19.2 Data Source and Estimation Limitations
Note: The depth of individual sections depends on data availability for this market. Volume, capacity, trade and other unit-based metrics are included where applicable.

