
Hospital-level IV care is moving into Australian homes
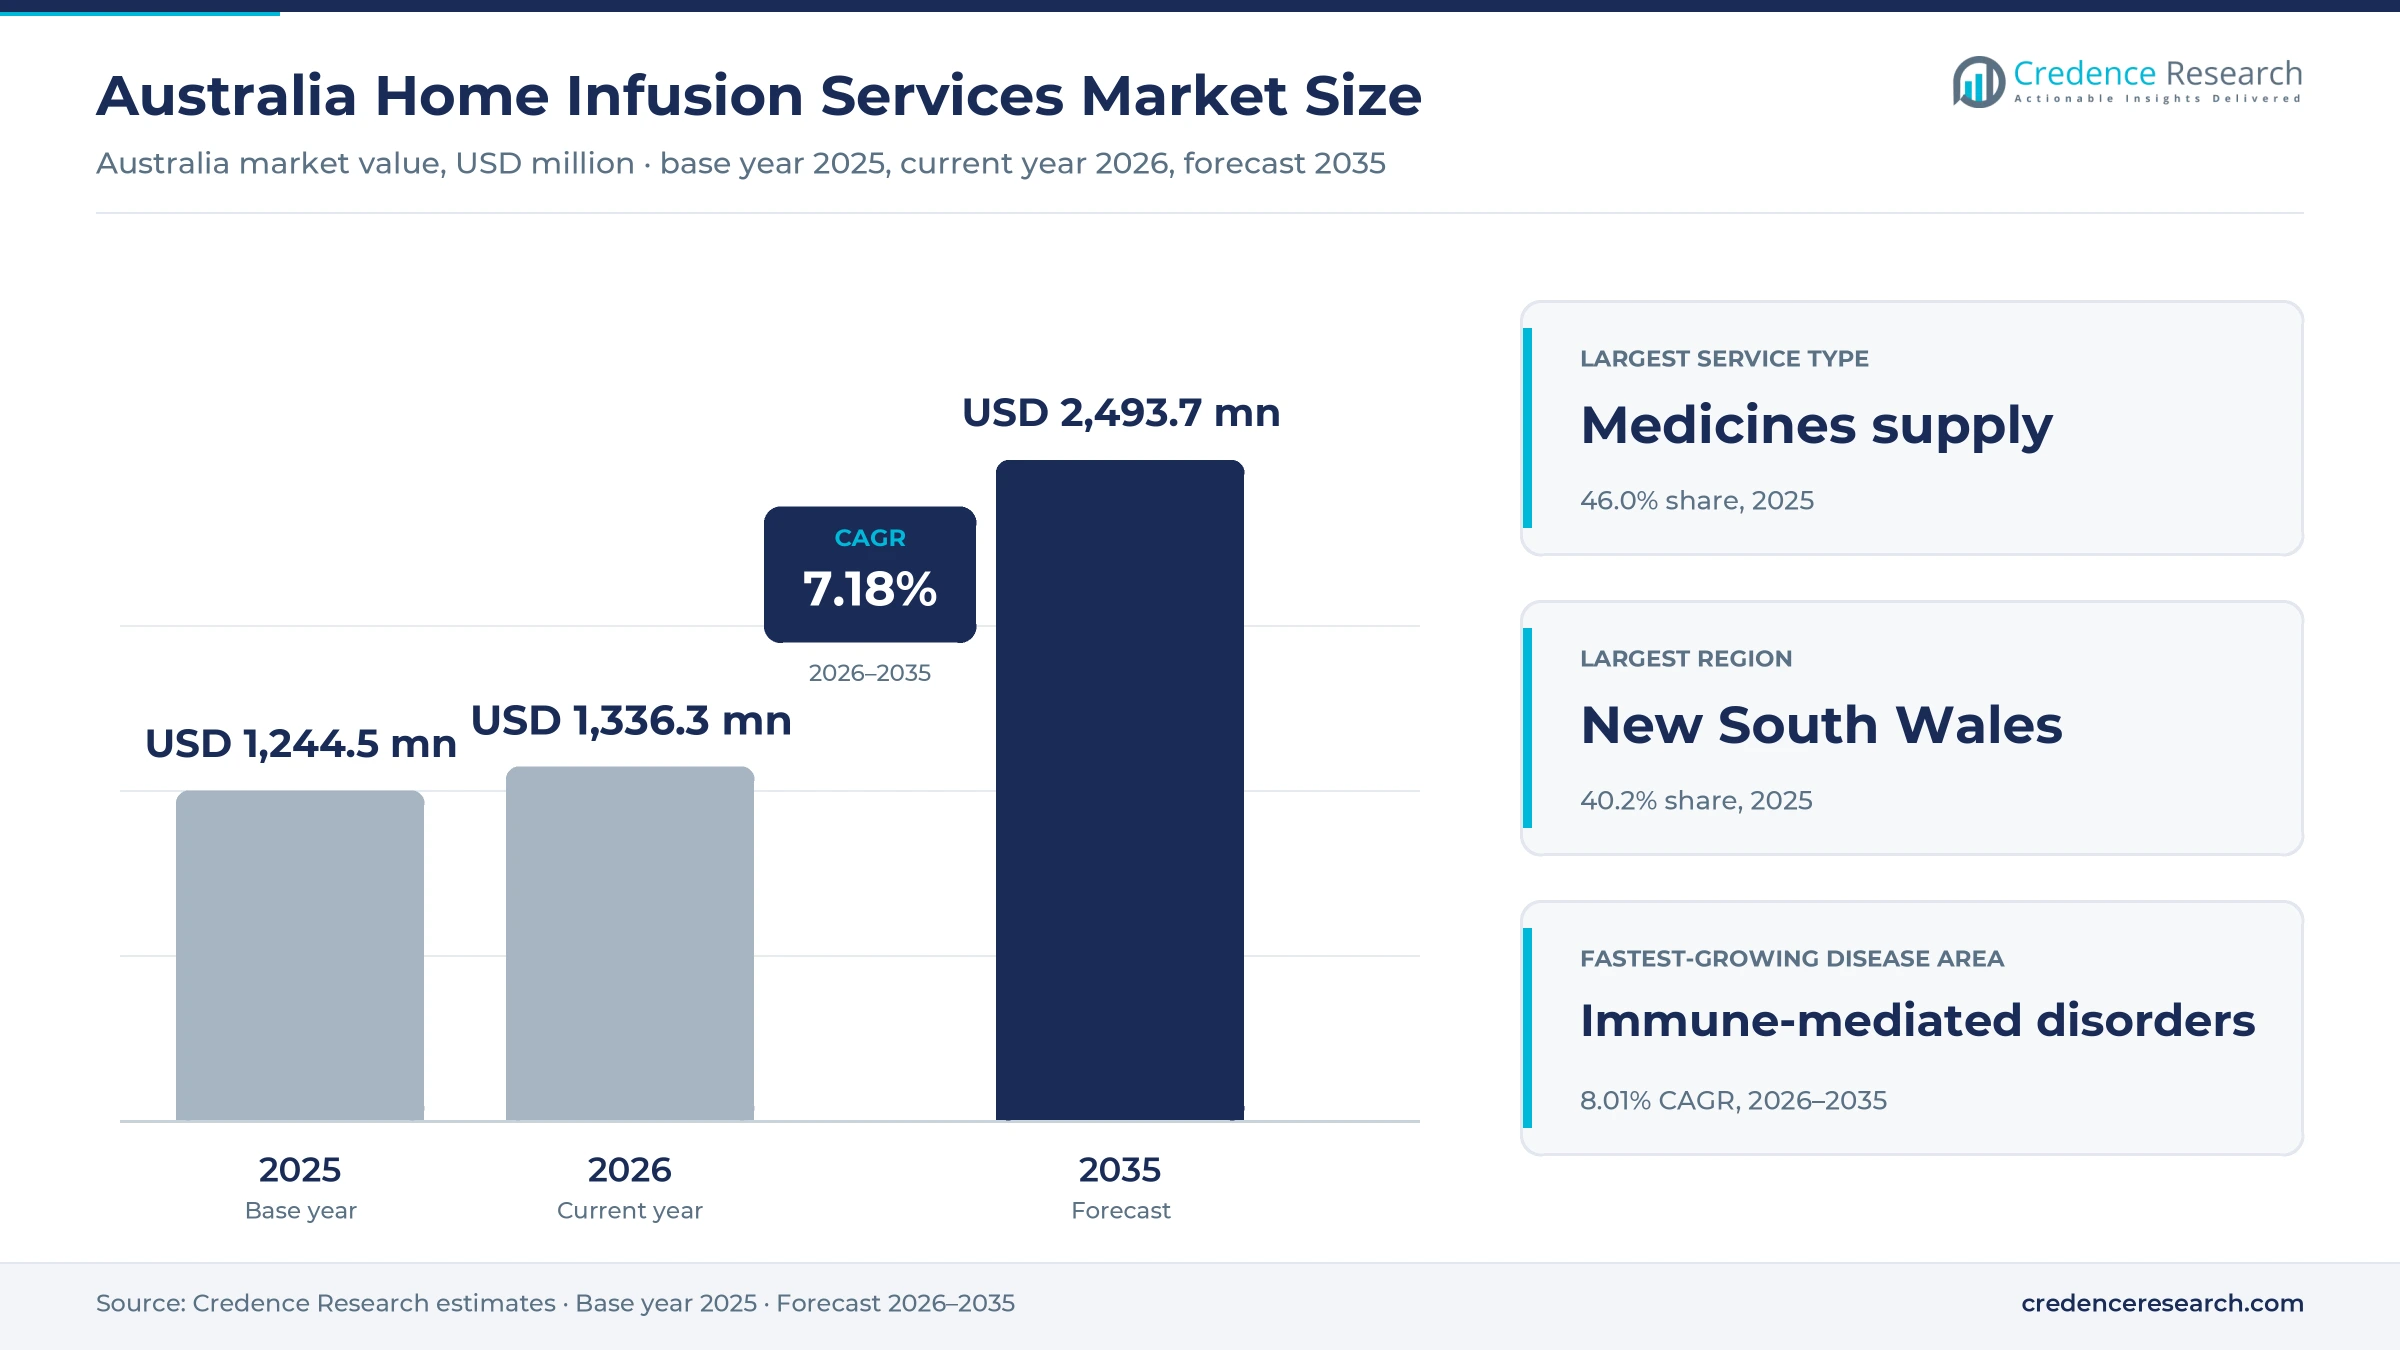
The Australia home infusion services market was valued at USD 1.24 billion in 2025 and is projected to increase from USD 1.34 billion in 2026 to USD 2.49 billion by 2035, registering a CAGR of 7.18% during 2026–2035. Demand comes from state health services that treat infections and other acute conditions through hospital in the home programs, from patients who receive immunoglobulin, biologics or chemotherapy outside a day unit, and from people who need parenteral nutrition or palliative infusions at home. New South Wales held the largest regional share, 40.2% in 2025, because it has the largest population and an expanding state program in western Sydney. Queensland is the fastest-growing region at 7.46% a year, as its population rises quickly. However, the delivery model is changing, because subcutaneous forms of infused medicines are reaching the national subsidy scheme and cut chair time from hours to minutes.
What sits inside the scope of this estimate?
The estimate measures the value of infusion services delivered to patients in their homes across Australia, including the medicines supplied for each course, nursing visits, care coordination and the pumps, sets and consumables provided with them. It counts hospital admission at home, community specialist care, supported self-administration and palliative infusions, whether paid by state health systems, insurers or households.
The estimate excludes infusions given in hospital wards, day oncology units and standalone infusion clinics, as well as oral and injectable medicines that patients take without a nurse-led infusion service. The value chain runs from manufacturers and compounding pharmacies through home hospital operators and nursing providers to the referring hospitals, specialists and the patients they treat.
Australia Home Infusion Services Market Insights
- The Australia home infusion services market was valued at USD 1.24 billion in 2025 and is projected to reach USD 2.49 billion by 2035, registering a CAGR of 7.18% during 2026–2035.
- New South Wales held a 40.2% share of 2025 value, because the state had about 8.67 million residents at March 31, 2026, and a growing hospital in the home program.
- Medicines supply led with a 46.0% share of 2025 value, because antibiotics, immunoglobulin, biologics and nutrition solutions cost more than the visits that deliver them.
- Australia issued 9.88 million grams of immunoglobulin in 2024–25, up 6.7% from the prior year, while 28,650 patients received the therapy across the country.
- Private health insurers grow fastest at 7.77% a year during 2026–2035, as insurer programs with chemo@home extend home chemotherapy and immunotherapy to more members.
Medicines supply leads while immune therapy grows fastest
Why does medicines supply hold the largest value?
Based on service type, the market is categorized into medicines supply, infusion nursing, care coordination and equipment support. Medicines Supply led with a 46.0% share of 2025 value, because antibiotics, immunoglobulin, biologics and nutrition bags carry the highest cost per course. Care Coordination grows fastest at 7.71% a year, as home hospital programs add virtual monitoring and direct referrals from general practice.
How do infections and immune therapy divide demand?
Based on disease area, the market is categorized into infections, immune-mediated disorders, cancer and nutrition and supportive conditions. Infections led with a 38.0% share of 2025 value, because cellulitis, pneumonia and urinary infections dominate hospital in the home admissions. Immune-Mediated Disorders grow fastest at 8.01% a year, as immunoglobulin use and subcutaneous biologics keep rising.
Why does hospital admission at home anchor value?
Based on care setting, the market is categorized into hospital admission at home, community specialist home care, supported self-administration and palliative home care. Hospital Admission at Home led with a 48.0% share of 2025 value, because state programs fund acute courses that replace ward stays. Supported Self-Administration grows fastest at 7.93% a year, as patients learn to give subcutaneous therapy themselves with nurse support.
How do public health systems shape the payer mix?
Based on customer type, the market is categorized into public health systems, private health insurers, direct-pay households and sponsored access programs. Public Health Systems led with a 64.0% share of 2025 value, because state health services fund most hospital in the home episodes. Private Health Insurers grow fastest at 7.77% a year, as insurers cover home chemotherapy and immunotherapy for eligible members.
| Segment Group | Leading Sub-segment | Share, 2025 | Fastest-growing Sub-segment | CAGR, 2026–2035 |
|---|---|---|---|---|
| By Service Type | Medicines Supply | 46.0% | Care Coordination | 7.71% |
| By Disease Area | Infections | 38.0% | Immune-Mediated Disorders | 8.01% |
| By Care Setting | Hospital Admission at Home | 48.0% | Supported Self-Administration | 7.93% |
| By Customer Type | Public Health Systems | 64.0% | Private Health Insurers | 7.77% |
Request a Free Sample
Fill in your details and we'll send you a free sample report.
- Sample data tables & charts
- Research methodology
Home hospital capacity and immune therapy lift demand
How does hospital substitution capacity lift home infusion?
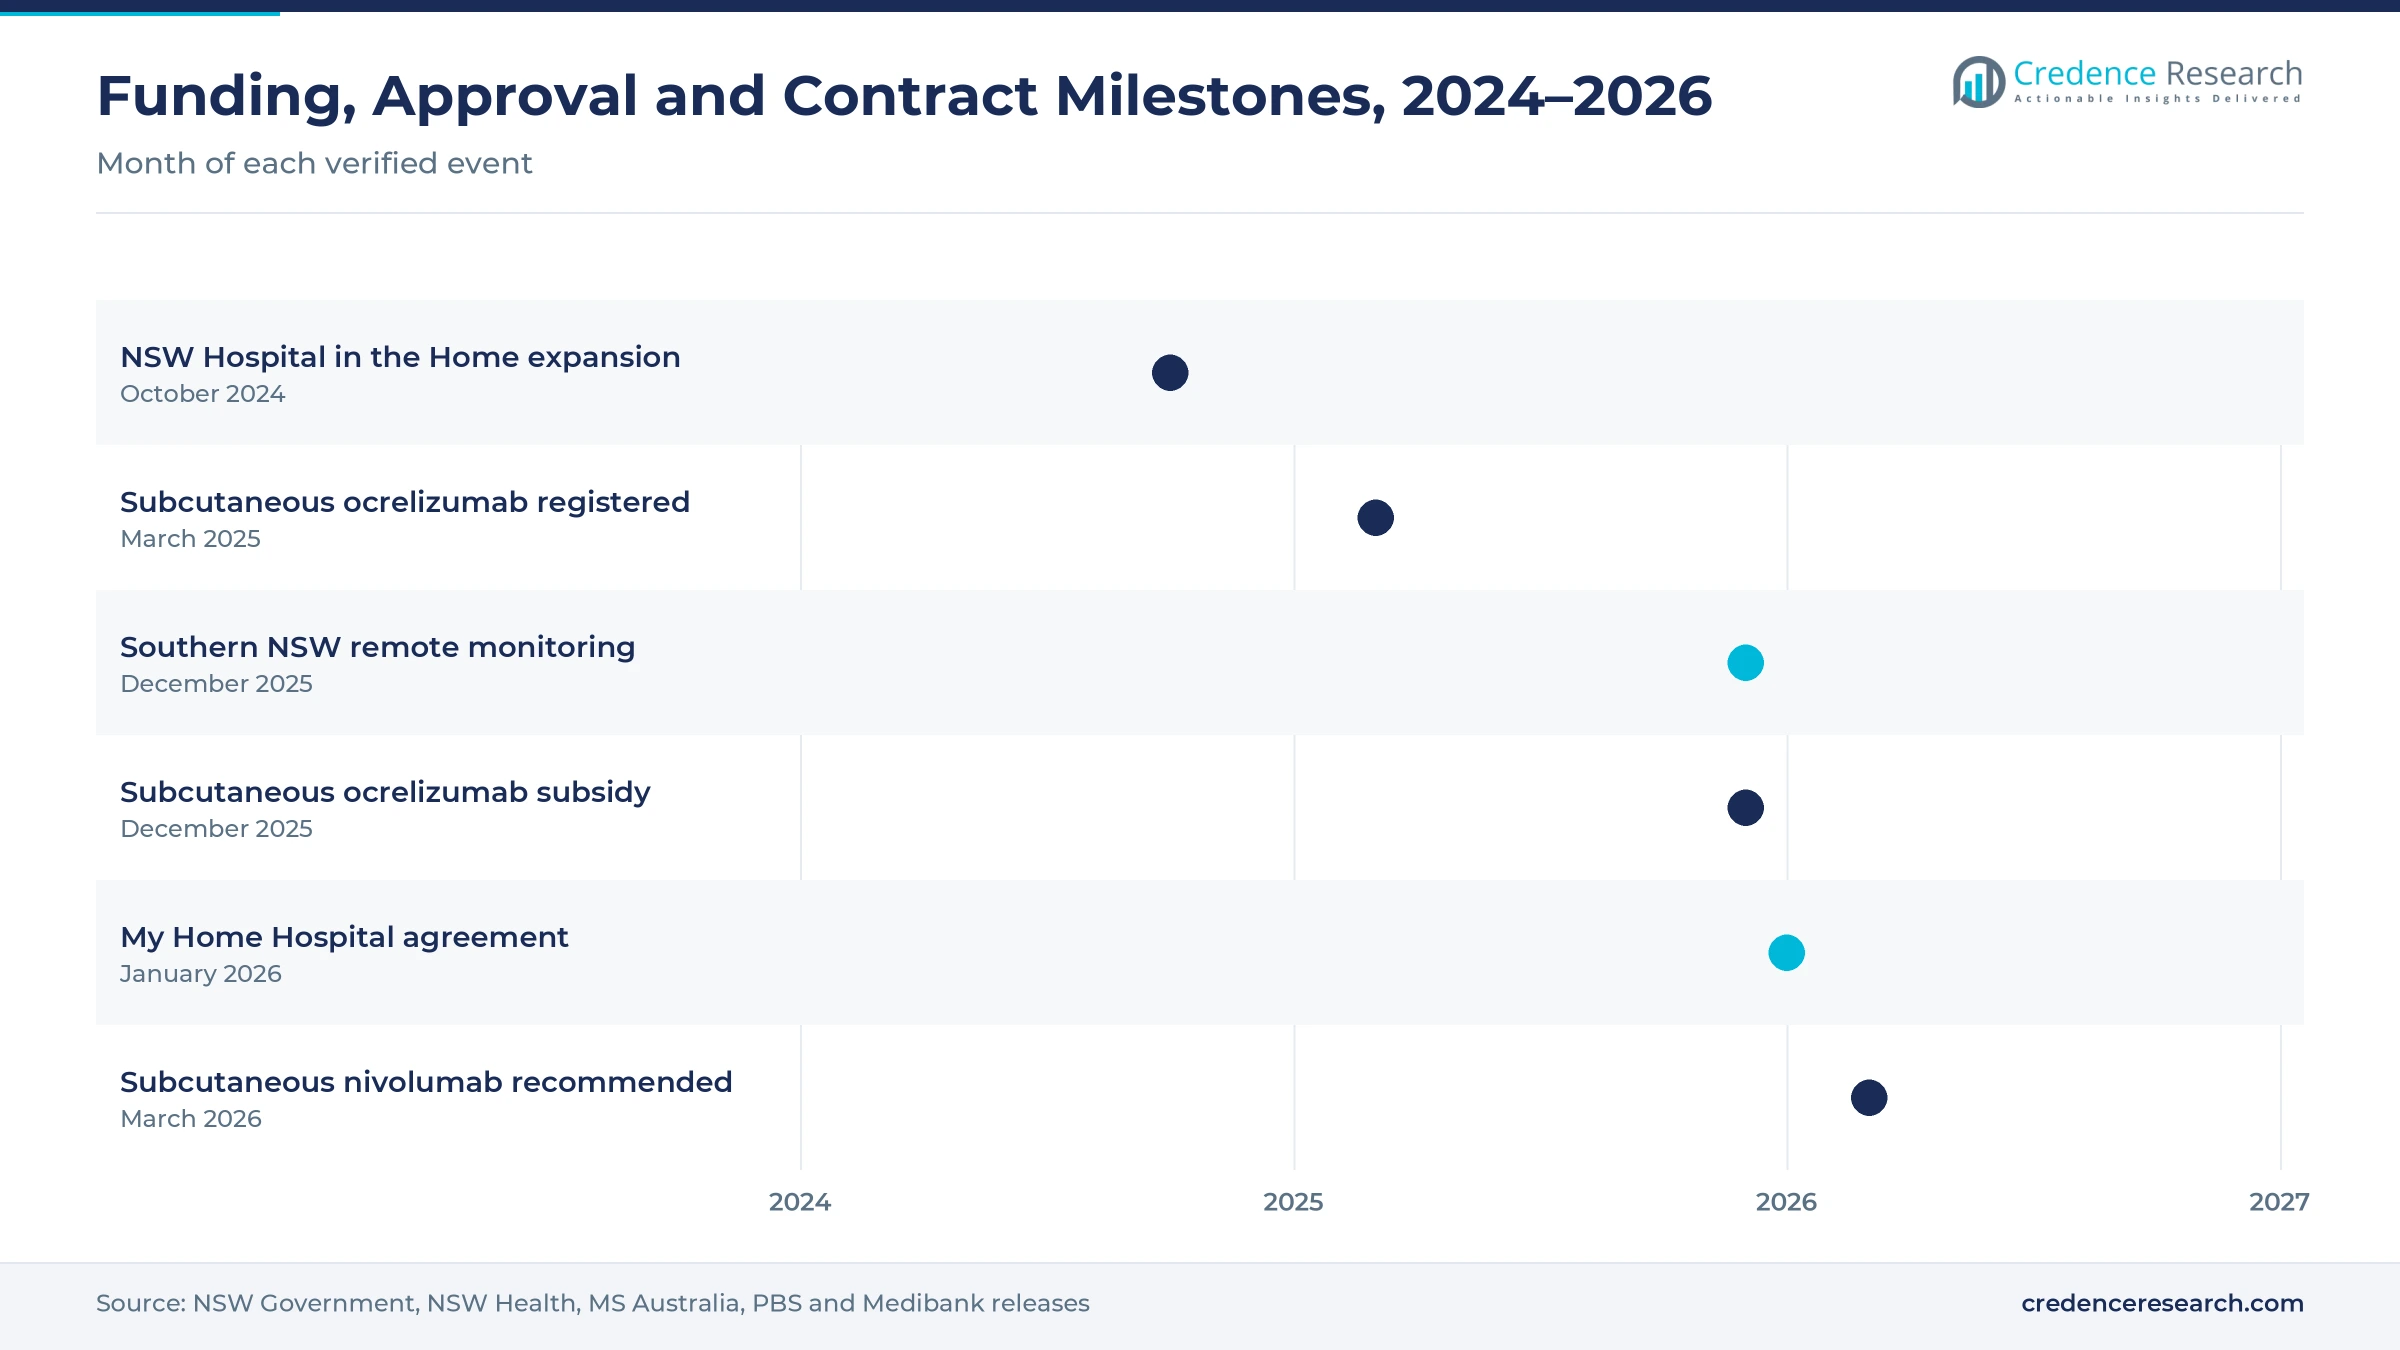
State health services now treat many infections and cases of dehydration at home instead of opening new ward beds, which turns spare home hospital capacity into infusion demand. Australian hospitals recorded 12.6 million hospitalizations in 2023–24, up from 10.2 million a decade earlier, according to the Australian Institute of Health and Welfare. The New South Wales Government committed A$31.4 million on Oct. 9, 2024, to expand Hospital in the Home, after about 5,300 patients used it in the prior year, according to the NSW Government. The expansion should add 3,500 patients a year and free almost 9,000 bed days, which eases pressure on acute hospital care networks. As a result, hospital admission at home holds 48.0% of 2025 value.
Why do recurring immune therapy pathways sustain demand?
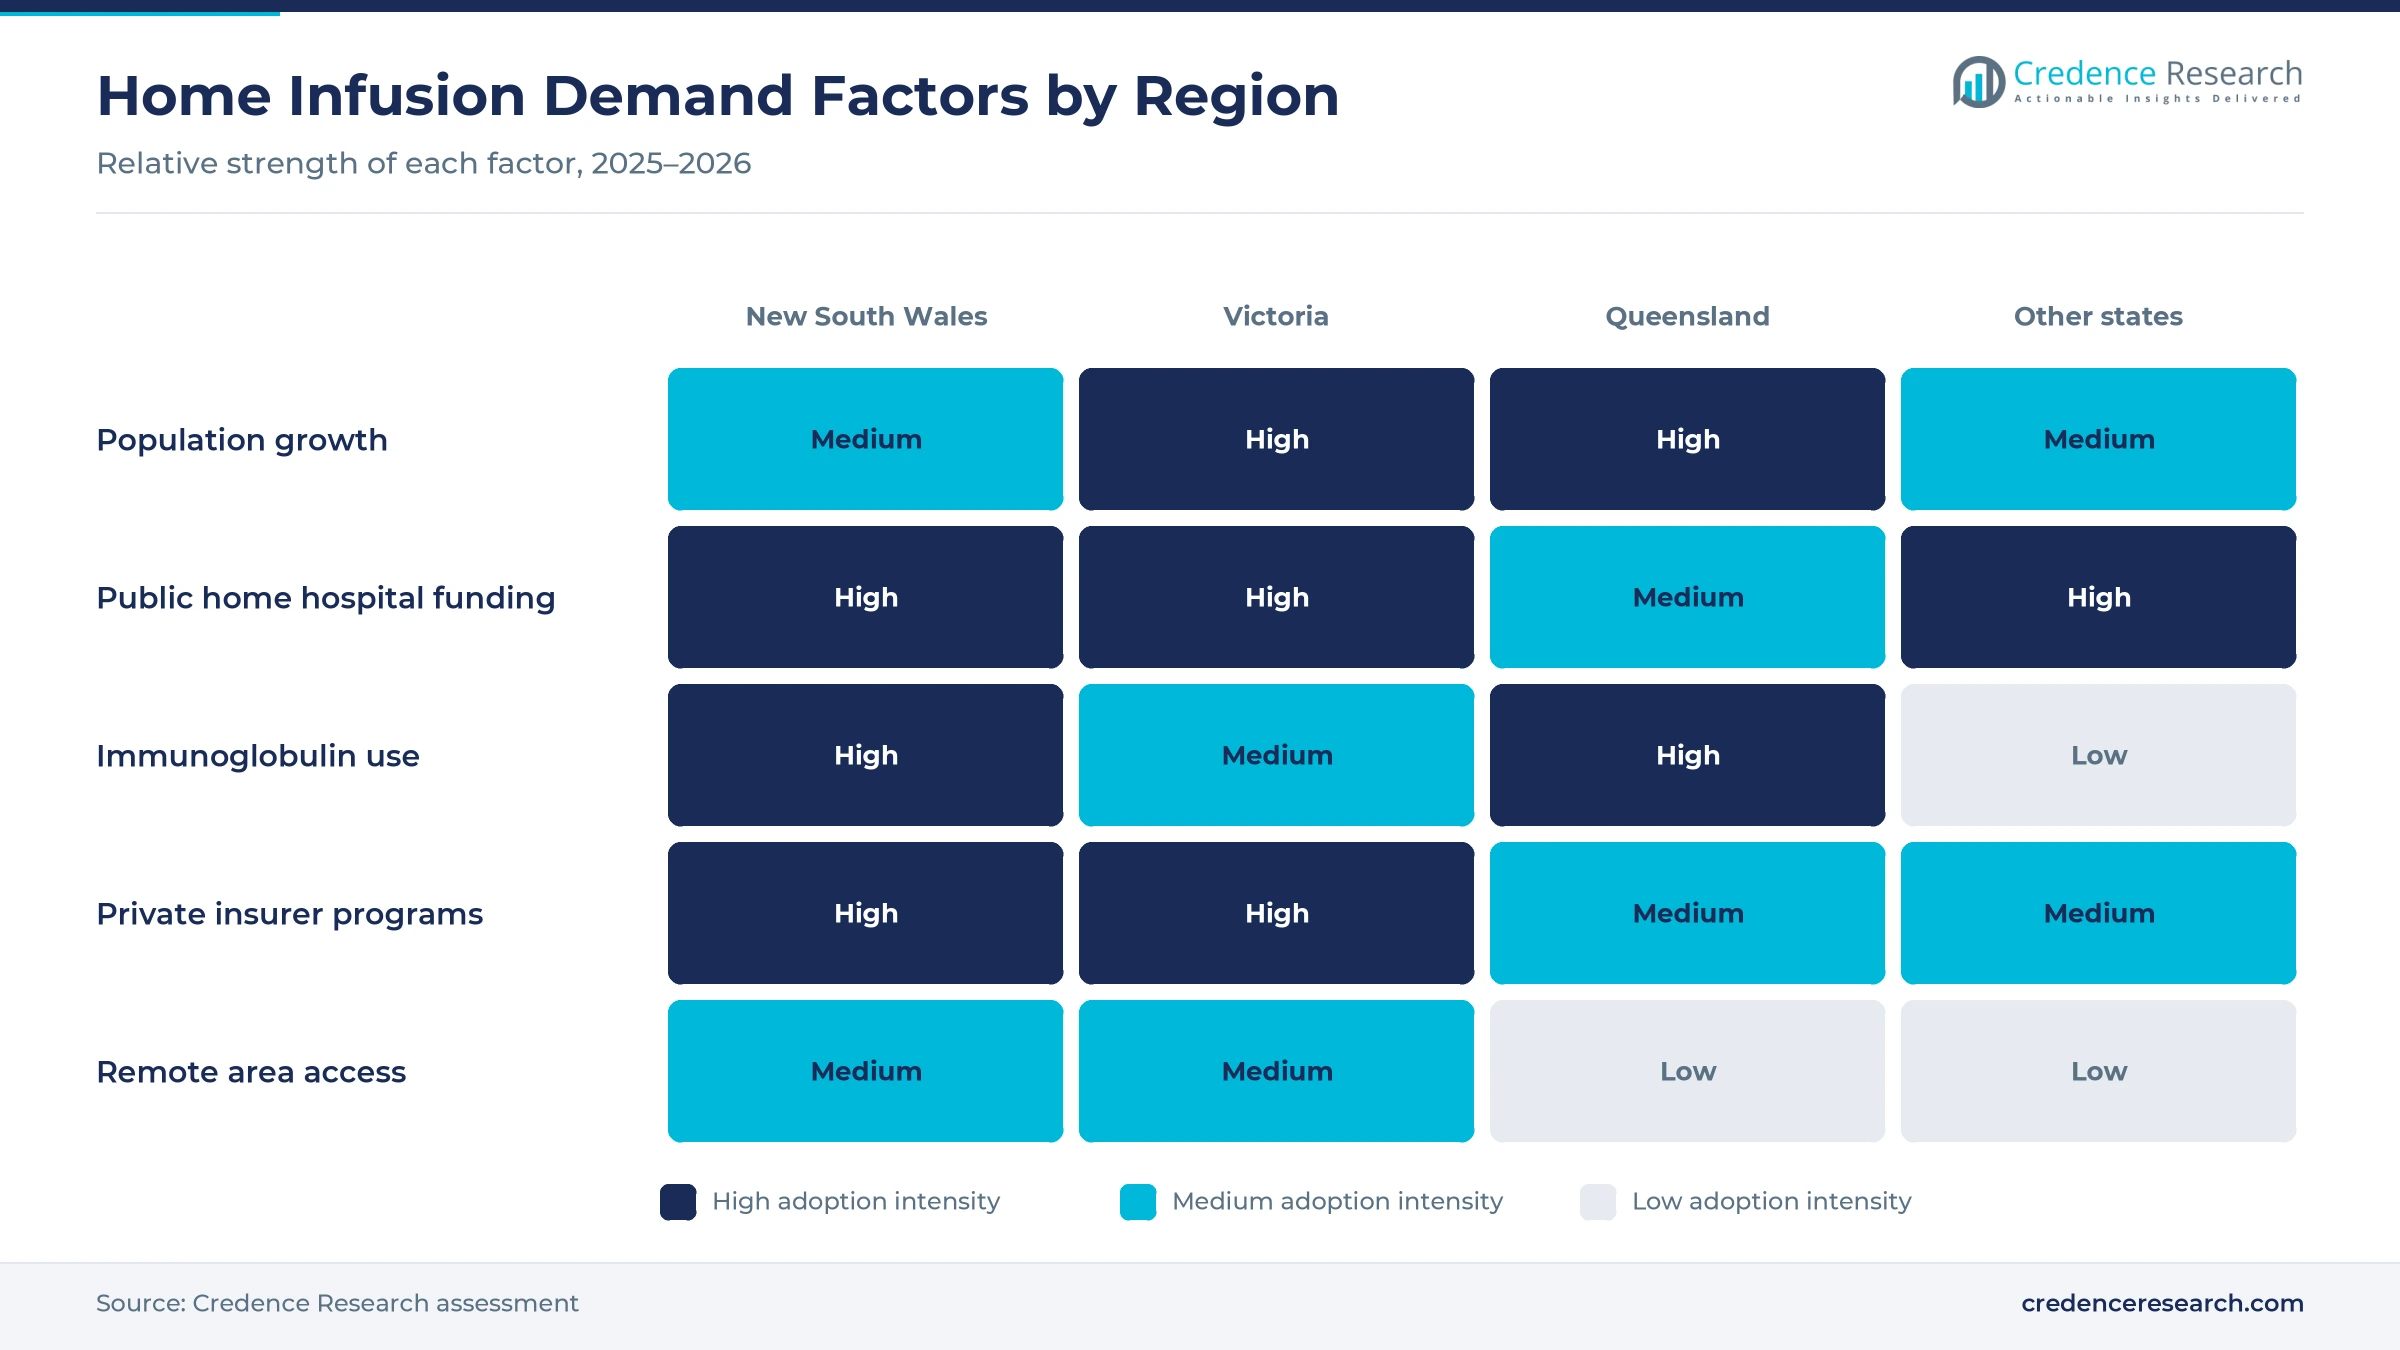
Patients with immune deficiency or nerve disorders need infusions every few weeks for years, which gives providers a steady base of repeat courses. Australia issued 9.88 million grams of immunoglobulin in 2024–25, up 6.7% from the prior year, according to the National Blood Authority. The number of patients receiving the therapy rose 6.3% to 28,650, while spending reached A$705.3 million excluding plasma. Subcutaneous immunoglobulin accounted for 1.12 million grams dispensed to 3,398 patients, and much of this is given at home. Chronic inflammatory demyelinating polyneuropathy alone used 21.1% of grams dispensed. In turn, immune-mediated disorders grow fastest at 8.01% a year during 2026–2035.
How does coordinated home-care access widen referrals?
A single coordinated service can accept patients from hospitals, general practices and aged care homes, which widens the pool of people referred for home treatment. The South Australian Government signed a new three-year agreement with Amplar Health for My Home Hospital, announced on Jan. 19, 2026, according to Medibank. About 25,000 South Australians have been treated since launch, and admissions are up 38% since 2022. Nearly 3,500 patients came directly from general practitioners, aged care facilities or other community referrers. Insurers also coordinate access, as Australian Unity members can receive chemotherapy, immunotherapy and iron infusions at home through chemo@home. As a result, care coordination grows fastest at 7.71% a year during 2026–2035.
Why does an aging population raise infusion need?
Older adults face more serious infections, cancers and immune disorders that require intravenous treatment, so demographic change adds patients every year. People aged 65 and above made up 18.1% of the Australian population in 2025, up from 17.4% in 2023, according to World Bank data. Australia also reached 27.9 million people at March 31, 2026, after growing 1.4% in a year, according to the Australian Bureau of Statistics. Queensland added 90,100 residents over the same year, a growth rate of 1.6%. My Home Hospital has treated nearly 4,500 aged care residents, which shows how home services reach frail patients. In turn, Queensland gains patients faster than the other large states.
Subcutaneous drugs and insurer programs reshape care
How is the shift to subcutaneous medicines changing care?
Shorter injections under the skin let nurses treat more patients in a day or train patients to self-administer, which changes the economics of each home visit. Subcutaneous ocrelizumab for multiple sclerosis was registered in Australia on March 27, 2025, and its injection takes about 10 minutes against up to three hours for the drip. The federal government announced its subsidy listing in December 2025, according to MS Australia. The subsidy advisory committee also recommended subcutaneous nivolumab for cancer in March 2026, according to its public summary document. As a result, supported self-administration grows fastest at 7.93% a year during 2026–2035, because shorter therapies suit home delivery.
How does remote monitoring extend home hospital episodes?
Home hospital teams can now watch vital signs between nursing visits and act earlier, which supports longer and more complex episodes at home. NSW Health began rolling out wearable devices in Southern NSW in December 2025 that track breathing rate, blood pressure, oxygen levels and heart rate in real time. The same state has invested A$171.4 million in virtual care, which helped about 180,000 people avoid an emergency department trip. The October 2024 Hospital in the Home expansion also funds virtual care infrastructure to support the larger service. In Victoria, the Better at Home program had logged 2.5 million telehealth appointments by July 2022, according to the state government. In turn, care coordination gains value, because monitoring makes longer and sicker home episodes safer for patients and clinicians.
Can insurer-funded home oncology open new demand?
Private patients often prefer treatment at home to travel to a day chemotherapy unit, and insurers now fund that choice for eligible members. Cancer was the costliest disease group in Australia in 2023–24, with A$19.7 billion of spending, according to the Australian Institute of Health and Welfare. HCF began offering chemo@home to members with chemotherapy cover at no out-of-pocket cost, extending the Perth-based provider from Western Australia, South Australia and Victoria to New South Wales. St John of God Healthcare at Home also delivers chemotherapy and immunotherapy across metropolitan Perth. As a result, private health insurers grow fastest among customer types at 7.77% a year.
Is there room to grow in home parenteral nutrition?
Patients with intestinal failure need complex daily infusions that hospitals struggle to fund, which leaves space for specialist providers. About 300 to 400 people in Australia need parenteral nutrition at home for intestinal failure, according to a 2023 submission by the Australasian Society for Parenteral and Enteral Nutrition. Formulas and ancillaries alone can exceed A$150,000 per patient a year, while the national price for self-administered home nutrition fell to about A$77,293 a year. Fresenius Kabi makes customized nutrition bags for hospital and home use at compounding centers licensed by the regulator. In turn, providers that pair compounding with nursing can win long contracts.
Nursing supply, funding gaps and distance limit reach
Nursing shortages cap the number of home visits
Each home patient needs trained nurses for line care, pump checks and chemotherapy administration. As a result, providers in fast-growing suburbs and regional towns can run waiting lists even when referring hospitals want to discharge patients sooner. Operators respond with clinic-based visits, virtual reviews and patient training, which stretch each nurse across more patients. This pressure is strongest for chemotherapy, where nurses need specific certification before they can work alone.
Funding gaps slow complex home therapies
National prices do not always cover the full cost of products, staff and complications for complex therapies at home. The parenteral nutrition society warned that hospitals providing home nutrition now operate at a loss after a price cut, which risks restricted access. In turn, services without dedicated funding may limit new patients or shift costs to families. Clinicians respond by lobbying for revised price weights and national service frameworks that match the real cost of care.
Distance restricts access outside major cities
Nurses outside major cities must often drive long routes to deliver short infusions to a single patient. As a result, many private programs list coverage by postcode, and patients in remote towns may still travel to hospital for each dose. Providers respond with longer-acting antibiotics, elastomeric devices and subcutaneous medicines that need fewer visits. This barrier explains why remote areas still rely on hospital wards for many courses that metropolitan patients receive at home.
Line infections and device errors raise clinical risk
Central lines and pumps at home are managed away from the constant supervision of a hospital ward and its staff. In turn, a blocked line or wrong flow rate can lead to readmission, delayed treatment or harm for the patient at home. Providers respond with strict line care protocols, pump checks and 24-hour clinical phone support. Hospitals also screen patients carefully, which keeps home programs safe but excludes some people who cannot manage devices.
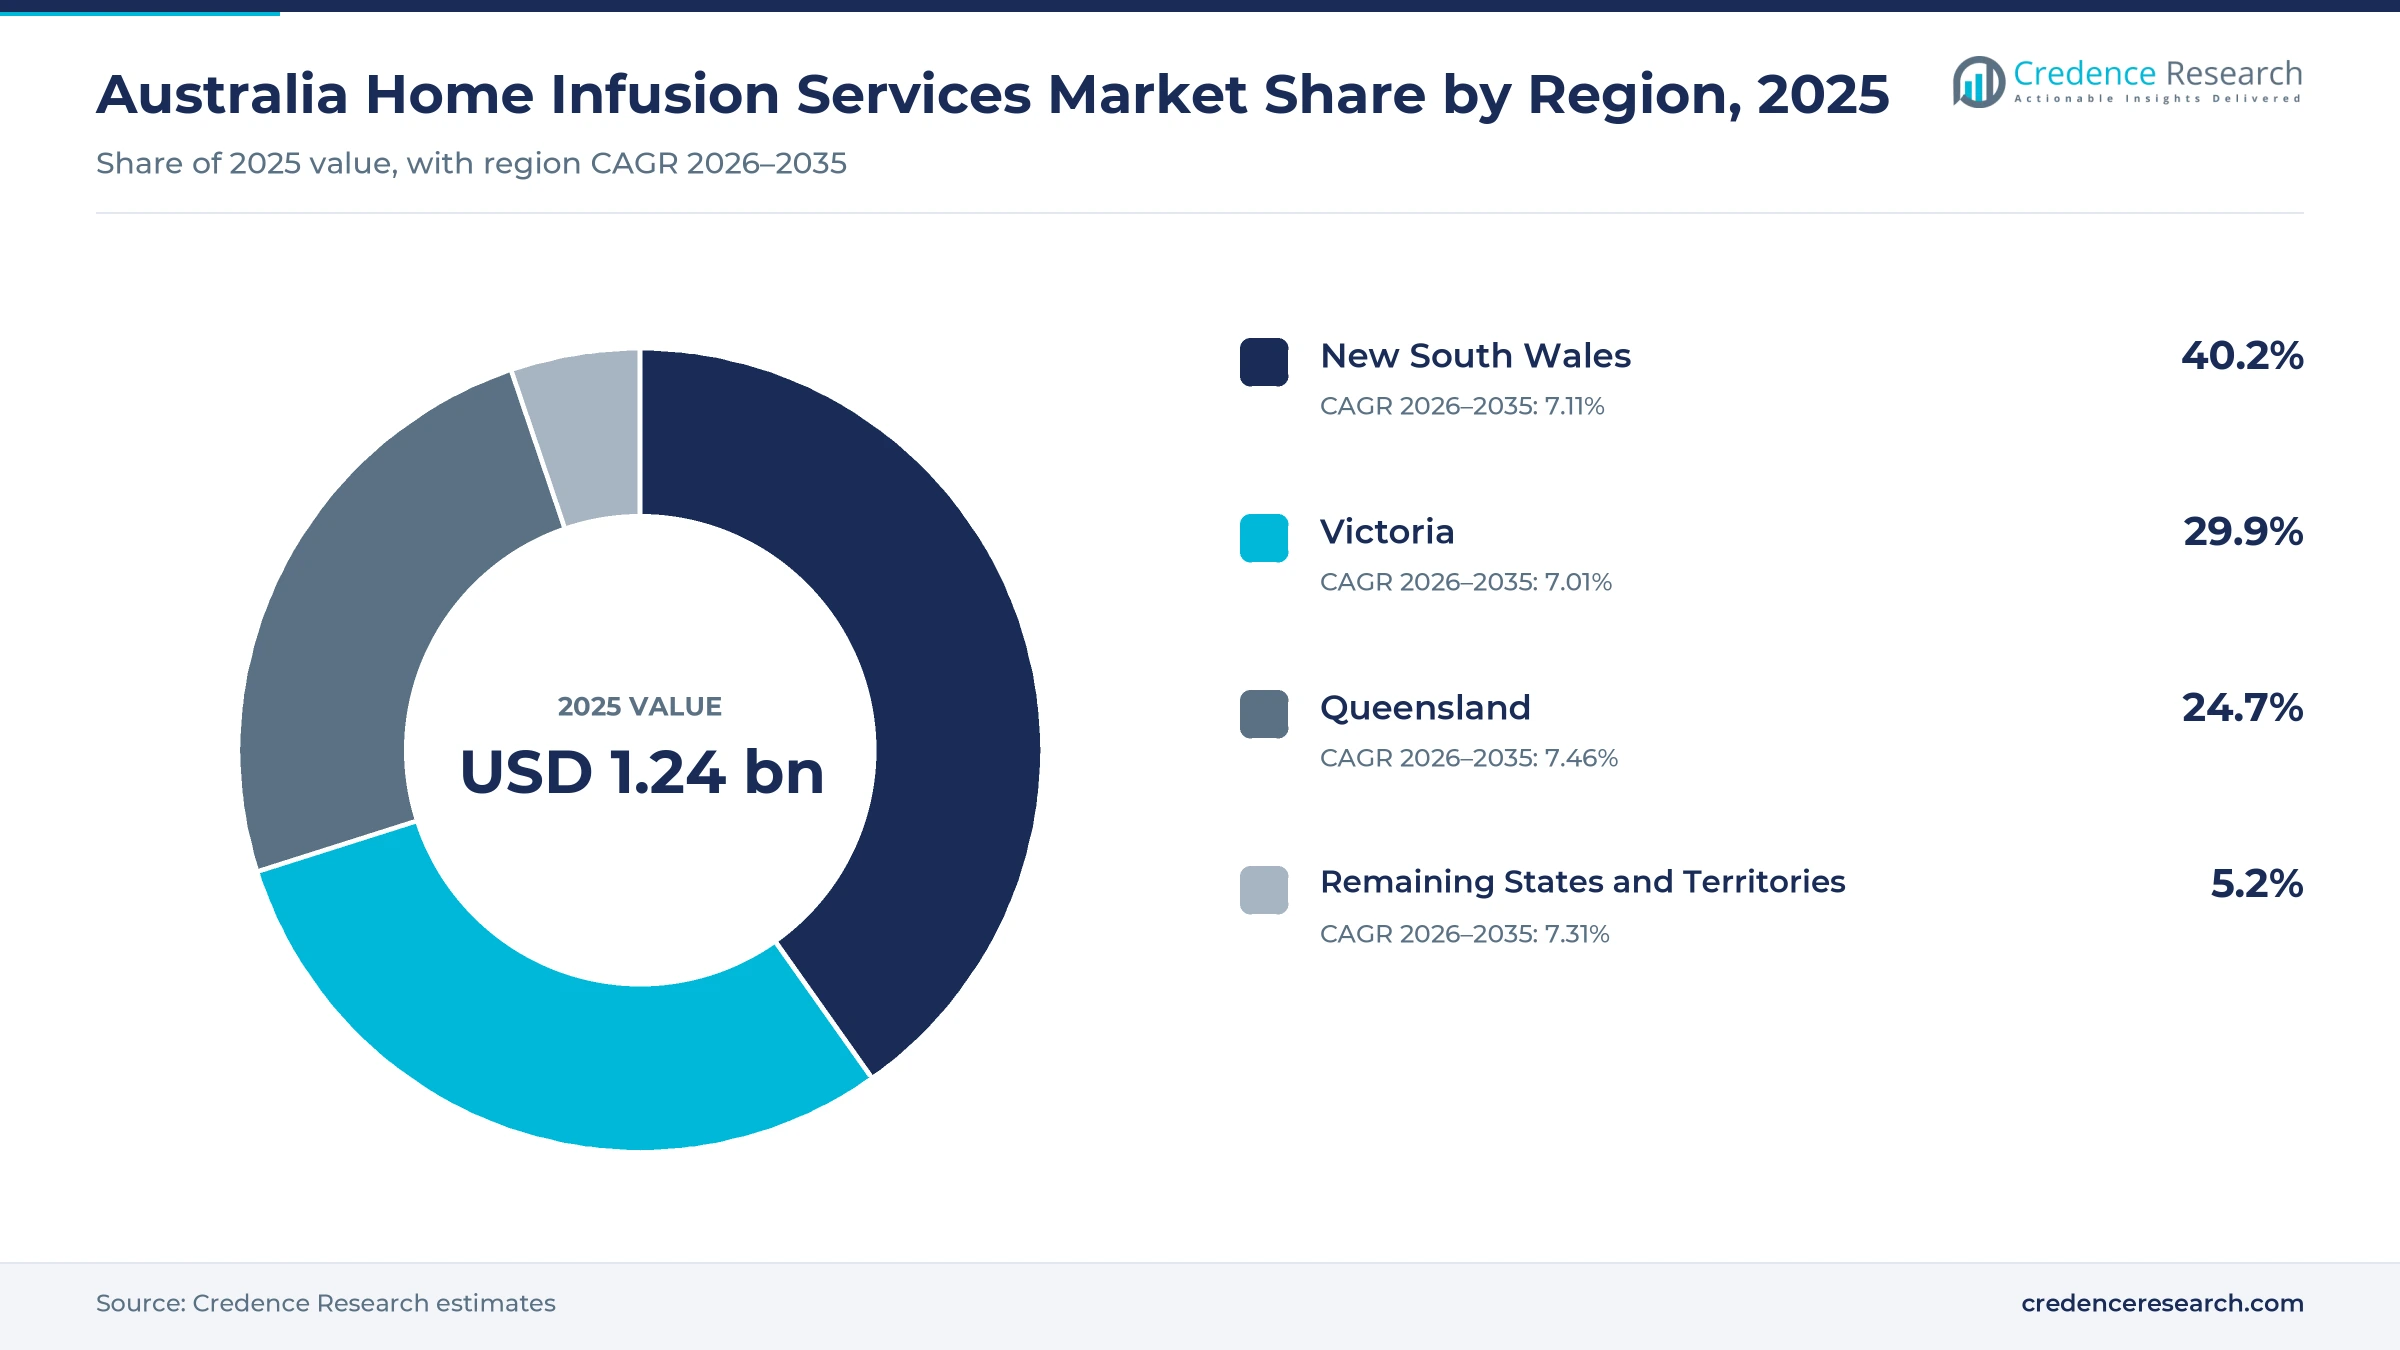
New South Wales leads while Queensland grows fastest
| Region | Value, 2025 (USD billion) | Share, 2025 | CAGR, 2026–2035 |
|---|---|---|---|
| New South Wales | 0.50 | 40.2% | 7.11% |
| Victoria | 0.37 | 29.9% | 7.01% |
| Queensland | 0.31 | 24.7% | 7.46% |
| Remaining States and Territories | 0.06 | 5.2% | 7.31% |
Why does New South Wales hold the largest share?
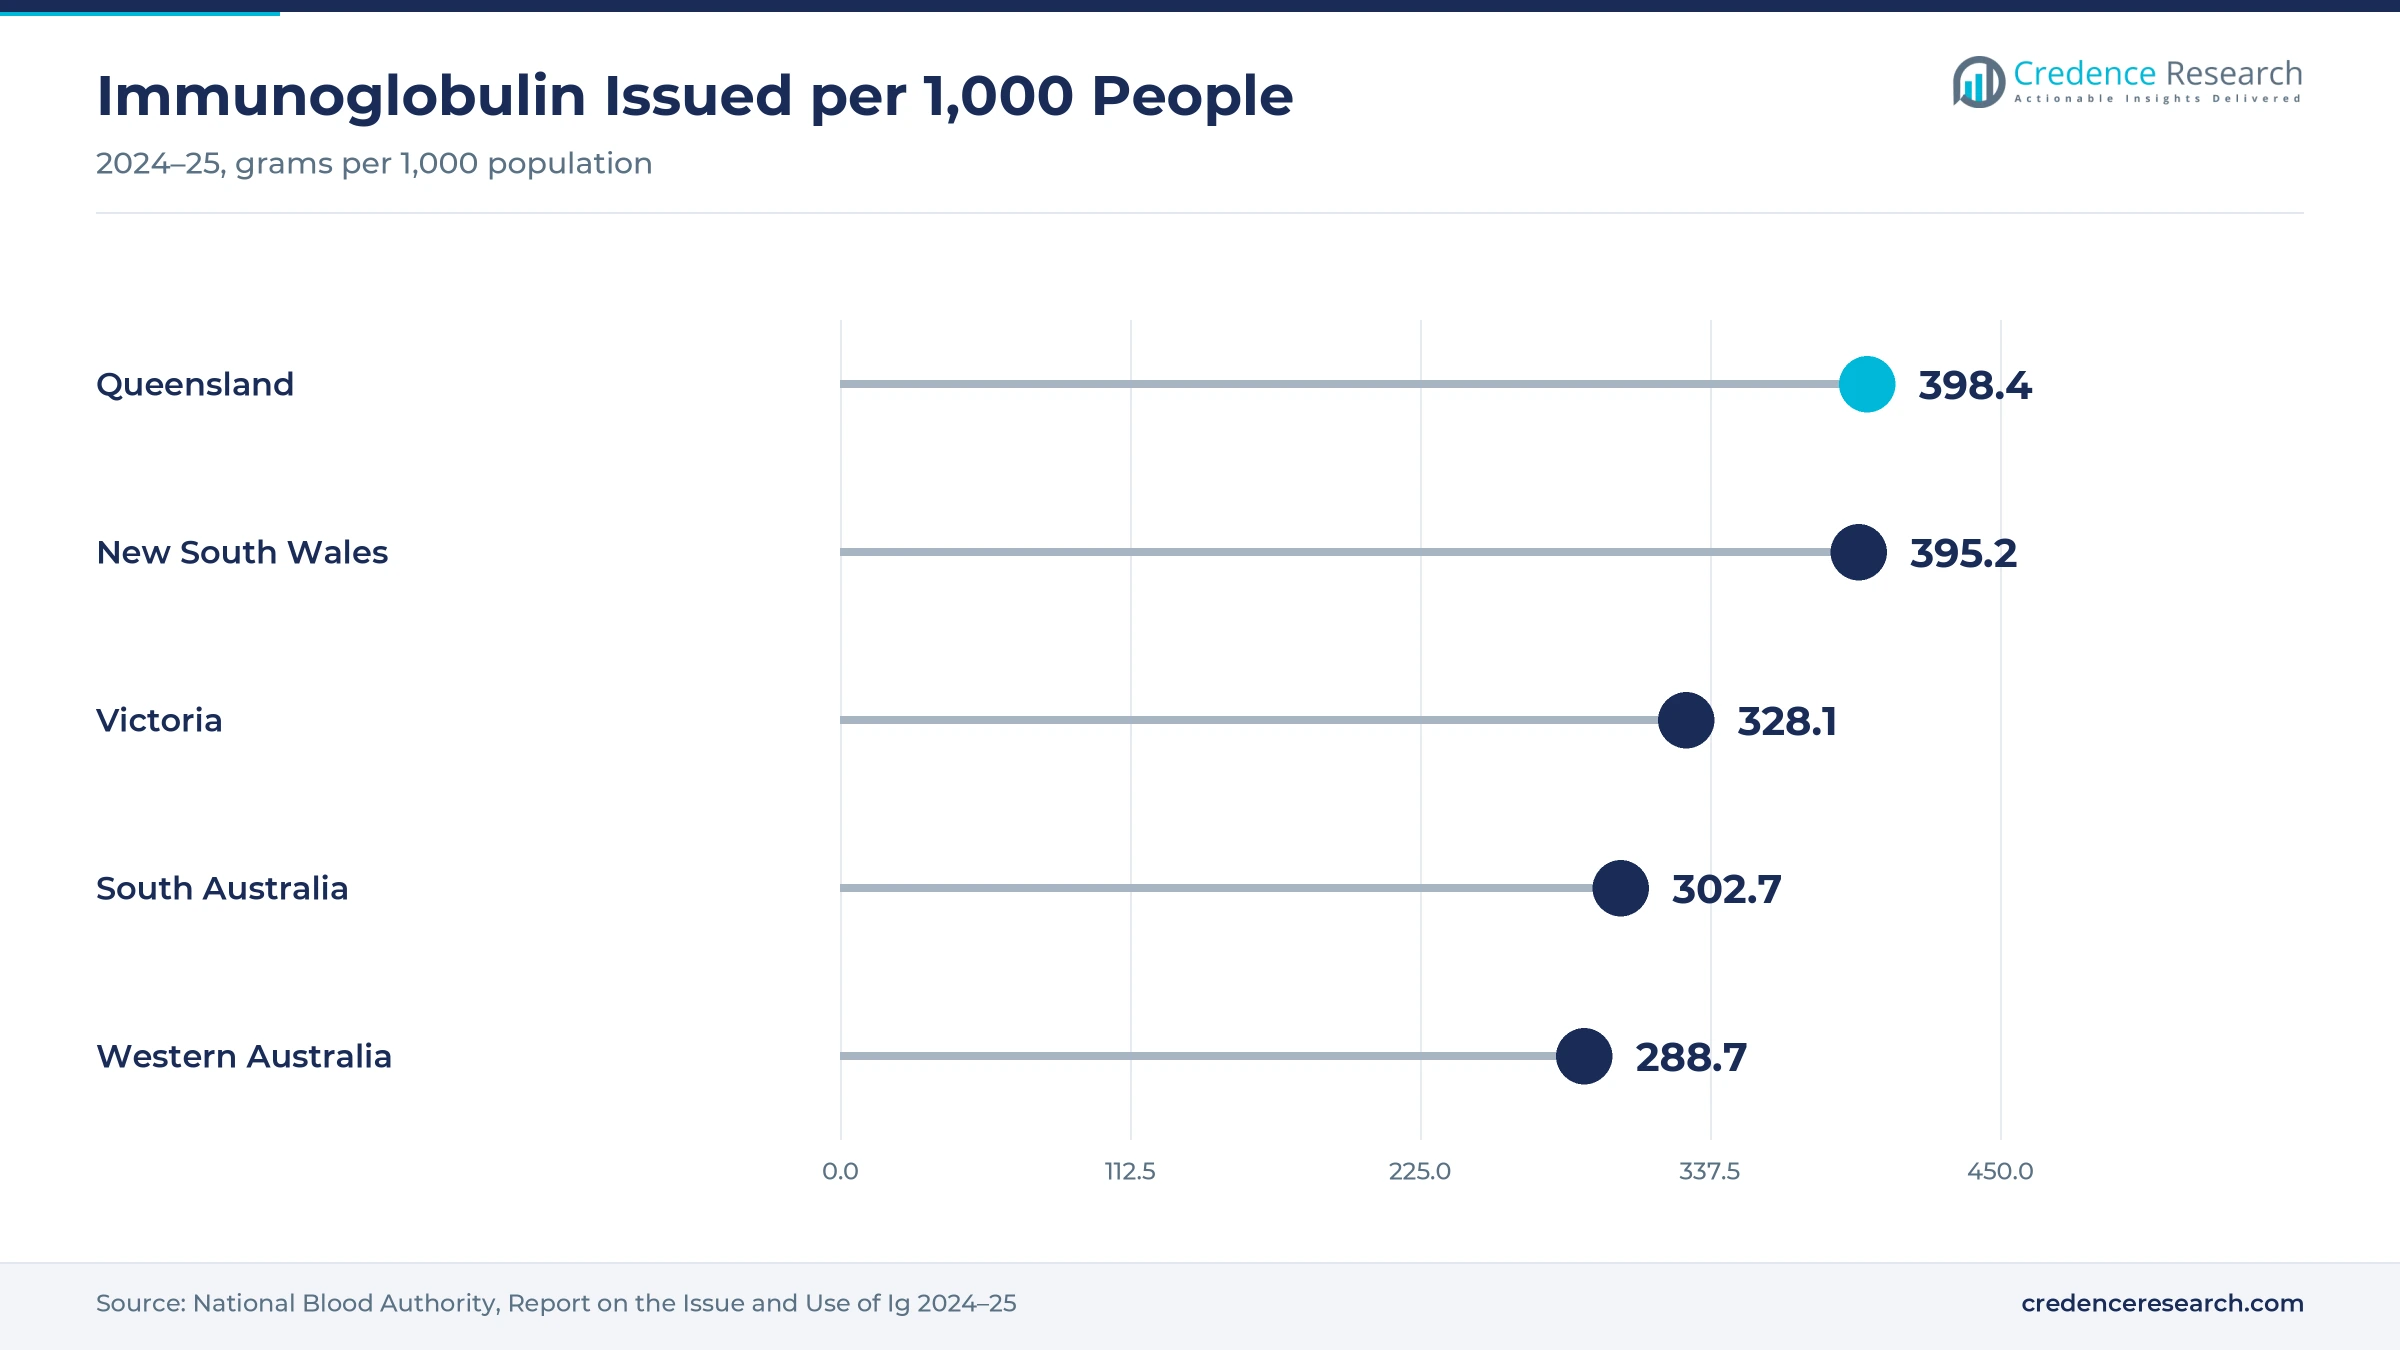
New South Wales held a 40.2% share of 2025 value and grows at 7.11% a year, because the state had about 8.67 million residents at March 31, 2026. Its A$31.4 million Hospital in the Home expansion includes Liverpool and Campbelltown, two of the busiest hospitals in the country. The state also issued 395.2 grams of immunoglobulin per 1,000 people in 2024–25. As a result, New South Wales combines the largest public program with a broad private insurer base.
How does Victoria support home infusion demand?
Victoria held a 29.9% share of 2025 value and grows at 7.01% a year, because the state added 109,500 residents in the year to March 2026. The Victorian Government committed A$698 million to its Better at Home program in May 2022, so that an additional 15,000 Victorians a year could receive care at home. chemo@home also operated in Victoria before HCF extended the service to New South Wales. In turn, Victoria pairs a large public program with an established private home oncology channel.
Why is Queensland growing fastest?
Queensland held a 24.7% share of 2025 value and grows fastest at 7.46% a year, because the state added 90,100 residents in the year to March 2026, a growth rate of 1.6%. Queensland also issued 398.4 grams of immunoglobulin per 1,000 people in 2024–25, the highest rate among the large states. The state had about 5.74 million residents at March 31, 2026, the third-largest population in the country. As a result, population growth and heavy immune therapy use lift demand faster here than elsewhere.
What supports demand in the remaining states and territories?
The remaining states and territories held a 5.2% share of 2025 value and grow at 7.31% a year, because Western Australia grew 2.1% in the year to March 2026. Silverchain runs Hospital at the Home for Royal Perth Hospital, including intravenous antibiotics through PICC lines and infusor ports. South Australia renewed My Home Hospital with Amplar Health for three more years in January 2026. In turn, these smaller regions rely on a few large home hospital contracts.
Funding deals, approvals and contracts since 2024
| Development | Status and market relevance |
|---|---|
| In October 2024, the New South Wales Government committed A$31.4 million to expand Hospital in the Home by 3,500 patients a year. | Adds public home hospital capacity in the largest region |
| In March 2025, subcutaneous ocrelizumab for multiple sclerosis was registered in Australia as a 10-minute injection. | Moves a long infusion toward short home or clinic visits |
| In December 2025, NSW Health began rolling out wearable remote monitoring for Hospital in the Home in Southern NSW. | Supports safer home episodes in regional areas |
| In January 2026, South Australia signed a new three-year My Home Hospital agreement with Amplar Health. | Extends the largest home hospital service for three more years |
| In March 2026, the subsidy advisory committee recommended subcutaneous nivolumab for existing intravenous indications. | Opens shorter cancer immunotherapy that suits home delivery |
Pumps and subcutaneous systems set the care model
- Intravenous elastomeric systems deliver antibiotics at a set flow rate without power, which lets patients receive 24-hour courses through elastomeric pumps with one daily nurse visit.
- Intravenous electronic pumps program dose, rate and alarms for chemotherapy, nutrition and complex antibiotics, which suits therapies that need exact timing.
- Intravenous gravity sets remain the low-cost option for hydration and short infusions given while a nurse stays in the home.
- Subcutaneous delivery systems give immunoglobulin and newer biologics under the skin, which lets trained patients treat themselves between nurse reviews.
Need a Custom Version of This Report?
Tailor the scope, geography, or segments to your exact requirements.
- Custom geography or segment scope
- Direct access to our analyst team
Home hospital operators and insurer partners compete
Competition combines state-funded home hospital operators, insurer-backed nursing providers and suppliers of medicines and compounding. Amplar Health, part of Medibank, runs My Home Hospital for the South Australian Government and signed a new three-year agreement in January 2026. Silverchain delivers Hospital at the Home for Royal Perth Hospital, including intravenous antibiotics and rehydration. chemo@home partners with insurers such as HCF and Australian Unity to give chemotherapy, immunotherapy and other infusions at home. St John of God Healthcare at Home serves metropolitan Perth with chemotherapy and non-cancer infusions. Fresenius Kabi Australia compounds parenteral nutrition for hospital and home use at regulator-licensed centers. Providers compete on referral relationships, nurse coverage by postcode, clinical governance and the ability to win multiyear public contracts.
Which providers deliver home infusion at scale?
| Company | Type | Role in the market |
|---|---|---|
| Amplar Health | Home hospital operator | Runs My Home Hospital for South Australia under a new three-year deal |
| Silverchain | Home hospital operator | Delivers Hospital at the Home with IV antibiotics in Perth |
| chemo@home | Home infusion nursing provider | Partners with HCF and Australian Unity for home cancer care |
| St John of God Healthcare at Home | Home infusion nursing provider | Gives chemotherapy and IV therapy across Perth |
| Fresenius Kabi Australia | Medicines and compounding supplier | Compounds parenteral nutrition for hospital and home use |
States fund home beds as immune therapy keeps expanding
Credence Research's view is that Australian home infusion services will grow faster than hospital care overall, because states are funding home hospital capacity instead of new beds and immune therapies keep expanding. Infections remain the largest disease area, while immune-mediated disorders grow fastest as immunoglobulin and subcutaneous biologics rise. Insurer programs are widening private access to home cancer care. Providers that combine reliable nurse coverage, remote monitoring and compounding partnerships should win the most multiyear contracts by 2035, while Queensland offers the fastest regional growth.
Blood product, program and population data shape sizing
The report uses 2025 as the base year on a calendar basis, and market values come from the Credence Research model. That model combines official population statistics, national hospital and blood product data, state program releases, subsidy committee documents and provider releases. Segment splits and region growth rates are Credence Research estimates, while region shares follow the client's regional split. Sources used are official statistics, government releases, regulator data and company releases, and no interviews or surveys were used.
Home hospital growth and biologics carry demand to 2035
The Australia home infusion services market is expected to reach USD 2.49 billion by 2035, a 7.18% CAGR during 2026–2035, as states expand home hospital programs and immune therapies keep growing. Growth should be strongest in care coordination, supported self-administration and Queensland, because these areas gain most from monitoring, subcutaneous medicines and population growth. Nursing shortages, funding gaps and distance could slow some services, while insurer programs and longer public contracts should keep provider capacity rising through the decade.
Frequently Asked Questions
How big is the Australia home infusion services market?
Which service type leads home infusion value?
Which region leads the market?
How much immunoglobulin does Australia use?
How is New South Wales expanding Hospital in the Home?
Why do subcutaneous medicines matter for home infusion?
Who are the leading home infusion providers in Australia?
What are the main challenges for home infusion providers?
Table of Content
Chapter 1 Market Segmentation
- 1.1 Segmentation Framework
- 1.1.1 Product and Service Classification
- 1.1.2 Application and End-Use Classification
- 1.1.3 Technology and Solution Classification
- 1.1.4 Customer and Distribution Channel Classification
- 1.1.5 Geographic Segmentation
- 1.1.6 Market Segment Definitions and Boundaries
- 1.2 By Service Type
- 1.2.1 Medicines Supply
- 1.2.2 Infusion Nursing
- 1.2.3 Care Coordination
- 1.2.4 Equipment Support
- 1.3 By Disease Area
- 1.3.1 Infections
- 1.3.2 Immune-Mediated Disorders
- 1.3.3 Cancer
- 1.3.4 Nutrition and Supportive Conditions
- 1.4 By Care Setting
- 1.4.1 Hospital Admission at Home
- 1.4.2 Community Specialist Home Care
- 1.4.3 Supported Self-Administration
- 1.4.4 Palliative Home Care
- 1.5 By Customer Type
- 1.5.1 Public Health Systems
- 1.5.2 Private Health Insurers
- 1.5.3 Direct-Pay Households
- 1.5.4 Sponsored Access Programs
Chapter 2 Introduction
- 2.1 Report Objectives and Scope
- 2.2 Product Definition and Industry Terminology
- 2.3 Market Inclusions and Exclusions
- 2.4 Research Process
- 2.4.1 Primary Research and Expert Interviews
- 2.4.2 Secondary Research and Source Review
- 2.4.3 Top-Down and Bottom-Up Estimation
- 2.4.4 Data Triangulation and Verification
- 2.5 Market Size Measurement Basis
- 2.5.1 2025: USD 1.24 billion → 2035: USD 2.49 billion
- 2.6 Historical and Forecast Reference Periods
- 2.6.1 Historical Period: 2018-2025
- 2.6.2 Base Year: 2025
- 2.6.3 Forecast Period: 2025-2035
- 2.7 Research Assumptions and Limitations
Chapter 3 Executive Summary
- 3.1 Market Snapshot and Key Findings
- 3.2 Base-Year Market Size, 2025
- 3.3 Forecast Market Size, 2035
- 3.4 Revenue and Volume Growth Outlook
- 3.5 Key Demand and Supply Indicators
- 3.6 Leading Market Segments
- 3.7 Fastest-Growing Market Opportunities
- 3.8 Regional Performance Highlights
- 3.9 Technology and Industry Transformation
- 3.10 Competitive Landscape Summary
- 3.11 Analyst View and Strategic Implications
Chapter 4 Australia Home Infusion Services Market Trends and Developments
- 4.1 Historical Industry Development, 2018-2025
- 4.2 Recent Market Trends and Developments
- 4.3 Demand and Customer Behavior Trends
- 4.4 Technology and Product Innovation
- 4.5 Artificial Intelligence, Automation and Digitalization
- 4.6 Local Manufacturing and Supply Chain Realignment
- 4.7 Industry Partnerships, Mergers and Acquisitions
- 4.8 Sustainability and Circular Economy Developments
- 4.9 Government and Private Sector Investment Trends
- 4.10 Emerging Business Models and Commercialization
- 4.11 Industry Developments and Announcements
Chapter 5 Australia Home Infusion Services Market Supply and Demand Analysis
- 5.1 Demand Trend and Consumption Analysis, 2018-2025
- 5.2 Demand Forecast, 2025-2035
- 5.3 Supply Chain Structure and Procurement Trends
- 5.4 Supply-Demand Gap and Bottlenecks
- 5.5 Import Dependence and Sourcing Structure
- 5.6 Regional Supply and Demand Concentration
Chapter 6 Australia Home Infusion Services Market Pricing Analysis
- 6.1 Pricing Structure and Measurement
- 6.2 Historical Pricing Trends, 2018-2025
- 6.3 Pricing Outlook, 2025-2035
- 6.4 Pricing by Product and Market Segment
- 6.5 Geographic Pricing Differences
- 6.6 Key Input, Energy, Labor and Logistics Costs
- 6.7 Contract Pricing and Purchasing Models
- 6.8 Pricing Sensitivity and Competitive Positioning
- 6.9 Price, Margin and Profitability Implications
Chapter 7 Australia Home Infusion Services Market Dynamics
- 7.1 Market Growth Drivers
- 7.1.1 Demand-Side Drivers
- 7.1.2 Technology and Innovation Drivers
- 7.1.3 Infrastructure and Investment Drivers
- 7.1.4 Regulatory and Policy Drivers
- 7.2 Market Restraints
- 7.2.1 Cost and Affordability Constraints
- 7.2.2 Technology and Adoption Barriers
- 7.2.3 Supply Chain and Operational Constraints
- 7.3 Market Challenges
- 7.3.1 Competitive Pressure and Margin Erosion
- 7.3.2 Skills, Infrastructure and Implementation Gaps
- 7.4 Emerging Market Opportunities
- 7.5 Market Dynamics Impact and Time-Horizon Assessment
Chapter 8 Australia Home Infusion Services Value Chain Analysis
- 8.1 Industry Value Chain Overview
- 8.2 Upstream Suppliers and Critical Inputs
- 8.3 Technology and Component Providers
- 8.4 Manufacturing or Service Delivery
- 8.5 Distribution, Channel Partners and Integrators
- 8.6 Downstream Applications and End Users
- 8.7 Value Addition and Profit Pools
- 8.8 Vertical Integration and Outsourcing
- 8.9 Supplier Concentration and Risk
- 8.10 Supply Chain Localization and Resilience
Chapter 9 Australia Home Infusion Services Market Regulations and Policies
- 9.1 Relevant Laws, Standards and Compliance Frameworks
- 9.2 Product, Service, Safety and Quality Requirements
- 9.3 Government Policies, Incentives and Subsidies
- 9.4 Imports, Exports and Trade Barriers
- 9.5 Public Procurement and Local Content Requirements
- 9.6 Data Protection, AI and Cybersecurity Compliance
- 9.7 Upcoming Policy Changes and Market Implications
Chapter 10 Australia Home Infusion Services Market Hotspots and Opportunities
- 10.1 Market Opportunity Mapping and Growth Hotspots
- 10.2 High-Growth Applications and Customer Groups
- 10.3 Underserved Markets and White-Space Opportunities
- 10.4 Emerging Technology and Product Opportunities
- 10.5 New Capacity and Investment Hotspots
- 10.6 Market Entry and Expansion Opportunities
- 10.7 Distribution and Partnership Opportunities
- 10.8 Near-Term and Long-Term Commercial Potential
- 10.9 Opportunity Attractiveness and Execution Risks
Chapter 11 Australia Home Infusion Services Market Outlook, 2025-2035
- 11.1 Market Size and Analysis
- 11.1.1 Revenue (Market Measurement: 2025: USD 1.24 billion → 2035: USD 2.49 billion)
- 11.1.2 Historical Market Size, 2018-2025
- 11.1.3 Base-Year Market Size, 2025
- 11.2 Market Forecast, 2025-2035
- 11.2.1 Revenue Forecast to 2035
- 11.2.2 CAGR and Year-on-Year Growth
- 11.2.3 Incremental Revenue Opportunity
- 11.3 Forecast Assumptions and Scenario Analysis
- 11.3.1 Base-Case Forecast
- 11.3.2 Optimistic and Conservative Scenarios
- 11.3.3 Technology, Pricing and Policy Sensitivities
- 11.4 Market Attractiveness and Growth Outlook
Chapter 12 Australia Home Infusion Services Market Segmentation and Outlook
- 12.1 Segmentation Summary and Market Shares, 2025
- 12.2 Largest and Fastest-Growing Segments
- 12.3 By Service Type - Market Size and Forecast, 2025-2035
- 12.3.1 Segment Definition and Scope
- 12.3.2 Historical Market Size, 2018-2025
- 12.3.3 Revenue Forecast, 2025-2035
- 12.3.4 Base-Year Market Share, 2025
- 12.3.5 Segment CAGR and Growth Drivers
- 12.3.6 Subsegment Market Size and Forecast
- 12.3.6.1 Medicines Supply
- 12.3.6.2 Infusion Nursing
- 12.3.6.3 Care Coordination
- 12.3.6.4 Equipment Support
- 12.3.7 Subsegment Pricing and Adoption Trends
- 12.3.8 Leading Suppliers and Competition
- 12.3.9 Regional Demand and Opportunities
- 12.4 By Disease Area - Market Size and Forecast, 2025-2035
- 12.4.1 Segment Definition and Scope
- 12.4.2 Historical Market Size, 2018-2025
- 12.4.3 Revenue Forecast, 2025-2035
- 12.4.4 Base-Year Market Share, 2025
- 12.4.5 Segment CAGR and Growth Drivers
- 12.4.6 Subsegment Market Size and Forecast
- 12.4.6.1 Infections
- 12.4.6.2 Immune-Mediated Disorders
- 12.4.6.3 Cancer
- 12.4.6.4 Nutrition and Supportive Conditions
- 12.4.7 Subsegment Pricing and Adoption Trends
- 12.4.8 Leading Suppliers and Competition
- 12.4.9 Regional Demand and Opportunities
- 12.5 By Care Setting - Market Size and Forecast, 2025-2035
- 12.5.1 Segment Definition and Scope
- 12.5.2 Historical Market Size, 2018-2025
- 12.5.3 Revenue Forecast, 2025-2035
- 12.5.4 Base-Year Market Share, 2025
- 12.5.5 Segment CAGR and Growth Drivers
- 12.5.6 Subsegment Market Size and Forecast
- 12.5.6.1 Hospital Admission at Home
- 12.5.6.2 Community Specialist Home Care
- 12.5.6.3 Supported Self-Administration
- 12.5.6.4 Palliative Home Care
- 12.5.7 Subsegment Pricing and Adoption Trends
- 12.5.8 Leading Suppliers and Competition
- 12.5.9 Regional Demand and Opportunities
- 12.6 By Customer Type - Market Size and Forecast, 2025-2035
- 12.6.1 Segment Definition and Scope
- 12.6.2 Historical Market Size, 2018-2025
- 12.6.3 Revenue Forecast, 2025-2035
- 12.6.4 Base-Year Market Share, 2025
- 12.6.5 Segment CAGR and Growth Drivers
- 12.6.6 Subsegment Market Size and Forecast
- 12.6.6.1 Public Health Systems
- 12.6.6.2 Private Health Insurers
- 12.6.6.3 Direct-Pay Households
- 12.6.6.4 Sponsored Access Programs
- 12.6.7 Subsegment Pricing and Adoption Trends
- 12.6.8 Leading Suppliers and Competition
- 12.6.9 Regional Demand and Opportunities
- 12.7 Segment Growth Comparison
- 12.8 Segment Attractiveness and Priority Matrix
Chapter 13 Australia Home Infusion Services End-Use and Application Market Outlook
- 13.1 End-Use Industry and Customer Demand Structure
- 13.2 Leading Applications and Customer Groups
- 13.3 End-Use Market Size, Share and Forecast
- 13.4 Major End-Use Industry Deep Dives
- 13.4.1 Customer Requirements and Use Cases
- 13.4.2 Demand and Replacement Cycles
- 13.4.3 Technical and Regulatory Considerations
- 13.4.4 Purchasing and Procurement Models
- 13.4.5 Leading Vendors and Distribution Channels
- 13.4.6 Forecast and Commercial Opportunities
- 13.5 Emerging Applications and Cross-Segment Demand
- 13.6 End-Use Industry Investment Priorities
Chapter 14 Australia Home Infusion Services Geographic Market Outlook, 2025-2035
- 14.1 Domestic Market Distribution and Demand Clusters
- 14.2 State- or Province-Wise Market Size and Forecast, 2025-2035
- 14.3 City and Metropolitan Market Outlook
- 14.4 Industrial, Manufacturing and Commercial Clusters
- 14.5 Geographic Concentration of Key End Users
- 14.6 Local Pricing and Purchasing Differences
- 14.7 Domestic Production Facilities and Capacity Map
- 14.8 Local Infrastructure and Project Pipeline
- 14.9 State-Level Policy and Incentive Differences
- 14.10 Subnational Investment Hotspots and Opportunities
- 14.11 Distribution and Logistics Networks
- 14.12 Domestic Competitive Footprint
Chapter 15 Australia Home Infusion Services Technology, Innovation and Sustainability Outlook
- 15.1 Technology Landscape and Maturity
- 15.2 Product, Process and Service Innovation
- 15.3 AI, Automation and Digital Tools in the Industry
- 15.4 Technology Adoption and Performance Benchmarking
- 15.5 Innovation Pipeline and R&D Investment
- 15.6 Energy Efficiency and Resource Management
- 15.7 Sustainability, Recycling and Circularity
- 15.8 Technology Roadmap, 2025-2035
- 15.9 Risks of Obsolescence and Technology Substitution
Chapter 16 Australia Home Infusion Services Market Key Strategic Imperatives
- 16.1 Growth and Market Entry Priorities
- 16.2 High-Return Products and Segments
- 16.3 Pricing, Profitability and Cost Optimization
- 16.4 Technology Investment and Product Differentiation
- 16.5 Supply Chain Localization and Resilience
- 16.6 Distribution and Customer Acquisition
- 16.7 Partnership, Acquisition and Capacity Strategy
- 16.8 Regional Expansion Priorities
- 16.9 Short-, Medium- and Long-Term Actions
Chapter 17 Competition Outlook
- 17.1 Industry Competition Characteristics
- 17.2 Market Structure and Concentration
- 17.3 Market Share and Competitive Positioning, 2025
- 17.4 Company-Wise Revenue and Product Benchmarking
- 17.5 Production and Service Capacity Benchmarking
- 17.6 Technology, Pricing and Differentiation
- 17.7 Regional Footprint and Distribution Strength
- 17.8 Mergers, Acquisitions and Strategic Alliances
- 17.9 New Entrants and Competitive Threats
- 17.10 Porter's Five Forces and Industry Attractiveness
- 17.11 Competitive Outlook, 2025-2035
Chapter 18 Company Profiles
- 18.1 Company Coverage and Selection Criteria
- 18.2 Baxter Healthcare
- 18.2.1 Business Description
- 18.2.2 Company Ownership and Geographic Presence
- 18.2.3 Product and Service Portfolio
- 18.2.4 Manufacturing and Operating Footprint
- 18.2.5 Financial Performance and Investment
- 18.2.6 Market Share and Competitive Position
- 18.2.7 Technology and Innovation Capabilities
- 18.2.8 Strategic Alliances or Partnerships
- 18.2.9 Recent Developments
- 18.2.10 Growth Strategy and Outlook
- 18.3 Fresenius Kabi Australia
- 18.4 Silverchain
- 18.5 Amplar Health
- 18.6 Ramsay Home Health
- 18.7 Nuevo Health
- 18.8 Kinship
- 18.9 View Health
- 18.10 chemo@home
- 18.11 St John of God Healthcare at Home
- 18.12 Other Relevant Market Participants
Note: Every listed company is profiled on the structure shown under the first company. The company list is preliminary and may change based on research findings, market developments, data availability and client requirements.
Chapter 19 Disclaimer
- 19.1 Research and Forecast Disclaimer
- 19.2 Data Source and Estimation Limitations
Note: The depth of individual sections depends on data availability for this market. Volume, capacity, trade and other unit-based metrics are included where applicable.

