
Asia-Pacific tempeh market rests on Indonesian daily meals
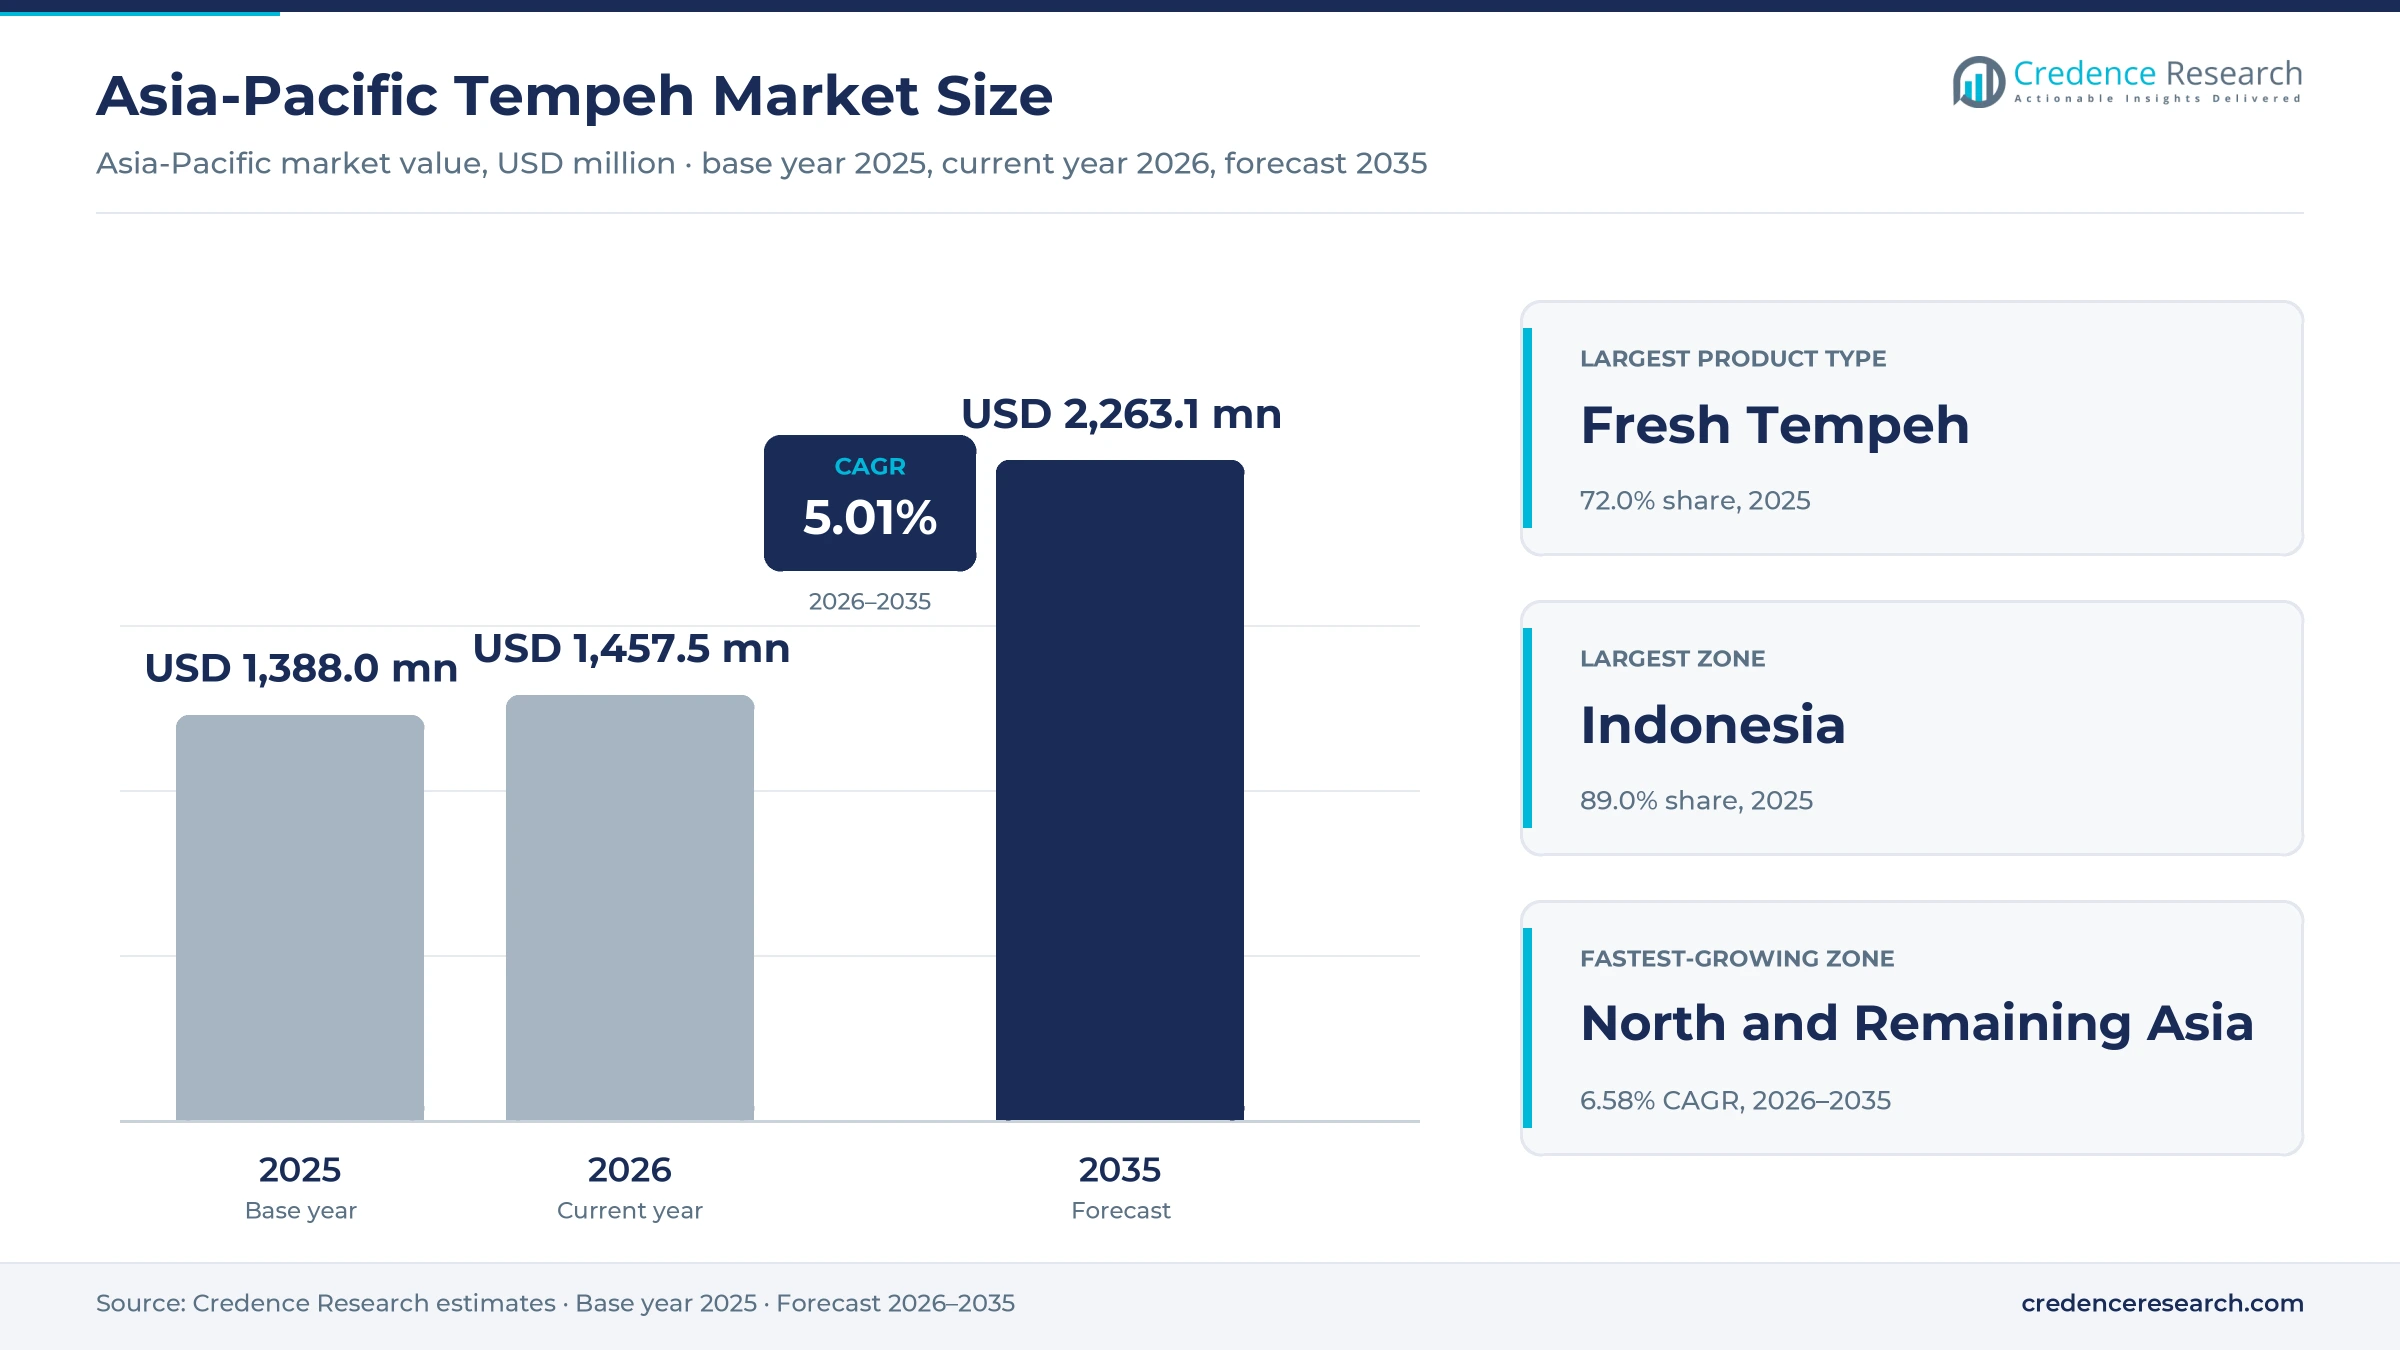
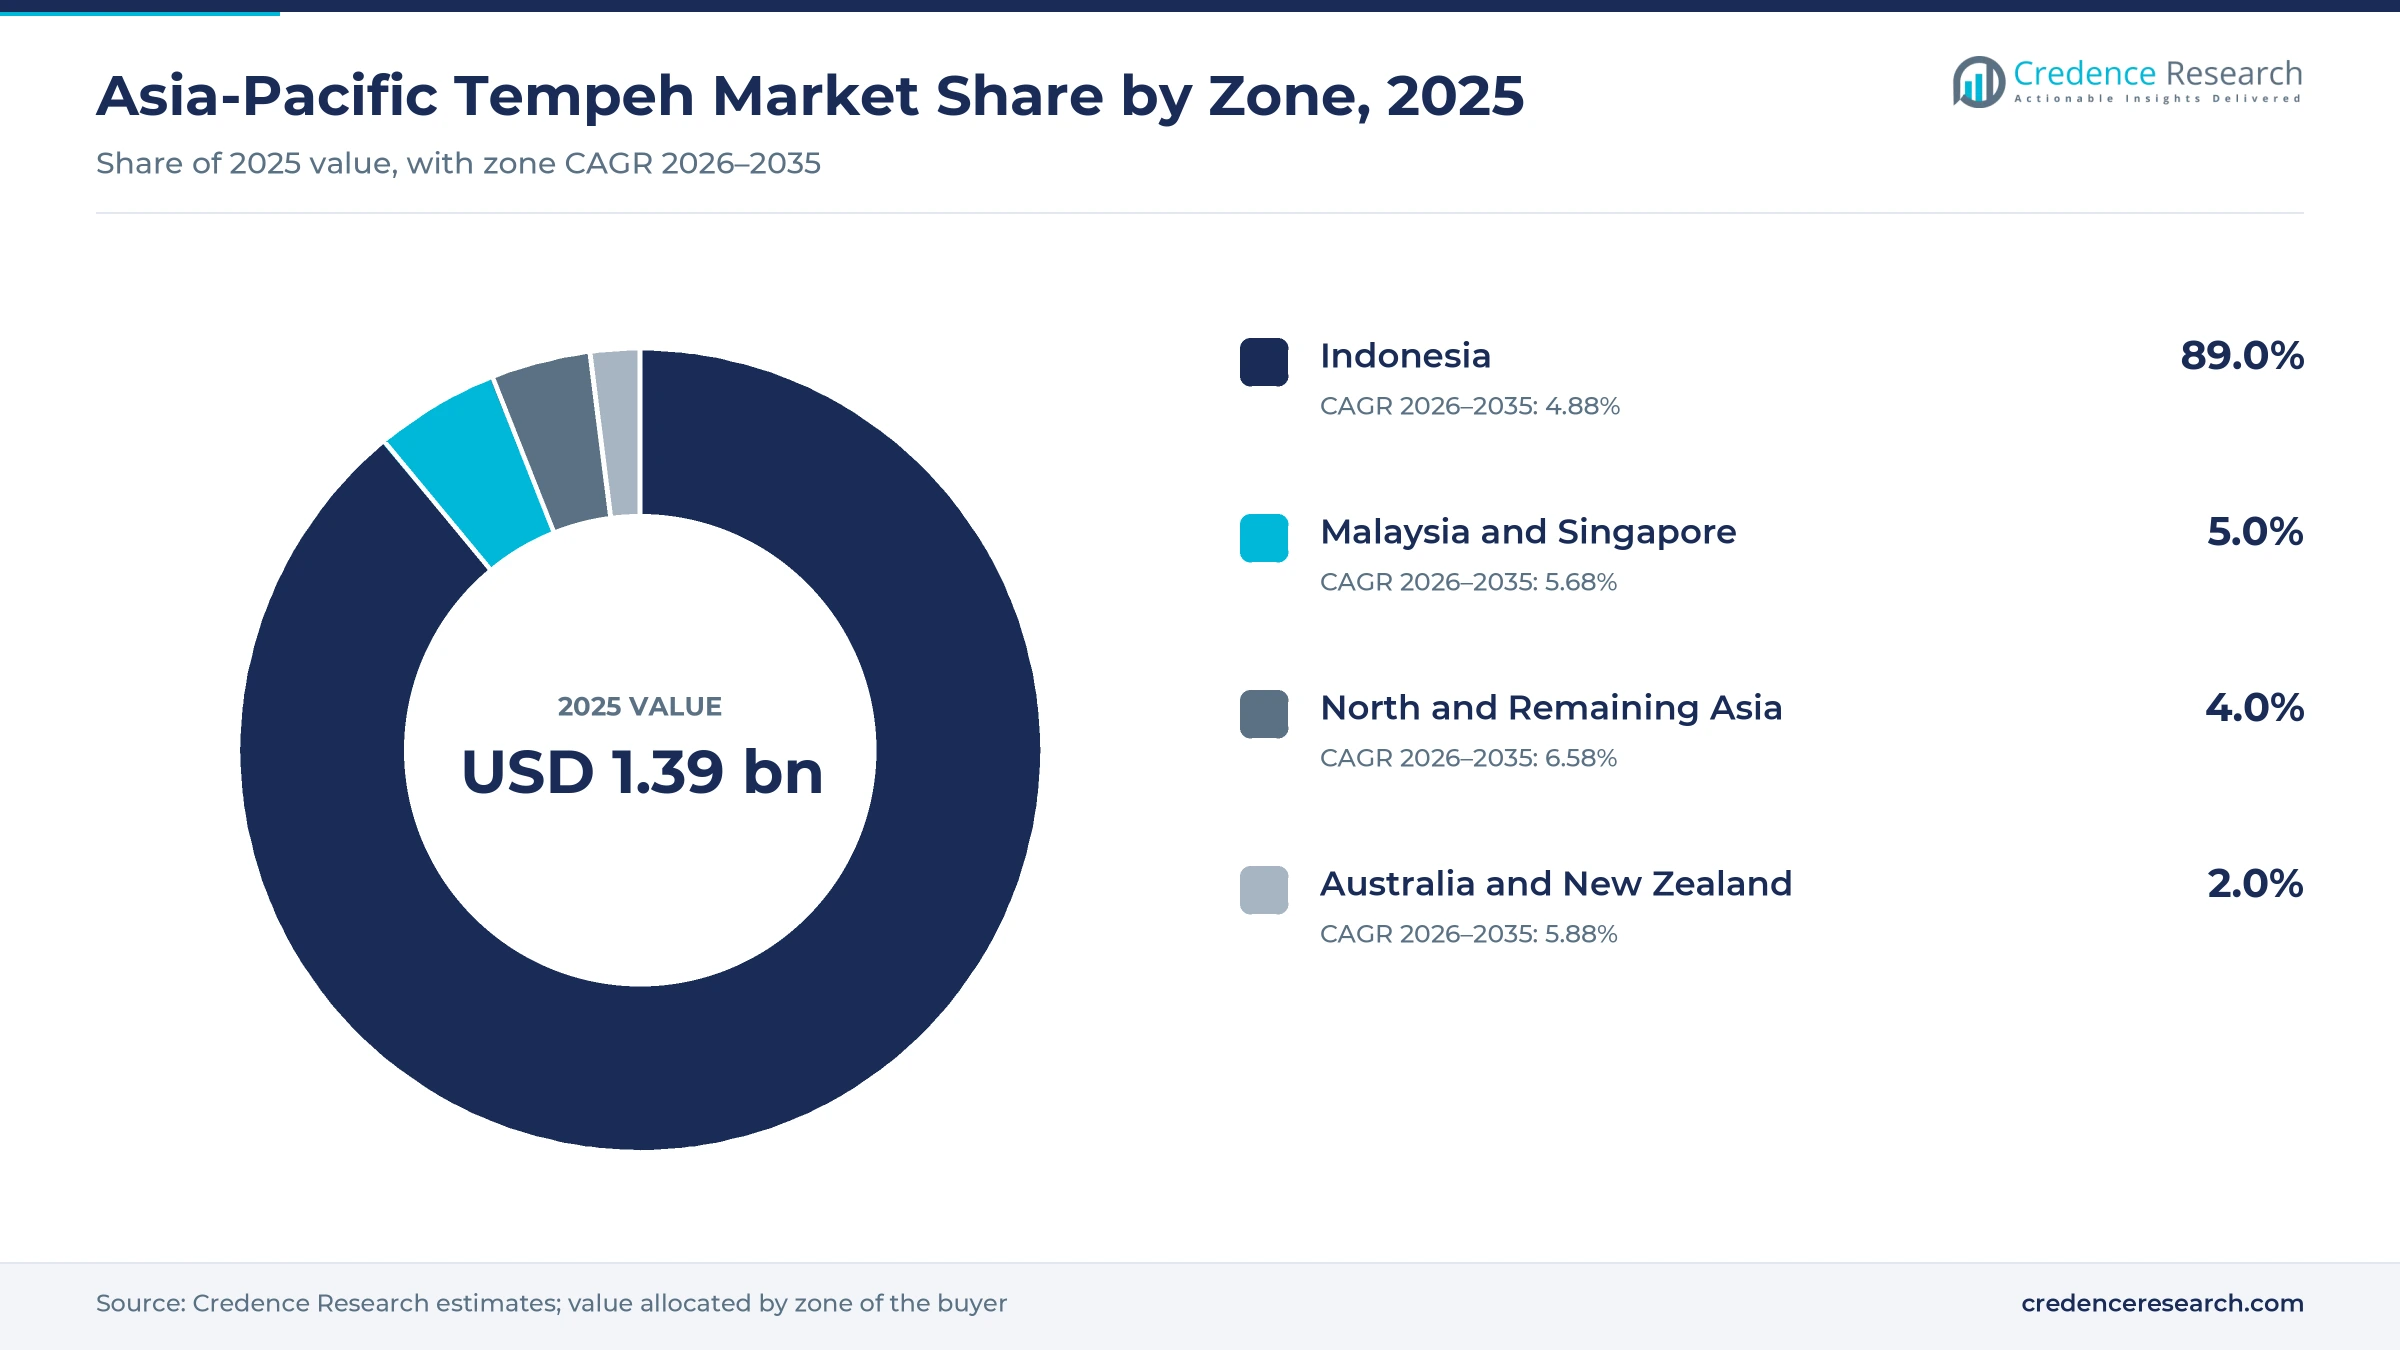
The Asia-Pacific tempeh market was valued at USD 1.39 billion in 2025 and is projected to increase from USD 1.46 billion in 2026 to USD 2.26 billion by 2035, registering a CAGR of 5.01% during 2026–2035. Demand rests on daily household meals in Indonesia, where BPS consumer data show average consumption of 0.102 kg of tempe per person each week. Indonesia held the largest share, 89.0% in 2025, because about 112,000 micro, small and medium businesses there make the product for neighborhood markets. North and Remaining Asia is the fastest-growing zone at 6.58% a year, helped by frozen exports to Japan, South Korea and Taiwan and by new production in India. Public procurement is the main commercial change in the market today. Indonesia started its free nutritious meals program on Jan. 6, 2025, and the national nutrition agency budgeted about Rp 335 trillion for 2026. Soybean costs remain the main constraint, because Indonesia imported 2.68 million tons of soybeans in 2024.
Which tempeh products and buyers does the estimate count?
The market covers fresh tempeh blocks, frozen tempeh, prepared tempeh meals and tempeh snacks sold across Indonesia, Malaysia and Singapore, Australia and New Zealand, and the rest of Asia. Value is counted at the first sale to households, hospitality operators, meal program kitchens and food manufacturers, through wet markets, grocery stores, digital channels and foodservice suppliers.
The estimate excludes raw soybeans, starter cultures sold on their own, tofu, soy milk and other soy foods that are not fermented with Rhizopus mold. The value chain runs from imported or local soybeans, through soaking, dehulling, inoculation and fermentation, to packaging, chilled or frozen storage and final sale.
Asia-Pacific Tempeh Market Insights
- The market grows from USD 1.39 billion in 2025 to USD 2.26 billion by 2035, a 5.01% CAGR during 2026–2035, as staple demand and public meal programs widen.
- Indonesia held 89.0% of 2025 value on weekly household buying, while North and Remaining Asia grows fastest at 6.58% a year.
- Fresh Tempeh led product types with 72.0% of 2025 value because household cooks buy freshly fermented blocks every week.
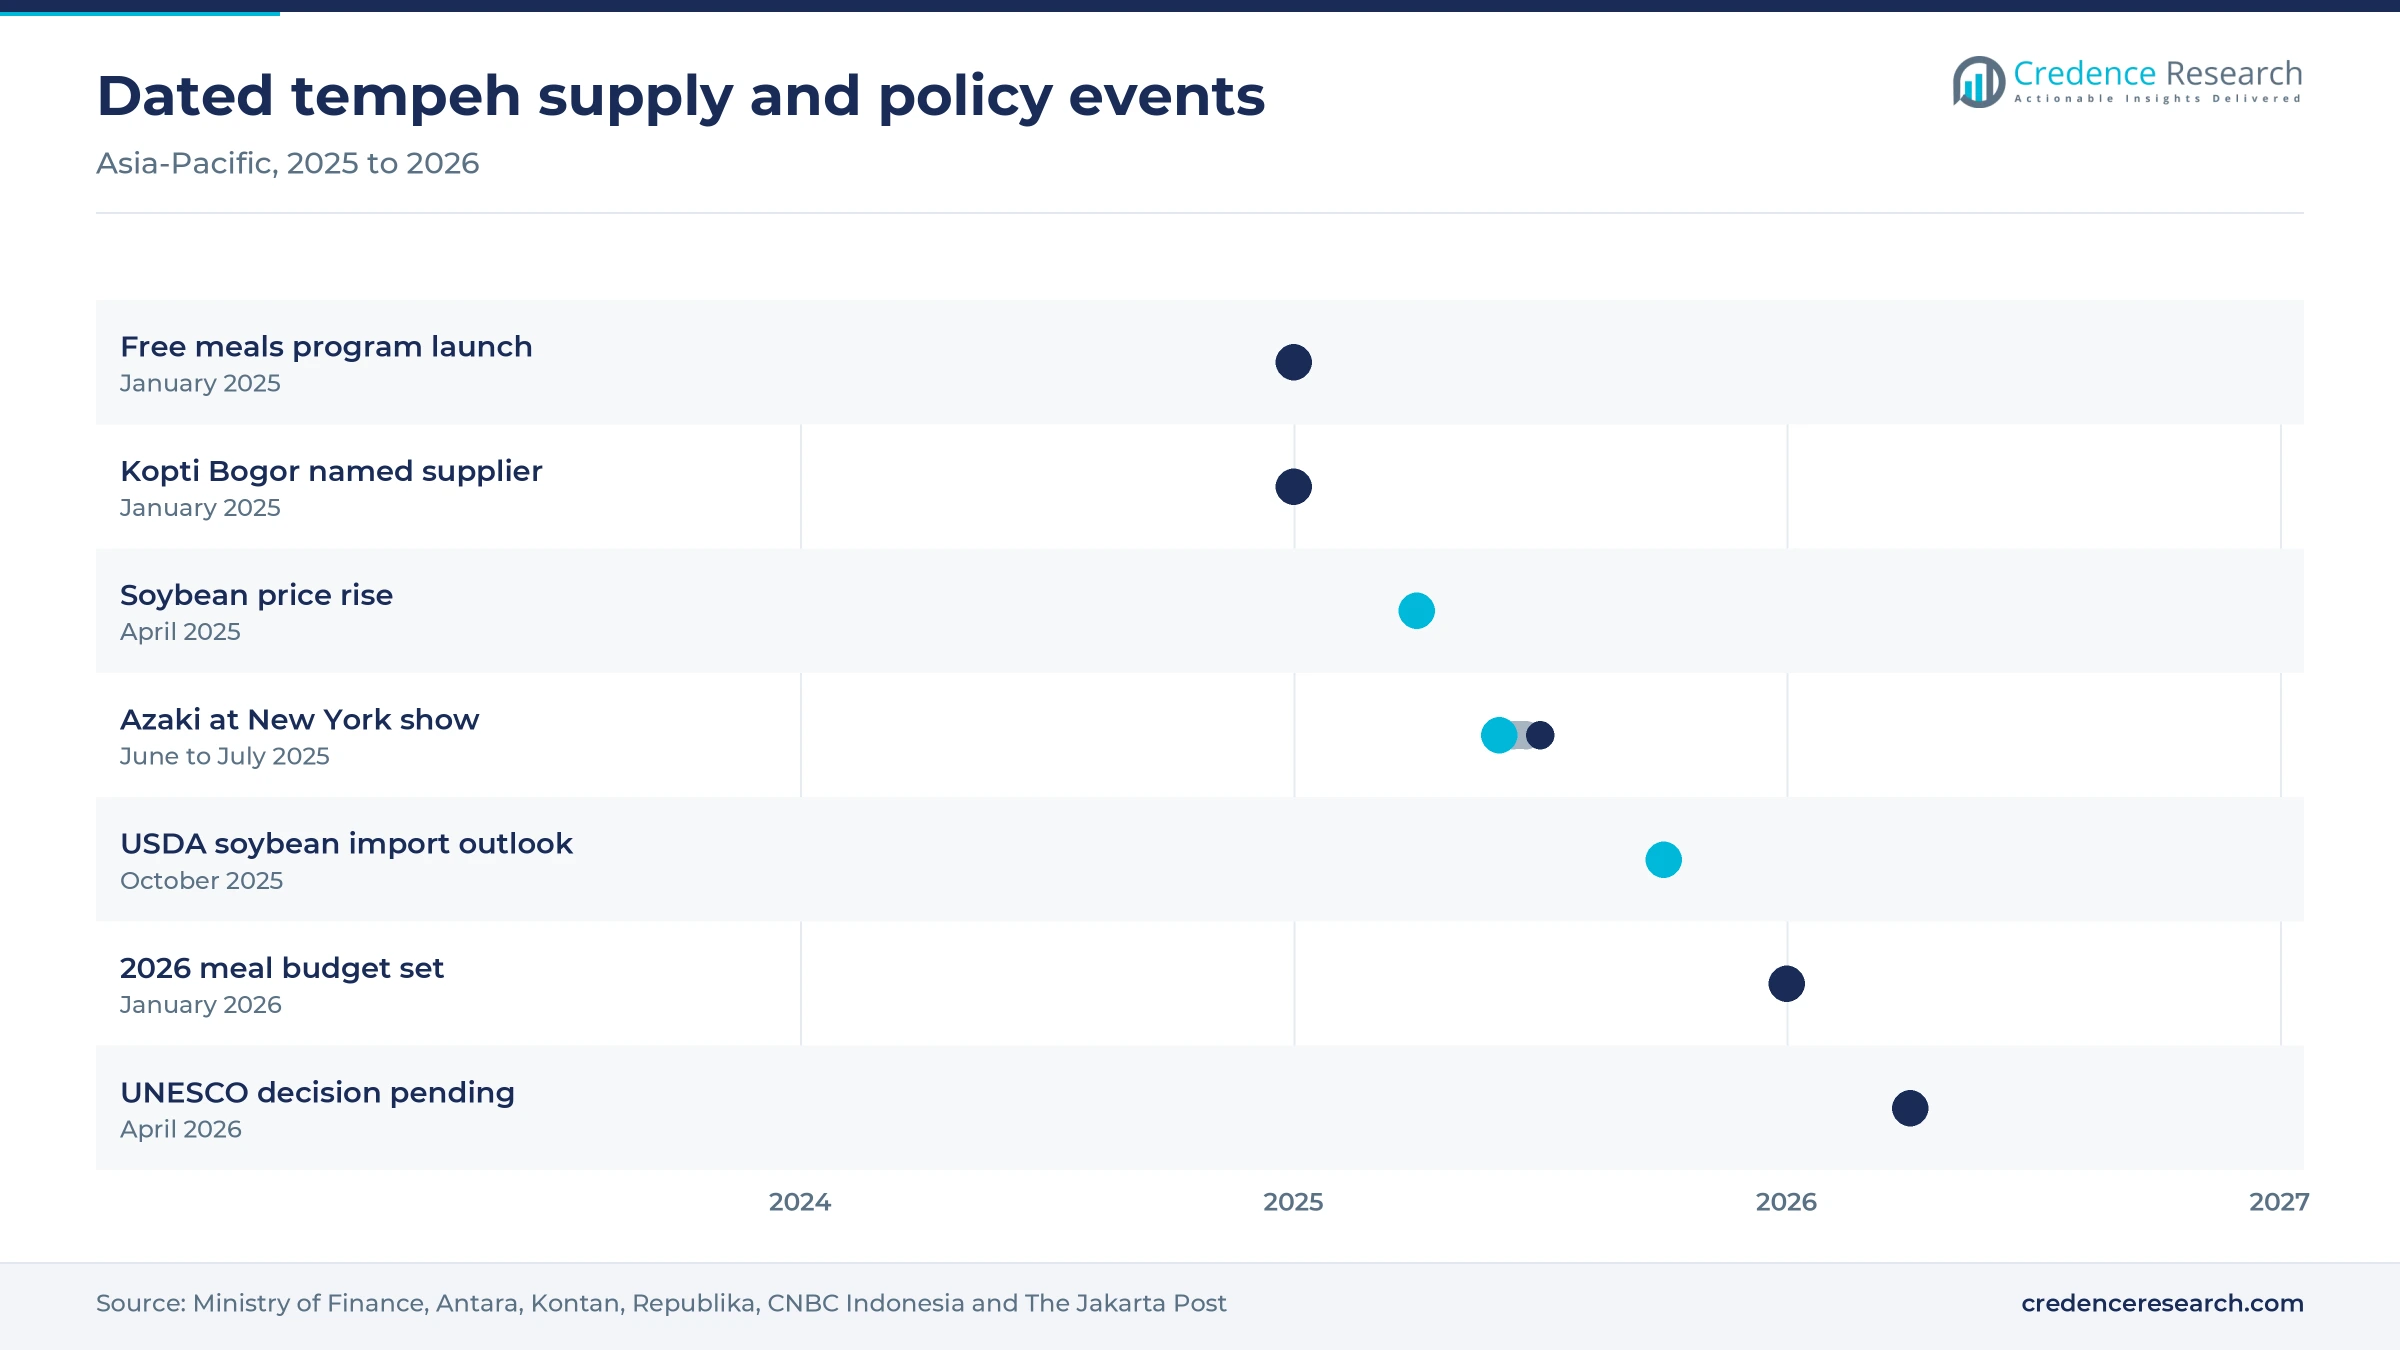
- Indonesia launched its free nutritious meals program on Jan. 6, 2025, and later set about Rp 335 trillion for 2026, opening a large institutional channel.
- Certified exporters are gaining ground, shown by Rumah Tempe Azaki, which ships frozen tempe and chips to 10 countries from its Bogor plant.
Fresh blocks and wet markets hold most of the value
Why do fresh blocks lead, and which format grows fastest?
Based on product type, the market is categorized into fresh tempeh, frozen tempeh, prepared tempeh meals and tempeh snacks. Fresh Tempeh led with 72.0% of 2025 value because Indonesian households buy freshly fermented blocks every week, and BPS data reported by CNBC Indonesia put that spending at Rp 1,282 per person each week. Frozen Tempeh is the fastest-growing format at 6.78% a year as certified exporters scale up, led by Rumah Tempe Azaki and its 1,847-square-meter plant in Bogor, according to Republika in July 2025. Tempeh snacks also travel well, since PT Arumia Kharisma Indonesia shipped 13.8 tons of chips to Japan in September 2021, Tempo reported.
Why do households dominate, and how fast do meal programs grow?
Based on customer type, the market is categorized into households, hospitality operators, meal programme operators and food manufacturers. Households led with 68.0% of 2025 value because Indonesians eat about 7.3 kg of tempe per person a year, according to the U.S. Soybean Export Council, and BPS tracks most of that intake through household spending. Meal Programme Operators grow fastest at 8.40% a year as Indonesia's free meal kitchens add a daily protein portion. A finance ministry treasury office in Berau reported in October 2025 that older students receive 50 g of tempe per serving. Food manufacturers form a smaller group that buys blocks for chips, nuggets and frozen meals.
Why does live-culture fermentation dominate production?
Based on technology, the market is categorized into live-culture fermentation, post-fermentation pasteurisation and post-fermentation cooking. Live-Culture Fermentation led with 80.0% of 2025 value because most of the roughly 112,000 Indonesian makers produce only 20 to 100 kg a day, according to the U.S. Soybean Export Council. Post-Fermentation Pasteurisation grows fastest at 6.53% a year as packaged brands need longer shelf life. Australian maker Mighty Bean extended shelf life from three weeks to four months with heat processes and vacuum bags, Australian Organic reported in October 2021. Post-fermentation cooking supports chips, nuggets and seasoned ready meals sold by food manufacturers.
Why do wet markets carry most tempeh, and which channel grows fastest?
Based on distribution channel, the market is categorized into wet markets, grocery and health-food stores, digital direct sales and foodservice supply. Wet Markets led with 55.0% of 2025 value because cooperative products already sell through traditional markets and retail stores across Greater Jakarta, as the Gakoptindo federation told Antara in January 2025. Digital Direct Sales grow fastest at 7.37% a year as newer brands sell online first. Singapore's Angie's Tempeh sold only through its own e-commerce platform in 2022, according to FoodNavigator-Asia, and India's Hello Tempayy launched through its website and e-commerce platforms in March 2021.
| Segment Group | Leading Sub-segment | Share, 2025 | Fastest-growing Sub-segment | CAGR, 2026–2035 |
|---|---|---|---|---|
| By Product Type | Fresh Tempeh | 72.0% | Frozen Tempeh | 6.78% |
| By Customer Type | Households | 68.0% | Meal Programme Operators | 8.40% |
| By Technology | Live-Culture Fermentation | 80.0% | Post-Fermentation Pasteurisation | 6.53% |
| By Distribution Channel | Wet Markets | 55.0% | Digital Direct Sales | 7.37% |
Request a Free Sample
Fill in your details and we'll send you a free sample report.
- Sample data tables & charts
- Research methodology
Staple habits and free school meals lift fresh demand
How does daily staple consumption anchor regional demand?
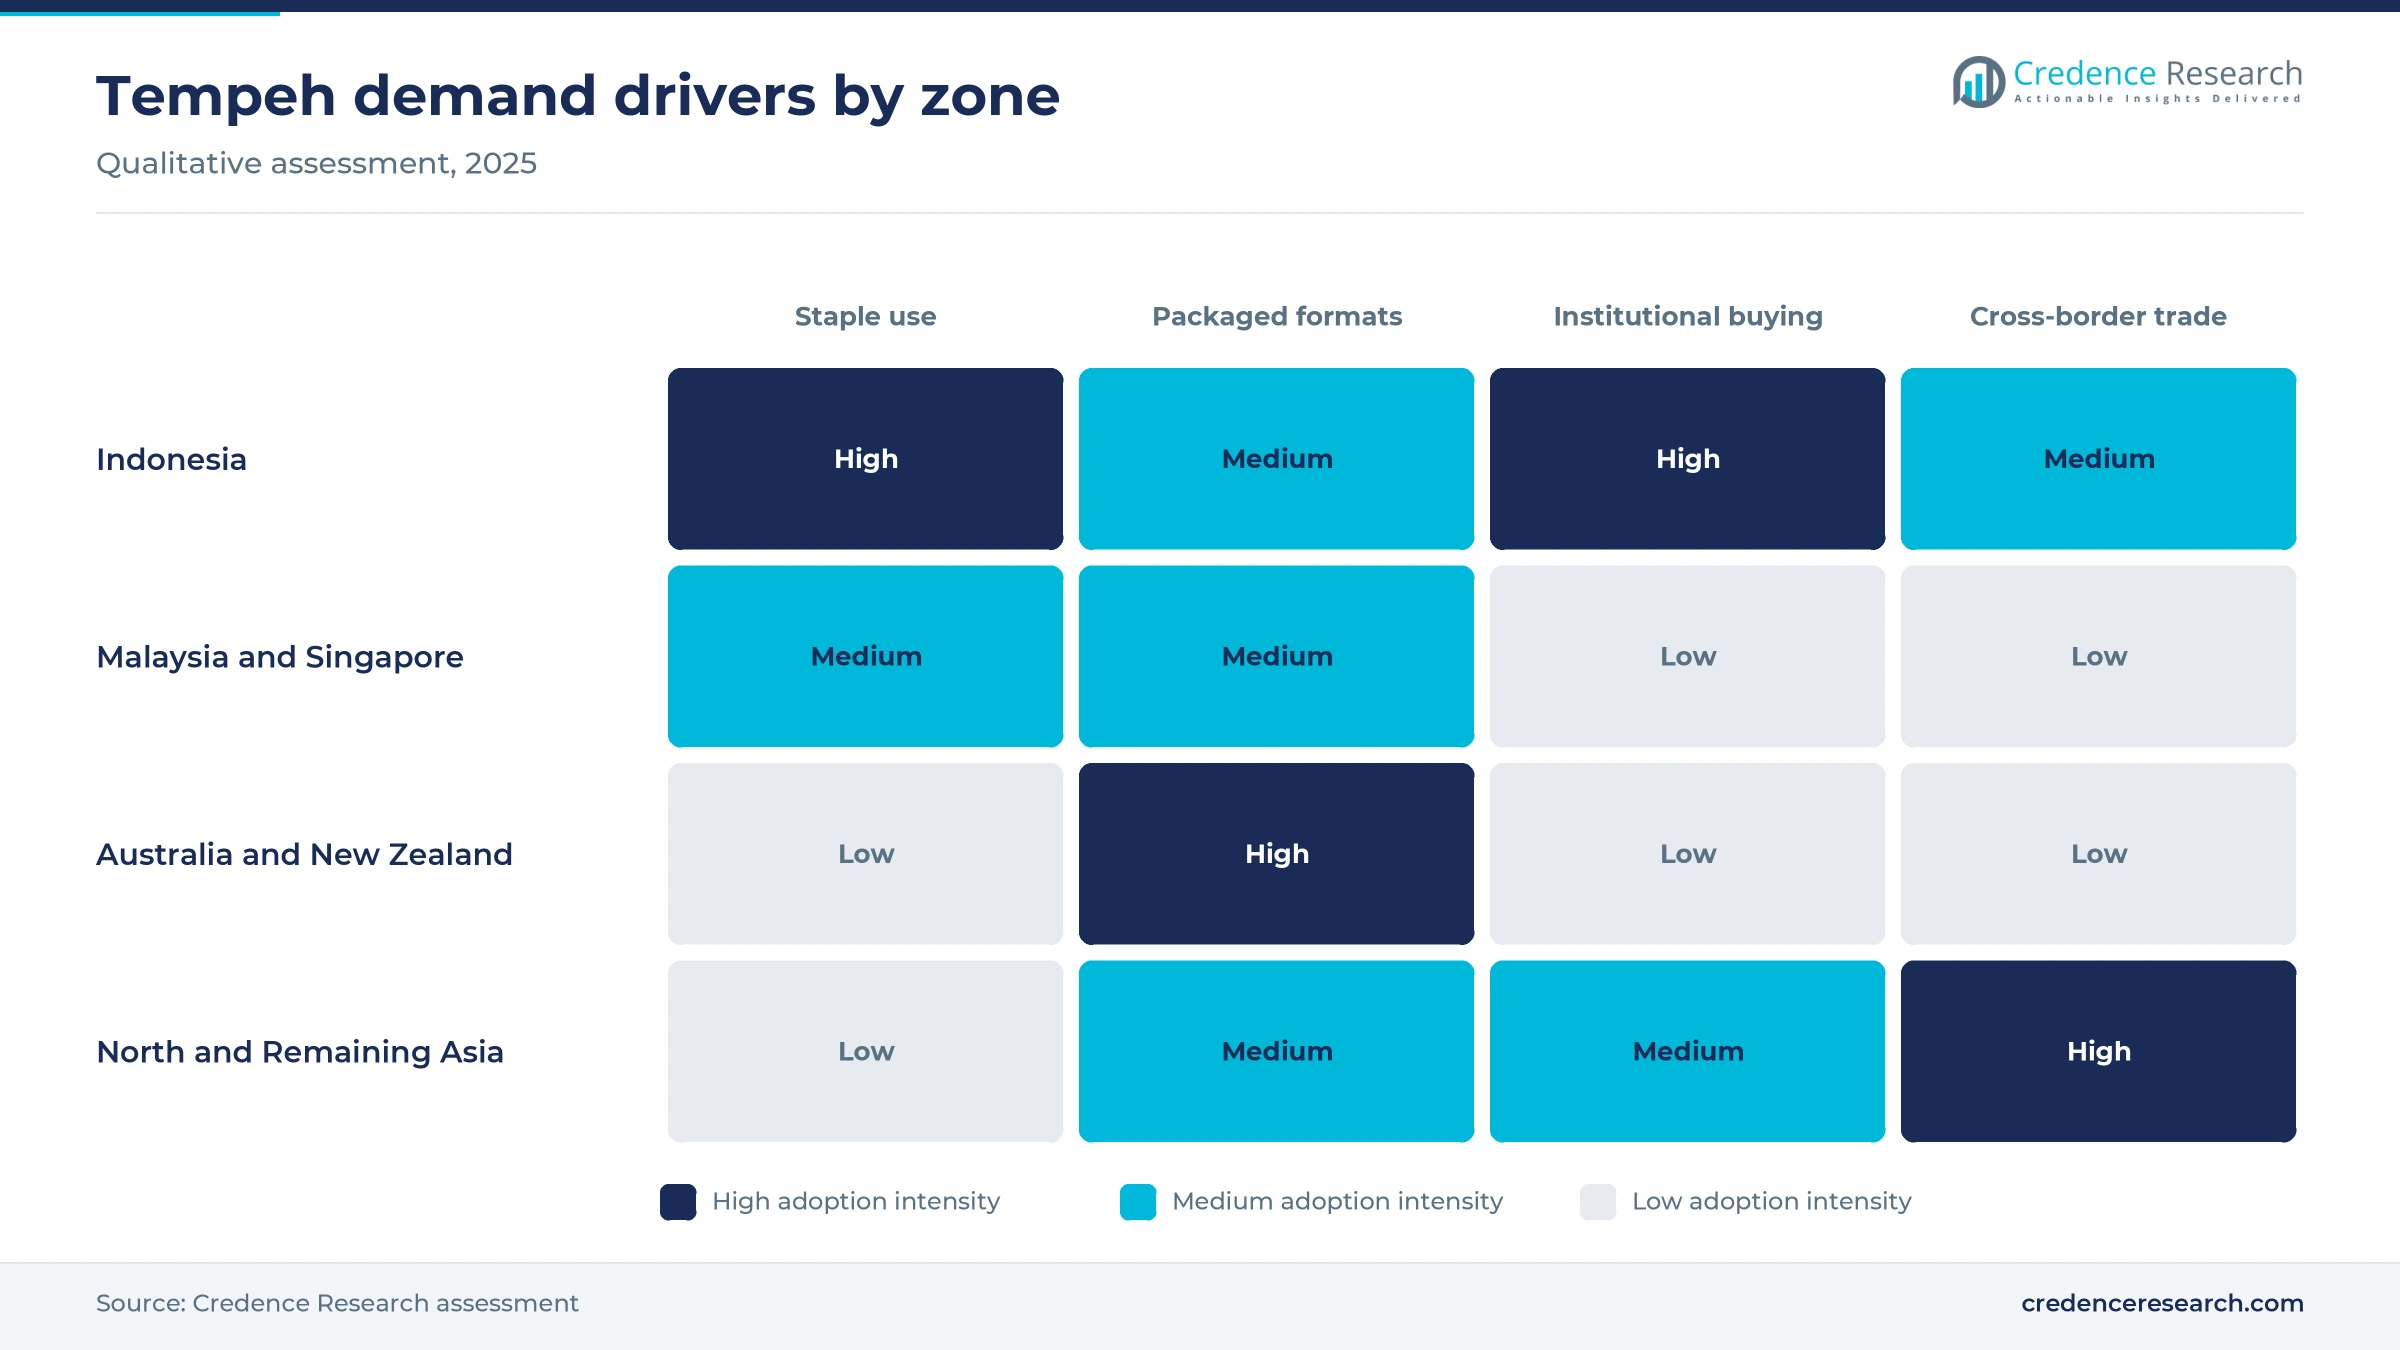
Established staple consumption gives the market a large, steady base that few packaged foods in the region can match. Indonesians eat about 1.3 billion kg of tempe a year, according to the U.S. Soybean Export Council, which also counts about 240,000 workers in the trade. BPS household data reported by CNBC Indonesia show weekly consumption of 0.102 kg per person, with Nganjuk regency in East Java at 0.288 kg. However, the same data show a slow decline from 0.109 kg in 2021, so growth depends on price and format rather than on new eaters. As a result, Indonesia keeps the dominant share of regional value, and suppliers that hold weekly household buyers keep the largest volume.
Why could public kitchens become a large new channel?
School-meal procurement potential is the strongest new source of volume, because Indonesia's free nutritious meals program buys protein every school day. The program started on Jan. 6, 2025, with a 2025 budget ceiling of Rp 71 trillion, according to a finance ministry treasury office report from Berau. That report estimated local need at about 710,000 kg of tempe and tofu a year in Berau alone, while local makers covered only 1.69% of it. The USDA Foreign Agricultural Service also expects the Free Nutritious Meals Program to increase demand for soy-based foods. In turn, the Ministry of Cooperatives said in January 2025 that 1,332 production cooperatives were ready to supply program kitchens.
How are packaged formats widening the buyer base?
Packaged format adoption extends tempeh beyond the wet market, because sealed, chilled or frozen packs reach supermarkets, cafes and export buyers. Rumah Tempe Azaki runs a Bogor plant with capacity of 4.5 tons a day and holds FSSC 22000, HACCP, halal and BPOM certification, Republika reported in July 2025. In Australia, Nutrisoy makes more than 50 tofu and tempeh varieties in a Sydney facility of about 5,000 square meters, according to the company. Mighty Bean also sells vacuum-packed organic tempeh through IGA stores and foodservice distributors. As a result, Frozen Tempeh grows at 6.78% a year, the fastest rate among product formats.
How do heritage status and exports lift the profile of tempeh?
Cultural recognition and export demand form a fourth driver, because they raise the profile of tempeh outside its home market. Indonesia nominated tempe culture for the UNESCO intangible heritage list, and The Jakarta Post reported in April 2026 that it was awaiting confirmation. Singapore's National Heritage Board already added tempeh making to its heritage inventory in November 2020. Exports are also rising, since Kontan reported that Indonesian tempe exports to the U.S. grew from USD 1.7 million in 2021 to USD 2.2 million in 2024. Within Asia, Rumah Tempe Azaki ships from a 1,847-square-meter Bogor plant to Japan, South Korea, Taiwan and Hong Kong. As a result, North and Remaining Asia is the fastest-growing zone as buyers in Japan, South Korea, Taiwan and India adopt the product.
Frozen exports and new substrates reshape the category
Frozen and ready-to-eat formats rise in export channels
A shift toward frozen and ready-to-eat formats is changing how tempeh travels, because fresh blocks keep only briefly at room temperature. Rumah Tempe Azaki was exporting about 44 tons of frozen tempe a month to Japan, South Korea, Taiwan and the U.S. after opening a second Bogor plant on Sept. 26, 2023, Investortrust reported. The same company showed frozen and ready-to-eat tempe at the Summer Fancy Food Show in New York from June 29 to July 1, 2025, according to Kontan. In India, the Tempeh Today system freezes 60% of output for central packaging, FoodIngredientsFirst reported. As a result, frozen packs are turning a local daily food into a stored and traded product.
Emerging substrates and flavors widen the tempeh range
New substrates and local flavors are emerging as producers court buyers of fermented foods who do not eat tempeh at home. Singapore's Angie's Tempeh made 11 tempeh-based products from soybeans, azuki beans, quinoa, barley and chickpeas at a 2,500-square-foot site in Admiralty, FoodNavigator-Asia reported in August 2022. In India, Hello Tempayy launched natural, sriracha, Szechuan and tawa masala flavors at 130 to 150 rupees per 200 g pack in March 2021, according to Vegconomist. Malaysia's Truly Gourmet turned tempeh into sea salt chips with a two-month shelf life, The Edge Malaysia reported in 2021. As a result, snacks and prepared meals now reach shoppers through cafes, online stores and organic grocers.
Meal program kitchens offer cooperatives a contract opening
Meal program kitchens offer a clear opening for cooperatives and mid-sized makers that can deliver on schedule. Indonesia's national nutrition agency planned a budget of about Rp 335 trillion for 2026 and a target of 82.9 million beneficiaries by May, Kontan reported in January 2026. Gakoptindo's secretary general said in January 2025 that the federation wants tempe and tofu to be a main supply item, Antara reported. The Berau gap shows the scale of the need, since local makers covered under 2% of school-year demand in 2025. As a result, Meal Programme Operators grow fastest at 8.40% a year, and suppliers with hygiene certification and cold logistics stand to win repeat orders.
Supermarket shelves in Australia and New Zealand offer an opening
Australia and New Zealand offer an opening for premium organic and flavored packs, because supermarkets there already give shelf space to meat substitutes. Food Frontier counted just under 300 plant-based meat products in Melbourne and Sydney supermarkets in mid-2023, made by 26 local manufacturers. Tonzu, run by the Chalmers family in Henderson, sells organic tempeh alongside tofu through New Zealand supermarket chains, health stores and cafes. Nutrisoy also offers private label and contract manufacturing for major retailers and foodservice companies, according to the company. As a result, the zone's 2.0% share can grow at 5.88% a year as retailers add organic and ready-to-cook formats.
Imported soybeans and thin margins test small makers
How does soybean import dependence expose makers?
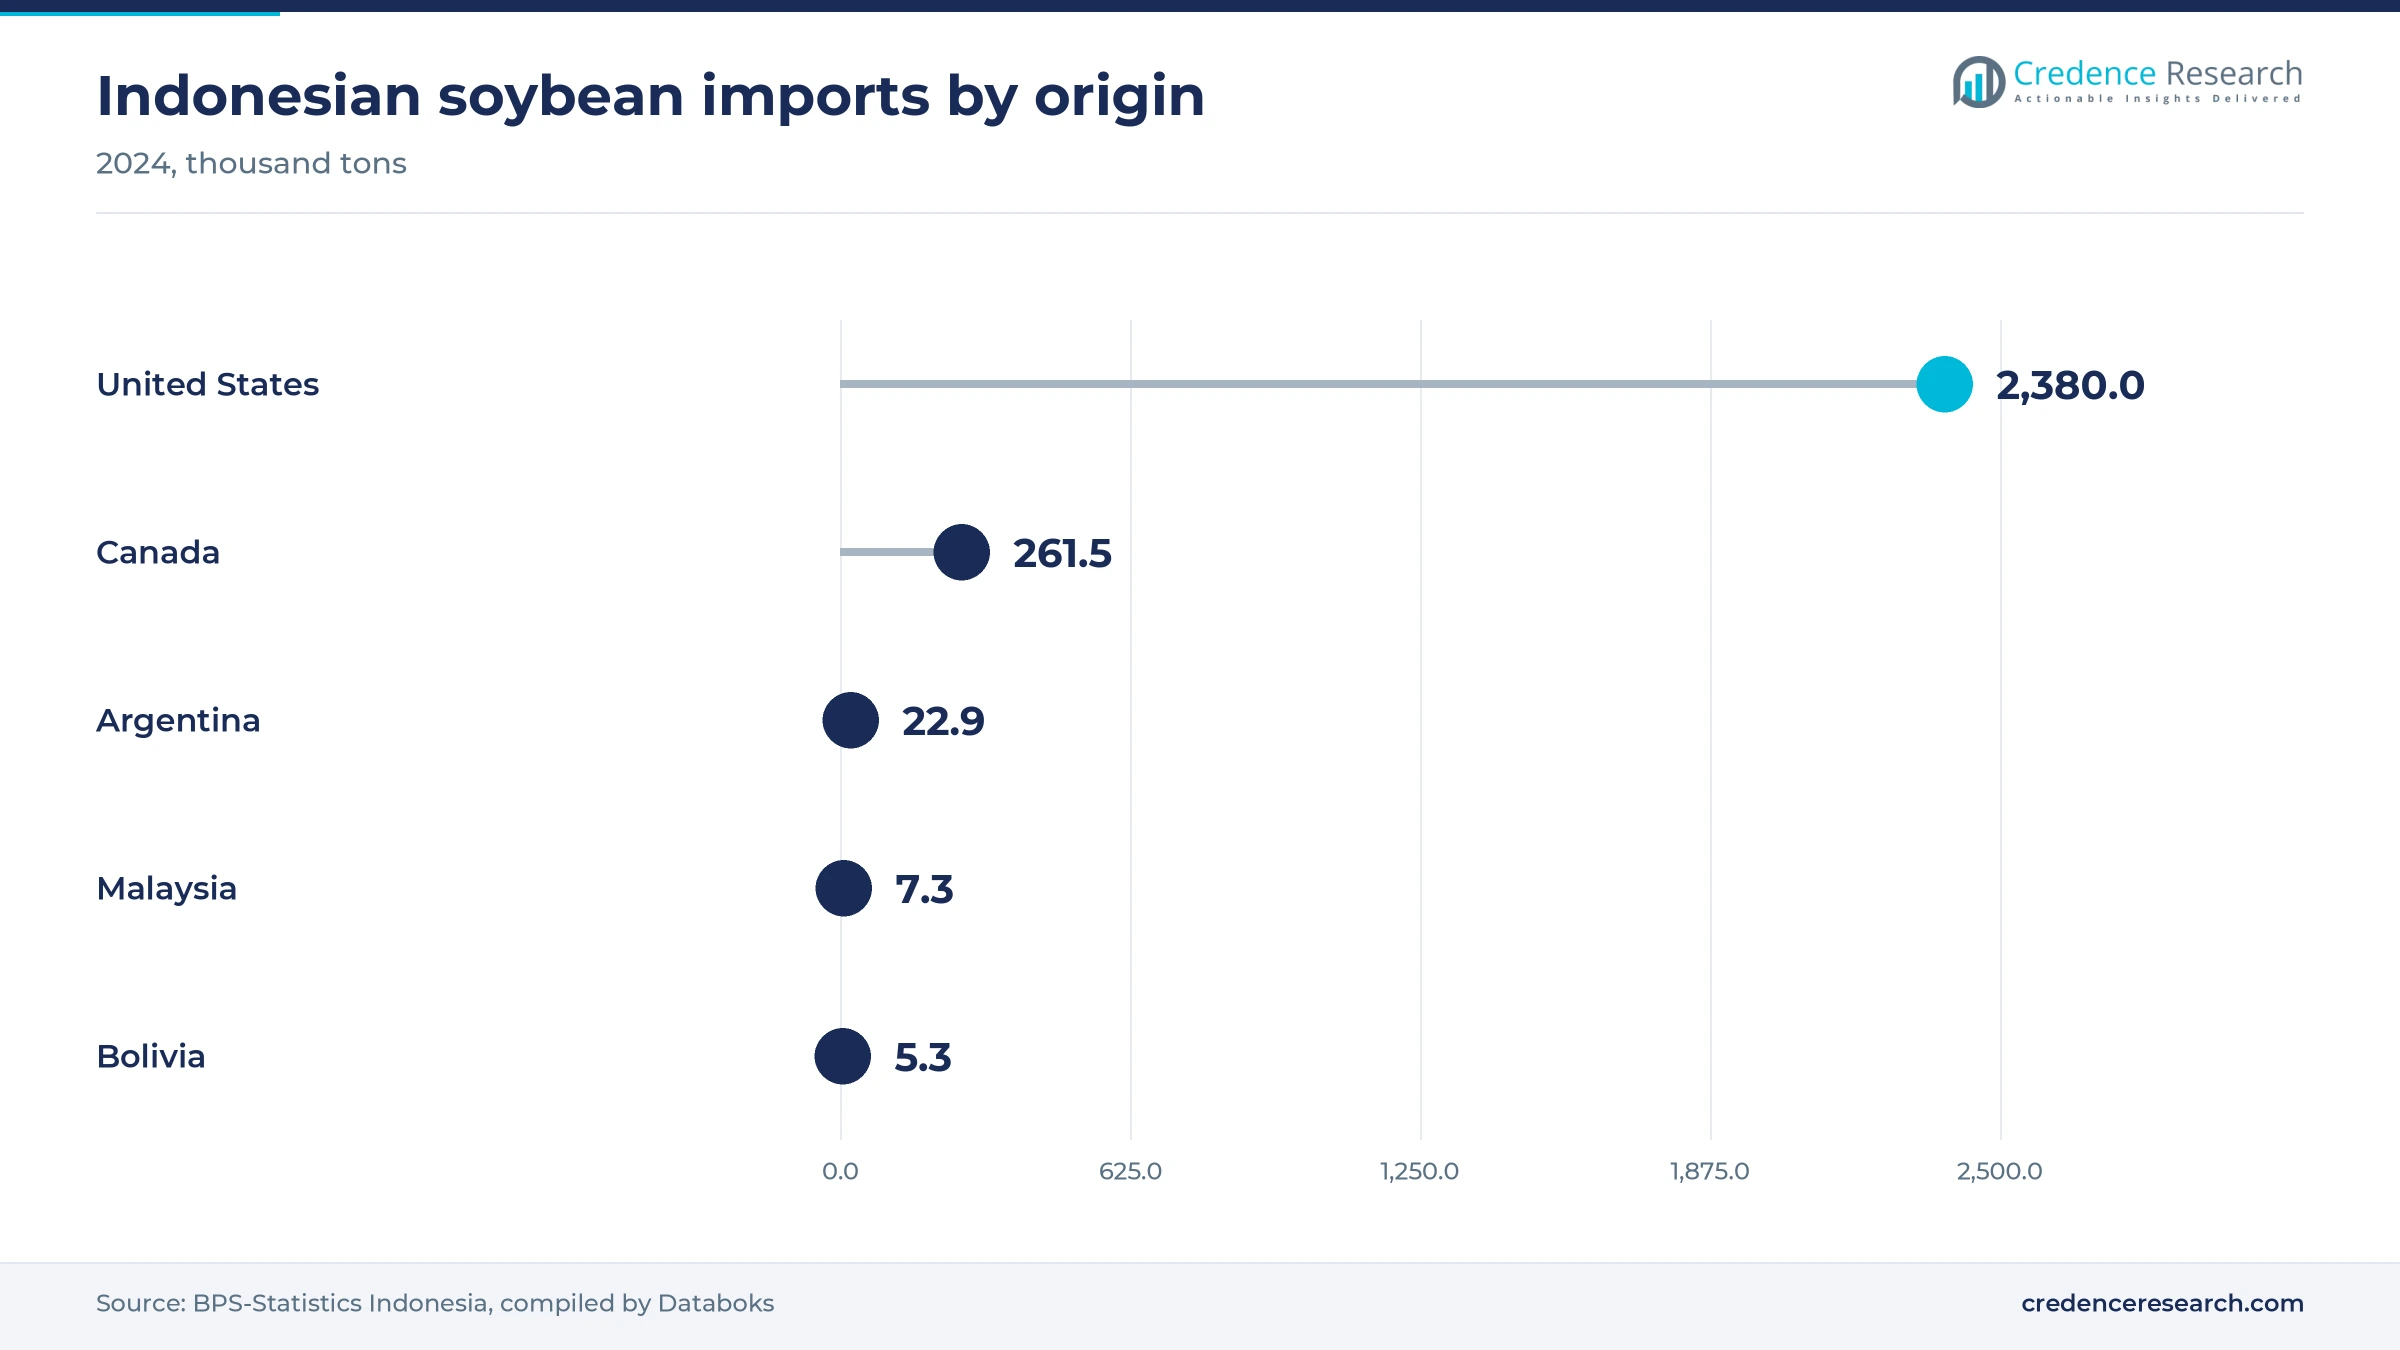
Import dependence is the main cost risk, because Indonesia grows only a small share of the soybeans it uses. USDA estimates cited by CNBC Indonesia in October 2025 put 2024/25 output at about 350,000 tons against demand near 2.9 million tons. BPS data compiled by Databoks show that 2.38 million tons of the 2024 imports came from the U.S. As a result, a weaker rupiah or a U.S. trade disruption passes quickly into tempe costs for small makers.
What happens to margins when input costs jump?
Thin margins leave small producers exposed when soybean prices climb. Gakoptindo told Kontan on April 8, 2025, that soybeans rose from about Rp 9,100 to Rp 9,700 per kg, while tempe rose from Rp 8,000 to Rp 10,000 a piece within two months. Output fell 10% to 20% around Lebaran, and the federation warned that many small makers could stop producing. It also asked the president to keep the 0% import duty on U.S. soybeans.
Can regency makers keep pace with school kitchens?
Local supply gaps limit how much meal program demand smaller regencies can capture. In Berau, East Kalimantan, the finance ministry treasury office found that local makers supplied about 12,000 kg against a school-year need near 710,000 kg. Soybeans also come from outside the regency, which raises cost and delivery risk for kitchens. As a result, kitchens may switch to other proteins, as one Berau kitchen did for 1,599 beneficiaries on Sept. 19, 2025, when it served peanuts.
Why do fresh blocks struggle to travel far?
Short shelf life restricts how far fresh tempeh can travel without heat treatment or freezing. Malaysia's national culture department notes that tempe is wrapped in banana leaves or perforated plastic and fermented for about 24 hours at about 30°C. Mighty Bean needed heat processes and vacuum bags to stretch shelf life from three weeks to four months. As a result, smaller makers without cold chains stay tied to nearby markets, while certified firms carry the cost of pasteurization, packaging and frozen storage.
Indonesia dominates while North Asia and India add buyers
| Zone | Value, 2025 (USD billion) | Share, 2025 | CAGR, 2026–2035 |
|---|---|---|---|
| Indonesia | 1.24 | 89.0% | 4.88% |
| Malaysia and Singapore | 0.07 | 5.0% | 5.68% |
| North and Remaining Asia | 0.06 | 4.0% | 6.58% |
| Australia and New Zealand | 0.03 | 2.0% | 5.88% |
Indonesia holds most of the value through weekly buying
Indonesia held 89.0% of 2025 value and grows at 4.88% a year, the slowest rate in the region because intake per person is already high. The base is cooperative and household-scale production, modernized in places such as Rumah Tempe Indonesia, which opened in Bogor on June 6, 2012, with EU and Mercy Corps backing, detik reported. Growth now depends on meal program contracts, certified exports and packaged lines in modern food and beverage retail, where hygiene certification earns a premium over wet-market blocks.
Malaysia and Singapore build on Javanese food heritage
Malaysia and Singapore held 5.0% of 2025 value and grow at 5.68% a year. Malaysia's national culture department describes tempe as an essential daily food for the Javanese community in Johor, now eaten across ethnic groups. Singapore's National Heritage Board notes that Kampong Tempeh once made over 5,000 pieces a day for island-wide peddlers. Brands such as Angie's Tempeh and Truly Gourmet now sell flavored and snack formats online and through organic stores in both countries.
North and Remaining Asia grows fastest from imports and India
North and Remaining Asia held 4.0% of 2025 value and is the fastest-growing zone at 6.58% a year. Japan, South Korea, Taiwan and Hong Kong buy frozen tempe from Indonesian exporters such as Rumah Tempe Azaki. India is building local supply, since Tempeh Today installed its first small fermentation unit in Bangalore in 2021 and planned 10,000 metric tons a year, with 40% for school meals, FoodIngredientsFirst reported. Hello Tempayy also sells ready-to-cook packs through its own website and e-commerce platforms.
Australia and New Zealand earn premium organic prices
Australia and New Zealand held 2.0% of 2025 value and grow at 5.88% a year, with value lifted by premium organic prices. Nutrisoy, founded in Sydney in 1984, and Mighty Bean, started on a Cooloolabin farm in 1983, supply organic and flavored tempeh to Australian stores. PrimaSoy packs of 225 g sell through Melbourne grocers and food cooperatives, while Tonzu supplies New Zealand chains from Henderson. Growth comes from wider ranges rather than from new mass-market buyers.
Meal program budgets and export moves since 2025
| Development | Status and market relevance |
|---|---|
| In January 2025, Indonesia launched the free nutritious meals program, which serves tempe and tofu as a main plant protein in school kitchens. | Running nationwide, with a target of 82.9 million beneficiaries by May 2026 |
| In January 2025, the Ministry of Cooperatives backed Kopti Bogor, operator of Rumah Tempe Indonesia, as a tempe and tofu supplier to meal program kitchens. | Supplier role announced, with 1,332 cooperatives listed as ready |
| In April 2025, Gakoptindo asked President Prabowo Subianto to keep a 0% import duty on U.S. soybeans after soybean prices reached Rp 9,700 per kg. | Request filed, while cost pressure on small makers continues |
| In June 2025, Rumah Tempe Azaki showed frozen and ready-to-eat tempe at the Summer Fancy Food Show in New York. | Exporting to 10 countries by July 2025 |
| In April 2026, Indonesia's tempe culture nomination was awaiting confirmation for the UNESCO intangible heritage list. | Decision pending |
Live culture, pasteurization and cooking set shelf life
- Live-culture fermentation binds cooked, dehulled soybeans with Rhizopus mold in about a day, giving the fresh blocks sold in wet markets.
- Post-fermentation pasteurization heats finished blocks and seals them in vacuum packs, so supermarket stock lasts for months rather than days.
- Freezing halts mold growth for export, as frozen shipments from Bogor to Japan, South Korea and Taiwan show.
- Post-fermentation cooking turns tempeh into chips, nuggets and seasoned meals that keep longer and suit snacking and quick cooking.
Need a Custom Version of This Report?
Tailor the scope, geography, or segments to your exact requirements.
- Custom geography or segment scope
- Direct access to our analyst team
Cottage makers compete with certified packaged brands
Competition splits between many thousands of cottage makers and a small group of certified brands. In Indonesia, cooperative members and household workshops sell fresh blocks at low prices through nearby markets, while Rumah Tempe Azaki and Rumah Tempe Indonesia compete on hygiene, certification and export readiness. Packaged brands compete on shelf life, organic sourcing and flavor. Nutrisoy, Mighty Bean, PrimaSoy and Tonzu hold supermarket and health-store shelves in Australia and New Zealand, with organic certification as a key claim. Angie's Tempeh and Truly Gourmet compete in Singapore and Malaysia through new substrates, snacks and online sales. Tempeh Today brings a decentralized production model to India, using small fermentation units close to soybean farmers. Price matters most in Indonesia, so packaged brands there target exports, modern retail and institutional buyers rather than wet-market shoppers. Over the forecast, meal program contracts and cold storage capacity are likely to favor larger certified makers.
Companies profiled and their roles in this market
| Company | Type | Role in the market |
|---|---|---|
| Rumah Tempe Azaki (PT Azaki Food) | Packaged producer and exporter | Bogor maker of frozen tempe and chips with FSSC 22000 certification |
| Rumah Tempe Indonesia (Kopti Bogor) | Cooperative production center | Hygienic training plant in Bogor named as a meal program supplier in 2025 |
| Nutrisoy | Packaged soy food maker | Sydney producer of tofu and tempeh lines with private label and contract work |
| Mighty Bean | Organic tempeh maker | Cooloolabin producer using its own certified organic starter culture |
| PrimaSoy | Packaged tempeh brand | Sells 225 g plain and flavored tempeh through Australian grocers |
| Tonzu (Chalmers Organics) | Organic soy food maker | Henderson producer supplying tofu and tempeh to New Zealand supermarket chains |
| Angie's Tempeh | Specialty brand | Singapore maker of multigrain and chickpea tempeh, nuggets and chips |
| Truly Gourmet | Snack brand | Malaysian maker of tempeh chips sold online and in organic stores |
| Tempeh Today | Production system provider | Dutch-backed network of small fermentation units in India |
Institutional buying will decide where volume grows
Credence Research's view is that the market will grow through institutions and packaging rather than through new household eaters in Indonesia. Household consumption per person has eased slightly since 2021, so the volume base is large but mature. The free nutritious meals program changes that picture, because it creates scheduled, specified orders that favor certified suppliers with steady soybean access. Outside Indonesia, value grows faster from a small base, led by frozen exports to North Asia, new Indian production and organic packs in Australia and New Zealand. Makers that combine hygiene certification, cold storage and soybean hedging are best placed to gain share by 2035.
How the regional tempeh estimates were built
The report uses 2025 as the base year and forecasts values for 2026 to 2035 in U.S. dollars. Market values come from the Credence Research model, which builds Indonesian value from BPS household consumption and spending per person, cross-checked against tempe volume estimates from the U.S. Soybean Export Council and soybean import data. Values for the other zones are Credence Research estimates based on population, retail prices and company information. Zone, segment and growth splits are Credence Research estimates from public sources, including government statistics, trade data, official program documents, company releases and news reports. No interviews or surveys were used to build these estimates.
Packaged and institutional formats shape the 2035 outlook
By 2035, the market reaches USD 2.26 billion, and the mix moves gradually toward frozen, pasteurized and prepared formats. Indonesia keeps the largest share because weekly household buying and school meals both rest on the same fresh blocks. The pace of soybean imports and the rupiah will decide margins, so makers that secure supply contracts and stable input costs will gain. North and Remaining Asia and Australia and New Zealand grow faster from small bases as frozen exports, Indian production and organic retail ranges widen. In turn, certified makers with cold chains will take a larger share of the value.
Frequently Asked Questions
How big is the Asia-Pacific tempeh market?
Which zone leads the Asia-Pacific tempeh market?
Which zone grows fastest?
Which product type leads the market?
How does Indonesia's free meals program affect tempeh demand?
What are the main challenges for tempeh makers?
Who are the key companies in the market?
Which technology grows fastest?
Table of Content
Chapter 1 Market Segmentation
- 1.1 Segmentation Framework
- 1.1.1 Product and Service Classification
- 1.1.2 Application and End-Use Classification
- 1.1.3 Technology and Solution Classification
- 1.1.4 Customer and Distribution Channel Classification
- 1.1.5 Geographic Segmentation
- 1.1.6 Market Segment Definitions and Boundaries
- 1.2 By Product Type
- 1.2.1 Fresh Tempeh
- 1.2.2 Frozen Tempeh
- 1.2.3 Prepared Tempeh Meals
- 1.2.4 Tempeh Snacks
- 1.3 By Customer Type
- 1.3.1 Households
- 1.3.2 Hospitality Operators
- 1.3.3 Meal Programme Operators
- 1.3.4 Food Manufacturers
- 1.4 By Technology
- 1.4.1 Live-Culture Fermentation
- 1.4.2 Post-Fermentation Pasteurisation
- 1.4.3 Post-Fermentation Cooking
- 1.5 By Zone
- 1.5.1 Indonesia
- 1.5.2 Malaysia and Singapore
- 1.5.3 Australia and New Zealand
- 1.5.4 North and Remaining Asia
Chapter 2 Introduction
- 2.1 Report Objectives and Scope
- 2.2 Product Definition and Industry Terminology
- 2.3 Market Inclusions and Exclusions
- 2.4 Research Process
- 2.4.1 Primary Research and Expert Interviews
- 2.4.2 Secondary Research and Source Review
- 2.4.3 Top-Down and Bottom-Up Estimation
- 2.4.4 Data Triangulation and Verification
- 2.5 Market Size Measurement Basis
- 2.5.1 2025: USD 1.39 billion → 2035: USD 2.26 billion
- 2.6 Historical and Forecast Reference Periods
- 2.6.1 Historical Period: 2018-2025
- 2.6.2 Base Year: 2025
- 2.6.3 Forecast Period: 2025-2035
- 2.7 Research Assumptions and Limitations
Chapter 3 Executive Summary
- 3.1 Market Snapshot and Key Findings
- 3.2 Base-Year Market Size, 2025
- 3.3 Forecast Market Size, 2035
- 3.4 Revenue and Volume Growth Outlook
- 3.5 Key Demand and Supply Indicators
- 3.6 Leading Market Segments
- 3.7 Fastest-Growing Market Opportunities
- 3.8 Regional Performance Highlights
- 3.9 Technology and Industry Transformation
- 3.10 Competitive Landscape Summary
- 3.11 Analyst View and Strategic Implications
Chapter 4 Asia-Pacific Tempeh Market Trends and Developments
- 4.1 Historical Industry Development, 2018-2025
- 4.2 Recent Market Trends and Developments
- 4.3 Demand and Customer Behavior Trends
- 4.4 Technology and Product Innovation
- 4.5 Artificial Intelligence, Automation and Digitalization
- 4.6 Local Manufacturing and Supply Chain Realignment
- 4.7 Industry Partnerships, Mergers and Acquisitions
- 4.8 Sustainability and Circular Economy Developments
- 4.9 Government and Private Sector Investment Trends
- 4.10 Emerging Business Models and Commercialization
- 4.11 Industry Developments and Announcements
Chapter 5 Asia-Pacific Tempeh Market Production, Supply and Demand Analysis
- 5.1 Demand Trend and Consumption Analysis, 2018-2025
- 5.2 Demand Forecast, 2025-2035
- 5.3 Production and Output Trend, 2018-2025
- 5.4 Production and Output Forecast, 2025-2035
- 5.5 Installed Capacity and Capacity Utilization
- 5.6 Company-Wise Production Plants and Statistics
- 5.6.1 Installed Production Capacity
- 5.6.2 Actual Production
- 5.6.3 Planned Capacity and Expansion Targets
- 5.7 Supply Chain Structure and Procurement Trends
- 5.8 Supply-Demand Gap and Bottlenecks
- 5.9 Import Dependence and Sourcing Structure
- 5.10 Contract Manufacturing and Outsourcing
- 5.11 Regional Supply and Demand Concentration
Chapter 6 Asia-Pacific Tempeh Market Pricing Analysis
- 6.1 Pricing Structure and Measurement
- 6.2 Historical Pricing Trends, 2018-2025
- 6.3 Pricing Outlook, 2025-2035
- 6.4 Average Selling Price and Unit Economics
- 6.5 Pricing by Product and Market Segment
- 6.6 Geographic Pricing Differences
- 6.7 Key Input, Energy, Labor and Logistics Costs
- 6.8 Contract Pricing and Purchasing Models
- 6.9 Pricing Sensitivity and Competitive Positioning
- 6.10 Price, Margin and Profitability Implications
Chapter 7 Asia-Pacific Tempeh Market Dynamics
- 7.1 Market Growth Drivers
- 7.1.1 Demand-Side Drivers
- 7.1.2 Technology and Innovation Drivers
- 7.1.3 Infrastructure and Investment Drivers
- 7.1.4 Regulatory and Policy Drivers
- 7.2 Market Restraints
- 7.2.1 Cost and Affordability Constraints
- 7.2.2 Technology and Adoption Barriers
- 7.2.3 Supply Chain and Operational Constraints
- 7.3 Market Challenges
- 7.3.1 Competitive Pressure and Margin Erosion
- 7.3.2 Skills, Infrastructure and Implementation Gaps
- 7.4 Emerging Market Opportunities
- 7.5 Market Dynamics Impact and Time-Horizon Assessment
Chapter 8 Asia-Pacific Tempeh Value Chain Analysis
- 8.1 Industry Value Chain Overview
- 8.2 Upstream Suppliers and Critical Inputs
- 8.3 Technology and Component Providers
- 8.4 Manufacturing or Service Delivery
- 8.5 Distribution, Channel Partners and Integrators
- 8.6 Downstream Applications and End Users
- 8.7 Value Addition and Profit Pools
- 8.8 Vertical Integration and Outsourcing
- 8.9 Supplier Concentration and Risk
- 8.10 Supply Chain Localization and Resilience
Chapter 9 Asia-Pacific Tempeh Market Regulations and Policies
- 9.1 Relevant Laws, Standards and Compliance Frameworks
- 9.2 Product, Service, Safety and Quality Requirements
- 9.3 Government Policies, Incentives and Subsidies
- 9.4 Imports, Exports and Trade Barriers
- 9.5 Public Procurement and Local Content Requirements
- 9.6 Environmental and Sustainability Compliance
- 9.7 Upcoming Policy Changes and Market Implications
Chapter 10 Asia-Pacific Tempeh Market Hotspots and Opportunities
- 10.1 Market Opportunity Mapping and Growth Hotspots
- 10.2 High-Growth Applications and Customer Groups
- 10.3 Underserved Markets and White-Space Opportunities
- 10.4 Emerging Technology and Product Opportunities
- 10.5 New Capacity and Investment Hotspots
- 10.6 Market Entry and Expansion Opportunities
- 10.7 Distribution and Partnership Opportunities
- 10.8 Near-Term and Long-Term Commercial Potential
- 10.9 Opportunity Attractiveness and Execution Risks
Chapter 11 Asia-Pacific Tempeh Market Outlook, 2025-2035
- 11.1 Market Size and Analysis
- 11.1.1 Revenue (Market Measurement: 2025: USD 1.39 billion → 2035: USD 2.26 billion)
- 11.1.2 Market Volume and Quantity Sold
- 11.1.3 Historical Market Size, 2018-2025
- 11.1.4 Base-Year Market Size, 2025
- 11.2 Market Forecast, 2025-2035
- 11.2.1 Revenue Forecast to 2035
- 11.2.2 Volume Forecast to 2035
- 11.2.3 CAGR and Year-on-Year Growth
- 11.2.4 Incremental Revenue Opportunity
- 11.3 Forecast Assumptions and Scenario Analysis
- 11.3.1 Base-Case Forecast
- 11.3.2 Optimistic and Conservative Scenarios
- 11.3.3 Technology, Pricing and Policy Sensitivities
- 11.4 Market Attractiveness and Growth Outlook
Chapter 12 Asia-Pacific Tempeh Market Segmentation and Outlook
- 12.1 Segmentation Summary and Market Shares, 2025
- 12.2 Largest and Fastest-Growing Segments
- 12.3 By Product Type - Market Size and Forecast, 2025-2035
- 12.3.1 Segment Definition and Scope
- 12.3.2 Historical Market Size, 2018-2025
- 12.3.3 Revenue Forecast, 2025-2035
- 12.3.4 Volume Forecast, 2025-2035
- 12.3.5 Base-Year Market Share, 2025
- 12.3.6 Segment CAGR and Growth Drivers
- 12.3.7 Subsegment Market Size and Forecast
- 12.3.7.1 Fresh Tempeh
- 12.3.7.2 Frozen Tempeh
- 12.3.7.3 Prepared Tempeh Meals
- 12.3.7.4 Tempeh Snacks
- 12.3.8 Subsegment Pricing and Adoption Trends
- 12.3.9 Leading Suppliers and Competition
- 12.3.10 Regional Demand and Opportunities
- 12.4 By Customer Type - Market Size and Forecast, 2025-2035
- 12.4.1 Segment Definition and Scope
- 12.4.2 Historical Market Size, 2018-2025
- 12.4.3 Revenue Forecast, 2025-2035
- 12.4.4 Volume Forecast, 2025-2035
- 12.4.5 Base-Year Market Share, 2025
- 12.4.6 Segment CAGR and Growth Drivers
- 12.4.7 Subsegment Market Size and Forecast
- 12.4.7.1 Households
- 12.4.7.2 Hospitality Operators
- 12.4.7.3 Meal Programme Operators
- 12.4.7.4 Food Manufacturers
- 12.4.8 Subsegment Pricing and Adoption Trends
- 12.4.9 Leading Suppliers and Competition
- 12.4.10 Regional Demand and Opportunities
- 12.5 By Technology - Market Size and Forecast, 2025-2035
- 12.5.1 Segment Definition and Scope
- 12.5.2 Historical Market Size, 2018-2025
- 12.5.3 Revenue Forecast, 2025-2035
- 12.5.4 Volume Forecast, 2025-2035
- 12.5.5 Base-Year Market Share, 2025
- 12.5.6 Segment CAGR and Growth Drivers
- 12.5.7 Subsegment Market Size and Forecast
- 12.5.7.1 Live-Culture Fermentation
- 12.5.7.2 Post-Fermentation Pasteurisation
- 12.5.7.3 Post-Fermentation Cooking
- 12.5.8 Subsegment Pricing and Adoption Trends
- 12.5.9 Leading Suppliers and Competition
- 12.5.10 Regional Demand and Opportunities
- 12.6 By Zone - Market Size and Forecast, 2025-2035
- 12.6.1 Segment Definition and Scope
- 12.6.2 Historical Market Size, 2018-2025
- 12.6.3 Revenue Forecast, 2025-2035
- 12.6.4 Volume Forecast, 2025-2035
- 12.6.5 Base-Year Market Share, 2025
- 12.6.6 Segment CAGR and Growth Drivers
- 12.6.7 Subsegment Market Size and Forecast
- 12.6.7.1 Indonesia
- 12.6.7.2 Malaysia and Singapore
- 12.6.7.3 Australia and New Zealand
- 12.6.7.4 North and Remaining Asia
- 12.6.8 Subsegment Pricing and Adoption Trends
- 12.6.9 Leading Suppliers and Competition
- 12.6.10 Regional Demand and Opportunities
- 12.7 Segment Growth Comparison
- 12.8 Segment Attractiveness and Priority Matrix
Chapter 13 Asia-Pacific Tempeh End-Use and Application Market Outlook
- 13.1 End-Use Industry and Customer Demand Structure
- 13.2 Leading Applications and Customer Groups
- 13.3 End-Use Market Size, Share and Forecast
- 13.4 Major End-Use Industry Deep Dives
- 13.4.1 Customer Requirements and Use Cases
- 13.4.2 Demand and Replacement Cycles
- 13.4.3 Technical and Regulatory Considerations
- 13.4.4 Purchasing and Procurement Models
- 13.4.5 Leading Vendors and Distribution Channels
- 13.4.6 Forecast and Commercial Opportunities
- 13.5 Emerging Applications and Cross-Segment Demand
- 13.6 End-Use Industry Investment Priorities
Chapter 14 Asia-Pacific Tempeh Geographic Market Outlook, 2025-2035
- 14.1 Regional Market Size and Country-Level Shares, 2025
- 14.2 Country Market Size Comparison, 2025
- 14.3 Country Market Forecasts, 2025-2035
- 14.4 Subregional Industrial and Demand Clusters
- 14.5 Intra-Regional Pricing and Cost Differences
- 14.6 Cross-Border Trade and Supply Networks
- 14.7 Regional Supply and Demand Balances
- 14.8 Country Opportunity Comparison and Prioritization
Note: Every listed country is covered on the structure shown under the first country.
Chapter 15 Asia-Pacific Tempeh Technology, Innovation and Sustainability Outlook
- 15.1 Technology Landscape and Maturity
- 15.2 Product, Process and Service Innovation
- 15.3 AI, Automation and Digital Tools in the Industry
- 15.4 Technology Adoption and Performance Benchmarking
- 15.5 Innovation Pipeline and R&D Investment
- 15.6 Patent and Intellectual Property Trends
- 15.7 Energy Efficiency and Resource Management
- 15.8 Sustainability, Recycling and Circularity
- 15.9 Technology Roadmap, 2025-2035
- 15.10 Risks of Obsolescence and Technology Substitution
Chapter 16 Asia-Pacific Tempeh Market Key Strategic Imperatives
- 16.1 Growth and Market Entry Priorities
- 16.2 High-Return Products and Segments
- 16.3 Pricing, Profitability and Cost Optimization
- 16.4 Technology Investment and Product Differentiation
- 16.5 Supply Chain Localization and Resilience
- 16.6 Distribution and Customer Acquisition
- 16.7 Partnership, Acquisition and Capacity Strategy
- 16.8 Regional Expansion Priorities
- 16.9 Short-, Medium- and Long-Term Actions
Chapter 17 Competition Outlook
- 17.1 Industry Competition Characteristics
- 17.2 Market Structure and Concentration
- 17.3 Market Share and Competitive Positioning, 2025
- 17.4 Company-Wise Revenue and Product Benchmarking
- 17.5 Production and Service Capacity Benchmarking
- 17.6 Technology, Pricing and Differentiation
- 17.7 Regional Footprint and Distribution Strength
- 17.8 Mergers, Acquisitions and Strategic Alliances
- 17.9 New Entrants and Competitive Threats
- 17.10 Porter's Five Forces and Industry Attractiveness
- 17.11 Competitive Outlook, 2025-2035
Chapter 18 Company Profiles
- 18.1 Company Coverage and Selection Criteria
- 18.2 Rumah Tempe Azaki
- 18.2.1 Business Description
- 18.2.2 Company Ownership and Geographic Presence
- 18.2.3 Product and Service Portfolio
- 18.2.4 Manufacturing and Operating Footprint
- 18.2.5 Production Capacity and Expansion Plans
- 18.2.6 Financial Performance and Investment
- 18.2.7 Market Share and Competitive Position
- 18.2.8 Technology and Innovation Capabilities
- 18.2.9 Strategic Alliances or Partnerships
- 18.2.10 Recent Developments
- 18.2.11 Growth Strategy and Outlook
- 18.3 Rumah Tempe Indonesia
- 18.4 Nutrisoy
- 18.5 Mighty Bean Soyfoods
- 18.6 PrimaSoy
- 18.7 Chalmers Organics (TONZU)
- 18.8 Angie's Tempeh
- 18.9 Truly Gourmet
- 18.10 Tempeh Today
- 18.11 Other Relevant Market Participants
Note: Every listed company is profiled on the structure shown under the first company. The company list is preliminary and may change based on research findings, market developments, data availability and client requirements.
Chapter 19 Disclaimer
- 19.1 Research and Forecast Disclaimer
- 19.2 Data Source and Estimation Limitations
Note: The depth of individual sections depends on data availability for this market. Volume, capacity, trade and other unit-based metrics are included where applicable.

