
Asia Pacific seasoning and spices move to branded formats
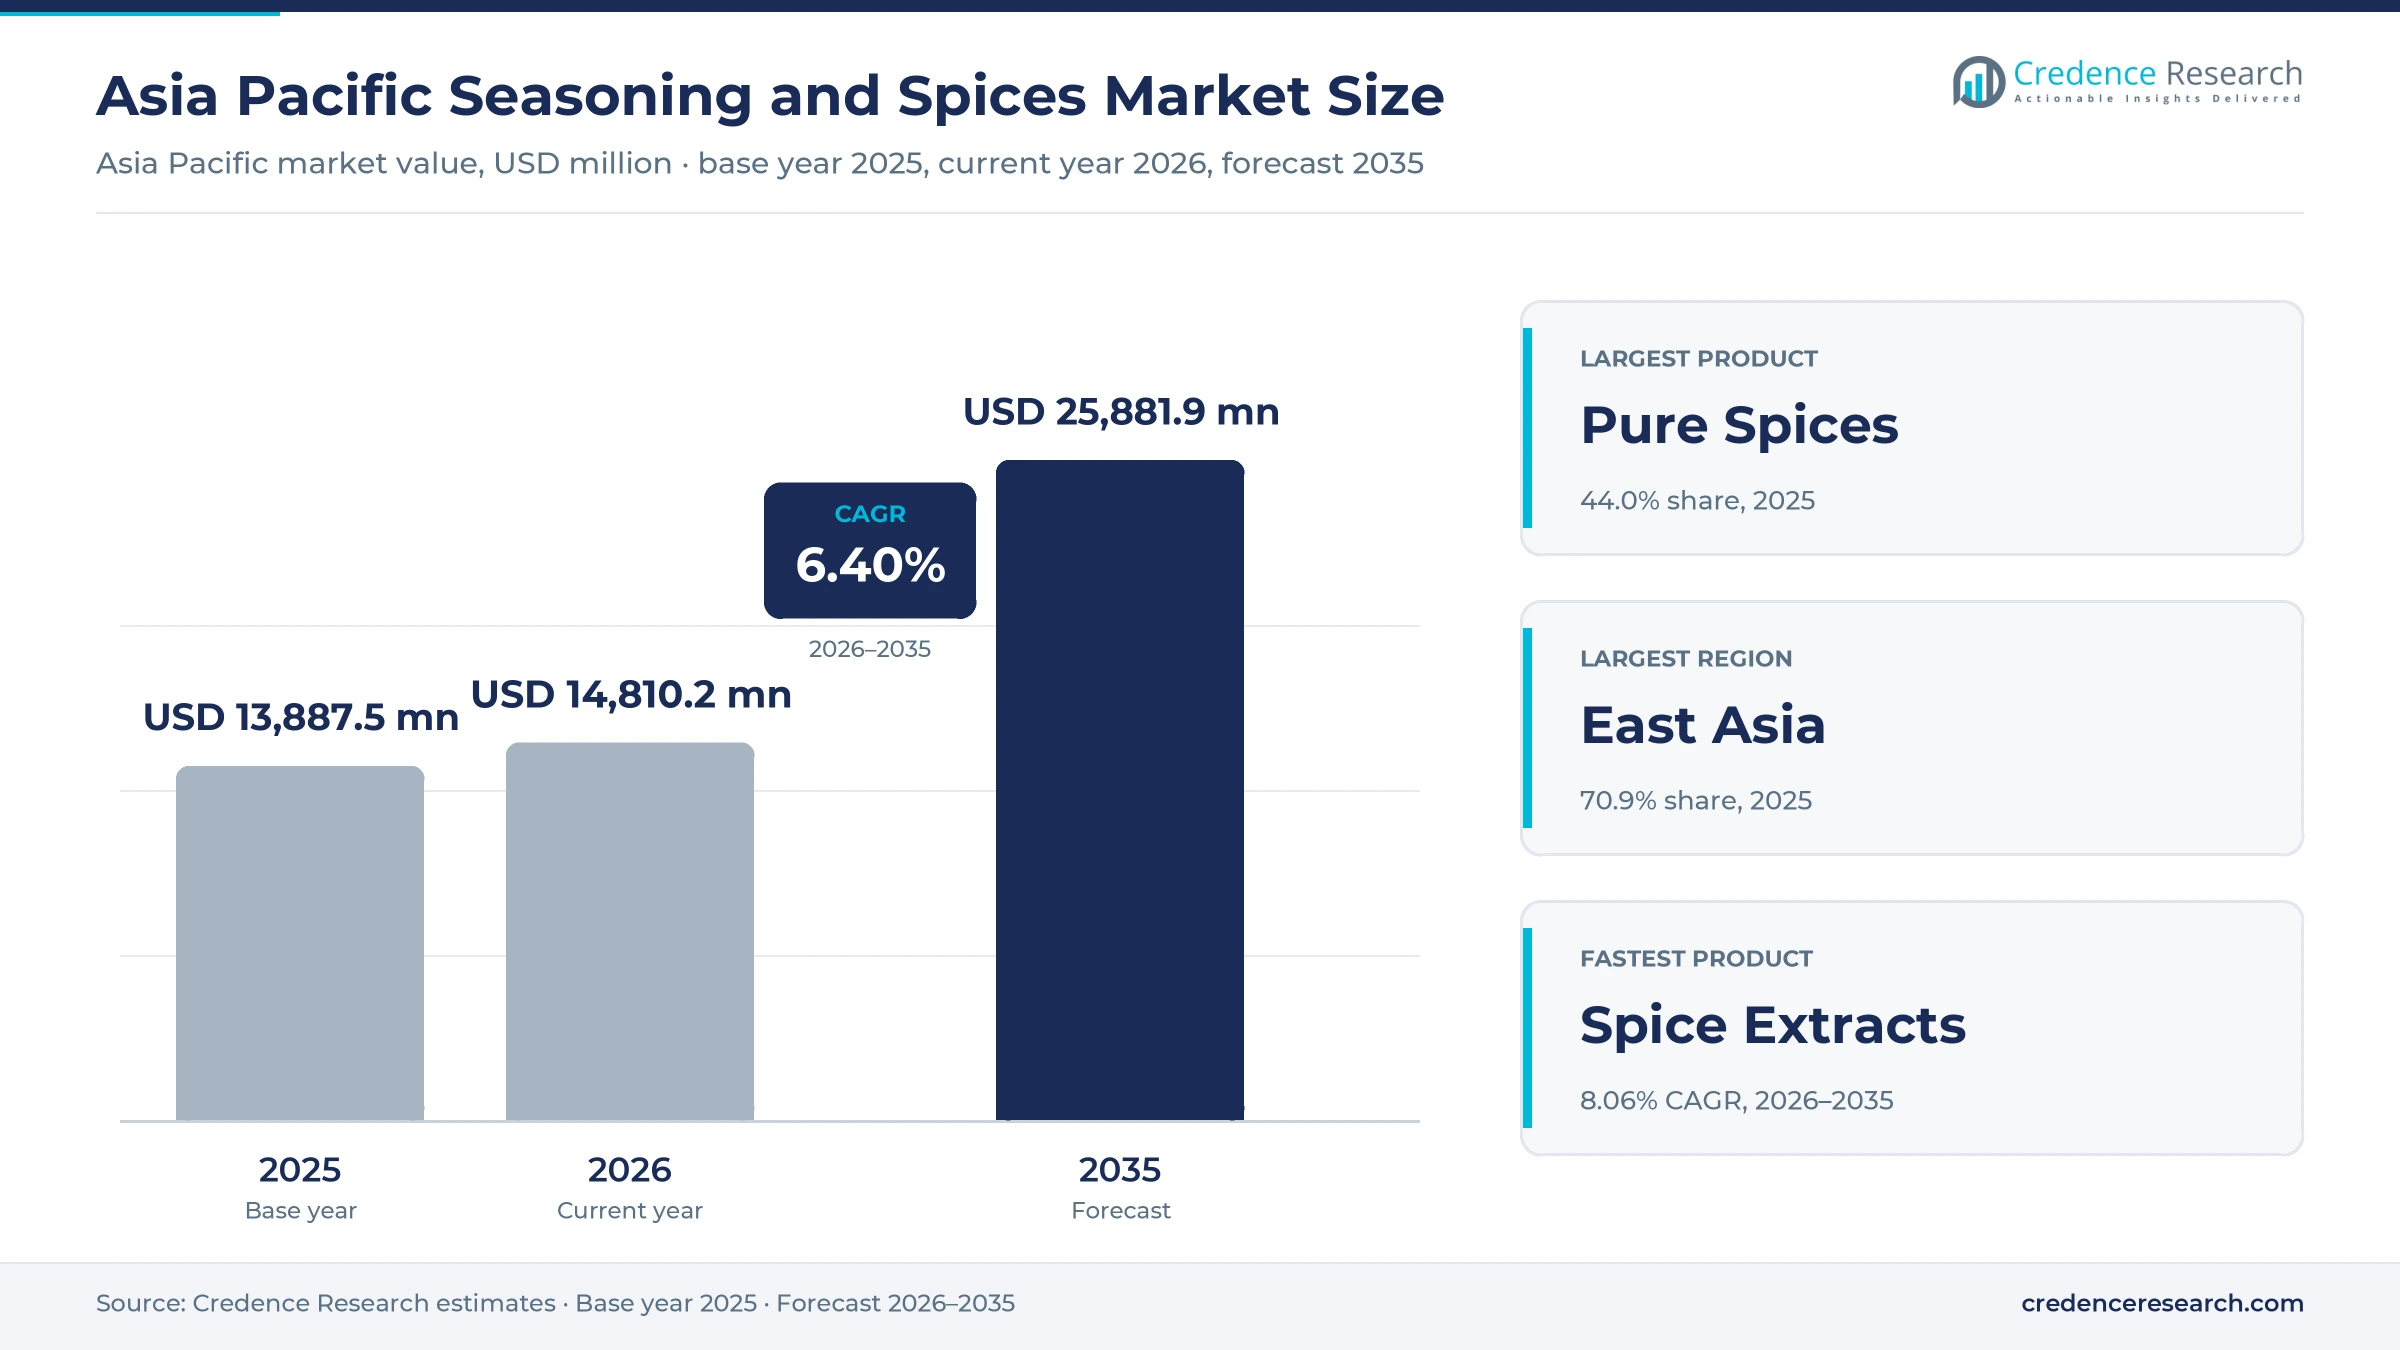
The Asia Pacific seasoning and spices market was valued at USD 13.89 billion in 2025 and is projected to increase from USD 14.81 billion in 2026 to USD 25.88 billion by 2035, registering a CAGR of 6.40% during 2026–2035. Demand comes from households replacing loose ingredients with branded blends, food manufacturers buying to tighter flavor specifications, and restaurants that want consistent regional dishes at scale. East Asia held the largest regional share, 70.9% in 2025, supported by Japanese curry and umami seasoning groups and by large Chinese supply. South Asia is the fastest-growing region at 7.73% a year, as packaged products take share from unbranded spice sold loose. The main commercial change is a stricter safety regime, because the 2024 ethylene oxide cases in Hong Kong and Singapore pushed exporters toward steam sterilization, residue testing and traceable sourcing across the supply chain.
What does this regional market include and exclude?
The market counts dried pure spices, blended masalas and curry bases, umami seasonings such as monosodium glutamate and nucleotide blends, and spice extracts sold to households, food manufacturers, foodservice operators and nutraceutical manufacturers. Buyers purchase through grocery wholesalers, retail chain procurement, digital commerce and direct ingredient contracts, and value is stated at the manufacturer and importer level.
Fresh herbs sold as produce, liquid soy and table sauces, cooking salt and non-food uses of spice oils fall outside the definition. The value chain runs from growers and origin traders through cleaning, sterilization, grinding and extraction to brand owners, with export trade from India and Vietnam linking the origin countries to processors elsewhere.
Asia Pacific Seasoning and Spices Market Insights
- The market is set to grow from USD 13.89 billion in 2025 to USD 25.88 billion by 2035, a 6.40% CAGR that reflects a steady shift toward packaged and processed formats.
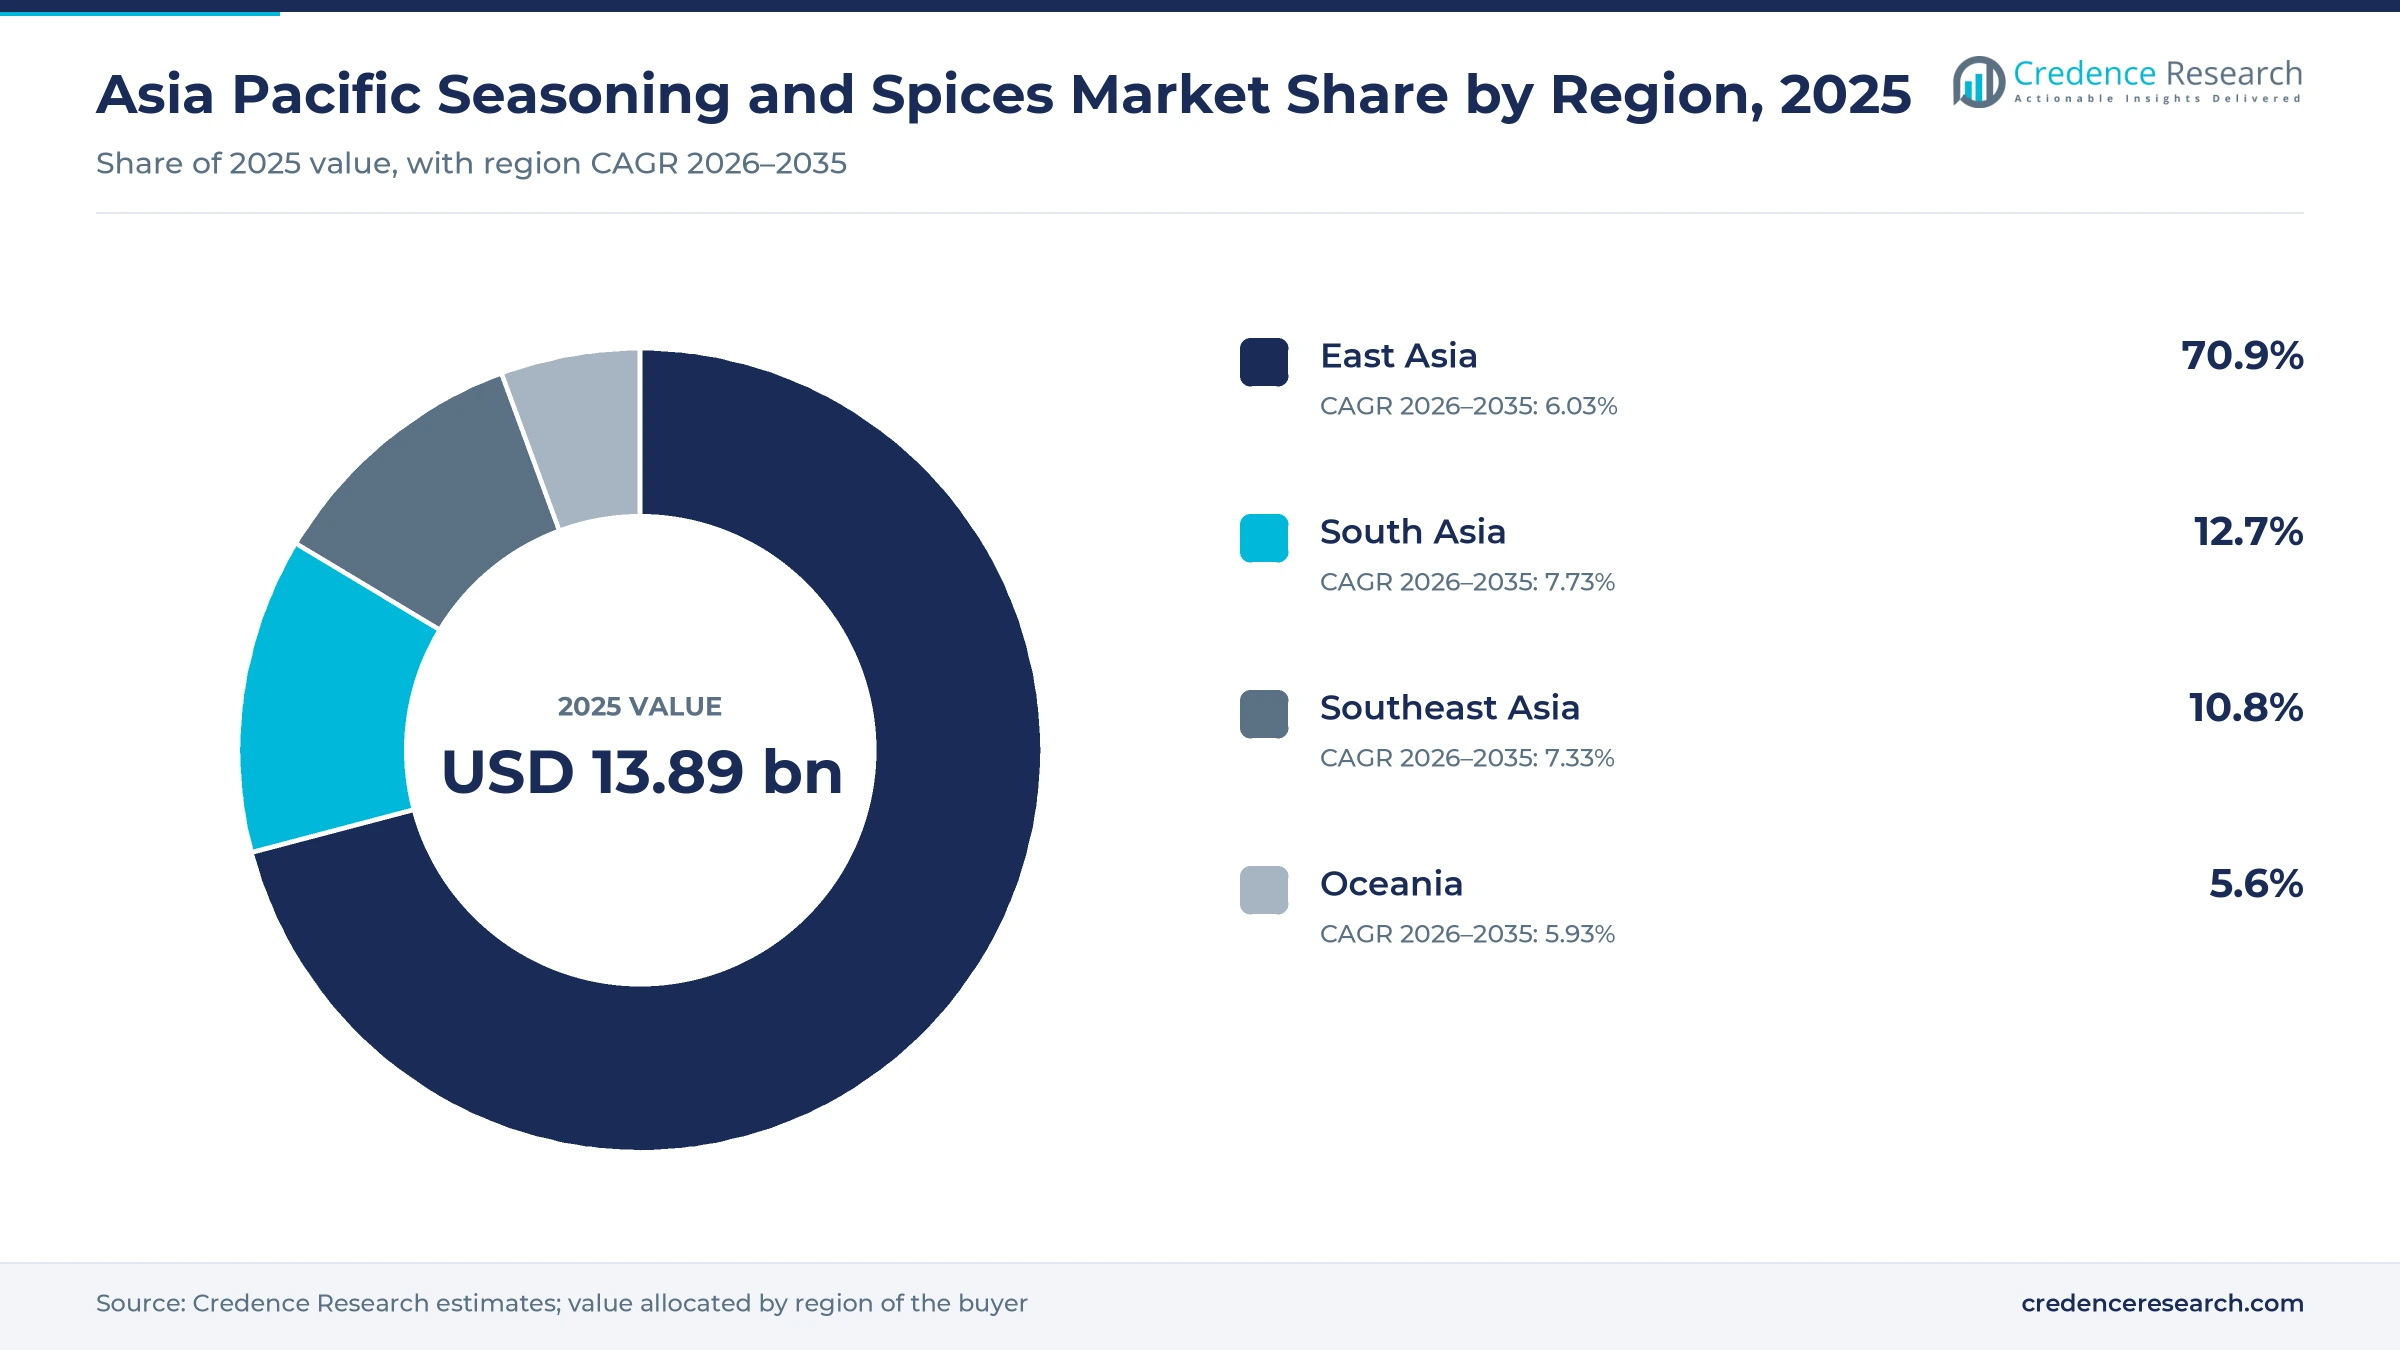
- East Asia held 70.9% of 2025 value, supported by Japanese curry and umami groups and by China, the largest spice exporter in 2023 at USD 8 billion.
- Pure Spices led the product mix with 44.0% of 2025 value, because cooking in South and Southeast Asia still begins with single ingredients.
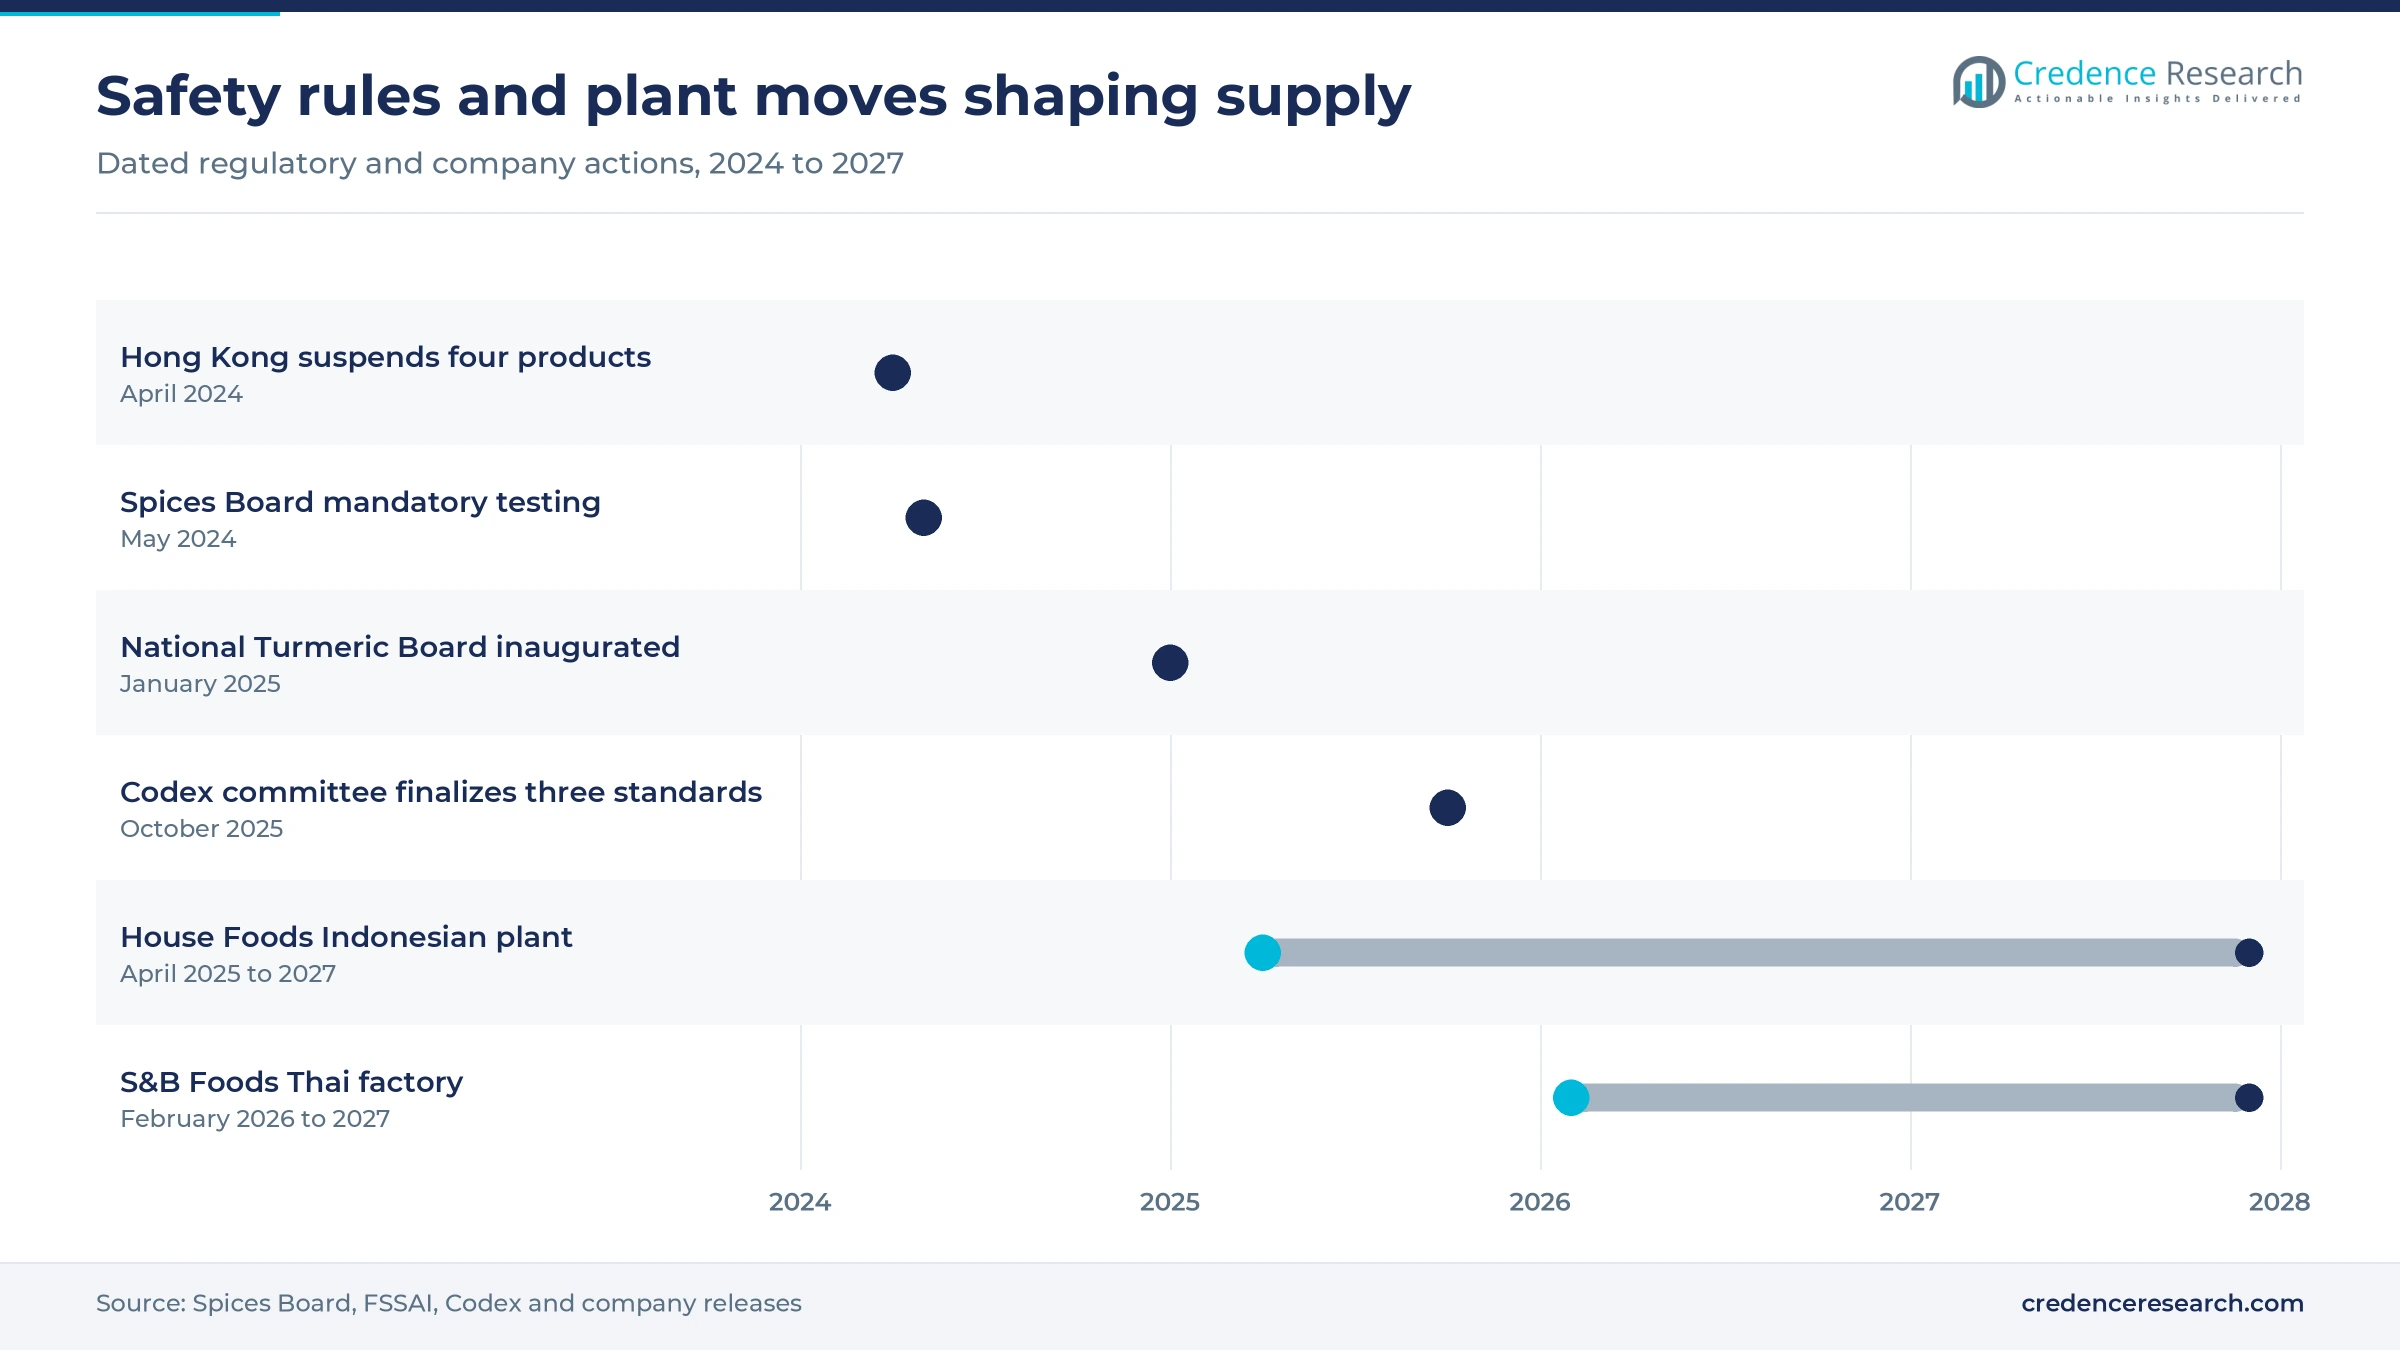
- The Spices Board made ethylene oxide testing mandatory on May 7, 2024, for shipments to Singapore and Hong Kong, which moved sterilization and residue control to the center of supplier selection.
- House Foods and S&B Foods are both building halal curry capacity in Southeast Asia for 2027, showing that Japanese groups now treat the region as a production base.
Pure spices lead while extracts grow fastest
Why do pure spices still anchor the product mix?
Based on product type, the market is categorized into pure spices, blended spices, umami seasonings and spice extracts. Pure Spices led with 44.0% of 2025 value because household and industrial recipes still start from single ingredients, and the Vietnam Pepper and Spice Association counted more than 246,000 tons of pepper exports in 2025. Spice Extracts grow fastest at 8.06% a year as Spices Board data put spice oils and oleoresins at 12% of India's 2025-26 export earnings. Umami products face a tougher cycle, since Ajinomoto reported oversupply from major Chinese manufacturers in its fiscal 2025 first half.
Which buyers shape purchasing decisions most?
Based on customer type, the market is categorized into households, food manufacturers, foodservice operators and nutraceutical manufacturers. Households led with 47.0% of 2025 value because daily cooking remains the core use, and Orkla India's offer documents described urban areas as at least 65% of packaged food demand, according to Business Standard in June 2025. Nutraceutical Manufacturers grow fastest at 8.23% a year as India's National Turmeric Board, inaugurated on Jan. 14, 2025, has an objective of encouraging clinical research into medicinal and wellness properties, according to a Commerce Ministry reply to Parliament dated April 1, 2025.
How far has digital commerce moved the channel mix?
Based on distribution channel, the market is categorized into grocery wholesalers, retail chain procurement, digital commerce and direct ingredient contracts. Grocery Wholesalers led with 46.0% of 2025 value because small shops still dominate Indian grocery, and an SBI Securities note showed general trade at 79.3% of Orkla India's domestic sales in fiscal 2025. Digital Commerce grows fastest at 9.32% a year as the same note showed e-commerce and quick commerce rising from 7.5% in fiscal 2025 to 8.6% in the following first quarter, after growing at a 100% annual rate across fiscal 2023 to 2025.
Why is validated microbial reduction gaining share?
Based on processing technology, the market is categorized into conventional dry processing, validated microbial reduction and extraction processing. Conventional Dry Processing led with 72.0% of 2025 value because cleaning, drying and grinding remain the base route for most of the 1.73 million tons India exported in 2025-26. Validated Microbial Reduction grows fastest at 8.17% a year as Spices Board guidelines reported in May 2024 recommended steam sterilization and irradiation in place of ethylene oxide. AVT McCormick Ingredients in Kochi, for example, says it steam sterilizes spices in sterilizers validated to U.S. FDA microbial reduction protocols.
| Segment Group | Leading Sub-segment | Share, 2025 | Fastest-growing Sub-segment | CAGR, 2026–2035 |
|---|---|---|---|---|
| By Product Type | Pure Spices | 44.0% | Spice Extracts | 8.06% |
| By Customer Type | Households | 47.0% | Nutraceutical Manufacturers | 8.23% |
| By Distribution Channel | Grocery Wholesalers | 46.0% | Digital Commerce | 9.32% |
| By Processing Technology | Conventional Dry Processing | 72.0% | Validated Microbial Reduction | 8.17% |
Request a Free Sample
Fill in your details and we'll send you a free sample report.
- Sample data tables & charts
- Research methodology
Recipes, flavor specifications and plants drive value
How does recipe standardization lift branded volume?
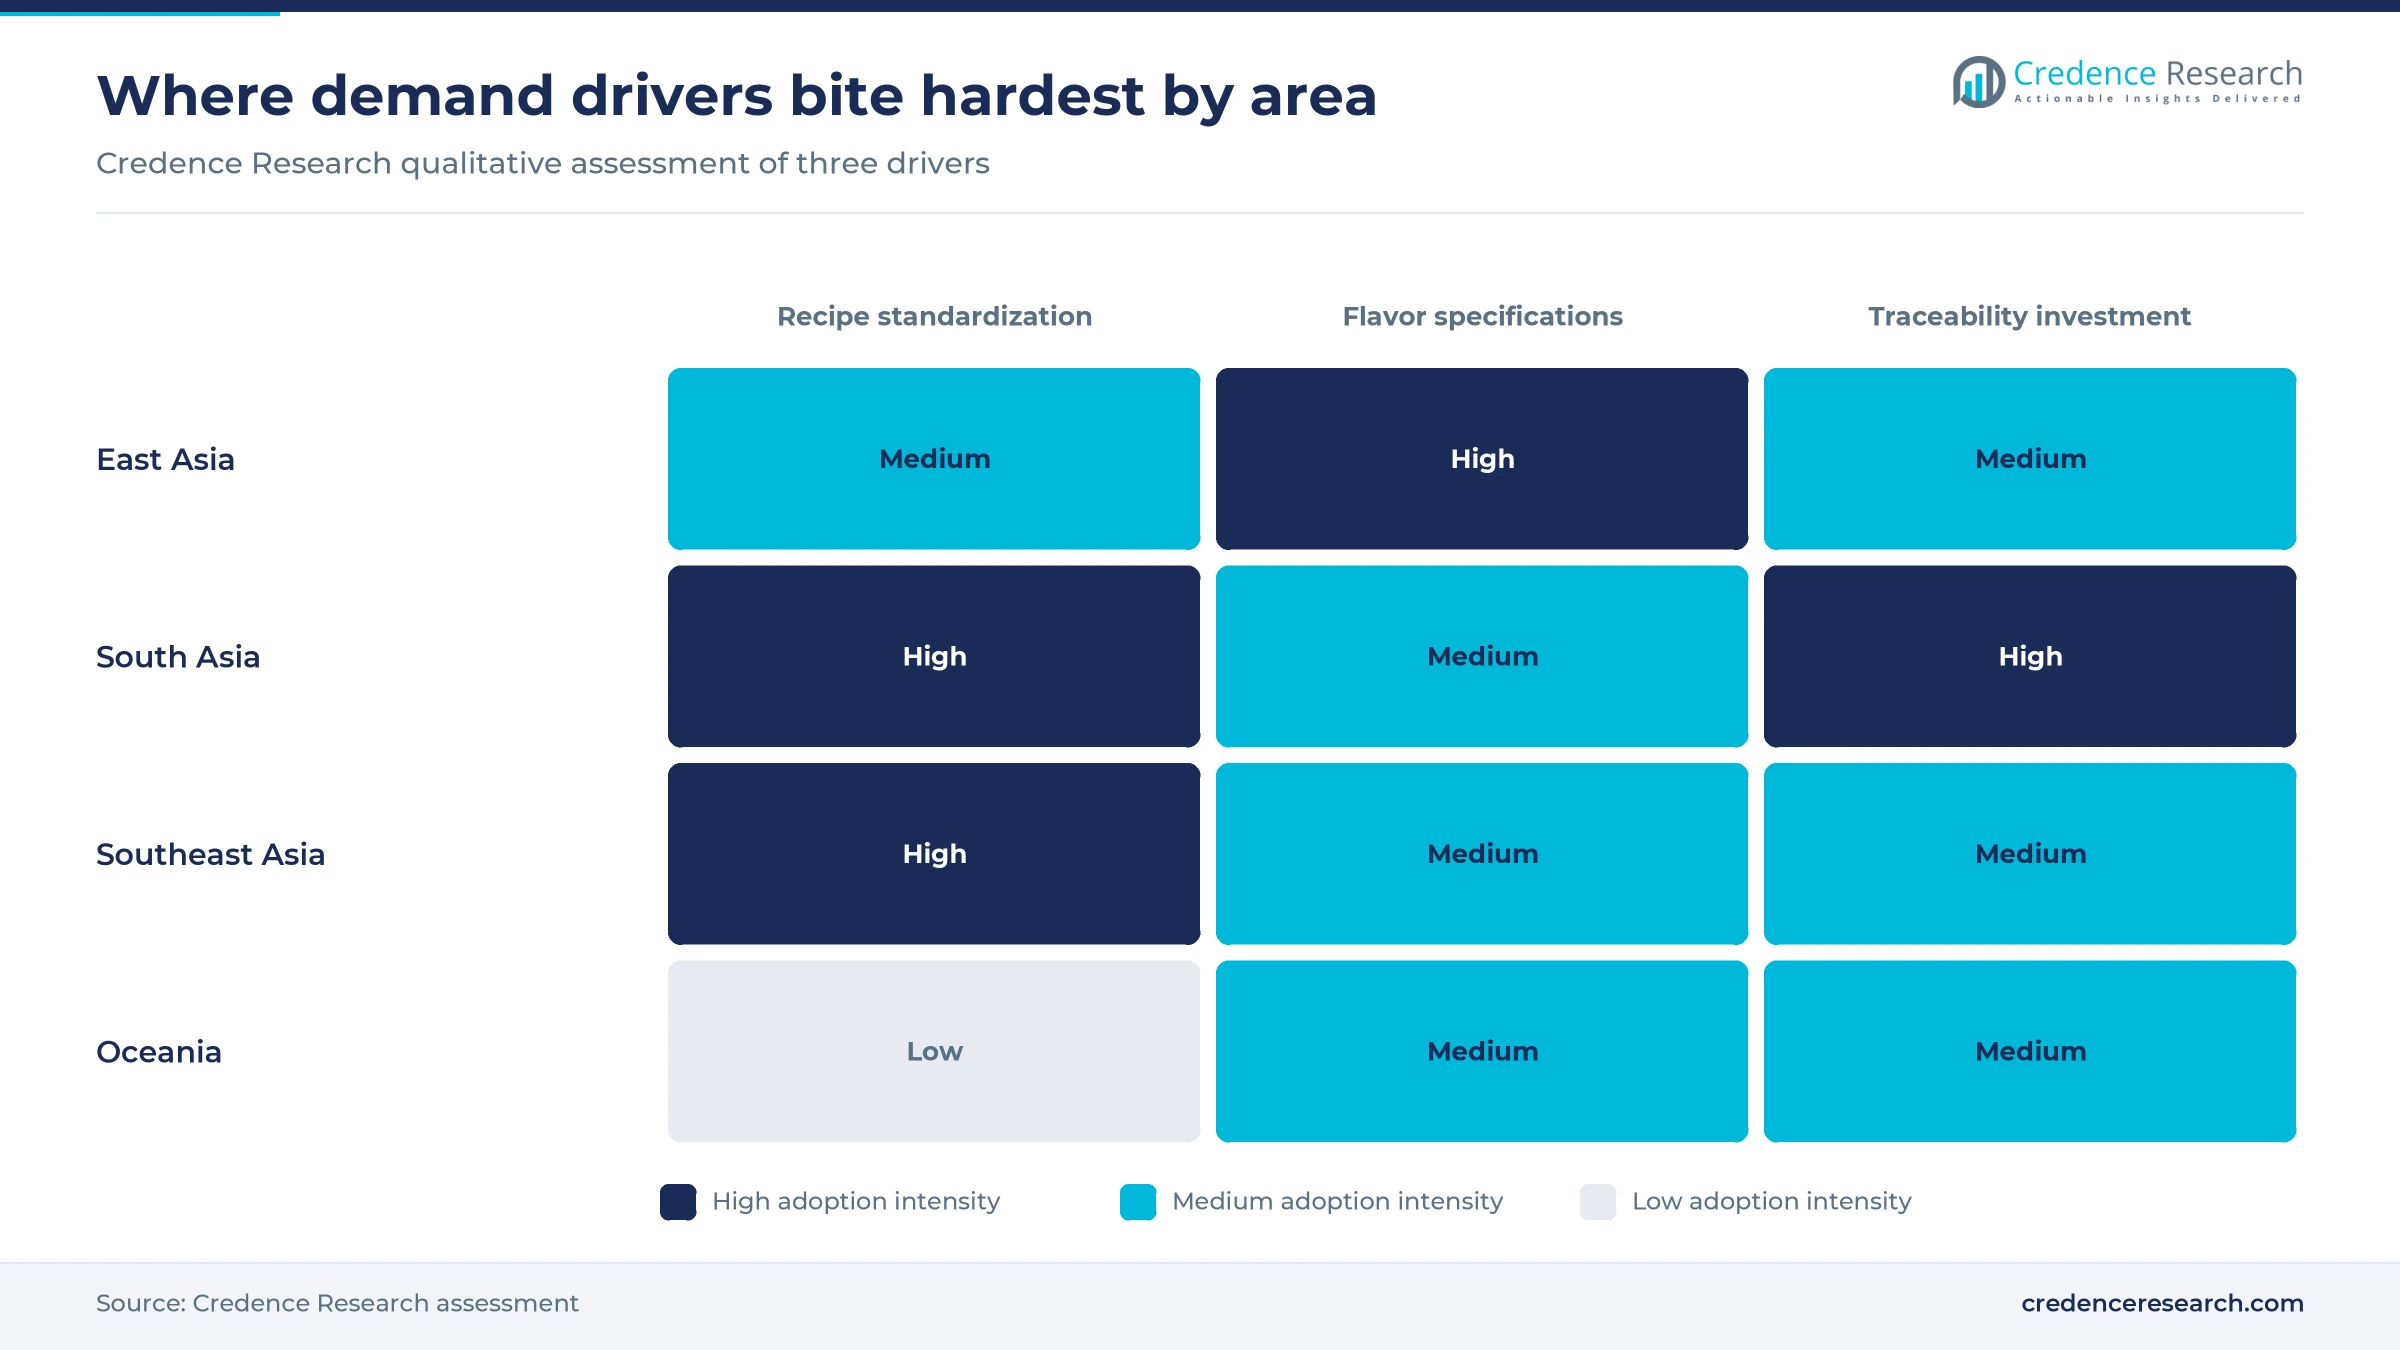
Regional recipe standardization moves cooking from home grinding toward branded blends that reproduce a local dish the same way each time. An SBI Securities note dated Oct. 27, 2025, put packaged products at about 40% of India's domestic spice market in 2024, with about 45% projected for 2029. DS Group applied the same logic on May 7, 2026, when it added Jeeravan and Podi masala to a Catch range of more than 140 variants, according to PTI. ITC's May 2020 agreement to buy Sunrise Foods rested on similar reasoning, since the brand's range was tailored to tastes in eastern India. Taken together, these moves show brand owners competing on regional accuracy rather than on commodity price.
Why do food manufacturers now buy to tighter specifications?
Food manufacturers are the second pillar of demand because packaged recipes need the same flavor and microbial profile in every batch. USDA Foreign Agricultural Service reporting in April 2024 put India's food industry output at USD 400 billion in 2023, and it projected packaged food and beverages to rise from USD 33.7 billion in 2023 to USD 46.3 billion by 2028. Business Standard reported Orkla India's estimate that the country's packaged food market would expand at 11.0% a year through fiscal 2029. This growth raises the need for savory flavor systems and for suppliers that can document origin. As a result, Validated Microbial Reduction is rising at 8.17% a year in the Credence Research model.
What is plant and traceability investment adding?
Processing and traceability investment adds value because cleaner, better documented product earns contracts that commodity lots cannot win. MDH planned a Rs 150 crore spice unit on 16 acres in Ujjain, Madhya Pradesh, according to Agro & Food Processing in March 2024. Orkla India ran nine owned facilities with 182,270 tons of annual capacity as of June 2025, according to SBI Securities. On the public side, India's SPICED scheme carries a Rs 422.30 crore outlay through fiscal 2025-26, according to the Press Information Bureau. Vietnam is also developing a digital map of its spice-growing areas, according to Voice of Vietnam in August 2025, which gives buyers a clearer view of farm origin.
How does origin scale keep regional supply competitive?
Neighboring origins give the region's largest buyers deep supply over relatively short trade routes. The Spices Board reported Indian exports of 17.34 lakh tons worth USD 4,430.90 million in 2025-26, with chili at 27% and cumin at 12% of earnings. Vietnam added more than USD 2.12 billion of spice exports in 2025, up 20.1%, according to the Vietnam Pepper and Spice Association. The Global Trade Research Initiative ranked China as the top exporter in 2023 at USD 8 billion of a USD 35 billion world trade, according to Business Standard. Because these origins sit inside the region, processors in Japan, Australia and Southeast Asia face shorter supply lines than buyers elsewhere.
Sterilization, quick commerce and halal reshape supply
Shift from fumigation to validated sterilization
A shift from chemical fumigation to validated sterilization is the clearest technical trend in the regional supply chain. Spices Board guidelines reported by PTI on May 10, 2024, told exporters not to use ethylene oxide and to list it as a hazard in their food safety plans. Steam sterilization and irradiation were named as the alternatives, and Australia and New Zealand already allow irradiation of herbs and spices at 2 to 30 kilogray under Standard 1.5.3. The Codex spice committee added momentum at Guwahati in October 2025, when it finalized large cardamom, vanilla and coriander standards and took its total to 19, according to the Press Information Bureau. Buyers can now compare suppliers against a clearer shared reference.
Rise of quick commerce in branded spices
Quick commerce is becoming a real route to market for branded spices in Indian cities, even though its base remains small. ITC drew 58% of its digital sales from quick commerce in fiscal 2026, and most fast-moving consumer goods companies reported 70% to 100% annual growth in the channel, according to Angel One in May 2026. DS Group says Catch leads on new-age retail platforms, and its May 2026 launch of pizza and pasta seasoning targeted that convenience-seeking shopper. ZOFF Foods told afaqs in October 2025 that about 90% of its sales come from e-commerce and quick commerce. The channel therefore gives newer brands a way around traditional distributor networks, and it rewards smaller pack sizes.
Opportunity in halal curry and seasoning capacity
Halal capacity in Southeast Asia is the clearest opening for regional groups that want to serve Muslim-majority markets from local plants. House Foods approved an Indonesian subsidiary on April 18, 2025, with 340.8 billion rupiah of capital and a plant at Kota Deltamas due to operate in 2027. S&B Foods has started a Thai factory for halal instant curry, with operations planned for the second half of fiscal 2027, according to Nippon Shokuhin Shimbun in February 2026. Ajinomoto proposed making its Malaysian unit wholly owned on June 22, 2026, for about 24.2 billion yen, and that unit has run halal-certified production since 1965. Local manufacture also shortens the certification path for exporters in those markets.
Opportunity in turmeric and bioactive extracts
Extracts offer an opening for processors that want more value per ton than dried spice can deliver. ThePrint reported in January 2025 that India holds more than 70% of world turmeric output and more than 62% of world trade, based on 10.74 lakh tons of production in 2023-24. India Seatrade News reported turmeric export value up 51% to USD 341 million in 2024-25, while spice oils and oleoresins rose 8% to USD 535.92 million. The National Turmeric Board, with an AYUSH ministry seat, now promotes health and wellness uses. Suppliers of curcumin-rich oleoresin can therefore position for nutraceutical contracts, which lifts Nutraceutical Manufacturers at 8.23% a year.
Residue rules and price swings test margins
How costly are residue failures for exporters?
Residue failures are the largest risk because they can close markets quickly, as the 2024 ethylene oxide cases showed. Hong Kong's Centre for Food Safety acted against four MDH and Everest products on April 5, 2024, according to Free Press Journal, and Singapore recalled an Everest fish curry mix, according to Deccan Herald. FSSAI then ordered nationwide testing of spice mix makers on May 2, 2024. Although the products involved were under 1% of Indian exports, according to the same newspaper, every exporter to those markets faced mandatory testing and higher compliance cost.
Why do raw material swings squeeze blenders?
Retail pack prices move far more slowly than origin prices, and that margin pressure falls on blenders. Vietnam's average pepper export price rose 28.3% to nearly USD 6,750 per ton in 2025, while volume fell 1.5%, according to the Vietnam Pepper and Spice Association. Indian chili moved the other way in 2024-25, with value down 11% despite volume up about 19%, according to India Seatrade News. Blenders manage this through forward cover, multi-origin sourcing and pack-size changes, though each adds working capital.
What does umami oversupply mean for suppliers?
Oversupply is pressing industrial umami margins because capacity has grown faster than demand. Ajinomoto's fiscal 2025 first-half presentation attributed lower glutamate and nucleotide revenue and profit to major Chinese manufacturers raising production and entering markets, and it created a dedicated collaboration department in April 2025 in response. Trade remedies add friction, as Vietnam imposed provisional duties of up to about USD 274 per ton on Chinese and Indonesian product in 2020, according to its trade ministry. Producers without brand outlets carry the most exposure in this cycle.
How do diverging food rules raise compliance cost?
One lot may need separate documentation for each destination, which adds cost and a barrier for smaller exporters. Indonesia set an Oct. 17, 2026, halal compliance deadline for Thai food exporters, and the Thai trade policy office flagged seafood seasoned with sauces or spices for closer attention, according to The Nation in August 2026. Australia's regulator had to clarify its irradiation wording in October 2019, after some imported herbs and spices were detained under narrow readings of the code. Smaller exporters absorb these costs least easily, which favors larger processors.
East Asia holds value as South Asia gains ground
| Region | Value, 2025 (USD billion) | Share, 2025 | CAGR, 2026–2035 |
|---|---|---|---|
| East Asia | 9.85 | 70.9% | 6.03% |
| South Asia | 1.76 | 12.7% | 7.73% |
| Southeast Asia | 1.50 | 10.8% | 7.33% |
| Oceania | 0.78 | 5.6% | 5.93% |
East Asia holds value through processed formats
East Asia held a 70.9% share of 2025 value and grows at 6.03% a year. The area buys processed formats at higher unit values than dried spice, which supports its lead. Ajinomoto reported Japanese sauce and seasoning volume at 94% of the prior year and unit prices at 113% in its fiscal 2025 first half, a pattern that lifts value without volume. House Foods reports a Japanese spice and seasoning business covering roux curry, retort curry and spice products. China adds supply depth as the largest spice exporter in 2023, according to the Global Trade Research Initiative.
South Asia gains as packaged products take share
South Asia held a 12.7% share of 2025 value and grows fastest at 7.73% a year. Packaged spice is replacing loose product there, which raises value per kilogram sold. India cultivates more than 60 of the 109 spices recognized by the International Organization for Standardization, according to the Press Information Bureau. Madhya Pradesh alone produced 3.63 million tons in 2023-24, the same source reports. Brands are also crossing borders, since DS Group announced in April 2026 a plan to widen Catch retail distribution in Nepal, with foodservice expansion targeted for fiscal 2026-27.
Southeast Asia pairs origin supply with new plants
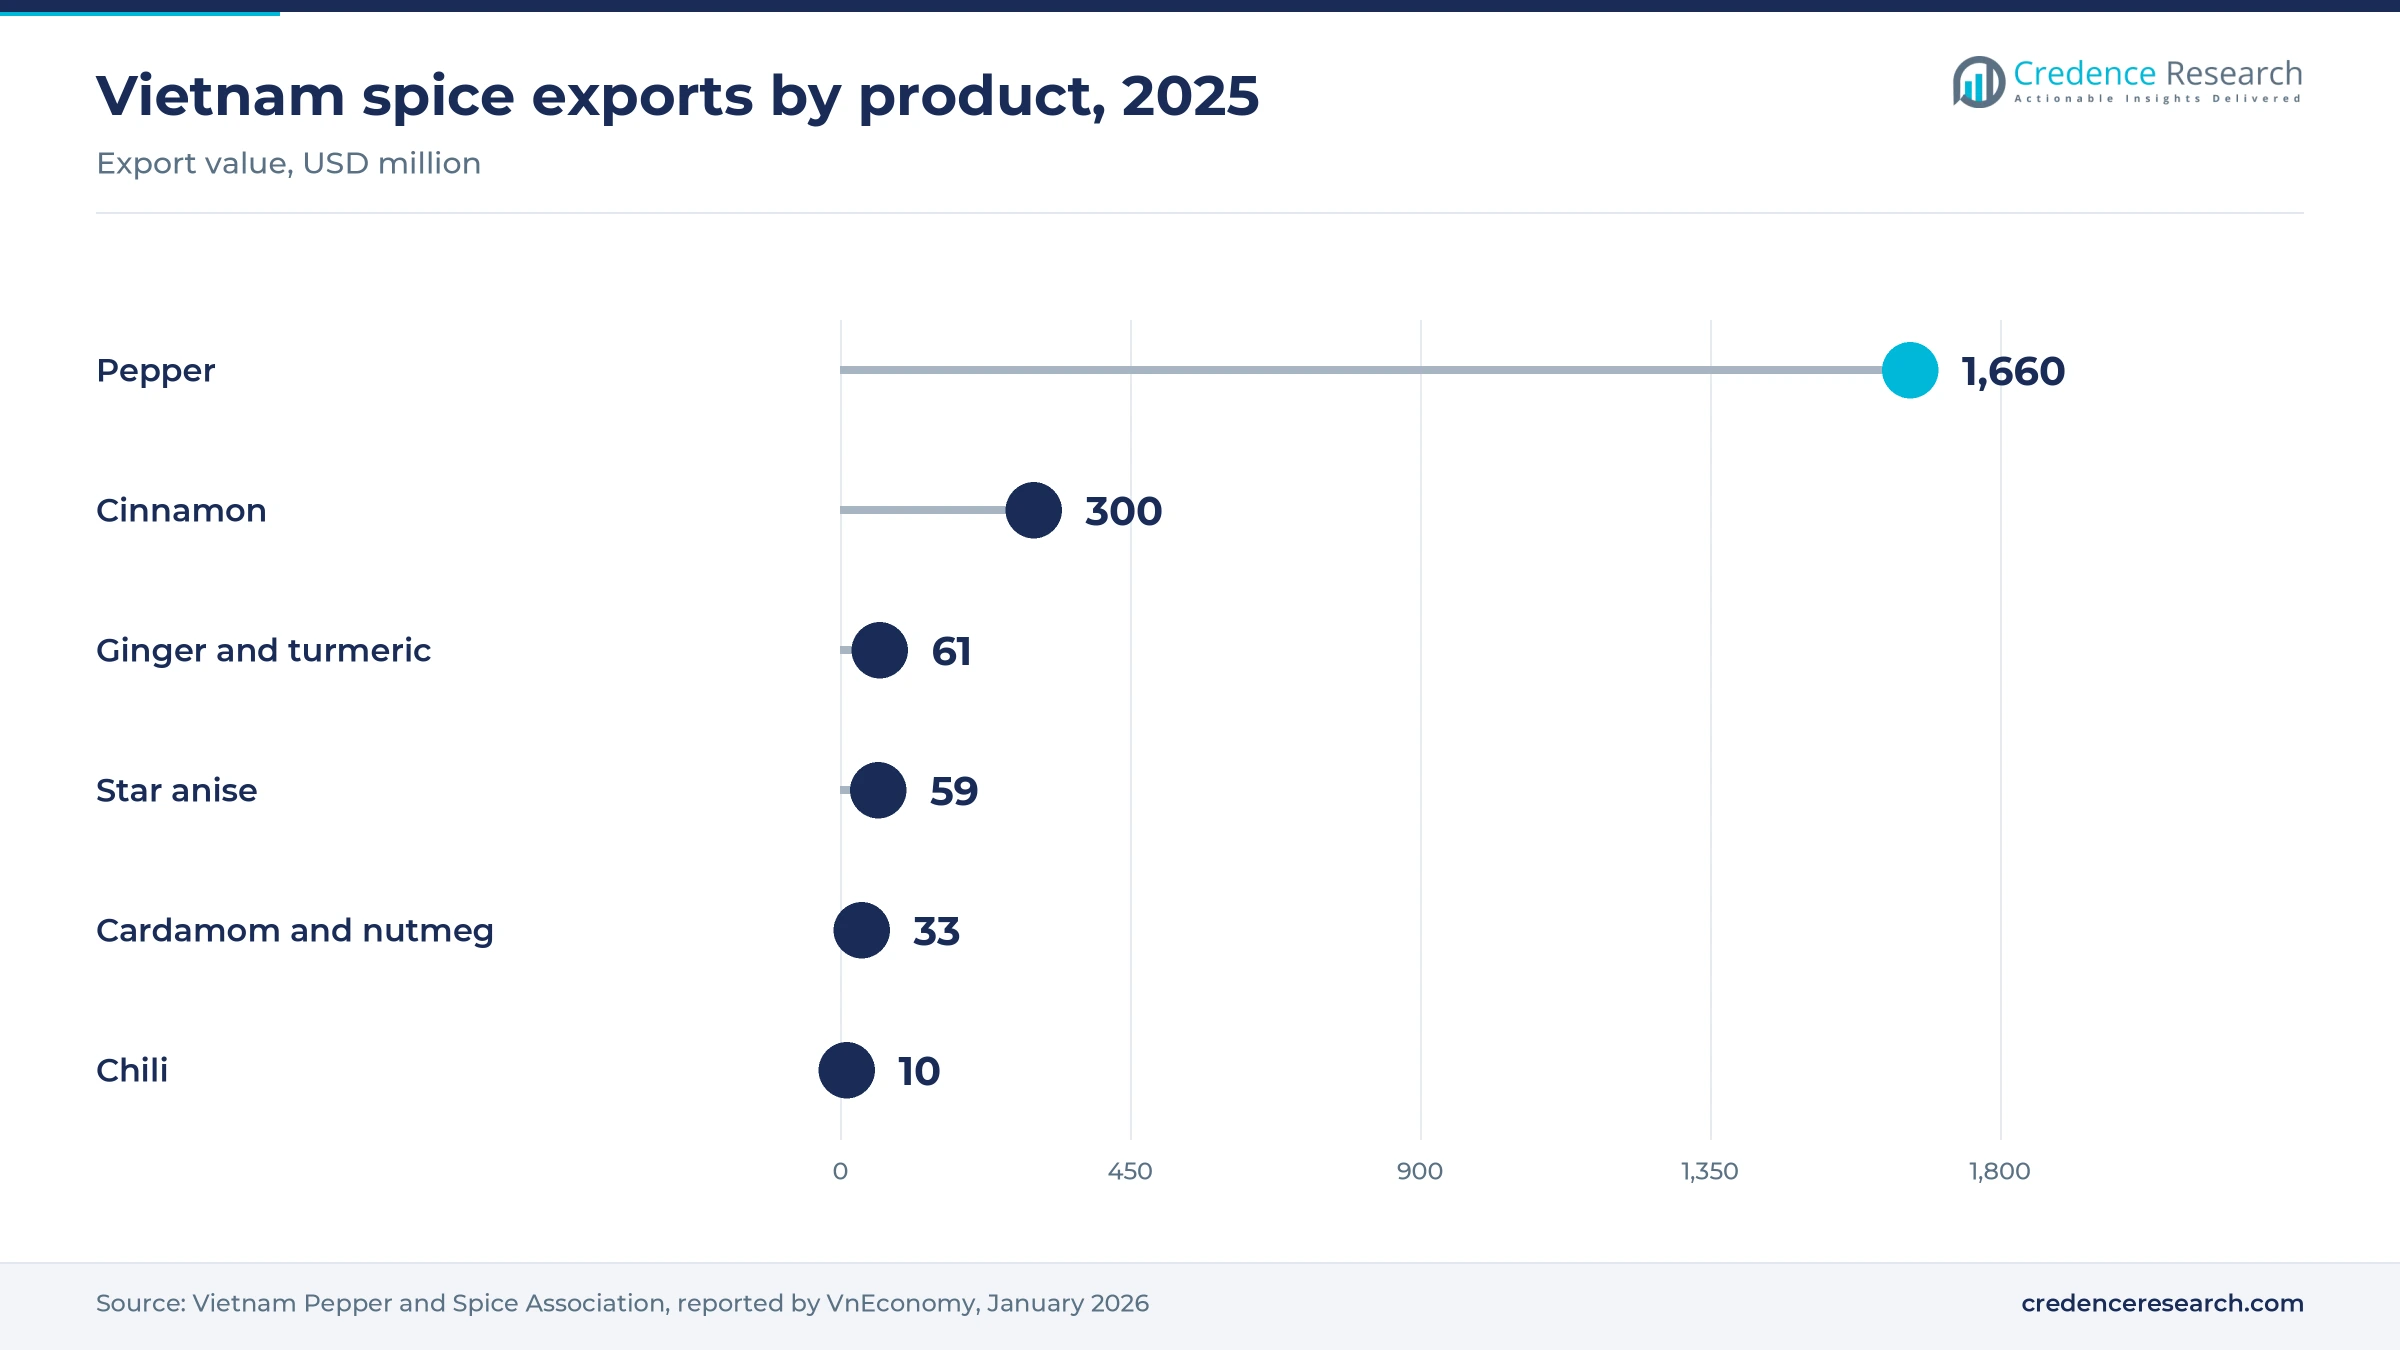
Southeast Asia held a 10.8% share of 2025 value and grows at 7.33% a year. The area combines origin supply with fresh processing investment, which keeps more value at home. Vietnam exported about USD 300 million of cinnamon and USD 1.66 billion of pepper in 2025, according to VnEconomy. House Foods expects its Indonesian curry roux plant to start in 2027, citing the popularity of Japanese-style curry in restaurants and rising dual-income households. Ajinomoto's Malaysian unit sells AJI-NO-MOTO and TUMIX and is expanding exports to the Middle East from its halal base.
Oceania relies on imports and irradiation rules
Oceania held 5.6% of 2025 value and grows at 5.93% a year, the slowest pace among the four areas, because its demand is mature and largely import-supplied. Australian imports of ginger, turmeric, curry and similar spices under HS 0910 were about USD 22 million in 2023, with India supplying 39% and China 10.4%, according to TrendEconomy trade data. The Standard 1.5.3 irradiation permission gives importers a recognized route for bacterial decontamination, which supports food manufacturers that need low-microbial ingredients.
Plants, Standards and rules that changed since 2024
| Development | Status and market relevance |
|---|---|
| In May 2024, the Spices Board made ethylene oxide testing mandatory for shipments to Singapore and Hong Kong. | In force, and followed by exporter guidelines that recommend steam sterilization and irradiation. |
| In January 2025, India inaugurated the National Turmeric Board, with its headquarters in Nizamabad, Telangana. | Operating, with research into medicinal and wellness properties among its stated objectives. |
| In April 2025, House Foods approved an Indonesian subsidiary to make halal curry roux at Kota Deltamas. | Plant expected to begin operating in 2027 for household and commercial buyers. |
| In October 2025, the Codex spice committee at Guwahati finalized standards for large cardamom, vanilla and coriander. | Recommended for adoption by the Codex Alimentarius Commission, taking the committee total to 19. |
| In February 2026, Nippon Shokuhin Shimbun reported that S&B Foods had started building a Thai factory for halal instant curry. | Building completion planned for November, with operations in the second half of fiscal 2027. |
Sterilization and extraction set the processing agenda
- Steam sterilization replaces ethylene oxide for microbial reduction and is named in the Spices Board guidelines reported in May 2024.
- Irradiation is permitted in Australia and New Zealand at 2 to 30 kilogray for bacterial decontamination under Standard 1.5.3.
- Oleoresin extraction concentrates flavor and color into standardized ingredients, and spice oils earned 12% of Indian export value in 2025-26.
- Digital origin mapping links lots to growing areas, and Vietnam is developing such a map for its spice-growing areas.
Need a Custom Version of This Report?
Tailor the scope, geography, or segments to your exact requirements.
- Custom geography or segment scope
- Direct access to our analyst team
Local masala brands meet Japanese umami Groups
Competition splits between Indian masala brands, Japanese curry and umami groups, and ingredient suppliers selling to processors. Everest and MDH hold long-standing positions in Indian kitchens, and both were at the center of the 2024 ethylene oxide cases, which raised the value of documented testing. DS Group calls Catch the third-largest packaged spice player in India, while ITC widened its Aashirvaad spice business through the Sunrise Foods agreement of May 2020. Orkla India owns MTR and Eastern, with nine owned facilities at June 2025. Ajinomoto competes through umami and flavor seasonings, and it is the regional reference for monosodium glutamate. House Foods and S&B Foods are extending curry from Japan into Southeast Asia through new plants. AVT McCormick supplies steam-sterilized spice and blends from Kochi in Kerala. Buyers increasingly choose on residue records, halal status and recipe support rather than on price alone.
Companies profiled and their roles in this market
| Company | Type | Role in the market |
|---|---|---|
| Ajinomoto Co., Inc. | Umami and flavor seasoning group | Oversupply response in glutamate and a June 2026 proposal to make its Malaysian unit wholly owned |
| House Foods Group Inc. | Curry and spice group | Japanese spice and seasoning business, with a halal curry roux plant due in Indonesia in 2027 |
| S&B Foods Inc. | Curry and spice group | Thai factory for halal instant curry, with operations planned for the second half of fiscal 2027 |
| Orkla India Limited | Branded spice owner | MTR and Eastern brands, nine owned facilities and 182,270 tons of annual capacity at June 2025 |
| DS Group | Branded spice owner | Catch sprinkler expansion in May 2026 and a retail and foodservice plan for Nepal |
| ITC Limited | Diversified food group | Aashirvaad spices, widened through the Sunrise Foods agreement signed in May 2020 |
| Mahashian Di Hatti Pvt. Ltd. | Branded spice owner | MDH brand, with a Rs 150 crore unit planned at Ujjain in March 2024 |
| Everest Food Products Pvt. Ltd. | Branded spice owner | Indian masala brand named in the 2024 Hong Kong and Singapore ethylene oxide actions |
| McCormick & Company, Incorporated | Ingredient supplier | Through AVT McCormick Ingredients, steam-sterilized spices and blends from Kochi, Kerala |
Compliance capacity will separate the winners
Credence Research's view is that compliance capacity will decide share more than brand spend over the next decade. The 2024 residue cases showed that one failed lot can suspend sales in a destination within days, and that risk favors processors with validated sterilization and full lot records. Pure spices remain the volume base with a 44.0% share of 2025 value, but the value gain sits in blends, extracts and halal-certified formats built close to the buyer. Suppliers that treat food safety as a sales argument should outperform those that treat it as a cost.
How the regional estimate was built
The report uses 2025 as the base year and presents market values in USD million through 2035. Market values come from the Credence Research model, and regional and segment shares and growth rates are Credence Research estimates. Public inputs include Spices Board of India export statistics, Vietnam Pepper and Spice Association figures, USDA Foreign Agricultural Service reports, Food Standards Australia New Zealand documents, Indian government releases, company releases and named press reports. No interviews or surveys were conducted for this edition, and the most assumption-heavy figures are the regional split and the segment shares.
Processed formats take a larger share through 2035
The market should reach USD 25.88 billion by 2035 as packaged and processed formats keep taking share from loose product. South Asia and Southeast Asia gain the most, with Indian brand owners expanding distribution and Japanese groups starting halal plants in 2027. Validated microbial reduction should become a normal purchase condition for food manufacturers, and extracts should win more bioactive contracts. The main risks are another residue episode, sharp origin price swings and continued oversupply in glutamate. The regional market grows at a 6.40% CAGR during 2026–2035, with East Asia still holding the largest share in 2035. Even so, recipe consistency and proof of safety should keep value growth ahead of raw volume through the forecast period.
Frequently Asked Questions
How big is the Asia Pacific seasoning and spices market?
Which region leads the market?
Which region grows fastest?
Which product type is the largest?
What changed after the 2024 ethylene oxide cases?
Why are Japanese companies building plants in Southeast Asia?
Which channel is growing fastest?
Which companies are active in this market?
Table of Content
Chapter 1 Market Segmentation
- 1.1 Segmentation Framework
- 1.1.1 Product and Service Classification
- 1.1.2 Application and End-Use Classification
- 1.1.3 Technology and Solution Classification
- 1.1.4 Customer and Distribution Channel Classification
- 1.1.5 Geographic Segmentation
- 1.1.6 Market Segment Definitions and Boundaries
- 1.2 By Product Type
- 1.2.1 Pure Spices
- 1.2.2 Umami Seasonings
- 1.2.3 Blended Spices
- 1.2.4 Spice Extracts
- 1.3 By Customer Type
- 1.3.1 Households
- 1.3.2 Food Manufacturers
- 1.3.3 Foodservice Operators
- 1.3.4 Nutraceutical Manufacturers
- 1.4 By Processing Technology
- 1.4.1 Conventional Dry Processing
- 1.4.2 Validated Microbial Reduction
- 1.4.3 Extraction Processing
Chapter 2 Introduction
- 2.1 Report Objectives and Scope
- 2.2 Product Definition and Industry Terminology
- 2.3 Market Inclusions and Exclusions
- 2.4 Research Process
- 2.4.1 Primary Research and Expert Interviews
- 2.4.2 Secondary Research and Source Review
- 2.4.3 Top-Down and Bottom-Up Estimation
- 2.4.4 Data Triangulation and Verification
- 2.5 Market Size Measurement Basis
- 2.5.1 2025: USD 13.89 billion → 2035: USD 25.88 billion
- 2.6 Historical and Forecast Reference Periods
- 2.6.1 Historical Period: 2018-2025
- 2.6.2 Base Year: 2025
- 2.6.3 Forecast Period: 2025-2035
- 2.7 Research Assumptions and Limitations
Chapter 3 Executive Summary
- 3.1 Market Snapshot and Key Findings
- 3.2 Base-Year Market Size, 2025
- 3.3 Forecast Market Size, 2035
- 3.4 Revenue and Volume Growth Outlook
- 3.5 Key Demand and Supply Indicators
- 3.6 Leading Market Segments
- 3.7 Fastest-Growing Market Opportunities
- 3.8 Regional Performance Highlights
- 3.9 Technology and Industry Transformation
- 3.10 Competitive Landscape Summary
- 3.11 Analyst View and Strategic Implications
Chapter 4 Asia Pacific Seasoning and Spices Market Trends and Developments
- 4.1 Historical Industry Development, 2018-2025
- 4.2 Recent Market Trends and Developments
- 4.3 Demand and Customer Behavior Trends
- 4.4 Technology and Product Innovation
- 4.5 Artificial Intelligence, Automation and Digitalization
- 4.6 Local Manufacturing and Supply Chain Realignment
- 4.7 Industry Partnerships, Mergers and Acquisitions
- 4.8 Sustainability and Circular Economy Developments
- 4.9 Government and Private Sector Investment Trends
- 4.10 Emerging Business Models and Commercialization
- 4.11 Industry Developments and Announcements
Chapter 5 Asia Pacific Seasoning and Spices Market Production, Supply and Demand Analysis
- 5.1 Demand Trend and Consumption Analysis, 2018-2025
- 5.2 Demand Forecast, 2025-2035
- 5.3 Production and Output Trend, 2018-2025
- 5.4 Production and Output Forecast, 2025-2035
- 5.5 Installed Capacity and Capacity Utilization
- 5.6 Company-Wise Production Plants and Statistics
- 5.6.1 Installed Production Capacity
- 5.6.2 Actual Production
- 5.6.3 Planned Capacity and Expansion Targets
- 5.7 Supply Chain Structure and Procurement Trends
- 5.8 Supply-Demand Gap and Bottlenecks
- 5.9 Import Dependence and Sourcing Structure
- 5.10 Contract Manufacturing and Outsourcing
- 5.11 Regional Supply and Demand Concentration
Chapter 6 Asia Pacific Seasoning and Spices Market Pricing Analysis
- 6.1 Pricing Structure and Measurement
- 6.2 Historical Pricing Trends, 2018-2025
- 6.3 Pricing Outlook, 2025-2035
- 6.4 Average Selling Price and Unit Economics
- 6.5 Pricing by Product and Market Segment
- 6.6 Geographic Pricing Differences
- 6.7 Key Input, Energy, Labor and Logistics Costs
- 6.8 Contract Pricing and Purchasing Models
- 6.9 Pricing Sensitivity and Competitive Positioning
- 6.10 Price, Margin and Profitability Implications
Chapter 7 Asia Pacific Seasoning and Spices Market Dynamics
- 7.1 Market Growth Drivers
- 7.1.1 Demand-Side Drivers
- 7.1.2 Technology and Innovation Drivers
- 7.1.3 Infrastructure and Investment Drivers
- 7.1.4 Regulatory and Policy Drivers
- 7.2 Market Restraints
- 7.2.1 Cost and Affordability Constraints
- 7.2.2 Technology and Adoption Barriers
- 7.2.3 Supply Chain and Operational Constraints
- 7.3 Market Challenges
- 7.3.1 Competitive Pressure and Margin Erosion
- 7.3.2 Skills, Infrastructure and Implementation Gaps
- 7.4 Emerging Market Opportunities
- 7.5 Market Dynamics Impact and Time-Horizon Assessment
Chapter 8 Asia Pacific Seasoning and Spices Value Chain Analysis
- 8.1 Industry Value Chain Overview
- 8.2 Upstream Suppliers and Critical Inputs
- 8.3 Technology and Component Providers
- 8.4 Manufacturing or Service Delivery
- 8.5 Distribution, Channel Partners and Integrators
- 8.6 Downstream Applications and End Users
- 8.7 Value Addition and Profit Pools
- 8.8 Vertical Integration and Outsourcing
- 8.9 Supplier Concentration and Risk
- 8.10 Supply Chain Localization and Resilience
Chapter 9 Asia Pacific Seasoning and Spices Market Regulations and Policies
- 9.1 Relevant Laws, Standards and Compliance Frameworks
- 9.2 Product, Service, Safety and Quality Requirements
- 9.3 Government Policies, Incentives and Subsidies
- 9.4 Imports, Exports and Trade Barriers
- 9.5 Public Procurement and Local Content Requirements
- 9.6 Environmental and Sustainability Compliance
- 9.7 Upcoming Policy Changes and Market Implications
Chapter 10 Asia Pacific Seasoning and Spices Market Hotspots and Opportunities
- 10.1 Market Opportunity Mapping and Growth Hotspots
- 10.2 High-Growth Applications and Customer Groups
- 10.3 Underserved Markets and White-Space Opportunities
- 10.4 Emerging Technology and Product Opportunities
- 10.5 New Capacity and Investment Hotspots
- 10.6 Market Entry and Expansion Opportunities
- 10.7 Distribution and Partnership Opportunities
- 10.8 Near-Term and Long-Term Commercial Potential
- 10.9 Opportunity Attractiveness and Execution Risks
Chapter 11 Asia Pacific Seasoning and Spices Market Outlook, 2025-2035
- 11.1 Market Size and Analysis
- 11.1.1 Revenue (Market Measurement: 2025: USD 13.89 billion → 2035: USD 25.88 billion)
- 11.1.2 Market Volume and Quantity Sold
- 11.1.3 Historical Market Size, 2018-2025
- 11.1.4 Base-Year Market Size, 2025
- 11.2 Market Forecast, 2025-2035
- 11.2.1 Revenue Forecast to 2035
- 11.2.2 Volume Forecast to 2035
- 11.2.3 CAGR and Year-on-Year Growth
- 11.2.4 Incremental Revenue Opportunity
- 11.3 Forecast Assumptions and Scenario Analysis
- 11.3.1 Base-Case Forecast
- 11.3.2 Optimistic and Conservative Scenarios
- 11.3.3 Technology, Pricing and Policy Sensitivities
- 11.4 Market Attractiveness and Growth Outlook
Chapter 12 Asia Pacific Seasoning and Spices Market Segmentation and Outlook
- 12.1 Segmentation Summary and Market Shares, 2025
- 12.2 Largest and Fastest-Growing Segments
- 12.3 By Product Type - Market Size and Forecast, 2025-2035
- 12.3.1 Segment Definition and Scope
- 12.3.2 Historical Market Size, 2018-2025
- 12.3.3 Revenue Forecast, 2025-2035
- 12.3.4 Volume Forecast, 2025-2035
- 12.3.5 Base-Year Market Share, 2025
- 12.3.6 Segment CAGR and Growth Drivers
- 12.3.7 Subsegment Market Size and Forecast
- 12.3.7.1 Pure Spices
- 12.3.7.2 Umami Seasonings
- 12.3.7.3 Blended Spices
- 12.3.7.4 Spice Extracts
- 12.3.8 Subsegment Pricing and Adoption Trends
- 12.3.9 Leading Suppliers and Competition
- 12.3.10 Regional Demand and Opportunities
- 12.4 By Customer Type - Market Size and Forecast, 2025-2035
- 12.4.1 Segment Definition and Scope
- 12.4.2 Historical Market Size, 2018-2025
- 12.4.3 Revenue Forecast, 2025-2035
- 12.4.4 Volume Forecast, 2025-2035
- 12.4.5 Base-Year Market Share, 2025
- 12.4.6 Segment CAGR and Growth Drivers
- 12.4.7 Subsegment Market Size and Forecast
- 12.4.7.1 Households
- 12.4.7.2 Food Manufacturers
- 12.4.7.3 Foodservice Operators
- 12.4.7.4 Nutraceutical Manufacturers
- 12.4.8 Subsegment Pricing and Adoption Trends
- 12.4.9 Leading Suppliers and Competition
- 12.4.10 Regional Demand and Opportunities
- 12.5 By Processing Technology - Market Size and Forecast, 2025-2035
- 12.5.1 Segment Definition and Scope
- 12.5.2 Historical Market Size, 2018-2025
- 12.5.3 Revenue Forecast, 2025-2035
- 12.5.4 Volume Forecast, 2025-2035
- 12.5.5 Base-Year Market Share, 2025
- 12.5.6 Segment CAGR and Growth Drivers
- 12.5.7 Subsegment Market Size and Forecast
- 12.5.7.1 Conventional Dry Processing
- 12.5.7.2 Validated Microbial Reduction
- 12.5.7.3 Extraction Processing
- 12.5.8 Subsegment Pricing and Adoption Trends
- 12.5.9 Leading Suppliers and Competition
- 12.5.10 Regional Demand and Opportunities
- 12.6 Segment Growth Comparison
- 12.7 Segment Attractiveness and Priority Matrix
Chapter 13 Asia Pacific Seasoning and Spices End-Use and Application Market Outlook
- 13.1 End-Use Industry and Customer Demand Structure
- 13.2 Leading Applications and Customer Groups
- 13.3 End-Use Market Size, Share and Forecast
- 13.4 Major End-Use Industry Deep Dives
- 13.4.1 Customer Requirements and Use Cases
- 13.4.2 Demand and Replacement Cycles
- 13.4.3 Technical and Regulatory Considerations
- 13.4.4 Purchasing and Procurement Models
- 13.4.5 Leading Vendors and Distribution Channels
- 13.4.6 Forecast and Commercial Opportunities
- 13.5 Emerging Applications and Cross-Segment Demand
- 13.6 End-Use Industry Investment Priorities
Chapter 14 Asia Pacific Seasoning and Spices Geographic Market Outlook, 2025-2035
- 14.1 Regional Market Size and Country-Level Shares, 2025
- 14.2 Country Market Size Comparison, 2025
- 14.3 Country Market Forecasts, 2025-2035
- 14.4 Subregional Industrial and Demand Clusters
- 14.5 Intra-Regional Pricing and Cost Differences
- 14.6 Cross-Border Trade and Supply Networks
- 14.7 Regional Supply and Demand Balances
- 14.8 Country Opportunity Comparison and Prioritization
Note: Every listed country is covered on the structure shown under the first country.
Chapter 15 Asia Pacific Seasoning and Spices Technology, Innovation and Sustainability Outlook
- 15.1 Technology Landscape and Maturity
- 15.2 Product, Process and Service Innovation
- 15.3 AI, Automation and Digital Tools in the Industry
- 15.4 Technology Adoption and Performance Benchmarking
- 15.5 Innovation Pipeline and R&D Investment
- 15.6 Patent and Intellectual Property Trends
- 15.7 Energy Efficiency and Resource Management
- 15.8 Sustainability, Recycling and Circularity
- 15.9 Technology Roadmap, 2025-2035
- 15.10 Risks of Obsolescence and Technology Substitution
Chapter 16 Asia Pacific Seasoning and Spices Market Key Strategic Imperatives
- 16.1 Growth and Market Entry Priorities
- 16.2 High-Return Products and Segments
- 16.3 Pricing, Profitability and Cost Optimization
- 16.4 Technology Investment and Product Differentiation
- 16.5 Supply Chain Localization and Resilience
- 16.6 Distribution and Customer Acquisition
- 16.7 Partnership, Acquisition and Capacity Strategy
- 16.8 Regional Expansion Priorities
- 16.9 Short-, Medium- and Long-Term Actions
Chapter 17 Competition Outlook
- 17.1 Industry Competition Characteristics
- 17.2 Market Structure and Concentration
- 17.3 Market Share and Competitive Positioning, 2025
- 17.4 Company-Wise Revenue and Product Benchmarking
- 17.5 Production and Service Capacity Benchmarking
- 17.6 Technology, Pricing and Differentiation
- 17.7 Regional Footprint and Distribution Strength
- 17.8 Mergers, Acquisitions and Strategic Alliances
- 17.9 New Entrants and Competitive Threats
- 17.10 Porter's Five Forces and Industry Attractiveness
- 17.11 Competitive Outlook, 2025-2035
Chapter 18 Company Profiles
- 18.1 Company Coverage and Selection Criteria
- 18.2 Ajinomoto Co., Inc.
- 18.2.1 Business Description
- 18.2.2 Company Ownership and Geographic Presence
- 18.2.3 Product and Service Portfolio
- 18.2.4 Manufacturing and Operating Footprint
- 18.2.5 Production Capacity and Expansion Plans
- 18.2.6 Financial Performance and Investment
- 18.2.7 Market Share and Competitive Position
- 18.2.8 Technology and Innovation Capabilities
- 18.2.9 Strategic Alliances or Partnerships
- 18.2.10 Recent Developments
- 18.2.11 Growth Strategy and Outlook
- 18.3 McCormick & Company, Incorporated
- 18.4 ofi
- 18.5 S&B Foods Inc.
- 18.6 House Foods Group Inc.
- 18.7 Everest Food Products Pvt. Ltd.
- 18.8 Mahashian Di Hatti Pvt. Ltd.
- 18.9 Orkla India Limited
- 18.10 DS Group
- 18.11 ITC Limited
- 18.12 Other Relevant Market Participants
Note: Every listed company is profiled on the structure shown under the first company. The company list is preliminary and may change based on research findings, market developments, data availability and client requirements.
Chapter 19 Disclaimer
- 19.1 Research and Forecast Disclaimer
- 19.2 Data Source and Estimation Limitations
Note: The depth of individual sections depends on data availability for this market. Volume, capacity, trade and other unit-based metrics are included where applicable.

