
Low-cost sweetness keeps a steady base across the region
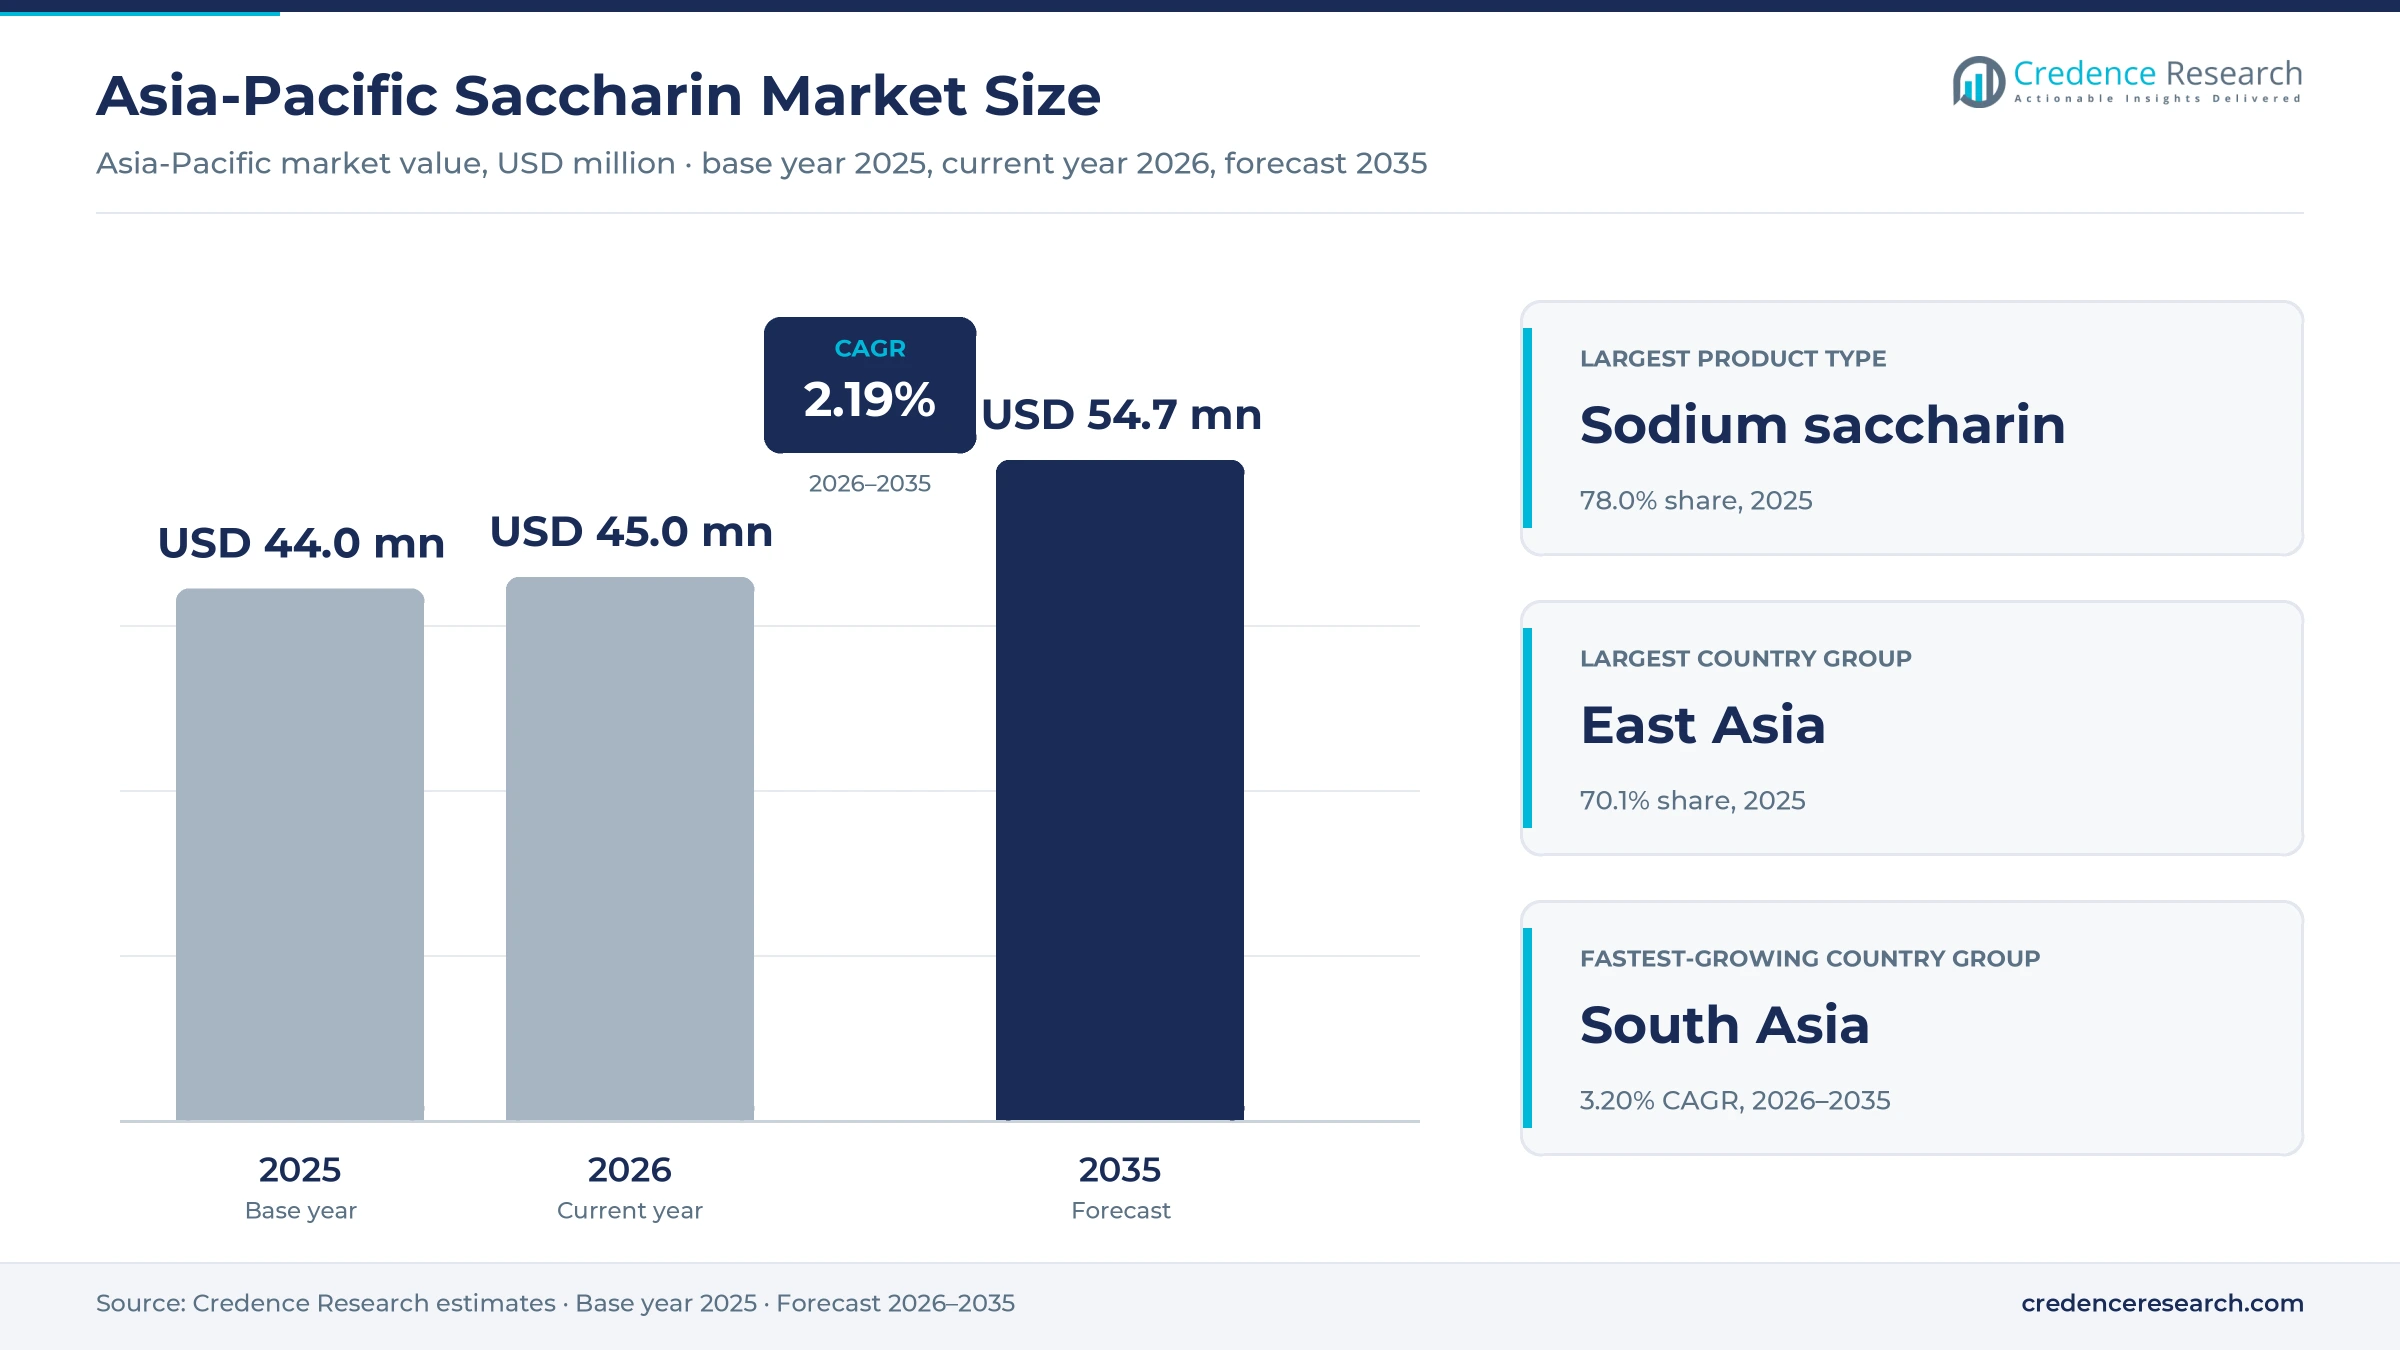
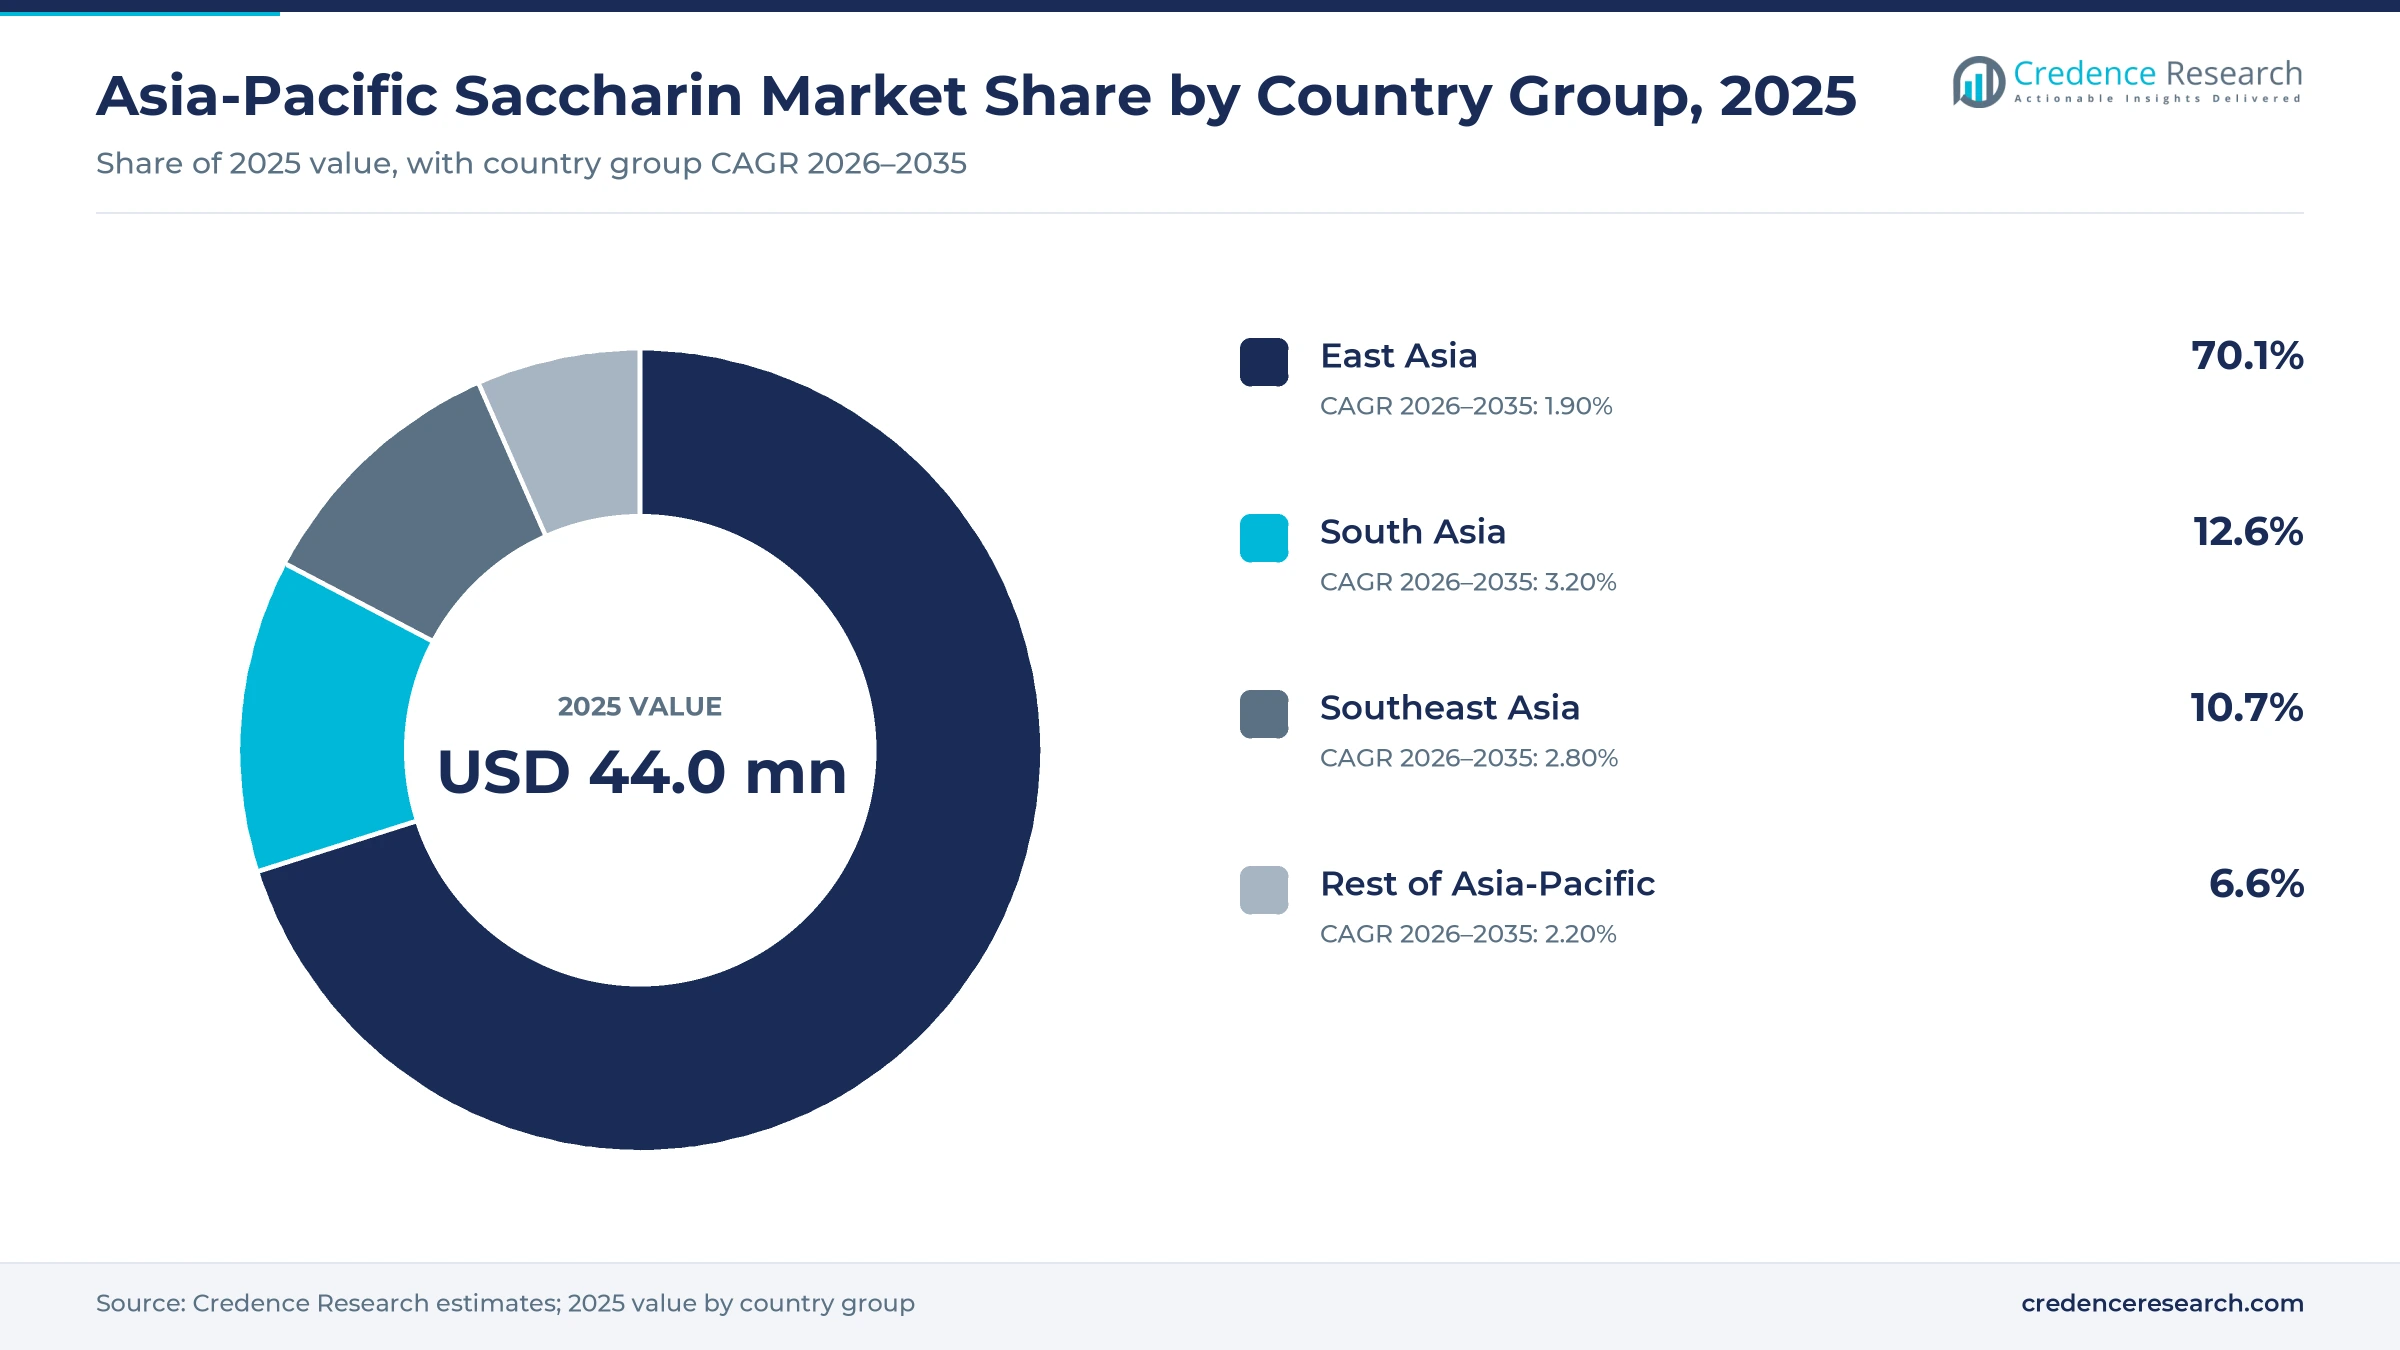
The Asia-Pacific saccharin market was valued at USD 44.0 million in 2025 and is projected to increase from USD 45.0 million in 2026 to USD 54.7 million by 2035, registering a CAGR of 2.19% during 2026–2035. Demand comes from beverage and food makers that need very low-cost sweetness, from tabletop sweetener brands and from makers of toothpaste, oral syrups and chewable tablets. East Asia held the largest share, 70.1% in 2025, because China and South Korea host the largest production base in the region. South Asia is the fastest-growing country group at 3.20% a year, as Indian generic drug output and a large diabetic population lift use. Regulation is also changing, because China's food additive standard GB 2760-2024 took effect on Feb. 8, 2025, with combined limits for some sweeteners used together. As a result, producers with pharmacopeia approvals and blend-ready grades hold an advantage over commodity traders.
Which saccharin products and buyers are counted?
The estimate measures the value of sodium, calcium and acid saccharin sold to buyers in East Asia, South Asia, Southeast Asia and the rest of Asia-Pacific. It covers food grade, pharmaceutical grade and technical grade material in crystalline powder, granules and spray-dried powder, sold directly by producers, through distributors or by importers.
The estimate excludes finished tabletop packs, beverages and medicines that contain saccharin, as well as other high-intensity sweeteners such as sucralose, aspartame and stevia. The value chain runs from chemical producers in China, South Korea and India through distributors and importers to beverage, food, oral care, pharmaceutical and industrial users.
Asia-Pacific Saccharin Market Insights
- The Asia-Pacific saccharin market was valued at USD 44.0 million in 2025 and is projected to reach USD 54.7 million by 2035, registering a CAGR of 2.19% during 2026–2035.
- East Asia held 70.1% of 2025 value, because China and South Korea host the main saccharin plants and the largest food and beverage industries.
- Sodium saccharin led with 78.0% of 2025 value, as beverage, tabletop and oral care formulators rely on its solubility and low cost.
- China's GB 2760-2024 additive standard took effect on Feb. 8, 2025, with combined limits for sweeteners used together in the same food categories.
- Blue Jet Healthcare made its first commercial dispatches of calcium saccharin in the year to March 2025, which shows producers adding specialty salts.
Sodium salt, food uses and food grade lead regional value
Why does sodium saccharin carry most value?
Based on product type, the market is categorized into Sodium saccharin, Calcium saccharin and Acid saccharin. Sodium saccharin led with 78.0% of 2025 value, because it dissolves easily and costs less per unit of sweetness than other forms. Calcium saccharin grows fastest at 3.11% a year, as formulators that need a sodium-free salt for specific medicines and foods ask producers for dedicated supply.
How do healthcare formulations compare with food uses?
Based on application, the market is categorized into Food and beverages, Tabletop sweeteners, Healthcare formulations and Technical applications. Food and beverages led with 38.0% of 2025 value, because soft drinks, pickles and snacks use saccharin to cut sugar cost. Healthcare formulations grow fastest at 3.05% a year, as makers of toothpaste, mouthwash and oral syrups keep it in long-running approved formulas.
Why is pharmaceutical grade gaining share?
Based on grade, the market is categorized into Food grade, Pharmaceutical grade and Technical grade. Food grade led with 55.0% of 2025 value, because beverage and tabletop users buy the largest volumes. Pharmaceutical grade grows fastest at 2.93% a year, as generic drug makers need material that meets the United States, European, British and Japanese pharmacopeias for registered products.
How do distributors reach smaller buyers?
Based on sales channel, the market is categorized into Direct producer sales, Authorised distributors and Independent importers. Direct producer sales led with 52.0% of 2025 value, because large beverage and oral care brands sign annual supply contracts with producers. Authorised distributors grow fastest at 2.67% a year, as small food and drug makers buy certified lots in smaller pack sizes.
| Segment Group | Leading Sub-segment | Share, 2025 | Fastest-growing Sub-segment | CAGR, 2026–2035 |
|---|---|---|---|---|
| By Product Type | Sodium saccharin | 78.0% | Calcium saccharin | 3.11% |
| By Application | Food and beverages | 38.0% | Healthcare formulations | 3.05% |
| By Grade | Food grade | 55.0% | Pharmaceutical grade | 2.93% |
| By Sales Channel | Direct producer sales | 52.0% | Authorised distributors | 2.67% |
Request a Free Sample
Fill in your details and we'll send you a free sample report.
- Sample data tables & charts
- Research methodology
Cost, medicine syrups and regional plants support demand
Why does cost-efficient sweetness keep saccharin in recipes?
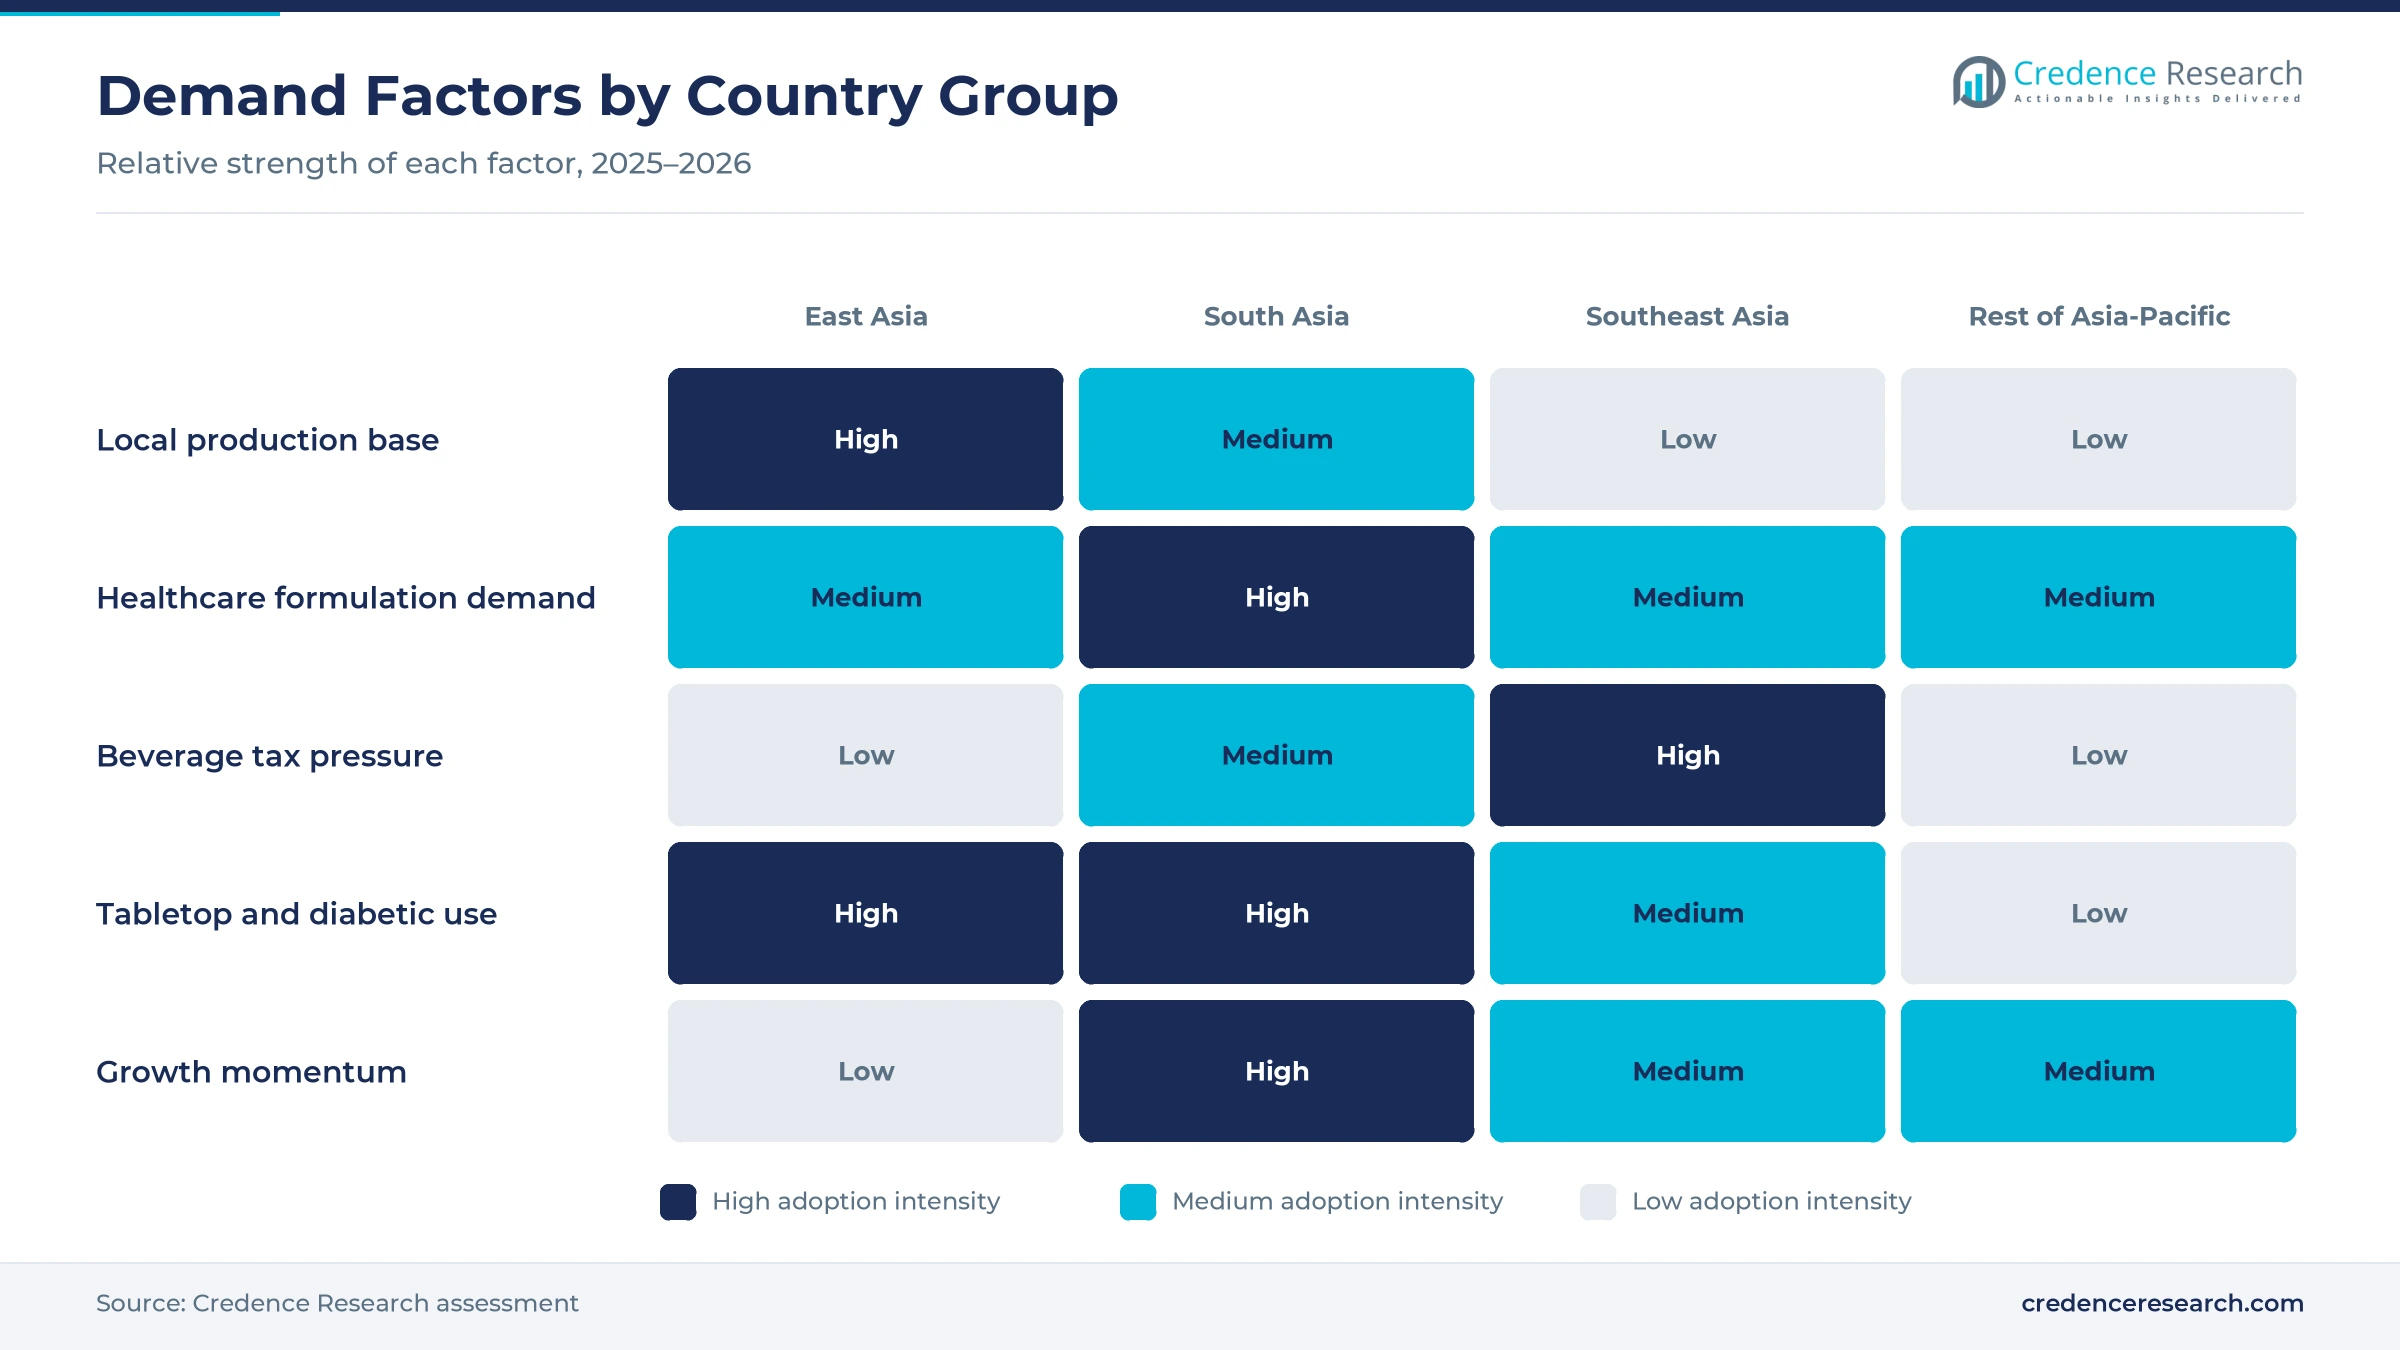
Saccharin gives the most sweetness per unit of cost of any common sweetener, so price-sensitive beverage and food makers keep it in their formulas. Kaifeng Xinghua, a Henan producer held by China Pingmei Shenma Group, says its sodium saccharin is about 500 times sweeter than sugar. Trade platform Tridge listed Chinese export prices of USD 5.34 to USD 8.55 per kilogram in 2024, which means a gram replaces several hundred grams of sugar at very low cost. Malaysia also raised its excise duty on sugar-sweetened drinks to 90 sen per liter from Jan. 1, 2025, according to The Star. As a result, food and beverages hold 38.0% of 2025 value.
How do healthcare formulations create repeat demand?
Medicines and oral care products use saccharin in registered formulas that rarely change, which creates steady repeat orders. The WHO guideline of May 15, 2023, says its advice on non-sugar sweeteners does not apply to toothpaste and other personal care and hygiene products, according to the World Health Organization. India's pharmaceutical exports reached USD 30.47 billion in 2024-25, up 9.4%, according to IANS, citing the Commerce Secretary. JMC says its sodium saccharin meets USP/NF and JP standards for syrups and other drug uses alongside other pharmaceutical excipients. Therefore, healthcare formulations grow fastest at 3.05% a year, ahead of food, tabletop and technical uses.
Why do established regional plants secure supply?
Leading saccharin plants operate in China, South Korea and India, so regional buyers can source certified material close to home with short lead times. JMC was founded in 1953 as Jeil Moolsan, joined the KISCO group in 2004 and produces saccharin at its site in Ulsan, South Korea. Blue Jet Healthcare says in its 2024-25 annual report that it has made high-intensity sweeteners since 1970 and holds about 10% of global saccharin capacity. Kaifeng Xinghua describes saccharin as its main business and itself as one of Henan's leading exporters. JMC also certifies its sodium saccharin to USP/NF, JP and FSSC 22000 standards. As a result, East Asian buyers enjoy short supply chains and can source certified material from nearby plants.
How does a large diabetic population support tabletop use?
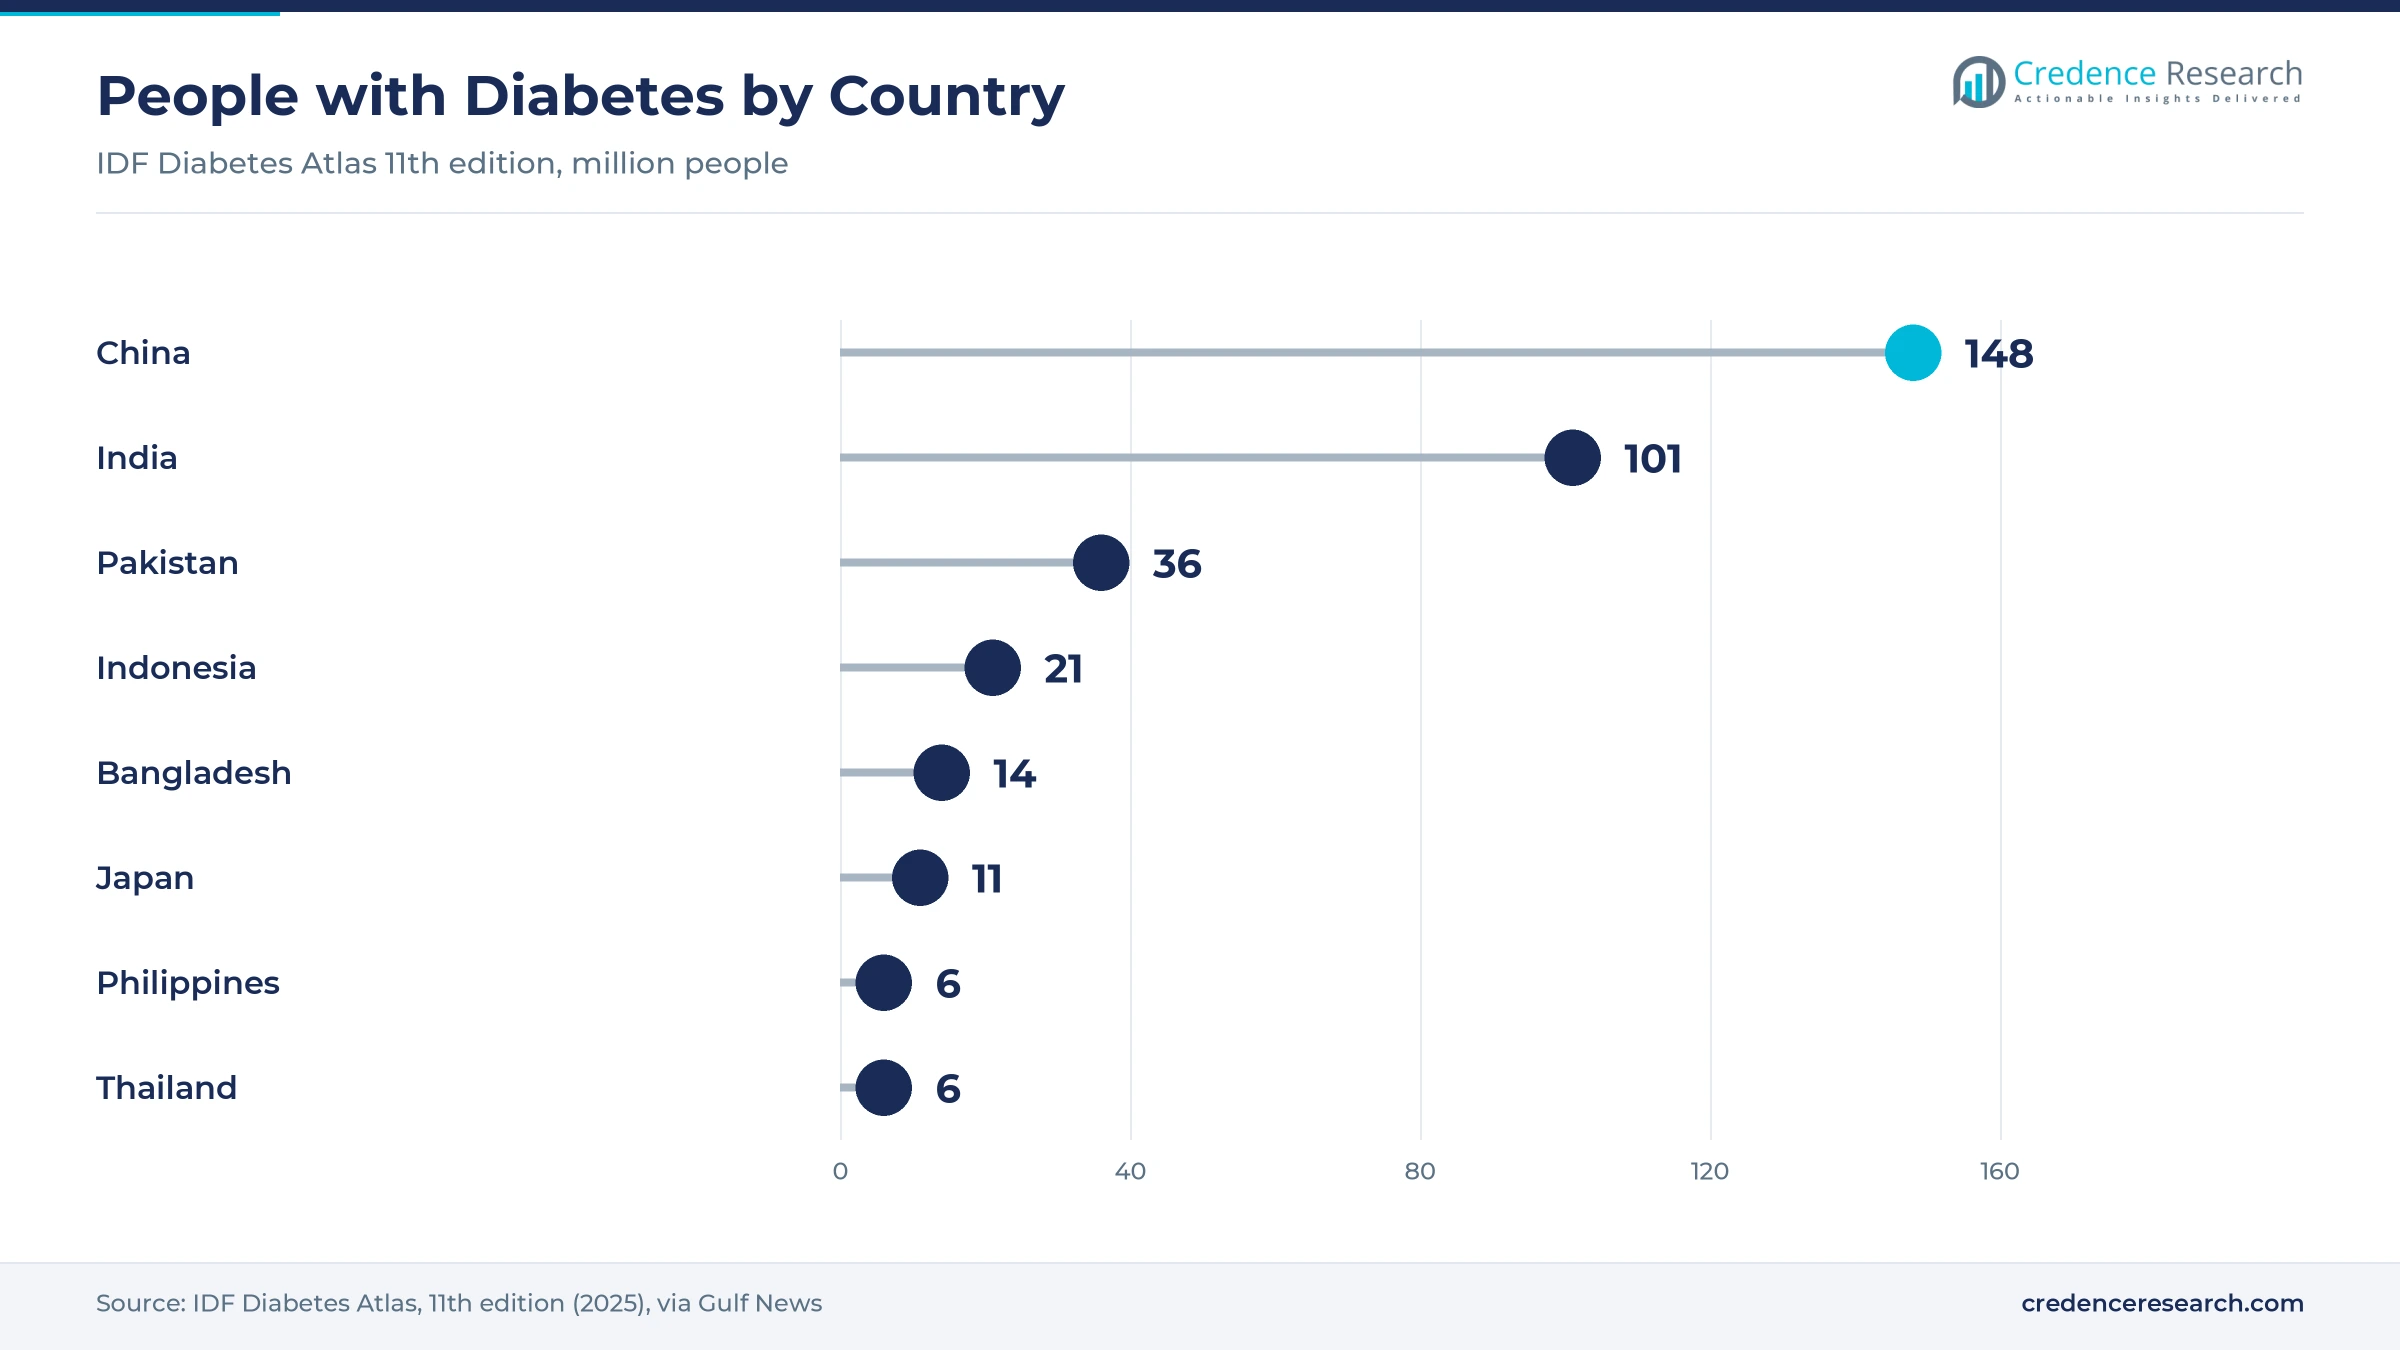
People with diabetes use tabletop sweeteners and sugar-free drinks every day, and Asia-Pacific has the largest diabetic population in the world. The IDF Diabetes Atlas 11th edition counts about 148 million people with diabetes in China, 101 million in India and 36 million in Pakistan, according to Gulf News. The WHO guideline of May 2023 on non-sugar sweeteners also excludes people with pre-existing diabetes from its advice. Indonesia adds about 21 million people with diabetes and Bangladesh about 14 million. Therefore, tabletop sweeteners keep a steady base in the Asia-Pacific saccharin market, since these five countries count about 320 million people with diabetes.
Sweetener blends, new salts and sugar taxes shape demand
How is the shift to sweetener blends changing orders?
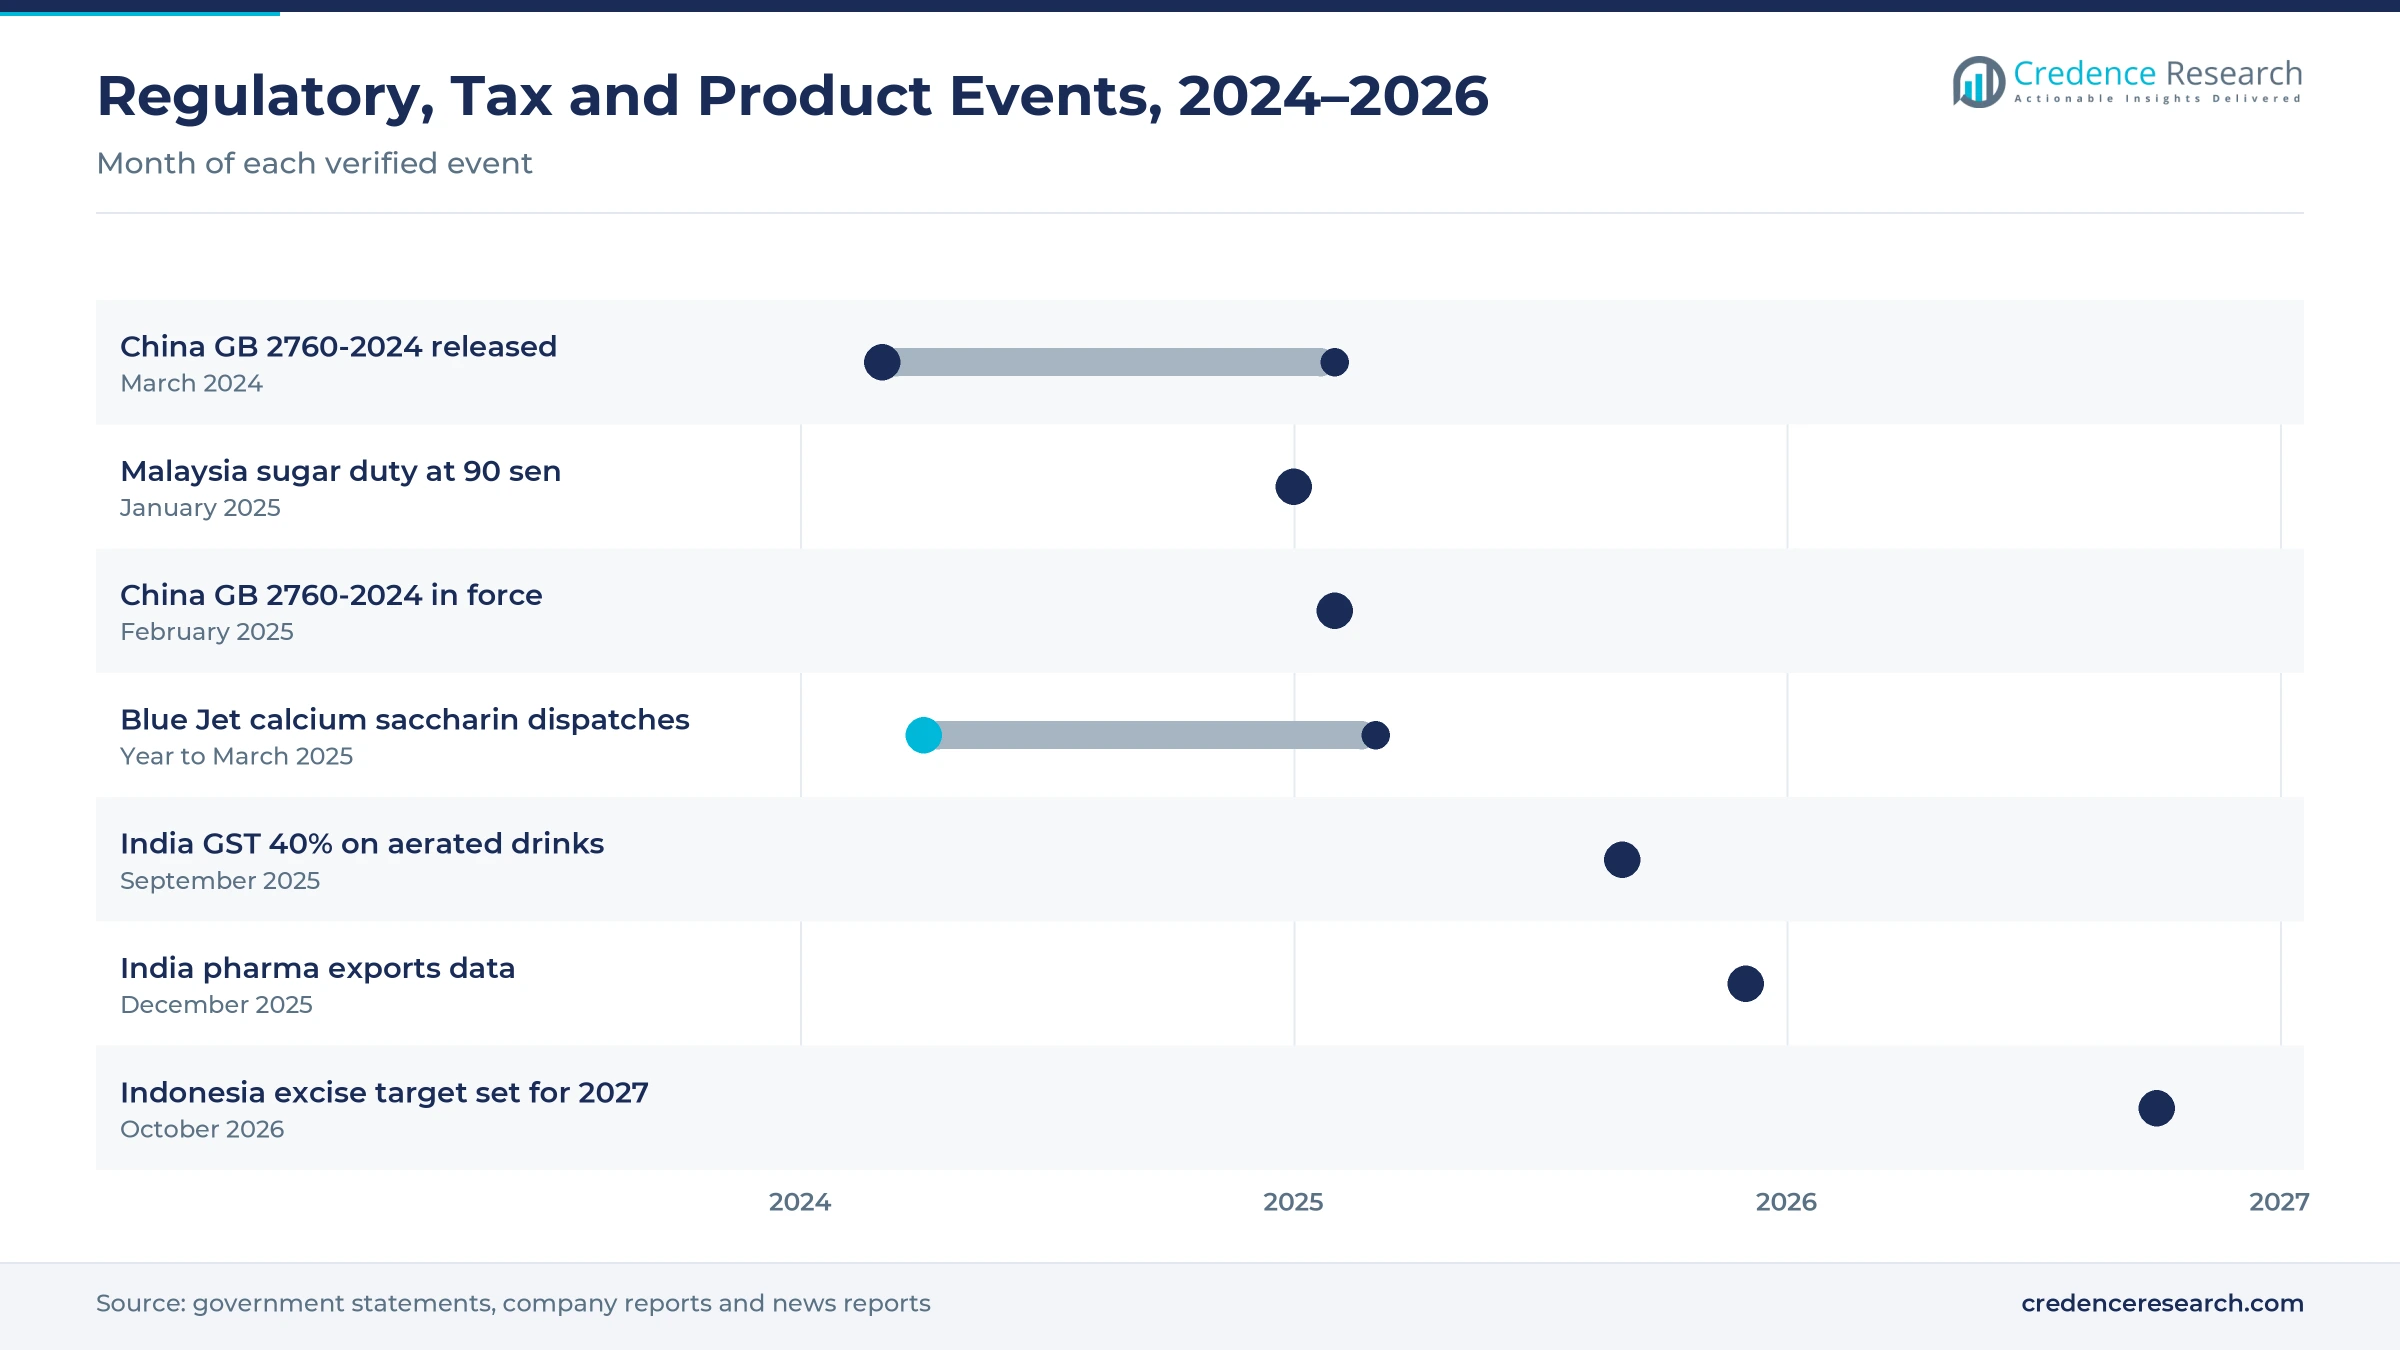
Beverage makers increasingly combine saccharin with other sweeteners to mask its aftertaste and stay within legal limits. China's National Health Commission released GB 2760-2024 on March 12, 2024, and the standard took effect on Feb. 8, 2025, according to ChemLinked. The publisher said the standard sets new combined usage limits for sweeteners such as aspartame and acesulfame in the same food categories. This change pushes formulators to recalculate blends with high-intensity artificial sweeteners rather than raise any single ingredient. As a result, producers that supply consistent mesh sizes and technical support for blends win more contracts, while sodium saccharin keeps 78.0% of 2025 value.
Why is the rise of calcium saccharin notable?
Producers are adding calcium saccharin and other specialty salts for buyers that need a sodium-free sweetener or a specific technical behavior. Blue Jet Healthcare says it scaled up calcium saccharin in the year to March 2025 with initial commercial dispatches, to meet a specific formulation need for one of its customers. Salvi Chemical Industries, founded in 1978, lists calcium saccharin and saccharin potassium among its bulk products and holds six United States drug master files. JMC also sells insoluble saccharin alongside sodium saccharin with 15% and 6% moisture. Therefore, calcium saccharin grows fastest at 3.11% a year, from a small base in 2025, as more drug makers file it in new formulas.
Can Southeast Asian sugar taxes open new demand?
Malaysia's beverage duty and a planned Indonesian excise raise the cost of sugary drinks, which opens room for low-calorie recipes that blend saccharin with other sweeteners. Malaysia collected RM73.81 million from its sugar-sweetened beverage duty between January and November 2025, and RM521.35 million since July 1, 2019. In Indonesia, the customs chief hopes to introduce a sweetened beverage excise in the second half of 2027, with expected revenue of Rp 1.7 trillion, according to The Jakarta Post. The Philippines and Thailand each count about 6 million people with diabetes, according to the IDF Diabetes Atlas. As a result, Southeast Asia grows at 2.80% a year, faster than East Asia.
Is pharmaceutical grade supply an opening for Indian makers?
Generic drug makers in India and their export customers need audited sources, so domestic producers with pharmacopeia grades are well placed to win new contracts. Blue Jet Healthcare says it supplied more than 200 customers across India, the United States, Europe, Asia and Latin America as of March 31, 2025. Its saccharin meets the Food Chemicals Codex and the European and British pharmacopeias, and it carries the food additive number E954. India's pharmaceutical exports also grew 9.4% in 2024-25, which lifts demand for registered excipients and sweeteners. Therefore, pharmaceutical grade grows fastest at 2.93% a year, and South Asia gains share across the region.
Health guidance, rival sweeteners and prices test sellers
How does WHO sweetener guidance affect consumer demand?
The WHO advised on May 15, 2023, against using non-sugar sweeteners, including saccharin, to control body weight or reduce the risk of noncommunicable diseases. The recommendation is conditional, but it shapes how beverage brands market sugar-free products to health-aware buyers. As a result, some brands avoid listing artificial sweeteners on front labels, which slows food use. Producers respond by stressing approved uses in medicines, toothpaste and products for people with diabetes, which the guidance does not cover.
Why do rival sweeteners limit growth in food uses?
Sucralose, stevia and blended sweeteners compete for the same low-calorie drinks and foods, and many brands prefer them because they taste closer to sugar. This competition holds back food and beverage demand for saccharin, especially in premium products where taste matters more than cost. In turn, saccharin keeps its place mainly in price-sensitive drinks, pickles, tabletop packs and oral care. Producers defend volume by selling saccharin as a low-cost partner in blends rather than as a stand-alone sweetener.
How do falling export prices squeeze producer margins?
Chinese export prices fell from about USD 8.19 per kilogram in 2022 to a range starting at USD 5.34 in 2024, according to Tridge, which narrows producer margins. Lower prices help buyers, but they make it hard for smaller plants to fund environmental upgrades and quality systems. As a result, regional supply concentrates among larger producers with backward integration and certified plants. Buyers that depend on a single source face supply risk when a plant closes or cuts output during a price downturn.
Why do environmental rules raise production costs?
Saccharin synthesis uses chemical intermediates and creates waste streams that regulators in China and India watch closely. Producers must invest in effluent treatment and cleaner processes to keep operating licenses near industrial zones. Blue Jet Healthcare says it uses a backward-integrated process designed for cost efficiency with zero by-products. In turn, plants without such investment face shutdowns or higher costs, which can tighten supply and raise prices for buyers across the region.
East Asia leads while South Asia grows fastest
| Country Group | Value, 2025 (USD million) | Share, 2025 | CAGR, 2026–2035 |
|---|---|---|---|
| East Asia | 30.9 | 70.1% | 1.90% |
| South Asia | 5.5 | 12.6% | 3.20% |
| Southeast Asia | 4.7 | 10.7% | 2.80% |
| Rest of Asia-Pacific | 2.9 | 6.6% | 2.20% |
Why does East Asia hold the largest share?
East Asia held 70.1% of 2025 value and grows at 1.90% a year, slightly below the regional rate. China hosts the largest group of producers, including Kaifeng Xinghua in Henan and several Tianjin and Shanghai suppliers, while JMC produces in Ulsan, South Korea. China also has the largest diabetic population in the world, which keeps tabletop and sugar-free drink demand steady. Growth is slower because food makers in China, Japan and South Korea are moving toward newer sweeteners and blends.
Why is South Asia growing fastest?
South Asia held 12.6% of 2025 value and grows fastest at 3.20% a year. India hosts saccharin makers such as Blue Jet Healthcare, which lists sweeteners as a focus at its Shahad, Ambernath and Mahad sites, and Salvi Chemical Industries. The country's generic drug and contract pharmaceutical manufacturing base needs pharmaceutical grade sweeteners for syrups and chewable tablets. Pakistan and Bangladesh add about 36 million and 14 million people with diabetes, which supports tabletop use.
How do sugar taxes lift Southeast Asian demand?
Southeast Asia held 10.7% of 2025 value and grows at 2.80% a year, above the regional rate. Malaysia raised its sugar-sweetened beverage duty to 90 sen per liter from Jan. 1, 2025, which pushes drink makers to cut sugar. Indonesia, with about 21 million people with diabetes, plans a sweetened beverage excise for the second half of 2027. As a result, beverage reformulation and imported food grade material drive most new demand in the country group.
What sustains demand in the rest of Asia-Pacific?
The rest of Asia-Pacific held 6.6% of 2025 value and grows at 2.20% a year. Australia, New Zealand and smaller Pacific island markets in this group import most of their saccharin. Demand comes mainly from oral care, medicine and tabletop uses rather than from mass-market drinks. Buyers in these markets depend on distributors and importers, which keep stocks of certified lots from Chinese, Korean and Indian producers.
Rules, taxes and product steps from 2024 to 2026
| Development | Status and market relevance |
|---|---|
| In March 2024, China's National Health Commission released the GB 2760-2024 food additive standard with combined sweetener limits. | In force since Feb. 8, 2025 |
| In January 2025, Malaysia raised its excise duty on sugar-sweetened beverages to 90 sen per liter. | RM73.81 million collected from January to November 2025 |
| In March 2025, Blue Jet Healthcare closed a fiscal year in which it made initial commercial dispatches of calcium saccharin. | New salt added to its sodium saccharin range |
| In September 2025, India's GST Council approved a 40% rate on carbonated and sweetened aerated drinks, up from 28%. | Raises shelf prices of sweetened beverages |
| In October 2026, Indonesia's customs chief said a sweetened beverage excise could start in the second half of 2027. | Expected revenue of Rp 1.7 trillion in 2027 |
Mesh grades, spray drying and new salts widen use
- Moisture-controlled sodium grades let buyers choose between products such as JMC's 15% and 6% moisture sodium saccharin for drinks, tablets and dry mixes.
- Spray-dried powder gives a fine, free-flowing form and Kaifeng Xinghua sells spray-dried sodium saccharin as a white crystalline powder.
- Specialty salts such as calcium saccharin and saccharin potassium serve sodium-free drugs, and Blue Jet and Salvi now offer them.
- Pharmacopeia certification covers USP/NF, JP, EP, BP and FSSC 22000 approvals, which buyers of oral care products and medicines require.
Need a Custom Version of This Report?
Tailor the scope, geography, or segments to your exact requirements.
- Custom geography or segment scope
- Direct access to our analyst team
Korean, Indian and Chinese makers compete on quality
Competition combines a long-established Korean producer, Indian specialty chemical makers and a larger group of Chinese manufacturers and traders. JMC competes on quality and certification, with sodium saccharin that meets USP/NF, JP, Halal and FSSC 22000 requirements from its plant in Ulsan. Blue Jet Healthcare competes on backward integration, pharmacopeia grades and long customer relationships. Kaifeng Xinghua, held by China Pingmei Shenma Group, competes on scale and export reach from Henan. Salvi Chemical Industries focuses on calcium saccharin and other salts with United States drug master files. Chinese suppliers in Tianjin and Shanghai, and Indian makers and distributors serve price-sensitive buyers. Suppliers compete on price per kilogram, certification, consistency between batches and delivery reliability.
Companies profiled and their roles in this market
| Company | Type | Role in the market |
|---|---|---|
| JMC Corporation | Korean producer | Makes saccharin in Ulsan, South Korea, with USP/NF, JP, Halal and FSSC 22000 certifications |
| Blue Jet Healthcare Limited | Indian specialty chemical maker | Holds about 10% of global saccharin capacity and began calcium saccharin dispatches in the year to March 2025 |
| China Pingmei Shenma Group Kaifeng Xinghua Fine Chemical Co., Ltd. | Chinese producer | Henan maker of sodium and spray-dried sodium saccharin, with saccharin as its main business |
| Salvi Chemical Industries Limited | Indian specialty salt maker | Founded in 1978, offers calcium saccharin and saccharin potassium with six United States drug master files |
Credence Research view on regional sweetener demand
Credence Research's view is that Asia-Pacific saccharin demand will grow slowly but steadily, because healthcare and tabletop uses offset weaker food demand. East Asia remains the anchor because of its production base, while South Asia adds the most new demand through generic medicines and a large diabetic population. Falling export prices keep saccharin attractive in blends, even as rival sweeteners gain in premium drinks. Producers with pharmacopeia approvals, specialty salts and clean processes are best placed through 2035.
How the regional estimate was built
The report uses 2025 as the base year and presents market values in USD million through 2035. Market values come from the Credence Research model, and country group, product type, application, grade and sales channel splits are Credence Research estimates. Country group shares follow the Credence Research regional model, checked against production, trade prices, pharmaceutical activity and diabetes statistics for each group. Inputs include WHO guidance, national regulations, government statements, company annual reports and websites, trade platforms and news reports. No interviews or surveys were used in preparing these estimates.
Healthcare uses and South Asia lead growth to 2035
The Asia-Pacific saccharin market is expected to reach USD 54.7 million by 2035, a 2.19% CAGR during 2026–2035, as healthcare formulations and tabletop products sustain demand. South Asia should gain the most share, while East Asia stays the largest country group. Calcium saccharin, pharmaceutical grade and distributor sales are expected to grow faster than the regional average. Wider sugar taxes in Southeast Asia would raise this outlook, while faster switching to rival sweeteners in drinks would lower it.
Frequently Asked Questions
How big is the Asia-Pacific saccharin market?
Which country group leads regional demand?
Which country group grows fastest?
Which product type holds the largest share?
Which application grows fastest?
How does the WHO guideline affect saccharin?
Which sales channel leads the market?
Who are the main companies in the market?
Table of Content
Chapter 1 Market Segmentation
- 1.1 Segmentation Framework
- 1.1.1 Product and Service Classification
- 1.1.2 Application and End-Use Classification
- 1.1.3 Technology and Solution Classification
- 1.1.4 Customer and Distribution Channel Classification
- 1.1.5 Geographic Segmentation
- 1.1.6 Market Segment Definitions and Boundaries
- 1.2 By Product Type
- 1.2.1 Sodium saccharin
- 1.2.2 Calcium saccharin
- 1.2.3 Acid saccharin
- 1.3 By Application
- 1.3.1 Food and beverages
- 1.3.2 Tabletop sweeteners
- 1.3.3 Healthcare formulations
- 1.3.4 Technical applications
- 1.4 By Grade
- 1.4.1 Food grade
- 1.4.2 Pharmaceutical grade
- 1.4.3 Technical grade
- 1.5 By Sales Channel
- 1.5.1 Direct producer sales
- 1.5.2 Authorised distributors
- 1.5.3 Independent importers
- 1.6 By Country Group
- 1.6.1 East Asia
- 1.6.2 South Asia
- 1.6.3 Southeast Asia
- 1.6.4 Rest of Asia-Pacific
Chapter 2 Introduction
- 2.1 Report Objectives and Scope
- 2.2 Product Definition and Industry Terminology
- 2.3 Market Inclusions and Exclusions
- 2.4 Research Process
- 2.4.1 Primary Research and Expert Interviews
- 2.4.2 Secondary Research and Source Review
- 2.4.3 Top-Down and Bottom-Up Estimation
- 2.4.4 Data Triangulation and Verification
- 2.5 Market Size Measurement Basis
- 2.5.1 2025: USD 44.0 million → 2035: USD 54.7 million
- 2.6 Historical and Forecast Reference Periods
- 2.6.1 Historical Period: 2018-2025
- 2.6.2 Base Year: 2025
- 2.6.3 Forecast Period: 2025-2035
- 2.7 Research Assumptions and Limitations
Chapter 3 Executive Summary
- 3.1 Market Snapshot and Key Findings
- 3.2 Base-Year Market Size, 2025
- 3.3 Forecast Market Size, 2035
- 3.4 Revenue and Volume Growth Outlook
- 3.5 Key Demand and Supply Indicators
- 3.6 Leading Market Segments
- 3.7 Fastest-Growing Market Opportunities
- 3.8 Regional Performance Highlights
- 3.9 Technology and Industry Transformation
- 3.10 Competitive Landscape Summary
- 3.11 Analyst View and Strategic Implications
Chapter 4 Asia-Pacific Saccharin Market Trends and Developments
- 4.1 Historical Industry Development, 2018-2025
- 4.2 Recent Market Trends and Developments
- 4.3 Demand and Customer Behavior Trends
- 4.4 Technology and Product Innovation
- 4.5 Artificial Intelligence, Automation and Digitalization
- 4.6 Local Manufacturing and Supply Chain Realignment
- 4.7 Industry Partnerships, Mergers and Acquisitions
- 4.8 Sustainability and Circular Economy Developments
- 4.9 Government and Private Sector Investment Trends
- 4.10 Emerging Business Models and Commercialization
- 4.11 Industry Developments and Announcements
Chapter 5 Asia-Pacific Saccharin Market Production, Supply and Demand Analysis
- 5.1 Demand Trend and Consumption Analysis, 2018-2025
- 5.2 Demand Forecast, 2025-2035
- 5.3 Production and Output Trend, 2018-2025
- 5.4 Production and Output Forecast, 2025-2035
- 5.5 Installed Capacity and Capacity Utilization
- 5.6 Company-Wise Production Plants and Statistics
- 5.6.1 Installed Production Capacity
- 5.6.2 Actual Production
- 5.6.3 Planned Capacity and Expansion Targets
- 5.7 Supply Chain Structure and Procurement Trends
- 5.8 Supply-Demand Gap and Bottlenecks
- 5.9 Import Dependence and Sourcing Structure
- 5.10 Contract Manufacturing and Outsourcing
- 5.11 Regional Supply and Demand Concentration
Chapter 6 Asia-Pacific Saccharin Market Pricing Analysis
- 6.1 Pricing Structure and Measurement
- 6.2 Historical Pricing Trends, 2018-2025
- 6.3 Pricing Outlook, 2025-2035
- 6.4 Average Selling Price and Unit Economics
- 6.5 Pricing by Product and Market Segment
- 6.6 Geographic Pricing Differences
- 6.7 Key Input, Energy, Labor and Logistics Costs
- 6.8 Contract Pricing and Purchasing Models
- 6.9 Pricing Sensitivity and Competitive Positioning
- 6.10 Price, Margin and Profitability Implications
Chapter 7 Asia-Pacific Saccharin Market Dynamics
- 7.1 Market Growth Drivers
- 7.1.1 Demand-Side Drivers
- 7.1.2 Technology and Innovation Drivers
- 7.1.3 Infrastructure and Investment Drivers
- 7.1.4 Regulatory and Policy Drivers
- 7.2 Market Restraints
- 7.2.1 Cost and Affordability Constraints
- 7.2.2 Technology and Adoption Barriers
- 7.2.3 Supply Chain and Operational Constraints
- 7.3 Market Challenges
- 7.3.1 Competitive Pressure and Margin Erosion
- 7.3.2 Skills, Infrastructure and Implementation Gaps
- 7.4 Emerging Market Opportunities
- 7.5 Market Dynamics Impact and Time-Horizon Assessment
Chapter 8 Asia-Pacific Saccharin Value Chain Analysis
- 8.1 Industry Value Chain Overview
- 8.2 Upstream Suppliers and Critical Inputs
- 8.3 Technology and Component Providers
- 8.4 Manufacturing or Service Delivery
- 8.5 Distribution, Channel Partners and Integrators
- 8.6 Downstream Applications and End Users
- 8.7 Value Addition and Profit Pools
- 8.8 Vertical Integration and Outsourcing
- 8.9 Supplier Concentration and Risk
- 8.10 Supply Chain Localization and Resilience
Chapter 9 Asia-Pacific Saccharin Market Regulations and Policies
- 9.1 Relevant Laws, Standards and Compliance Frameworks
- 9.2 Product, Service, Safety and Quality Requirements
- 9.3 Government Policies, Incentives and Subsidies
- 9.4 Imports, Exports and Trade Barriers
- 9.5 Public Procurement and Local Content Requirements
- 9.6 Environmental and Sustainability Compliance
- 9.7 Upcoming Policy Changes and Market Implications
Chapter 10 Asia-Pacific Saccharin Market Hotspots and Opportunities
- 10.1 Market Opportunity Mapping and Growth Hotspots
- 10.2 High-Growth Applications and Customer Groups
- 10.3 Underserved Markets and White-Space Opportunities
- 10.4 Emerging Technology and Product Opportunities
- 10.5 New Capacity and Investment Hotspots
- 10.6 Market Entry and Expansion Opportunities
- 10.7 Distribution and Partnership Opportunities
- 10.8 Near-Term and Long-Term Commercial Potential
- 10.9 Opportunity Attractiveness and Execution Risks
Chapter 11 Asia-Pacific Saccharin Market Outlook, 2025-2035
- 11.1 Market Size and Analysis
- 11.1.1 Revenue (Market Measurement: 2025: USD 44.0 million → 2035: USD 54.7 million)
- 11.1.2 Market Volume and Quantity Sold
- 11.1.3 Historical Market Size, 2018-2025
- 11.1.4 Base-Year Market Size, 2025
- 11.2 Market Forecast, 2025-2035
- 11.2.1 Revenue Forecast to 2035
- 11.2.2 Volume Forecast to 2035
- 11.2.3 CAGR and Year-on-Year Growth
- 11.2.4 Incremental Revenue Opportunity
- 11.3 Forecast Assumptions and Scenario Analysis
- 11.3.1 Base-Case Forecast
- 11.3.2 Optimistic and Conservative Scenarios
- 11.3.3 Technology, Pricing and Policy Sensitivities
- 11.4 Market Attractiveness and Growth Outlook
Chapter 12 Asia-Pacific Saccharin Market Segmentation and Outlook
- 12.1 Segmentation Summary and Market Shares, 2025
- 12.2 Largest and Fastest-Growing Segments
- 12.3 By Product Type - Market Size and Forecast, 2025-2035
- 12.3.1 Segment Definition and Scope
- 12.3.2 Historical Market Size, 2018-2025
- 12.3.3 Revenue Forecast, 2025-2035
- 12.3.4 Volume Forecast, 2025-2035
- 12.3.5 Base-Year Market Share, 2025
- 12.3.6 Segment CAGR and Growth Drivers
- 12.3.7 Subsegment Market Size and Forecast
- 12.3.7.1 Sodium saccharin
- 12.3.7.2 Calcium saccharin
- 12.3.7.3 Acid saccharin
- 12.3.8 Subsegment Pricing and Adoption Trends
- 12.3.9 Leading Suppliers and Competition
- 12.3.10 Regional Demand and Opportunities
- 12.4 By Application - Market Size and Forecast, 2025-2035
- 12.4.1 Segment Definition and Scope
- 12.4.2 Historical Market Size, 2018-2025
- 12.4.3 Revenue Forecast, 2025-2035
- 12.4.4 Volume Forecast, 2025-2035
- 12.4.5 Base-Year Market Share, 2025
- 12.4.6 Segment CAGR and Growth Drivers
- 12.4.7 Subsegment Market Size and Forecast
- 12.4.7.1 Food and beverages
- 12.4.7.2 Tabletop sweeteners
- 12.4.7.3 Healthcare formulations
- 12.4.7.4 Technical applications
- 12.4.8 Subsegment Pricing and Adoption Trends
- 12.4.9 Leading Suppliers and Competition
- 12.4.10 Regional Demand and Opportunities
- 12.5 By Grade - Market Size and Forecast, 2025-2035
- 12.5.1 Segment Definition and Scope
- 12.5.2 Historical Market Size, 2018-2025
- 12.5.3 Revenue Forecast, 2025-2035
- 12.5.4 Volume Forecast, 2025-2035
- 12.5.5 Base-Year Market Share, 2025
- 12.5.6 Segment CAGR and Growth Drivers
- 12.5.7 Subsegment Market Size and Forecast
- 12.5.7.1 Food grade
- 12.5.7.2 Pharmaceutical grade
- 12.5.7.3 Technical grade
- 12.5.8 Subsegment Pricing and Adoption Trends
- 12.5.9 Leading Suppliers and Competition
- 12.5.10 Regional Demand and Opportunities
- 12.6 By Sales Channel - Market Size and Forecast, 2025-2035
- 12.6.1 Segment Definition and Scope
- 12.6.2 Historical Market Size, 2018-2025
- 12.6.3 Revenue Forecast, 2025-2035
- 12.6.4 Volume Forecast, 2025-2035
- 12.6.5 Base-Year Market Share, 2025
- 12.6.6 Segment CAGR and Growth Drivers
- 12.6.7 Subsegment Market Size and Forecast
- 12.6.7.1 Direct producer sales
- 12.6.7.2 Authorised distributors
- 12.6.7.3 Independent importers
- 12.6.8 Subsegment Pricing and Adoption Trends
- 12.6.9 Leading Suppliers and Competition
- 12.6.10 Regional Demand and Opportunities
- 12.7 By Country Group - Market Size and Forecast, 2025-2035
- 12.7.1 Segment Definition and Scope
- 12.7.2 Historical Market Size, 2018-2025
- 12.7.3 Revenue Forecast, 2025-2035
- 12.7.4 Volume Forecast, 2025-2035
- 12.7.5 Base-Year Market Share, 2025
- 12.7.6 Segment CAGR and Growth Drivers
- 12.7.7 Subsegment Market Size and Forecast
- 12.7.7.1 East Asia
- 12.7.7.2 South Asia
- 12.7.7.3 Southeast Asia
- 12.7.7.4 Rest of Asia-Pacific
- 12.7.8 Subsegment Pricing and Adoption Trends
- 12.7.9 Leading Suppliers and Competition
- 12.7.10 Regional Demand and Opportunities
- 12.8 Segment Growth Comparison
- 12.9 Segment Attractiveness and Priority Matrix
Chapter 13 Asia-Pacific Saccharin End-Use and Application Market Outlook
- 13.1 End-Use Industry and Customer Demand Structure
- 13.2 Leading Applications and Customer Groups
- 13.3 End-Use Market Size, Share and Forecast
- 13.4 Major End-Use Industry Deep Dives
- 13.4.1 Customer Requirements and Use Cases
- 13.4.2 Demand and Replacement Cycles
- 13.4.3 Technical and Regulatory Considerations
- 13.4.4 Purchasing and Procurement Models
- 13.4.5 Leading Vendors and Distribution Channels
- 13.4.6 Forecast and Commercial Opportunities
- 13.5 Emerging Applications and Cross-Segment Demand
- 13.6 End-Use Industry Investment Priorities
Chapter 14 Asia-Pacific Saccharin Geographic Market Outlook, 2025-2035
- 14.1 Regional Market Size and Country-Level Shares, 2025
- 14.2 Country Market Size Comparison, 2025
- 14.3 Country Market Forecasts, 2025-2035
- 14.4 Subregional Industrial and Demand Clusters
- 14.5 Intra-Regional Pricing and Cost Differences
- 14.6 Cross-Border Trade and Supply Networks
- 14.7 Regional Supply and Demand Balances
- 14.8 Country Opportunity Comparison and Prioritization
Note: Every listed country is covered on the structure shown under the first country.
Chapter 15 Asia-Pacific Saccharin Technology, Innovation and Sustainability Outlook
- 15.1 Technology Landscape and Maturity
- 15.2 Product, Process and Service Innovation
- 15.3 AI, Automation and Digital Tools in the Industry
- 15.4 Technology Adoption and Performance Benchmarking
- 15.5 Innovation Pipeline and R&D Investment
- 15.6 Patent and Intellectual Property Trends
- 15.7 Energy Efficiency and Resource Management
- 15.8 Sustainability, Recycling and Circularity
- 15.9 Technology Roadmap, 2025-2035
- 15.10 Risks of Obsolescence and Technology Substitution
Chapter 16 Asia-Pacific Saccharin Market Key Strategic Imperatives
- 16.1 Growth and Market Entry Priorities
- 16.2 High-Return Products and Segments
- 16.3 Pricing, Profitability and Cost Optimization
- 16.4 Technology Investment and Product Differentiation
- 16.5 Supply Chain Localization and Resilience
- 16.6 Distribution and Customer Acquisition
- 16.7 Partnership, Acquisition and Capacity Strategy
- 16.8 Regional Expansion Priorities
- 16.9 Short-, Medium- and Long-Term Actions
Chapter 17 Competition Outlook
- 17.1 Industry Competition Characteristics
- 17.2 Market Structure and Concentration
- 17.3 Market Share and Competitive Positioning, 2025
- 17.4 Company-Wise Revenue and Product Benchmarking
- 17.5 Production and Service Capacity Benchmarking
- 17.6 Technology, Pricing and Differentiation
- 17.7 Regional Footprint and Distribution Strength
- 17.8 Mergers, Acquisitions and Strategic Alliances
- 17.9 New Entrants and Competitive Threats
- 17.10 Porter's Five Forces and Industry Attractiveness
- 17.11 Competitive Outlook, 2025-2035
Chapter 18 Company Profiles
- 18.1 Company Coverage and Selection Criteria
- 18.2 JMC Corporation
- 18.2.1 Business Description
- 18.2.2 Company Ownership and Geographic Presence
- 18.2.3 Product and Service Portfolio
- 18.2.4 Manufacturing and Operating Footprint
- 18.2.5 Production Capacity and Expansion Plans
- 18.2.6 Financial Performance and Investment
- 18.2.7 Market Share and Competitive Position
- 18.2.8 Technology and Innovation Capabilities
- 18.2.9 Strategic Alliances or Partnerships
- 18.2.10 Recent Developments
- 18.2.11 Growth Strategy and Outlook
- 18.3 Blue Jet Healthcare Limited
- 18.4 China Pingmei Shenma Group Kaifeng Xinghua Fine Chemical Co., Ltd.
- 18.5 Tianjin Changjie Chemical Co., Ltd.
- 18.6 Tianjin North Food Co., Ltd.
- 18.7 Shanghai Fortune Chemical Co., Ltd.
- 18.8 Salvi Chemical Industries Limited
- 18.9 Shree Vardayini Chemical Industries Pvt. Ltd.
- 18.10 PT Batang Alum Industrie
- 18.11 Muby Chemicals
- 18.12 Other Relevant Market Participants
Note: Every listed company is profiled on the structure shown under the first company. The company list is preliminary and may change based on research findings, market developments, data availability and client requirements.
Chapter 19 Disclaimer
- 19.1 Research and Forecast Disclaimer
- 19.2 Data Source and Estimation Limitations
Note: The depth of individual sections depends on data availability for this market. Volume, capacity, trade and other unit-based metrics are included where applicable.

