
Public data platforms turn freight and traffic into software
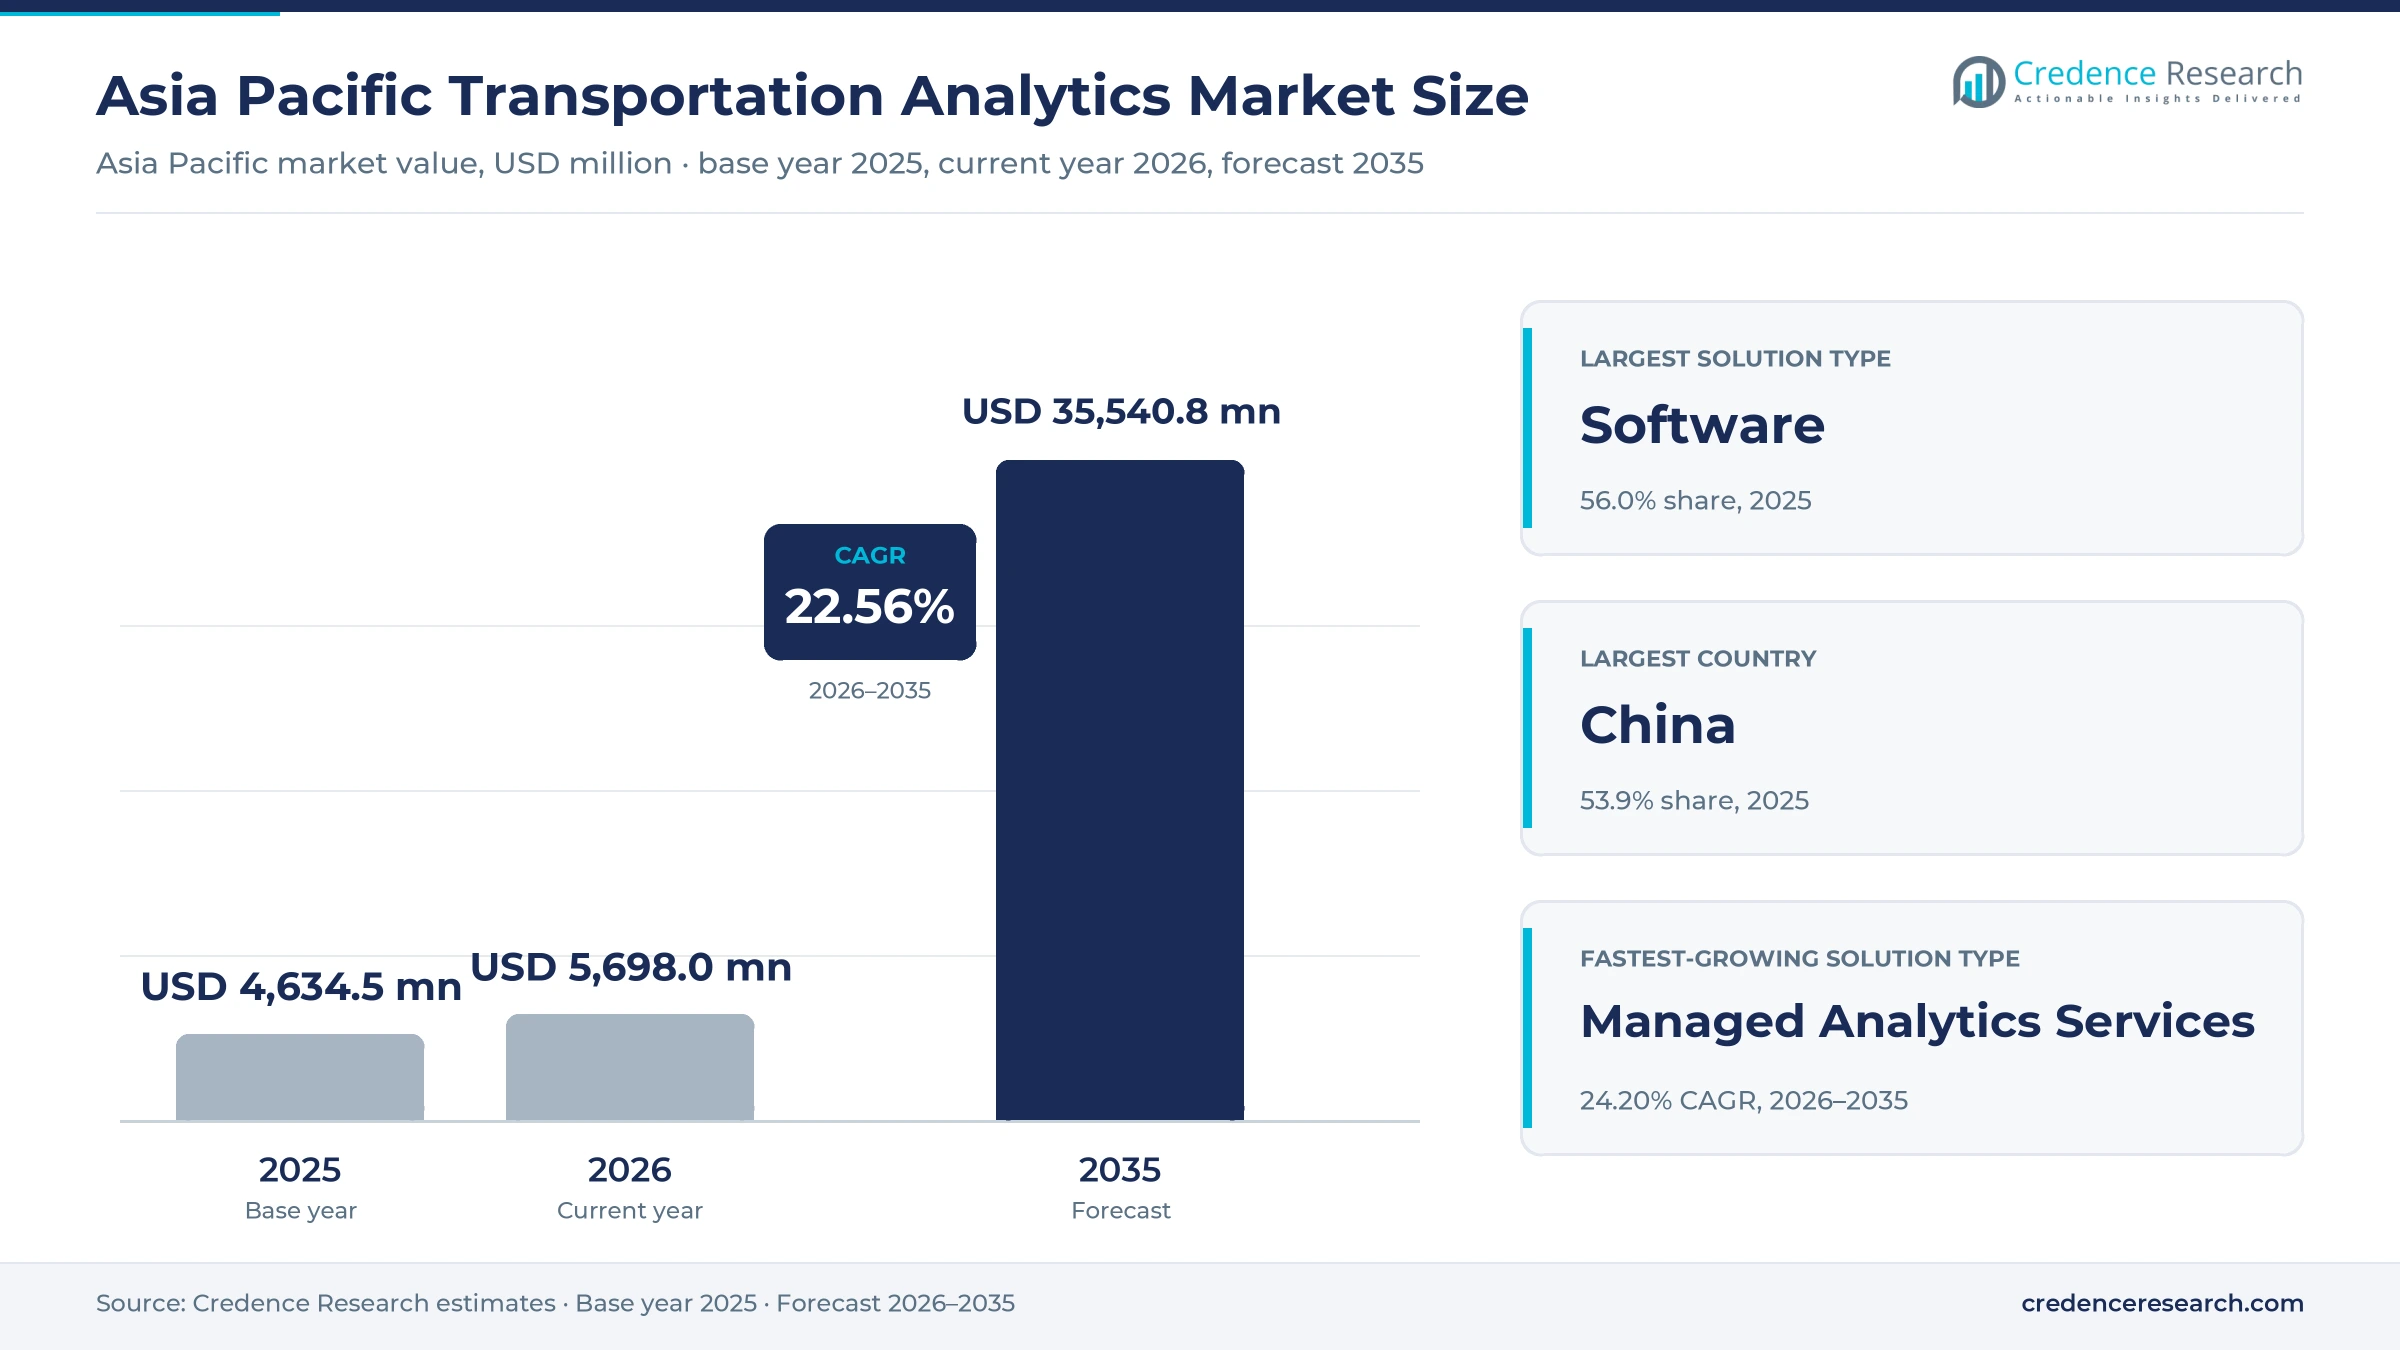
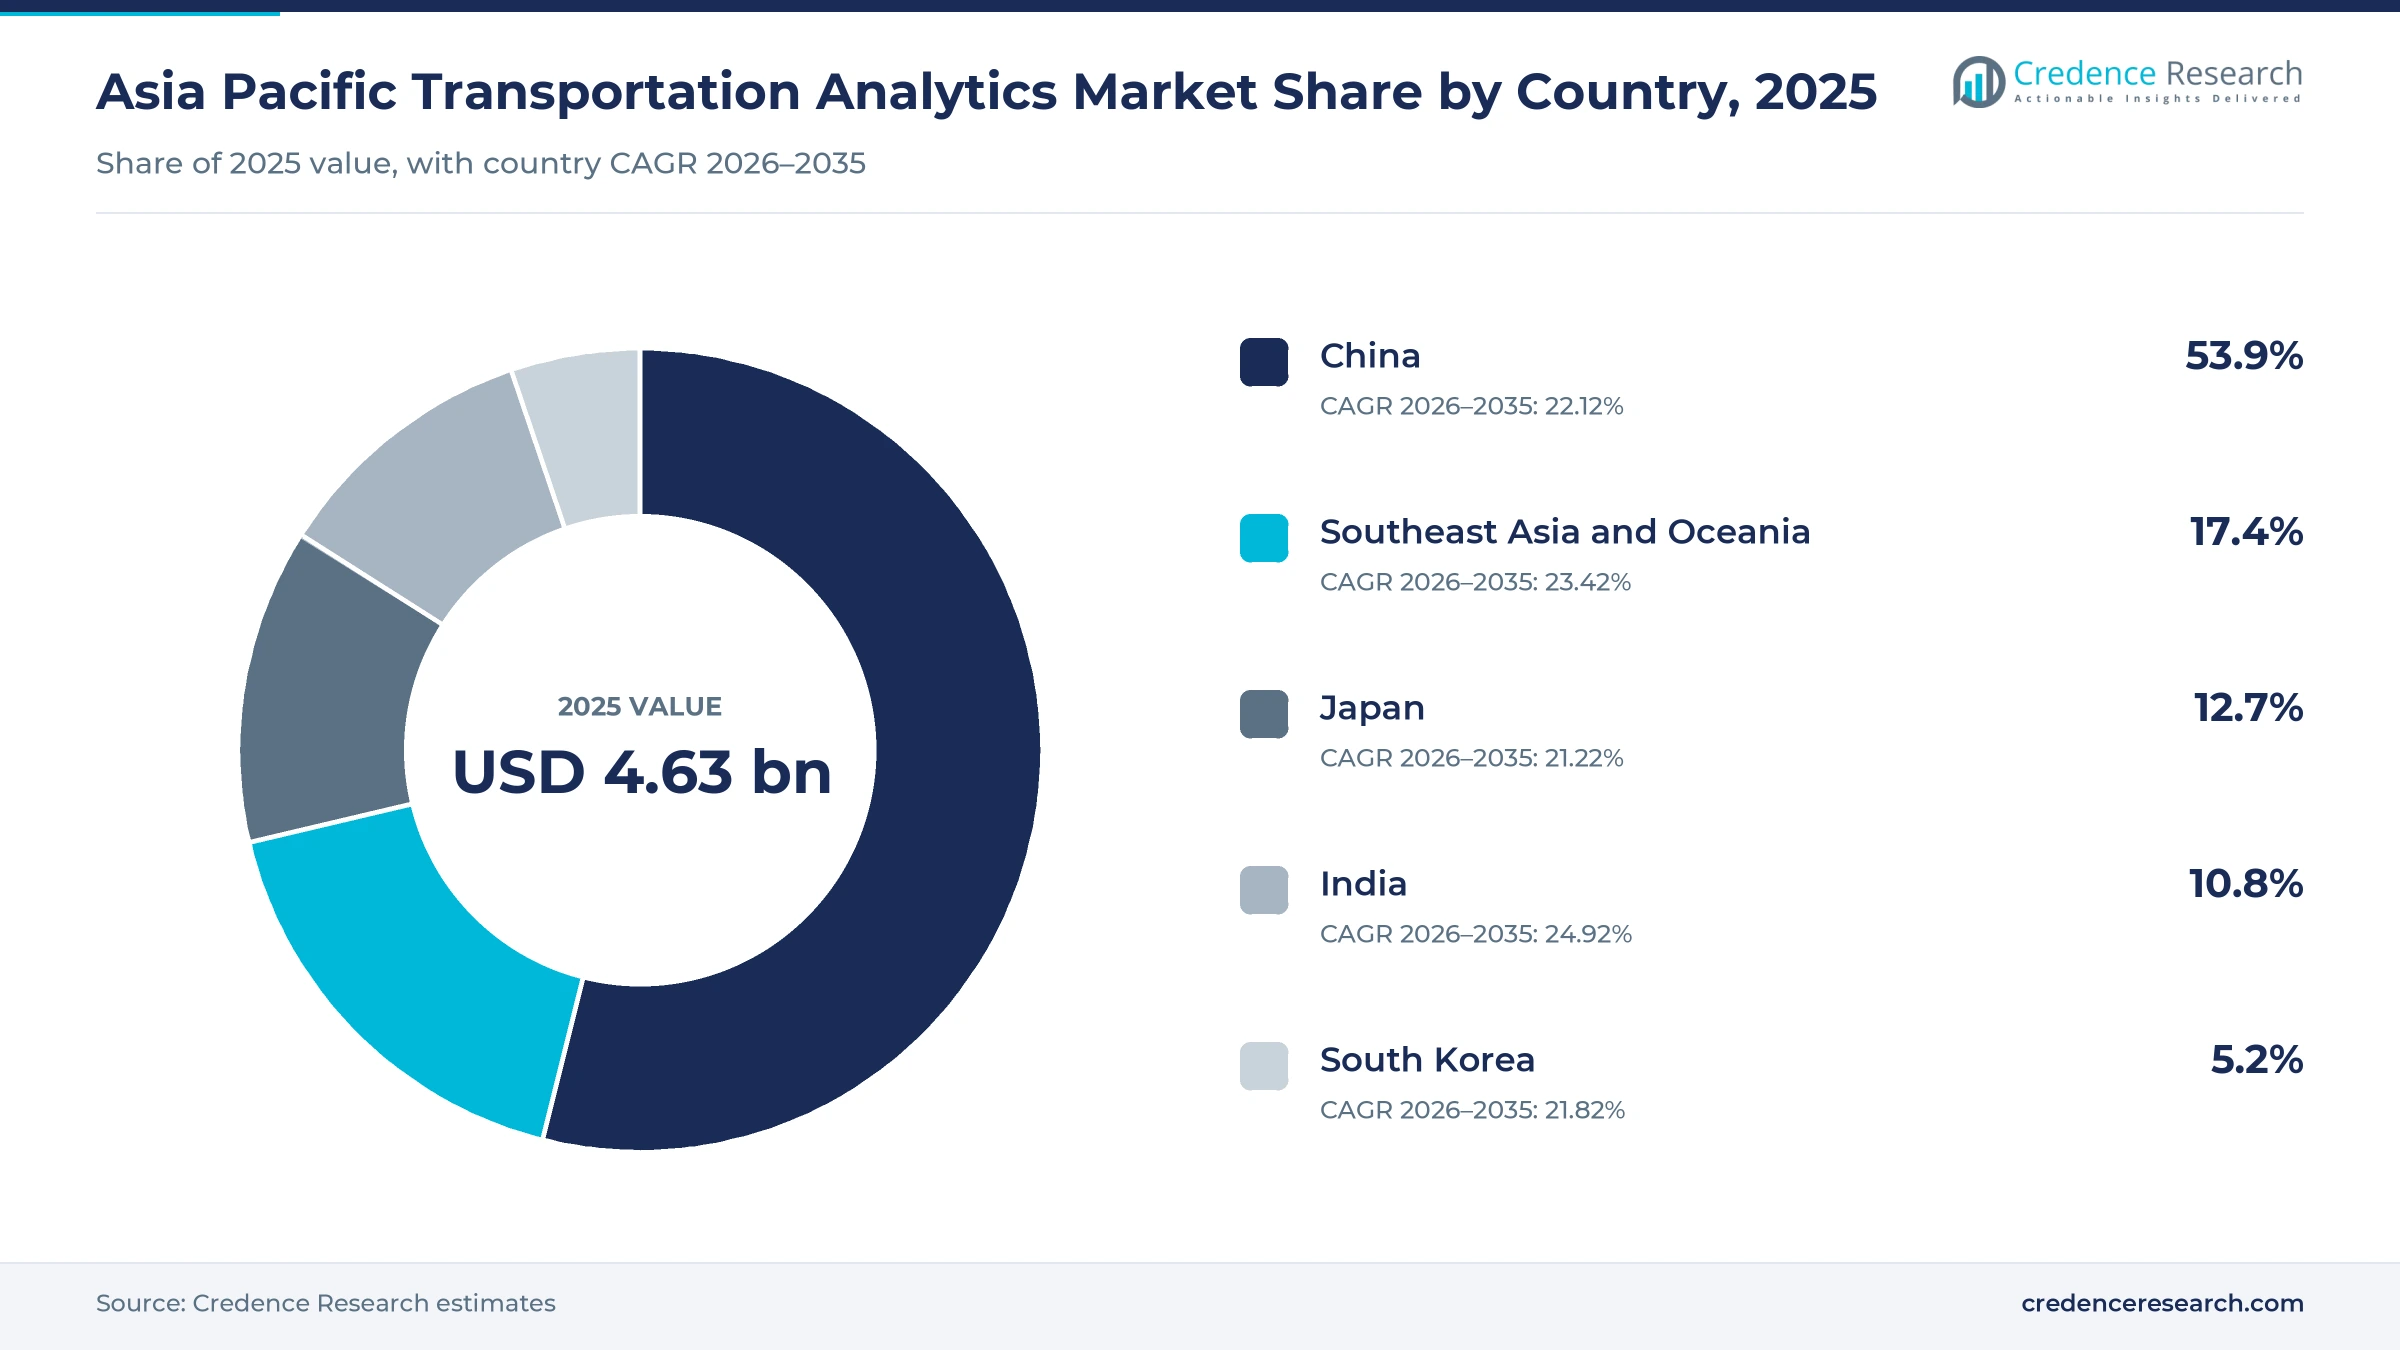
The Asia Pacific transportation analytics market was valued at USD 4.63 billion in 2025 and is projected to increase from USD 5.70 billion in 2026 to USD 35.54 billion by 2035, registering a CAGR of 22.56% during 2026–2035. Demand comes from freight carriers, shippers, highway operators, transit agencies, airports and ports that buy software and services to turn vehicle, toll, signal and shipment data into planning and operating decisions. China held the largest country share, 53.9% in 2025, because its road network and freight volumes are the largest in the region and provincial highway groups now build their own AI models. India is the fastest-growing country at 24.92% a year, as government logistics data platforms open shipment and vehicle records to private users. In turn, Japan's limits on truck driver overtime and new shipper obligations are pushing companies toward load matching, route planning and shared delivery platforms.
Which tools and buyers does the estimate count?
The estimate measures spending across Asia Pacific on software, professional services and managed services that analyze data from vehicles, roads, terminals and shipments. It counts fleet performance tools, logistics network planning, traffic management analytics and asset and passenger operations software bought by road freight and logistics firms, road infrastructure operators, passenger transport operators and aviation and maritime operators.
The estimate excludes vehicles, roadside hardware, cameras, signals, toll gantries and telecom networks bought on their own, and it excludes general business intelligence licenses not tied to transport operations. The value chain runs from data sources such as telematics, tolling and ticketing through cloud platforms and analytics vendors to operators in China, Japan, India, South Korea and Southeast Asia and Oceania.
Asia Pacific Transportation Analytics Market Insights
- The Asia Pacific transportation analytics market was valued at USD 4.63 billion in 2025 and is projected to reach USD 35.54 billion by 2035, at a 22.56% CAGR during 2026–2035.
- China held a 53.9% share of 2025 value, because its freight volumes, expressway network and provincial highway groups create the largest analytics budgets in the region.
- Software led solution types with a 56.0% share of 2025 value, as operators license planning, monitoring and prediction tools before buying services.
- Japan's amended logistics law requires specified shippers to appoint a chief logistics officer from April 1, 2026, which raises demand for load and route data.
- Managed analytics services grow fastest among solution types at 24.20% a year during 2026–2035, as operators outsource data pipelines and model upkeep.
Software leads while managed services and cloud gain fastest
Why does software hold the largest share?
Based on solution type, the market is categorized into software, professional services and managed analytics services. Software led with a 56.0% share of 2025 value, because operators license route planning, traffic monitoring and fleet dashboards as the core of each program. Managed Analytics Services grow fastest at 24.20% a year, as highway groups and carriers hand data pipelines and model upkeep to outside teams.
How fast are buyers moving to cloud delivery?
Based on deployment model, the market is categorized into cloud, on-premise and hybrid. Cloud led with a 46.0% share of 2025 value, because freight carriers and shippers buy subscription tools that need no local servers. Cloud also grows fastest at 23.67% a year, as AI models for traffic prediction need elastic computing that most operators cannot host themselves.
Which operators place the largest orders?
Based on end-use industry, the market is categorized into road freight and logistics, road infrastructure operations, passenger transport and aviation and maritime. Road Freight and Logistics led with a 38.0% share of 2025 value, because carriers and shippers buy planning and tracking tools at scale. Road Freight and Logistics grows fastest at 23.26% a year, as driver limits and cost targets push load matching.
Where do applications create the most value?
Based on application, the market is categorized into fleet performance, logistics network optimization, traffic management and transport asset and passenger operations. Traffic Management led with a 30.0% share of 2025 value, because highway and city agencies fund signal, incident and flow analytics. Logistics Network Optimization grows fastest at 23.56% a year, as shared trunk routes and multimodal visibility need network-wide planning.
| Segment Group | Leading Sub-segment | Share, 2025 | Fastest-growing Sub-segment | CAGR, 2026–2035 |
|---|---|---|---|---|
| By Solution Type | Software | 56.0% | Managed Analytics Services | 24.20% |
| By Deployment Model | Cloud | 46.0% | Cloud | 23.67% |
| By End-Use Industry | Road Freight and Logistics | 38.0% | Road Freight and Logistics | 23.26% |
| By Application | Traffic Management | 30.0% | Logistics Network Optimization | 23.56% |
Request a Free Sample
Fill in your details and we'll send you a free sample report.
- Sample data tables & charts
- Research methodology
Shared data, driver limits and cloud AI lift spending
How does public logistics data integration lift demand?
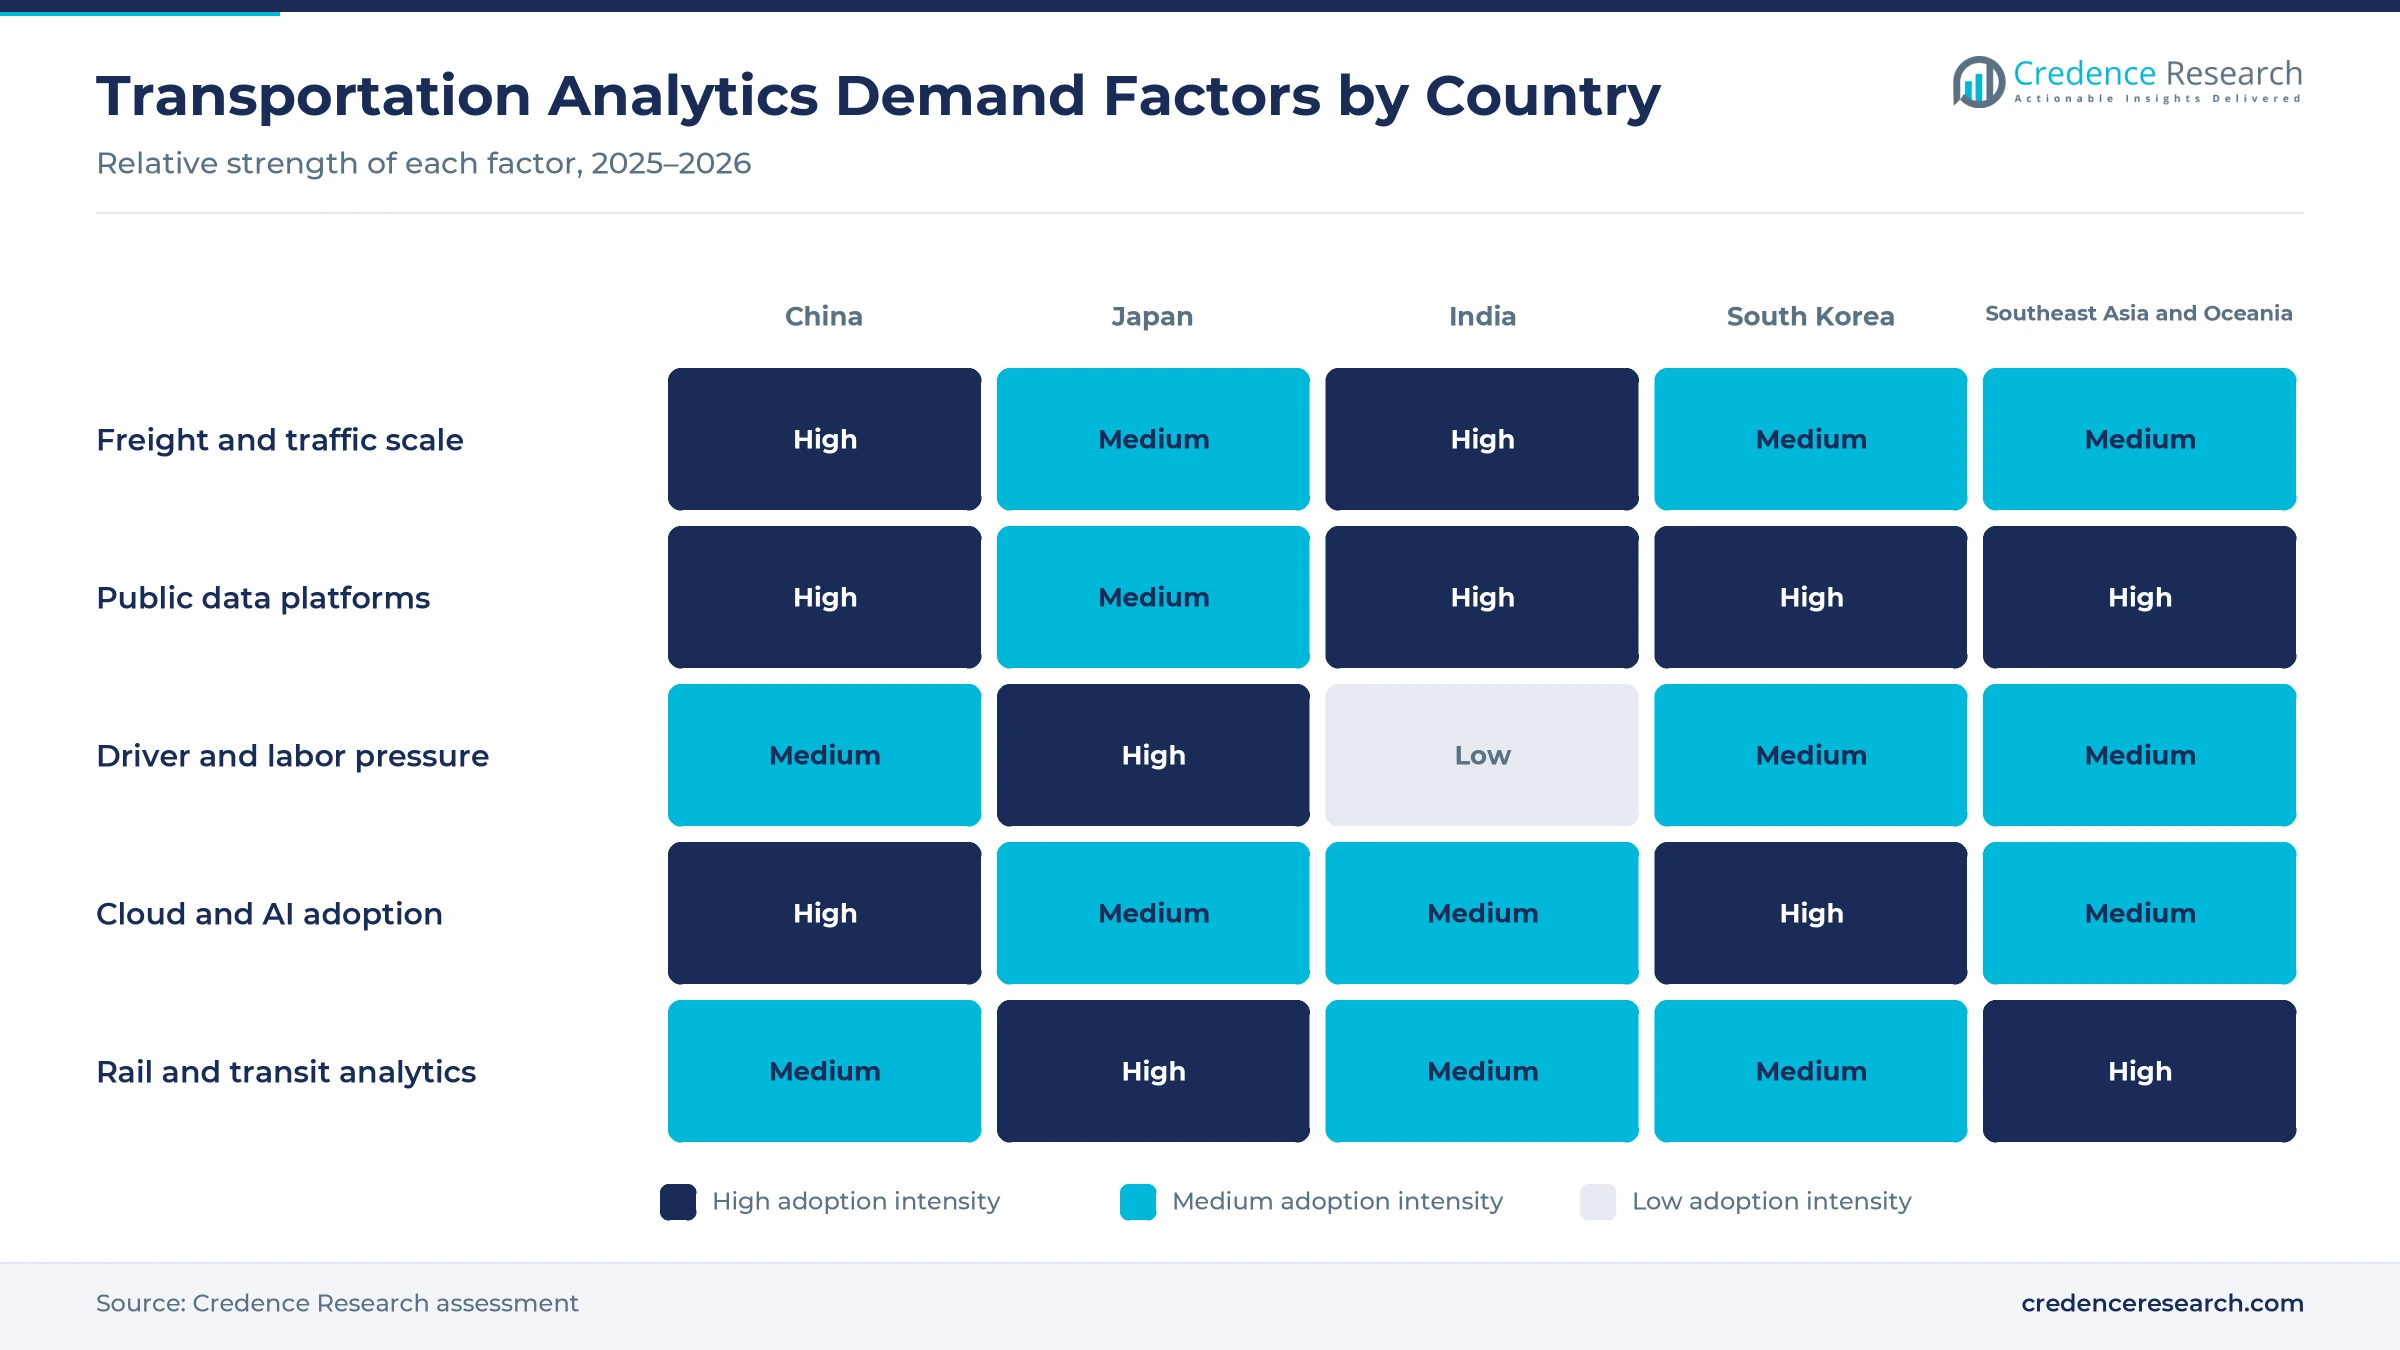
Governments are opening shipment, vehicle and permit records through shared platforms, which gives analytics vendors far richer inputs to work with. India's Unified Logistics Interface Platform passed 100 crore API transactions in March 2025, linking 43 systems of 11 ministries through 129 APIs, Doordarshan News reported. More than 1,300 companies had registered on it by then. The Logistics Data Bank now syncs with those APIs to track containers, vehicles and rail freight, and PM GatiShakti Public offers 230 non-sensitive datasets, according to a government logistics brief. As a result, more Indian carriers and shippers can buy analytics built on shared records.
Why do reliability and driver productivity matter?
Operators must move more freight with fewer driver hours, so planning tools that raise load rates have become a necessity rather than an option. Japan capped annual overtime for truck drivers at 960 hours from April 2024, and the World Economic Forum noted that transport capacity could fall 34% short by 2030 without action. Hitachi and Okamura began using automated delivery planning, load calculation and vehicle tracking on Feb. 27, 2025 to cut vehicles and planning time. Hitachi and pharmaceutical wholesaler KSK then began a trial at its Osaka branch in September 2025, with rollout planned to all 32 branches. Consequently, road freight and logistics led with 38.0% of 2025 value.
How do cloud delivery and operational intelligence add value?
Large AI models for traffic and maintenance need elastic computing, which moves analytics budgets toward cloud platforms and managed services. Hubei Communications Investment Group launched the Jingchu Xing transport model on June 30, 2026, built on Huawei Cloud, with more than 20 AI agents across over 6,400 km of highways. Huawei said the system processes 3.18 billion data records from sensing, tolling and maintenance. In June 2026, Huawei also unveiled a Road Traffic Agent covering signal management, emergency dispatch and traffic forecasting at a forum in Macao. In turn, cloud deployment grows fastest at 23.67% a year through the forecast.
Why do national logistics cost targets raise spending?
China and India both track logistics costs against GDP, and those targets reward tools that remove empty miles and waiting time. China's logistics costs equaled 14% of GDP in the first three quarters of 2025, with a target of about 13.5% by 2027, according to National Development and Reform Commission data. A DPIIT and NCAER study put India's logistics cost at 7.97% of GDP in 2023-24, or ₹24.01 lakh crore. China's Ministry of Transport counted 39.49 billion metric tons of highway freight from January to November 2025, up 3.6%. As a result, logistics network optimization grows at 23.56% a year, the fastest application.
AI road models and shared trunk platforms reshape buying
Why are transport AI models rising in China?
Chinese agencies now treat AI as core transport infrastructure, which shifts spending from dashboards toward prediction and automated response. The Ministry of Transport, NDRC and MIIT issued implementation opinions on AI and transport on Sept. 22, 2025, targeting extensive AI use in typical transport scenarios by 2027. The opinions also call for a multimodal transport big data resource system and integrated cloud-network data transmission, the European standardization liaison office SESEC reported. Hubei's highway group reported 20% better emergency detection accuracy after its own model went live in 2026. Consequently, China grows at 22.12% a year as provincial operators copy that approach.
How are shared trunk platforms reshaping Japan?
Japanese shippers increasingly share truck space instead of running their own half-empty routes, and each shared route needs common data. Sustainable Shared Transport, a Yamato Holdings subsidiary, launched an open joint delivery platform with Fujitsu on Feb. 1, 2025, matching shipper loads with carrier schedules in standard pallet units. Fujitsu invested 50 million yen in the company and set a target of 80 routes by the end of March 2026. Japan's amended logistics law, promulgated on May 15, 2024, requires specified shippers to file plans and appoint a chief logistics officer from April 1, 2026, according to the government law outline. As a result, Japan grows at 21.22% a year as shippers seek shared route data.
Can tolling and signal data open new revenue?
Electronic tolling and road pricing produce dense, timestamped vehicle records, which creates an opening for traffic and freight analytics. Singapore's Land Transport Authority is testing ERP 2 data to adjust traffic lights through its CRUISE pilot and using AI video analytics for incident detection, according to a Ministry of Transport parliamentary reply dated Aug. 4, 2026. India had about 5.9 crore active FASTags in December 2025, and more than 98% of national highway fees were paid electronically, Business Standard reported. Daily electronic toll transactions averaged about 105 lakh in 2025-26. In turn, intelligent traffic management buyers gain inputs for flow prediction.
Where does rail asset analytics open gains?
Rail and metro operators want to predict faults before trains fail, which creates strong demand for asset and reliability analytics. SBS Transit said in November 2024 that it would use IBM Maximo Application Suite, with watsonx-powered work order intelligence, for predictive maintenance on its Singapore rail operations. Siemens Mobility supplies its Railigent X application suite for the Sydney Metro Western Sydney Airport line, with 15 years of maintenance services. A Siemens consortium was also selected on June 17, 2025 for ETCS Level 2 signaling with real-time train tracking on India's first high-speed rail corridor. Consequently, Southeast Asia and Oceania grows at 23.42% a year, as Singapore and Sydney rail operators add predictive maintenance.
Fragmented data, legacy systems and scarce data skills
How does fragmented operator data slow projects?
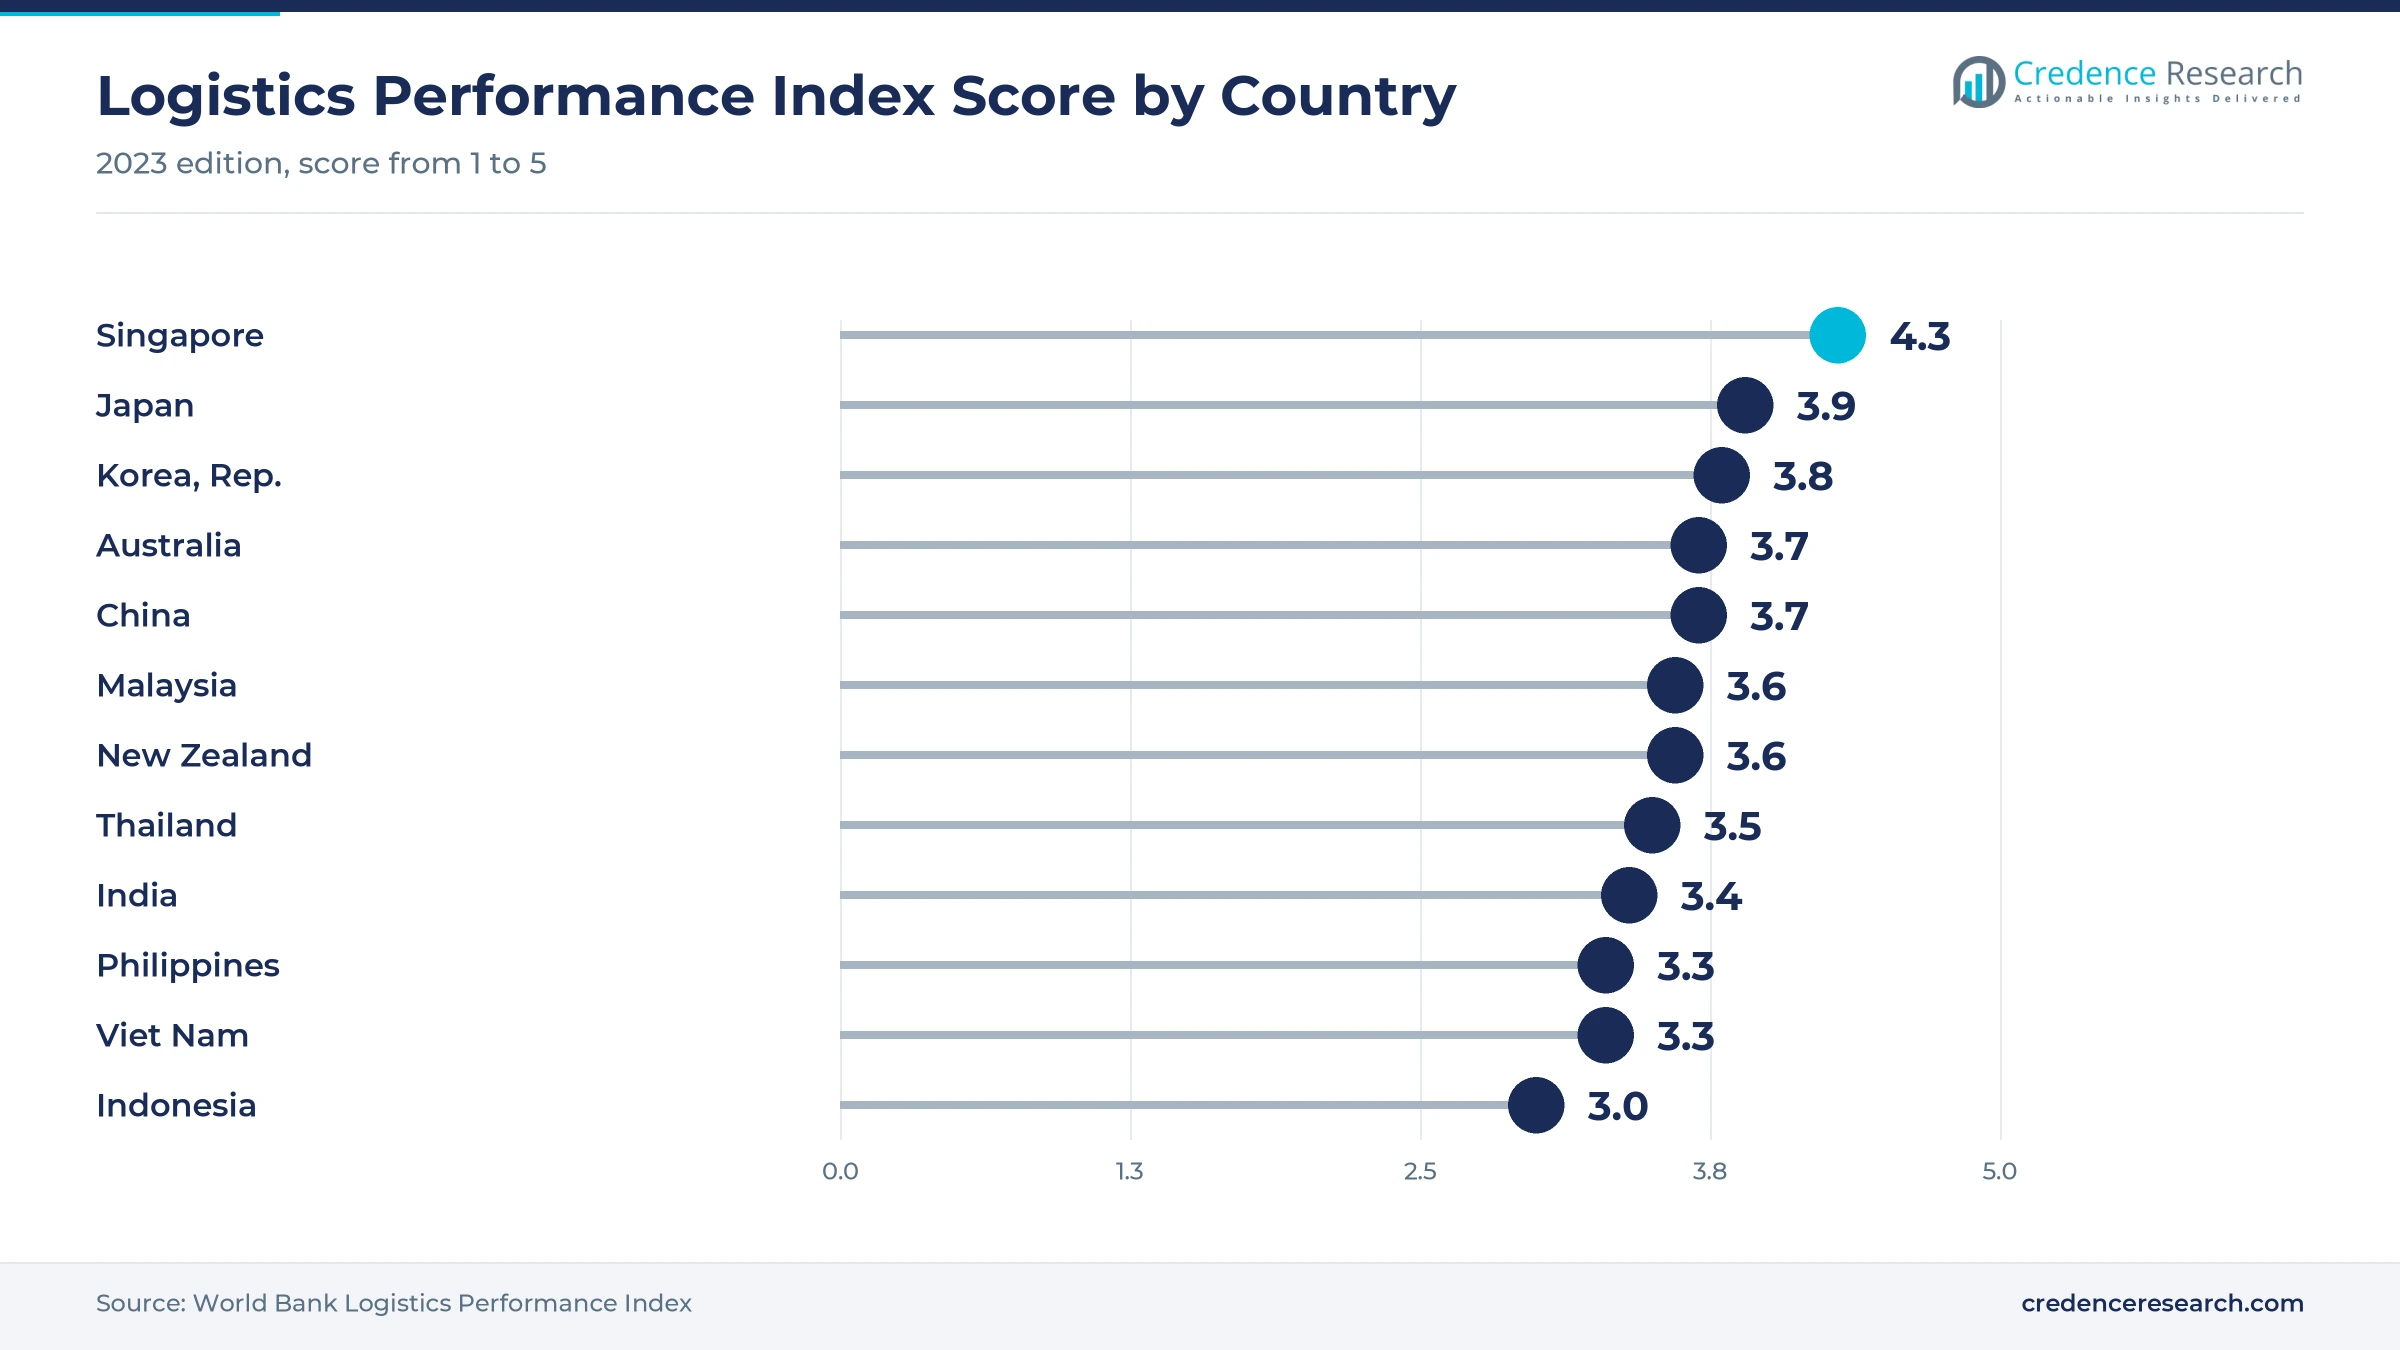
Fleet, toll, port and rail records sit in separate systems with different formats, so integration absorbs much of each project budget. Indonesia scored 3.0 and Singapore 4.3 in the 2022 World Bank Logistics Performance Index, which shows how uneven data and logistics systems remain. India needed 129 APIs across 43 systems to connect logistics data held by 11 ministries. As a result, smaller carriers and city agencies often wait for public platforms before buying analytics of their own. Vendors respond with prebuilt connectors to government platforms and standard pallet and shipment codes.
Why do legacy control systems raise costs?
Many highway, signal and rail control centers run older on-premise systems that were never designed to share live data. Singapore's Land Transport Authority is still piloting CRUISE, its smart traffic light control system, and plans to roll out AI capabilities progressively over the coming years. In turn, analytics projects must add gateways and clean historical records first. Operators respond with hybrid deployments that keep control systems local and move analysis to the cloud.
What limits the supply of data skills?
Operators need staff who understand both transport operations and machine learning, and such people remain scarce outside large cities. Japanese shippers must now appoint chief logistics officers, which adds demand for the same small pool of planners. Consequently, projects can stall after a pilot when internal teams cannot maintain models. Vendors respond with managed analytics services that bundle data engineering, model upkeep and reporting.
Can data security rules delay cloud adoption?
Vehicle movement and passenger records are sensitive, and governments are tightening oversight of how such data is stored and shared. China's AI and transport opinions of September 2025 call for stronger network and data security oversight alongside wider AI use. As a result, cross-border cloud services face extra review, and some operators keep data on local servers. Suppliers respond with in-country cloud regions and private cloud stacks for highway groups.
China leads as India adds analytics spending fastest
| Country | Value, 2025 (USD billion) | Share, 2025 | CAGR, 2026–2035 |
|---|---|---|---|
| China | 2.50 | 53.9% | 22.12% |
| Southeast Asia and Oceania | 0.81 | 17.4% | 23.42% |
| Japan | 0.59 | 12.7% | 21.22% |
| India | 0.50 | 10.8% | 24.92% |
| South Korea | 0.24 | 5.2% | 21.82% |
Freight scale and highway AI keep China ahead
China held a 53.9% share of 2025 value and grows at 22.12% a year. The Ministry of Transport counted 53.54 billion metric tons of freight and 3.27 trillion yuan of transport fixed-asset investment from January to November 2025. Provincial highway groups such as Hubei Communications Investment Group now run their own AI models across thousands of kilometers. Because national policy sets AI targets for 2027 and 2030, highway, port and logistics operators are expected to keep raising analytics budgets.
Shared logistics and new duties reshape Japan
Japan held a 12.7% share of 2025 value and grows at 21.22% a year. The 960-hour overtime cap for truck drivers took effect in April 2024, and specified shippers must appoint chief logistics officers from April 1, 2026. Fujitsu, Hitachi and Yamato's Sustainable Shared Transport have all launched delivery planning or joint transport platforms since early 2025. In turn, Japanese spending favors load matching, route planning and fleet management systems over traffic control tools.
Why does India grow fastest?
India held a 10.8% share of 2025 value and grows fastest at 24.92% a year. Its Unified Logistics Interface Platform passed 100 crore API transactions in March 2025, and PM GatiShakti Public offers 230 datasets to private users. Logistics cost stood at 7.97% of GDP in 2023-24, which keeps pressure on carriers and shippers to cut delays. As a result, data from India's logistics sector increasingly flows into commercial planning and tracking tools.
Toll and transit data anchor South Korea
South Korea held a 5.2% share of 2025 value and grows at 21.82% a year. Korea covers all 5,224 km of expressways and 13,983 km of national highways with ITS, and Hi-pass electronic tolling reaches a 90.6% usage rate, according to a 2026 presentation by ITS Korea. The ITS Master Plan 2030 targets about 40% fewer traffic accidents and lower traffic costs. Because coverage is already high, Korean spending shifts from new sensors toward analytics on existing toll, signal and bus data.
Road pricing and rail upkeep lift Southeast Asia and Oceania
Southeast Asia and Oceania held a 17.4% share of 2025 value and grows at 23.42% a year. Singapore is testing ERP 2 data for signal timing, and monthly downloads from its Land Transport DataMall rose from 4 million to 600 million after April 2015, Smart Nation Singapore reported. SBS Transit uses IBM Maximo for rail maintenance, and Siemens Mobility supports a new Sydney metro line. In turn, operators in Singapore's freight and logistics sector gain richer road data.
Platform launches, laws and contracts, 2024–2026
| Development | Status and market relevance |
|---|---|
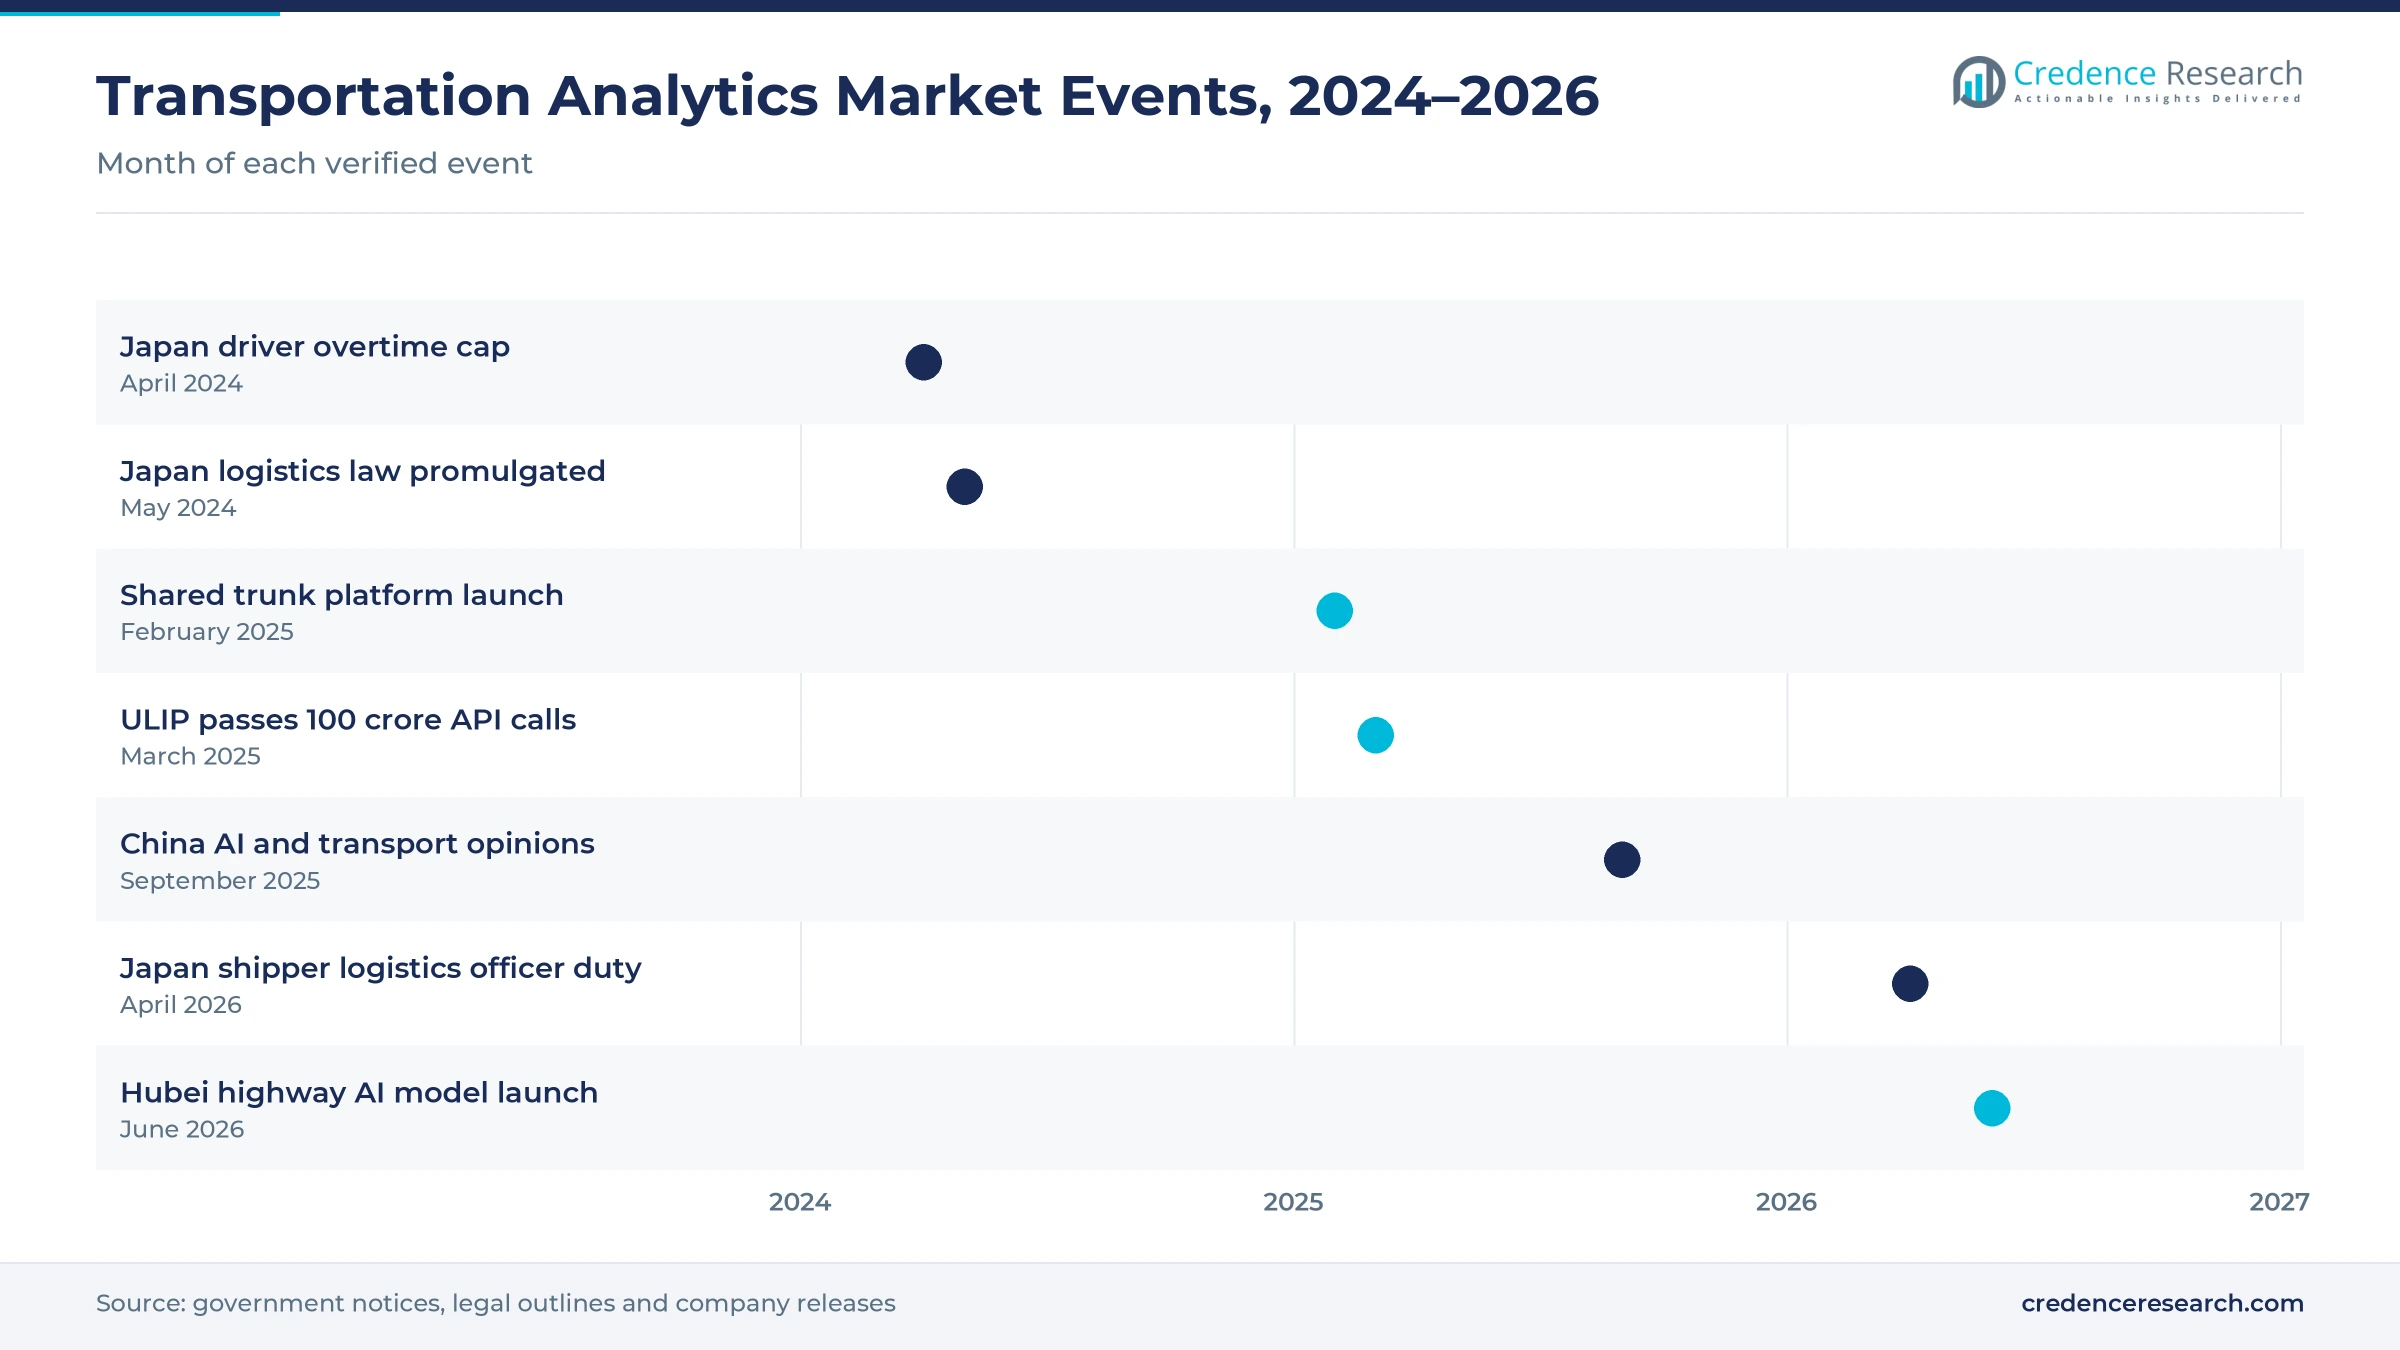
| In May 2024, Japan promulgated an amended logistics law requiring specified shippers to appoint chief logistics officers. | Duties for specified shippers apply from April 2026 |
| In February 2025, Sustainable Shared Transport launched a joint delivery platform built with Fujitsu. | Expands shared trunk routes in Japan |
| In March 2025, India's Unified Logistics Interface Platform passed 100 crore API transactions. | Widens public data inputs for analytics |
| In September 2025, China issued implementation opinions on AI and transport with targets for 2027 and 2030. | Sets national direction for transport AI |
| In June 2026, Hubei Communications Investment Group launched the Jingchu Xing transport AI model on Huawei Cloud. | Shows provincial demand for highway AI |
Data integration, prediction and agents set solution value
- Data integration layers connect telematics, tolling, ticketing and government APIs, which is often the largest share of early project work.
- Route and load optimization engines build delivery plans, vehicle assignments and loading patterns, which raises truck load rates and cuts planning time.
- Traffic prediction models forecast flow, incidents and congestion from sensor and toll records, which lets agencies adjust signals and dispatch crews sooner.
- Operational AI agents combine large models with workflow rules for monitoring, maintenance and emergency dispatch, which moves analytics from reports to action.
Need a Custom Version of This Report?
Tailor the scope, geography, or segments to your exact requirements.
- Custom geography or segment scope
- Direct access to our analyst team
Cloud, rail and IT suppliers compete on local data access
Competition runs between cloud and network suppliers, rail technology companies and Japanese and global IT service firms. Huawei supplies cloud, computing and AI tools to provincial highway groups, including the Jingchu Xing model launched in Hubei in June 2026, and it unveiled a Road Traffic Agent that month. Siemens Mobility brings Railigent X asset applications to the Sydney Metro Western Sydney Airport line and signaling with train tracking to India's first high-speed rail corridor. Hitachi sells delivery planning through its Hitachi Digital Solution for Logistics to Okamura and KSK. Fujitsu co-built the data platform behind Sustainable Shared Transport, while IBM supplies Maximo asset analytics to SBS Transit in Singapore. Suppliers compete on access to local data, domain models and long service contracts rather than on license price alone.
Which suppliers lead regional deployments?
| Company | Type | Role in the market |
|---|---|---|
| Huawei Technologies | Cloud and AI supplier | Jingchu Xing highway AI model for Hubei, June 2026 |
| Siemens Mobility | Rail technology supplier | Railigent X for Sydney Metro, ETCS Level 2 for India high-speed rail |
| Hitachi | IT and logistics software supplier | Delivery planning for Okamura and KSK, 2025 |
| Fujitsu | IT services and platform builder | Data platform for Sustainable Shared Transport, February 2025 |
| IBM | Asset analytics software supplier | Maximo with watsonx for SBS Transit rail maintenance, November 2024 |
Credence Research sees value moving to managed analytics
Credence Research's view is that Asia Pacific transportation analytics spending will grow several times over by 2035, because governments are opening logistics data while labor and cost pressure make planning tools essential. Software should keep the largest share, while managed analytics services and cloud delivery add value fastest. China will stay the largest country, although India gains share as public platforms reach more carriers and shippers. However, fragmented data, legacy control systems and scarce skills will reward suppliers that bundle integration with long service contracts.
Freight, traffic and fleet data anchor the model
The report uses 2025 as the base year and 2035 as the forecast year. Market values come from the Credence Research model, which combines freight and passenger activity, fleet and road network size, operator technology budgets and average contract values by solution type. Country shares were provided for the study, and country growth rates and the splits by solution type, deployment model, end-use industry and application are Credence Research estimates. Sources used are official statistics, government policy documents, a legal outline, a parliamentary reply, World Bank indicators, company announcements and news reports, and no interviews or surveys were used.
AI agents and open data shape demand to 2035
The Asia Pacific transportation analytics market is expected to reach USD 35.54 billion by 2035, a 22.56% CAGR during 2026–2035, as public data platforms, AI models and labor limits keep spending rising. Spending is projected to rise from USD 5.70 billion in 2026 as Japanese shipper duties and Chinese AI targets take effect. Growth should be strongest in managed analytics, cloud delivery and India, while China keeps the largest country share. In contrast, data security reviews and legacy systems could slow some projects.
Frequently Asked Questions
How big is the Asia Pacific transportation analytics market?
Which country leads demand?
Which country grows fastest?
Which solution type holds the largest share?
Which deployment model grows fastest?
How is Japan changing demand?
Who are the leading companies in this market?
What are the main risks to growth?
Table of Content
Chapter 1 Market Segmentation
- 1.1 Segmentation Framework
- 1.1.1 Product and Service Classification
- 1.1.2 Application and End-Use Classification
- 1.1.3 Technology and Solution Classification
- 1.1.4 Customer and Distribution Channel Classification
- 1.1.5 Geographic Segmentation
- 1.1.6 Market Segment Definitions and Boundaries
- 1.2 By Solution Type
- 1.2.1 Software
- 1.2.2 Professional Services
- 1.2.3 Managed Analytics Services
- 1.3 By Deployment Model
- 1.3.1 Cloud
- 1.3.2 On-Premise
- 1.3.3 Hybrid
- 1.4 By End-Use Industry
- 1.4.1 Road Freight and Logistics
- 1.4.2 Road Infrastructure Operations
- 1.4.3 Passenger Transport
- 1.4.4 Aviation and Maritime
- 1.5 By Application
- 1.5.1 Fleet Performance
- 1.5.2 Logistics Network Optimization
- 1.5.3 Traffic Management
- 1.5.4 Transport Asset and Passenger Operations
- 1.6 By Country
- 1.6.1 China
- 1.6.2 Japan
- 1.6.3 India
- 1.6.4 South Korea
- 1.6.5 Southeast Asia and Oceania
Chapter 2 Introduction
- 2.1 Report Objectives and Scope
- 2.2 Product Definition and Industry Terminology
- 2.3 Market Inclusions and Exclusions
- 2.4 Research Process
- 2.4.1 Primary Research and Expert Interviews
- 2.4.2 Secondary Research and Source Review
- 2.4.3 Top-Down and Bottom-Up Estimation
- 2.4.4 Data Triangulation and Verification
- 2.5 Market Size Measurement Basis
- 2.5.1 2025: USD 4.63 billion → 2035: USD 35.54 billion
- 2.6 Historical and Forecast Reference Periods
- 2.6.1 Historical Period: 2018-2025
- 2.6.2 Base Year: 2025
- 2.6.3 Forecast Period: 2025-2035
- 2.7 Research Assumptions and Limitations
Chapter 3 Executive Summary
- 3.1 Market Snapshot and Key Findings
- 3.2 Base-Year Market Size, 2025
- 3.3 Forecast Market Size, 2035
- 3.4 Revenue and Volume Growth Outlook
- 3.5 Key Demand and Supply Indicators
- 3.6 Leading Market Segments
- 3.7 Fastest-Growing Market Opportunities
- 3.8 Regional Performance Highlights
- 3.9 Technology and Industry Transformation
- 3.10 Competitive Landscape Summary
- 3.11 Analyst View and Strategic Implications
Chapter 4 Asia Pacific Transportation Analytics Market Trends and Developments
- 4.1 Historical Industry Development, 2018-2025
- 4.2 Recent Market Trends and Developments
- 4.3 Demand and Customer Behavior Trends
- 4.4 Technology and Product Innovation
- 4.5 Artificial Intelligence, Automation and Digitalization
- 4.6 Local Manufacturing and Supply Chain Realignment
- 4.7 Industry Partnerships, Mergers and Acquisitions
- 4.8 Sustainability and Circular Economy Developments
- 4.9 Government and Private Sector Investment Trends
- 4.10 Emerging Business Models and Commercialization
- 4.11 Industry Developments and Announcements
Chapter 5 Asia Pacific Transportation Analytics Market Supply and Demand Analysis
- 5.1 Demand Trend and Consumption Analysis, 2018-2025
- 5.2 Demand Forecast, 2025-2035
- 5.3 Supply Chain Structure and Procurement Trends
- 5.4 Supply-Demand Gap and Bottlenecks
- 5.5 Import Dependence and Sourcing Structure
- 5.6 Regional Supply and Demand Concentration
Chapter 6 Asia Pacific Transportation Analytics Market Pricing Analysis
- 6.1 Pricing Structure and Measurement
- 6.2 Historical Pricing Trends, 2018-2025
- 6.3 Pricing Outlook, 2025-2035
- 6.4 Pricing by Product and Market Segment
- 6.5 Geographic Pricing Differences
- 6.6 Key Input, Energy, Labor and Logistics Costs
- 6.7 Contract Pricing and Purchasing Models
- 6.8 Pricing Sensitivity and Competitive Positioning
- 6.9 Price, Margin and Profitability Implications
Chapter 7 Asia Pacific Transportation Analytics Market Dynamics
- 7.1 Market Growth Drivers
- 7.1.1 Demand-Side Drivers
- 7.1.2 Technology and Innovation Drivers
- 7.1.3 Infrastructure and Investment Drivers
- 7.1.4 Regulatory and Policy Drivers
- 7.2 Market Restraints
- 7.2.1 Cost and Affordability Constraints
- 7.2.2 Technology and Adoption Barriers
- 7.2.3 Supply Chain and Operational Constraints
- 7.3 Market Challenges
- 7.3.1 Competitive Pressure and Margin Erosion
- 7.3.2 Skills, Infrastructure and Implementation Gaps
- 7.4 Emerging Market Opportunities
- 7.5 Market Dynamics Impact and Time-Horizon Assessment
Chapter 8 Asia Pacific Transportation Analytics Value Chain Analysis
- 8.1 Industry Value Chain Overview
- 8.2 Upstream Suppliers and Critical Inputs
- 8.3 Technology and Component Providers
- 8.4 Manufacturing or Service Delivery
- 8.5 Distribution, Channel Partners and Integrators
- 8.6 Downstream Applications and End Users
- 8.7 Value Addition and Profit Pools
- 8.8 Vertical Integration and Outsourcing
- 8.9 Supplier Concentration and Risk
- 8.10 Supply Chain Localization and Resilience
Chapter 9 Asia Pacific Transportation Analytics Market Regulations and Policies
- 9.1 Relevant Laws, Standards and Compliance Frameworks
- 9.2 Product, Service, Safety and Quality Requirements
- 9.3 Government Policies, Incentives and Subsidies
- 9.4 Imports, Exports and Trade Barriers
- 9.5 Public Procurement and Local Content Requirements
- 9.6 Data Protection, AI and Cybersecurity Compliance
- 9.7 Upcoming Policy Changes and Market Implications
Chapter 10 Asia Pacific Transportation Analytics Market Hotspots and Opportunities
- 10.1 Market Opportunity Mapping and Growth Hotspots
- 10.2 High-Growth Applications and Customer Groups
- 10.3 Underserved Markets and White-Space Opportunities
- 10.4 Emerging Technology and Product Opportunities
- 10.5 New Capacity and Investment Hotspots
- 10.6 Market Entry and Expansion Opportunities
- 10.7 Distribution and Partnership Opportunities
- 10.8 Near-Term and Long-Term Commercial Potential
- 10.9 Opportunity Attractiveness and Execution Risks
Chapter 11 Asia Pacific Transportation Analytics Market Outlook, 2025-2035
- 11.1 Market Size and Analysis
- 11.1.1 Revenue (Market Measurement: 2025: USD 4.63 billion → 2035: USD 35.54 billion)
- 11.1.2 Historical Market Size, 2018-2025
- 11.1.3 Base-Year Market Size, 2025
- 11.2 Market Forecast, 2025-2035
- 11.2.1 Revenue Forecast to 2035
- 11.2.2 CAGR and Year-on-Year Growth
- 11.2.3 Incremental Revenue Opportunity
- 11.3 Forecast Assumptions and Scenario Analysis
- 11.3.1 Base-Case Forecast
- 11.3.2 Optimistic and Conservative Scenarios
- 11.3.3 Technology, Pricing and Policy Sensitivities
- 11.4 Market Attractiveness and Growth Outlook
Chapter 12 Asia Pacific Transportation Analytics Market Segmentation and Outlook
- 12.1 Segmentation Summary and Market Shares, 2025
- 12.2 Largest and Fastest-Growing Segments
- 12.3 By Solution Type - Market Size and Forecast, 2025-2035
- 12.3.1 Segment Definition and Scope
- 12.3.2 Historical Market Size, 2018-2025
- 12.3.3 Revenue Forecast, 2025-2035
- 12.3.4 Base-Year Market Share, 2025
- 12.3.5 Segment CAGR and Growth Drivers
- 12.3.6 Subsegment Market Size and Forecast
- 12.3.6.1 Software
- 12.3.6.2 Professional Services
- 12.3.6.3 Managed Analytics Services
- 12.3.7 Subsegment Pricing and Adoption Trends
- 12.3.8 Leading Suppliers and Competition
- 12.3.9 Regional Demand and Opportunities
- 12.4 By Deployment Model - Market Size and Forecast, 2025-2035
- 12.4.1 Segment Definition and Scope
- 12.4.2 Historical Market Size, 2018-2025
- 12.4.3 Revenue Forecast, 2025-2035
- 12.4.4 Base-Year Market Share, 2025
- 12.4.5 Segment CAGR and Growth Drivers
- 12.4.6 Subsegment Market Size and Forecast
- 12.4.6.1 Cloud
- 12.4.6.2 On-Premise
- 12.4.6.3 Hybrid
- 12.4.7 Subsegment Pricing and Adoption Trends
- 12.4.8 Leading Suppliers and Competition
- 12.4.9 Regional Demand and Opportunities
- 12.5 By End-Use Industry - Market Size and Forecast, 2025-2035
- 12.5.1 Segment Definition and Scope
- 12.5.2 Historical Market Size, 2018-2025
- 12.5.3 Revenue Forecast, 2025-2035
- 12.5.4 Base-Year Market Share, 2025
- 12.5.5 Segment CAGR and Growth Drivers
- 12.5.6 Subsegment Market Size and Forecast
- 12.5.6.1 Road Freight and Logistics
- 12.5.6.2 Road Infrastructure Operations
- 12.5.6.3 Passenger Transport
- 12.5.6.4 Aviation and Maritime
- 12.5.7 Subsegment Pricing and Adoption Trends
- 12.5.8 Leading Suppliers and Competition
- 12.5.9 Regional Demand and Opportunities
- 12.6 By Application - Market Size and Forecast, 2025-2035
- 12.6.1 Segment Definition and Scope
- 12.6.2 Historical Market Size, 2018-2025
- 12.6.3 Revenue Forecast, 2025-2035
- 12.6.4 Base-Year Market Share, 2025
- 12.6.5 Segment CAGR and Growth Drivers
- 12.6.6 Subsegment Market Size and Forecast
- 12.6.6.1 Fleet Performance
- 12.6.6.2 Logistics Network Optimization
- 12.6.6.3 Traffic Management
- 12.6.6.4 Transport Asset and Passenger Operations
- 12.6.7 Subsegment Pricing and Adoption Trends
- 12.6.8 Leading Suppliers and Competition
- 12.6.9 Regional Demand and Opportunities
- 12.7 By Country - Market Size and Forecast, 2025-2035
- 12.7.1 Segment Definition and Scope
- 12.7.2 Historical Market Size, 2018-2025
- 12.7.3 Revenue Forecast, 2025-2035
- 12.7.4 Base-Year Market Share, 2025
- 12.7.5 Segment CAGR and Growth Drivers
- 12.7.6 Subsegment Market Size and Forecast
- 12.7.6.1 China
- 12.7.6.2 Japan
- 12.7.6.3 India
- 12.7.6.4 South Korea
- 12.7.6.5 Southeast Asia and Oceania
- 12.7.7 Subsegment Pricing and Adoption Trends
- 12.7.8 Leading Suppliers and Competition
- 12.7.9 Regional Demand and Opportunities
- 12.8 Segment Growth Comparison
- 12.9 Segment Attractiveness and Priority Matrix
Chapter 13 Asia Pacific Transportation Analytics End-Use and Application Market Outlook
- 13.1 End-Use Industry and Customer Demand Structure
- 13.2 Leading Applications and Customer Groups
- 13.3 End-Use Market Size, Share and Forecast
- 13.4 Major End-Use Industry Deep Dives
- 13.4.1 Customer Requirements and Use Cases
- 13.4.2 Demand and Replacement Cycles
- 13.4.3 Technical and Regulatory Considerations
- 13.4.4 Purchasing and Procurement Models
- 13.4.5 Leading Vendors and Distribution Channels
- 13.4.6 Forecast and Commercial Opportunities
- 13.5 Emerging Applications and Cross-Segment Demand
- 13.6 End-Use Industry Investment Priorities
Chapter 14 Asia Pacific Transportation Analytics Geographic Market Outlook, 2025-2035
- 14.1 Regional Market Size and Country-Level Shares, 2025
- 14.2 Country Market Size Comparison, 2025
- 14.3 Country Market Forecasts, 2025-2035
- 14.4 Subregional Industrial and Demand Clusters
- 14.5 Intra-Regional Pricing and Cost Differences
- 14.6 Cross-Border Trade and Supply Networks
- 14.7 Regional Supply and Demand Balances
- 14.8 Country Opportunity Comparison and Prioritization
Note: Every listed country is covered on the structure shown under the first country.
Chapter 15 Asia Pacific Transportation Analytics Technology, Innovation and Sustainability Outlook
- 15.1 Technology Landscape and Maturity
- 15.2 Product, Process and Service Innovation
- 15.3 AI, Automation and Digital Tools in the Industry
- 15.4 Technology Adoption and Performance Benchmarking
- 15.5 Innovation Pipeline and R&D Investment
- 15.6 Patent and Intellectual Property Trends
- 15.7 Energy Efficiency and Resource Management
- 15.8 Sustainability, Recycling and Circularity
- 15.9 Technology Roadmap, 2025-2035
- 15.10 Risks of Obsolescence and Technology Substitution
Chapter 16 Asia Pacific Transportation Analytics Market Key Strategic Imperatives
- 16.1 Growth and Market Entry Priorities
- 16.2 High-Return Products and Segments
- 16.3 Pricing, Profitability and Cost Optimization
- 16.4 Technology Investment and Product Differentiation
- 16.5 Supply Chain Localization and Resilience
- 16.6 Distribution and Customer Acquisition
- 16.7 Partnership, Acquisition and Capacity Strategy
- 16.8 Regional Expansion Priorities
- 16.9 Short-, Medium- and Long-Term Actions
Chapter 17 Competition Outlook
- 17.1 Industry Competition Characteristics
- 17.2 Market Structure and Concentration
- 17.3 Market Share and Competitive Positioning, 2025
- 17.4 Company-Wise Revenue and Product Benchmarking
- 17.5 Production and Service Capacity Benchmarking
- 17.6 Technology, Pricing and Differentiation
- 17.7 Regional Footprint and Distribution Strength
- 17.8 Mergers, Acquisitions and Strategic Alliances
- 17.9 New Entrants and Competitive Threats
- 17.10 Porter's Five Forces and Industry Attractiveness
- 17.11 Competitive Outlook, 2025-2035
Chapter 18 Company Profiles
- 18.1 Company Coverage and Selection Criteria
- 18.2 Huawei Technologies
- 18.2.1 Business Description
- 18.2.2 Company Ownership and Geographic Presence
- 18.2.3 Product and Service Portfolio
- 18.2.4 Manufacturing and Operating Footprint
- 18.2.5 Financial Performance and Investment
- 18.2.6 Market Share and Competitive Position
- 18.2.7 Technology and Innovation Capabilities
- 18.2.8 Strategic Alliances or Partnerships
- 18.2.9 Recent Developments
- 18.2.10 Growth Strategy and Outlook
- 18.3 Siemens Mobility
- 18.4 Hitachi
- 18.5 Fujitsu
- 18.6 IBM
- 18.7 Other Relevant Market Participants
Note: Every listed company is profiled on the structure shown under the first company. The company list is preliminary and may change based on research findings, market developments, data availability and client requirements.
Chapter 19 Disclaimer
- 19.1 Research and Forecast Disclaimer
- 19.2 Data Source and Estimation Limitations
Note: The depth of individual sections depends on data availability for this market. Volume, capacity, trade and other unit-based metrics are included where applicable.

