
Screen offsets and game studios anchor local CG demand
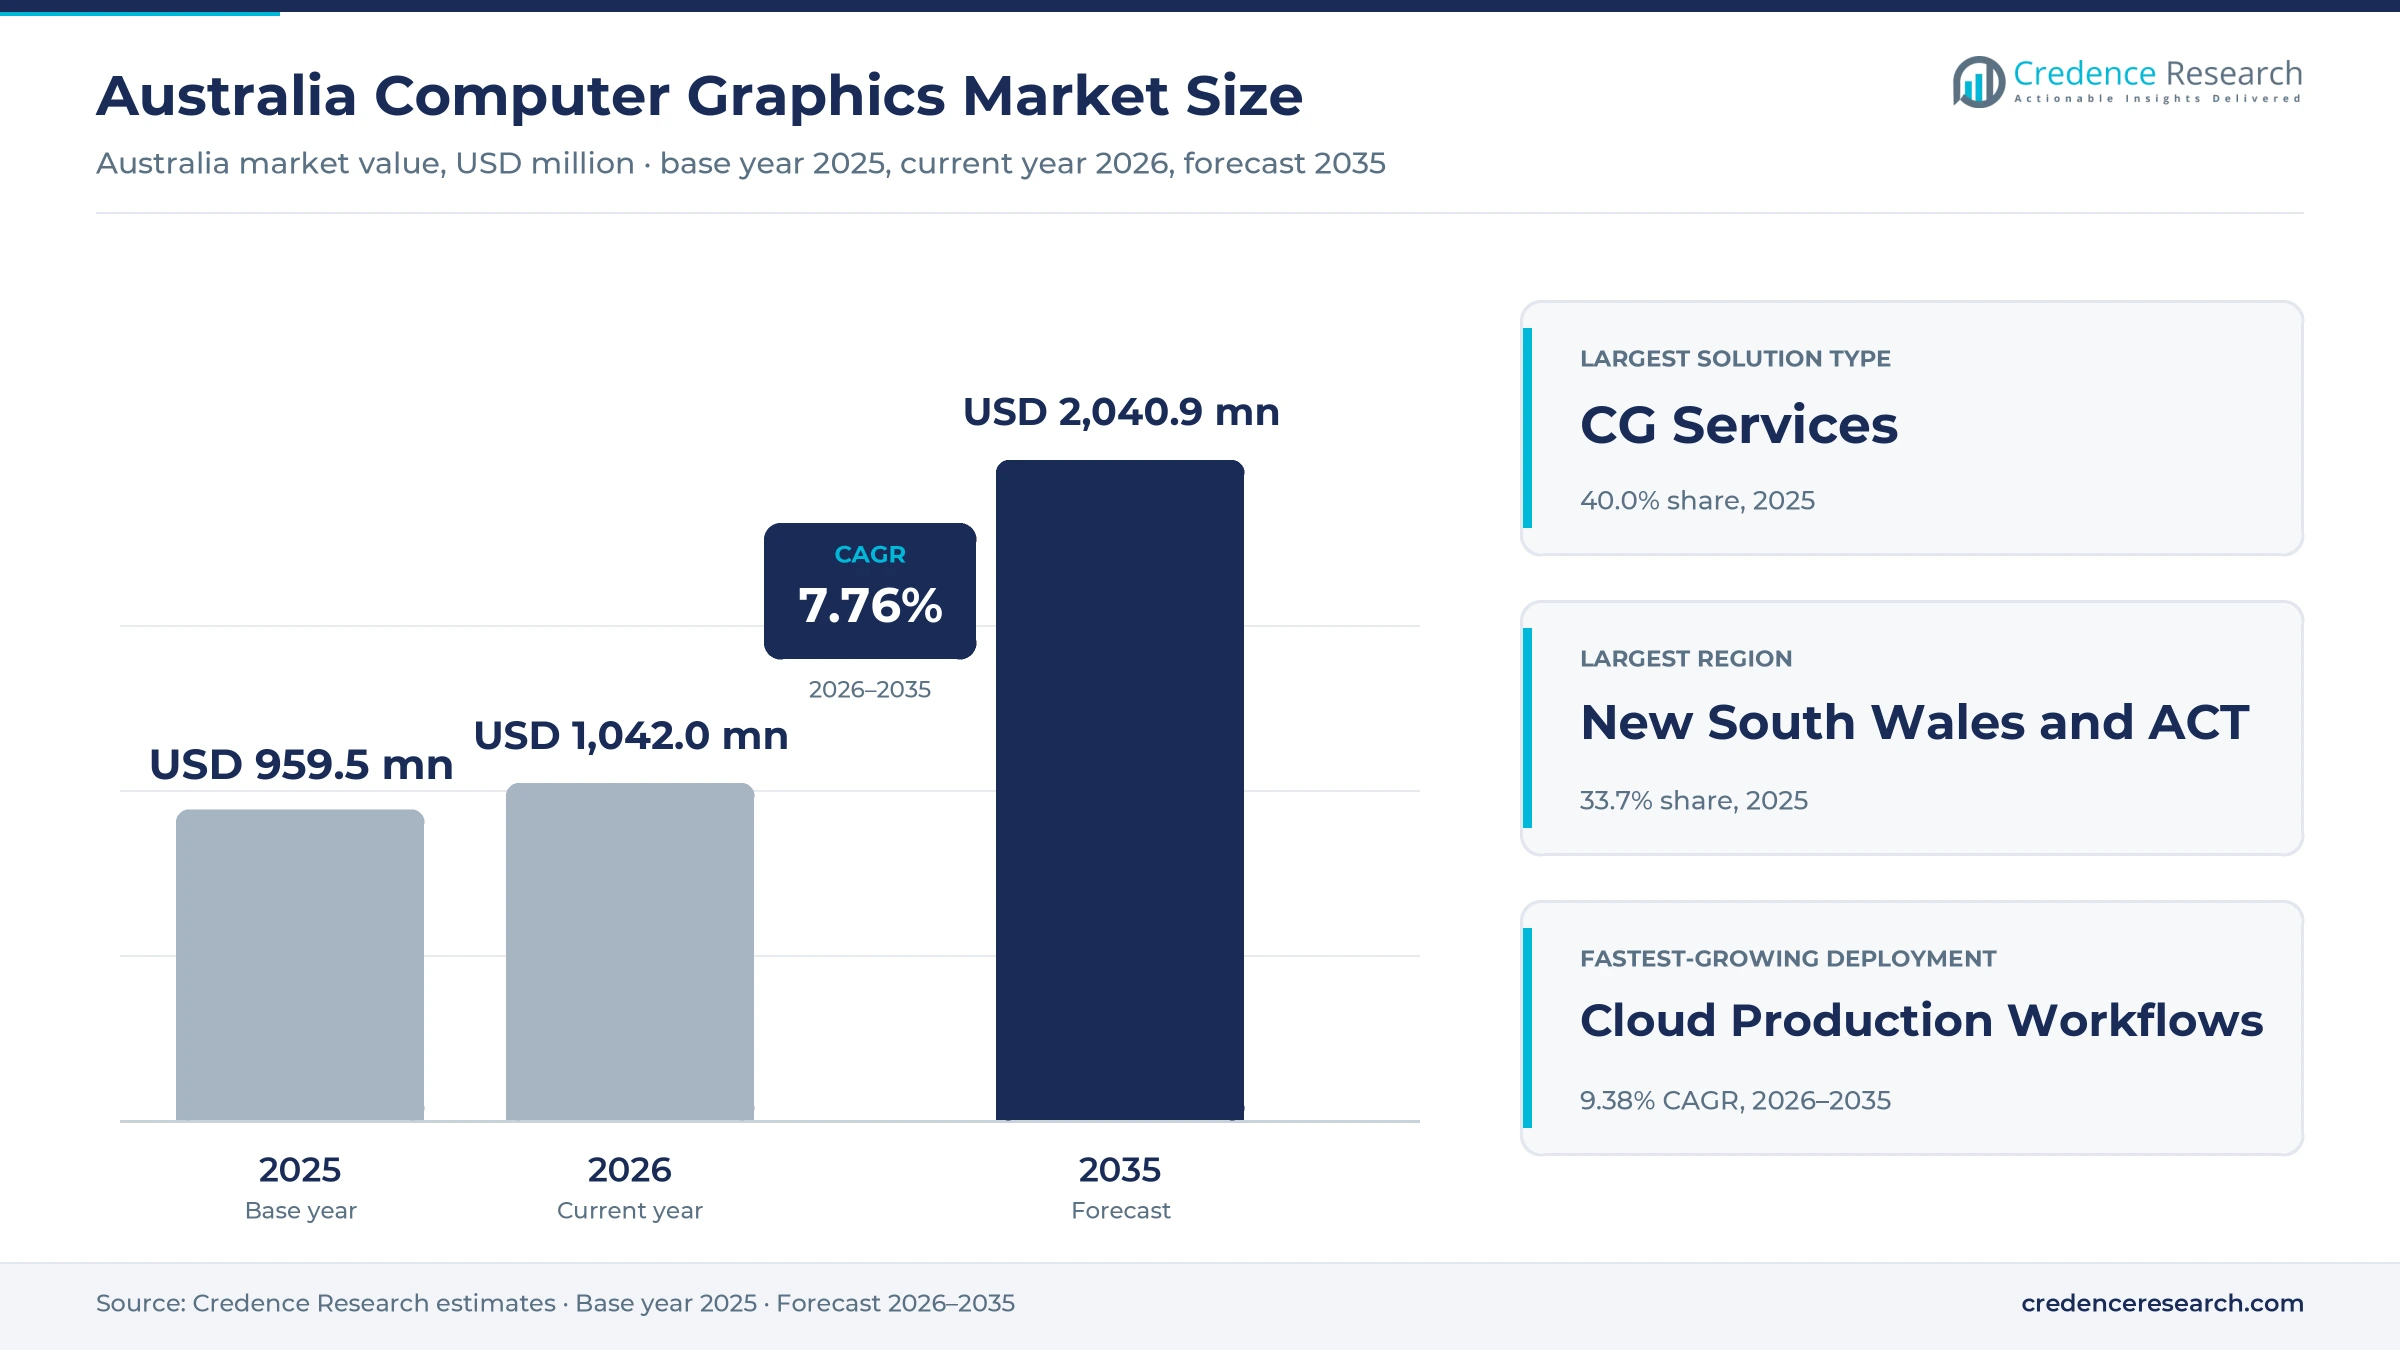
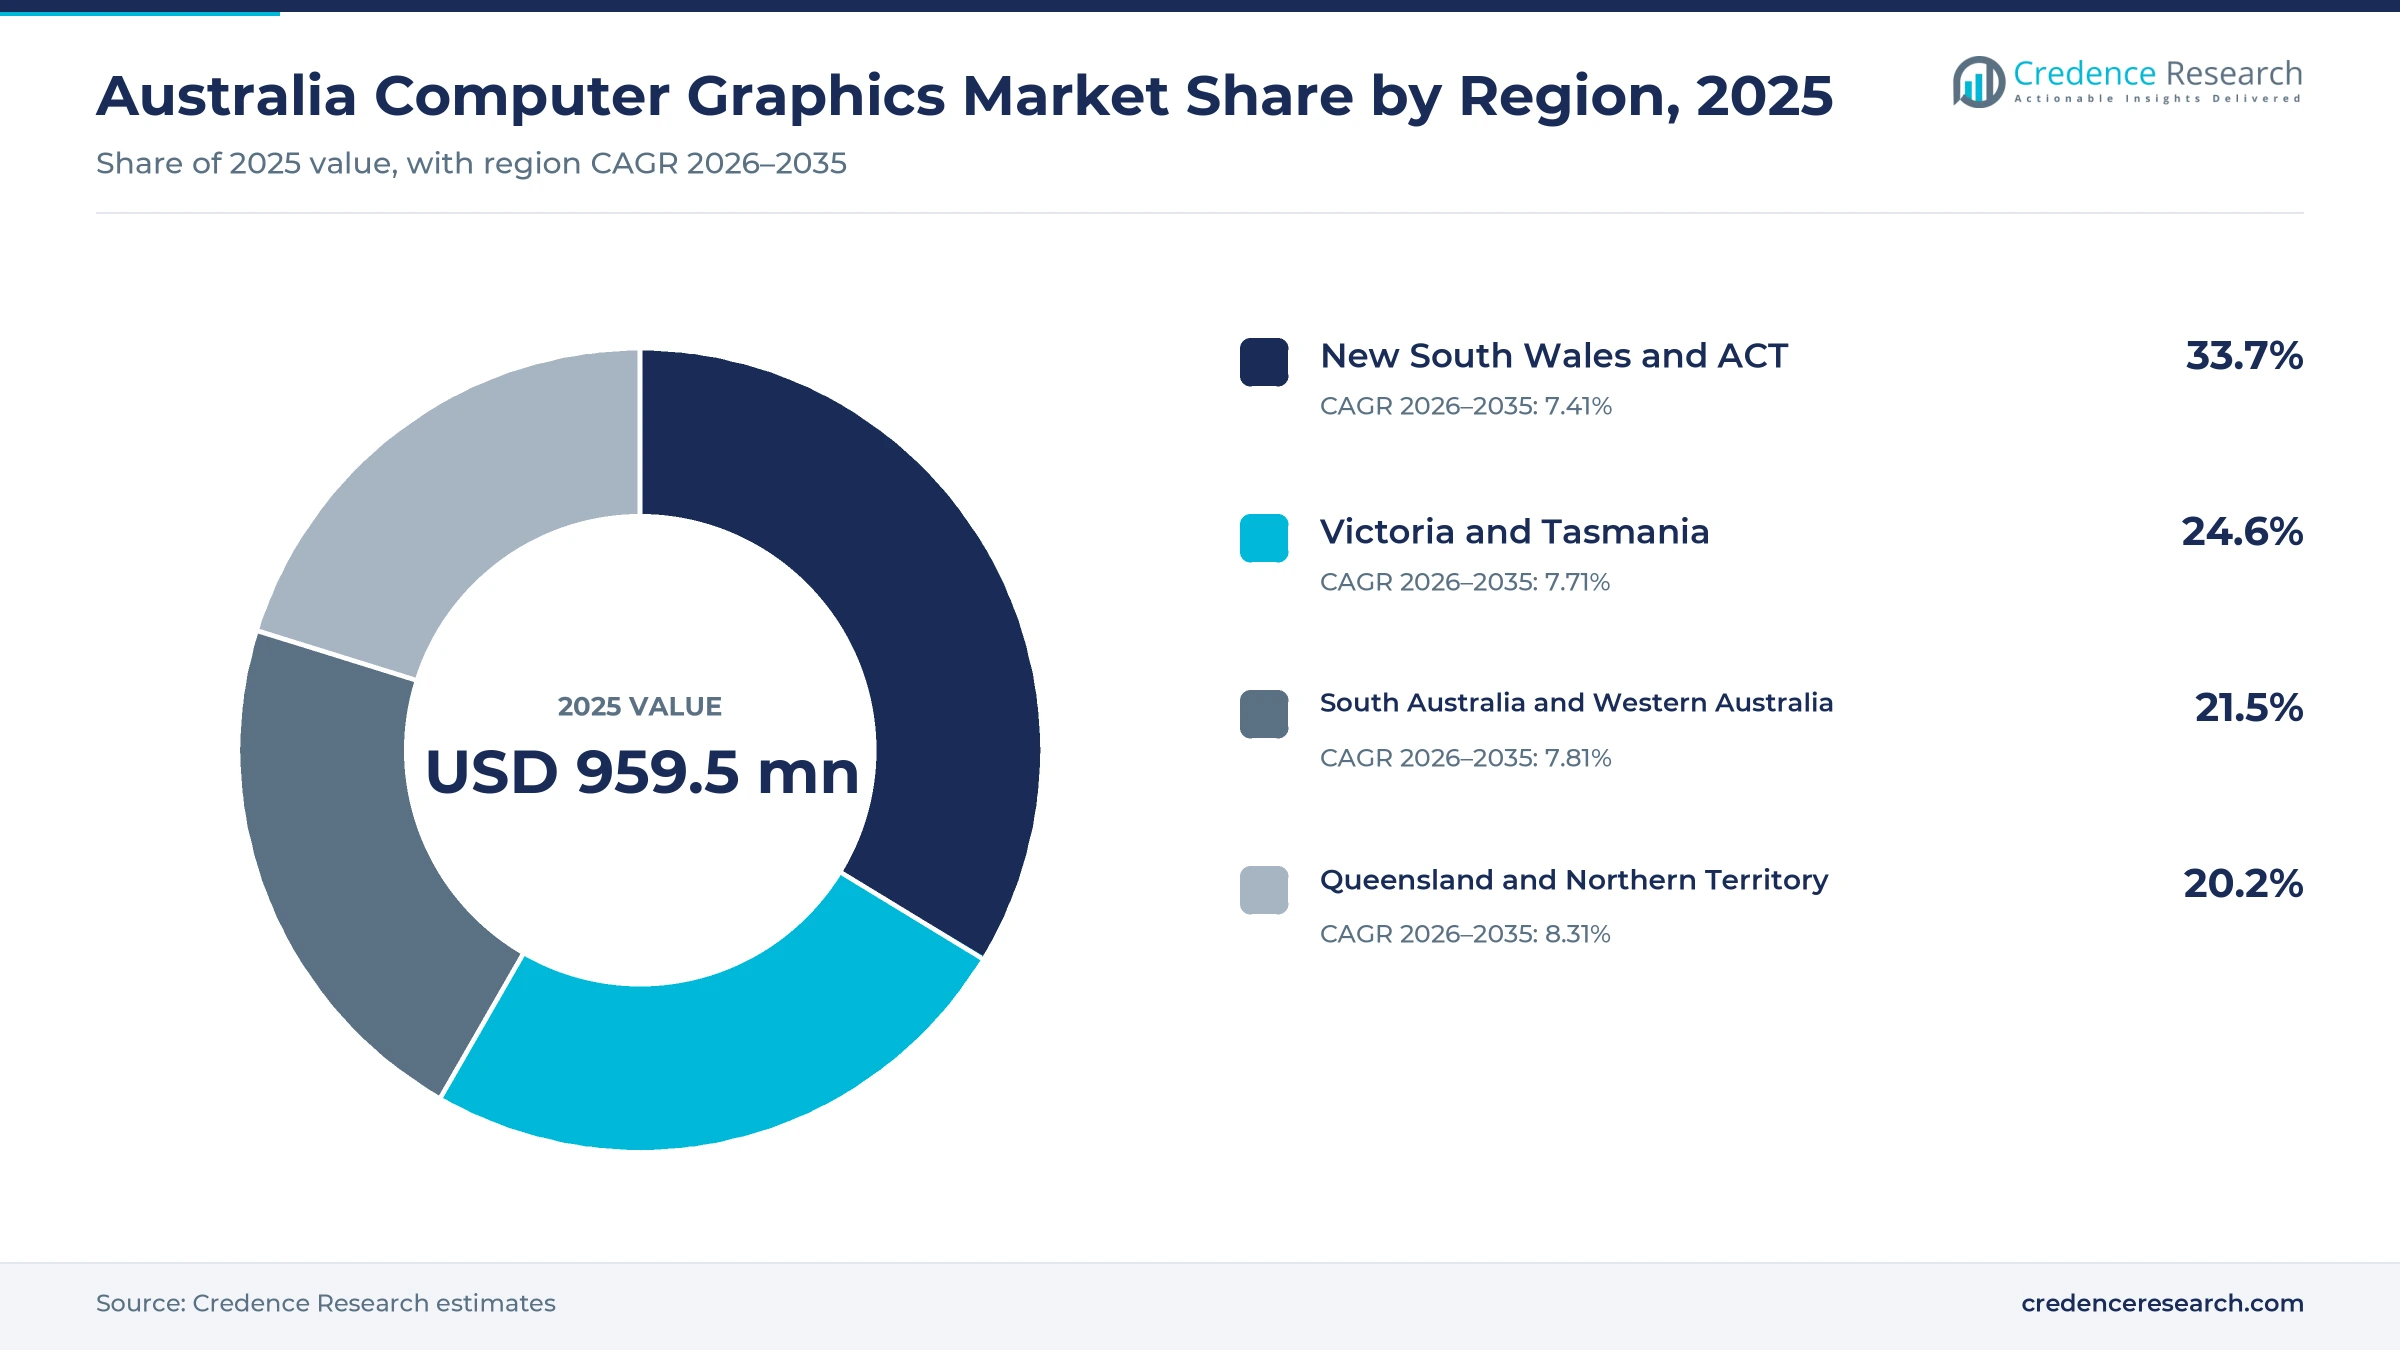
The Australia computer graphics market was valued at USD 959.5 million in 2025 and is projected to increase from USD 1.04 billion in 2026 to USD 2.04 billion by 2035, registering a CAGR of 7.76% during 2026–2035. Demand comes from film, series and streaming productions that buy visual effects, animation and finishing work, from game studios that build art and engine content, and from design, engineering and advertising firms that render buildings, products and campaigns. New South Wales and ACT held the largest regional share, 33.7% in 2025, because Sydney hosts major animation studios and many agency and broadcaster head offices. Queensland and Northern Territory is the fastest-growing region at 8.31% a year, as large productions and game teams expand there. At the same time, a rule that has applied since Jan. 1, 2026, requires large streaming services to invest in Australian drama, children's and documentary content, which widens the local pipeline of animation and effects work.
Which software, hardware and studio work does the estimate count?
The estimate counts spending in Australia on modeling, animation, rendering, compositing and real-time visualization software, on workstations, graphics hardware and capture equipment bought for creative work, and on visual effects, animation, game art and visualization services delivered by studios in the country. Buyers include production companies, streaming platforms, game developers, architects, engineering firms, advertising agencies and independent creators, who buy through subscriptions, equipment purchases and project contracts.
The estimate excludes consumer gaming hardware, general office computers, live-action camera crews and the value of finished films or games sold to audiences. The value chain links global software and chip vendors, local resellers, visual effects and animation studios, game developers, design practices and the federal and state screen agencies that set production incentives.
Australia Computer Graphics Market Insights
- The Australia computer graphics market was valued at USD 959.5 million in 2025 and is projected to reach USD 2.04 billion by 2035, registering a CAGR of 7.76% during 2026–2035.
- New South Wales and ACT held a 33.7% share of 2025 value, because Sydney hosts large feature animation and series animation studios.
- CG Services led solution types with a 40.0% share of 2025 value, because international productions buy effects and animation work from Australian studios.
- Post, digital and visual effects spending on Australian and international titles reached A$762 million in 2024/25, up 33% on the previous year.
- Cloud production workflows grow fastest at 9.38% a year during 2026–2035, as studios rent rendering capacity for peak delivery periods.
Studio services lead while cloud workflows grow fastest
Why do studio services hold the largest share?
Based on solution type, the market is categorized into CG software tools, professional and prosumer CG hardware, and CG services. CG Services led with a 40.0% share of 2025 value, because effects, animation and game art studios sell labor-intensive work to local and international clients. CG Software Tools grow fastest at 8.36% a year, as subscriptions, engine licenses and AI-assisted features spread to smaller teams and new users.
How quickly are studios moving rendering off site?
Based on deployment model, the market is categorized into local production workflows, cloud production workflows and hybrid production workflows. Local Production Workflows led with a 48.0% share of 2025 value, because many studios still run on-premise render farms and storage for security and speed. Cloud Production Workflows grow fastest at 9.38% a year, as studios rent GPU capacity for peaks rather than building farms for every project.
Which industries buy the most CG work?
Based on end-use industry, the market is categorized into screen and broadcast production, game development, architecture and engineering, and advertising and specialist visualization. Screen and Broadcast Production led with a 38.0% share of 2025 value, because film and series offsets attract large effects and animation packages. Game Development grows fastest at 8.50% a year, as local studios expand art, animation and porting teams.
Where does rendering stand against interactive work?
Based on application, the market is categorized into asset creation and modeling, animation and simulation, rendering and compositing, and interactive visualization. Rendering and Compositing led with a 31.0% share of 2025 value, because final shots and frames consume most compute and artist hours. Interactive Visualization grows fastest at 8.72% a year, as developers, planners and engineers present designs in real-time 3D models.
| Segment Group | Leading Sub-segment | Share, 2025 | Fastest-growing Sub-segment | CAGR, 2026–2035 |
|---|---|---|---|---|
| By Solution Type | CG Services | 40.0% | CG Software Tools | 8.36% |
| By Deployment Model | Local Production Workflows | 48.0% | Cloud Production Workflows | 9.38% |
| By End-Use Industry | Screen and Broadcast Production | 38.0% | Game Development | 8.50% |
| By Application | Rendering and Compositing | 31.0% | Interactive Visualization | 8.72% |
Request a Free Sample
Fill in your details and we'll send you a free sample report.
- Sample data tables & charts
- Research methodology
Screen offsets, game art and real-time design lift spend
How do federal screen offsets pull effects work onshore?
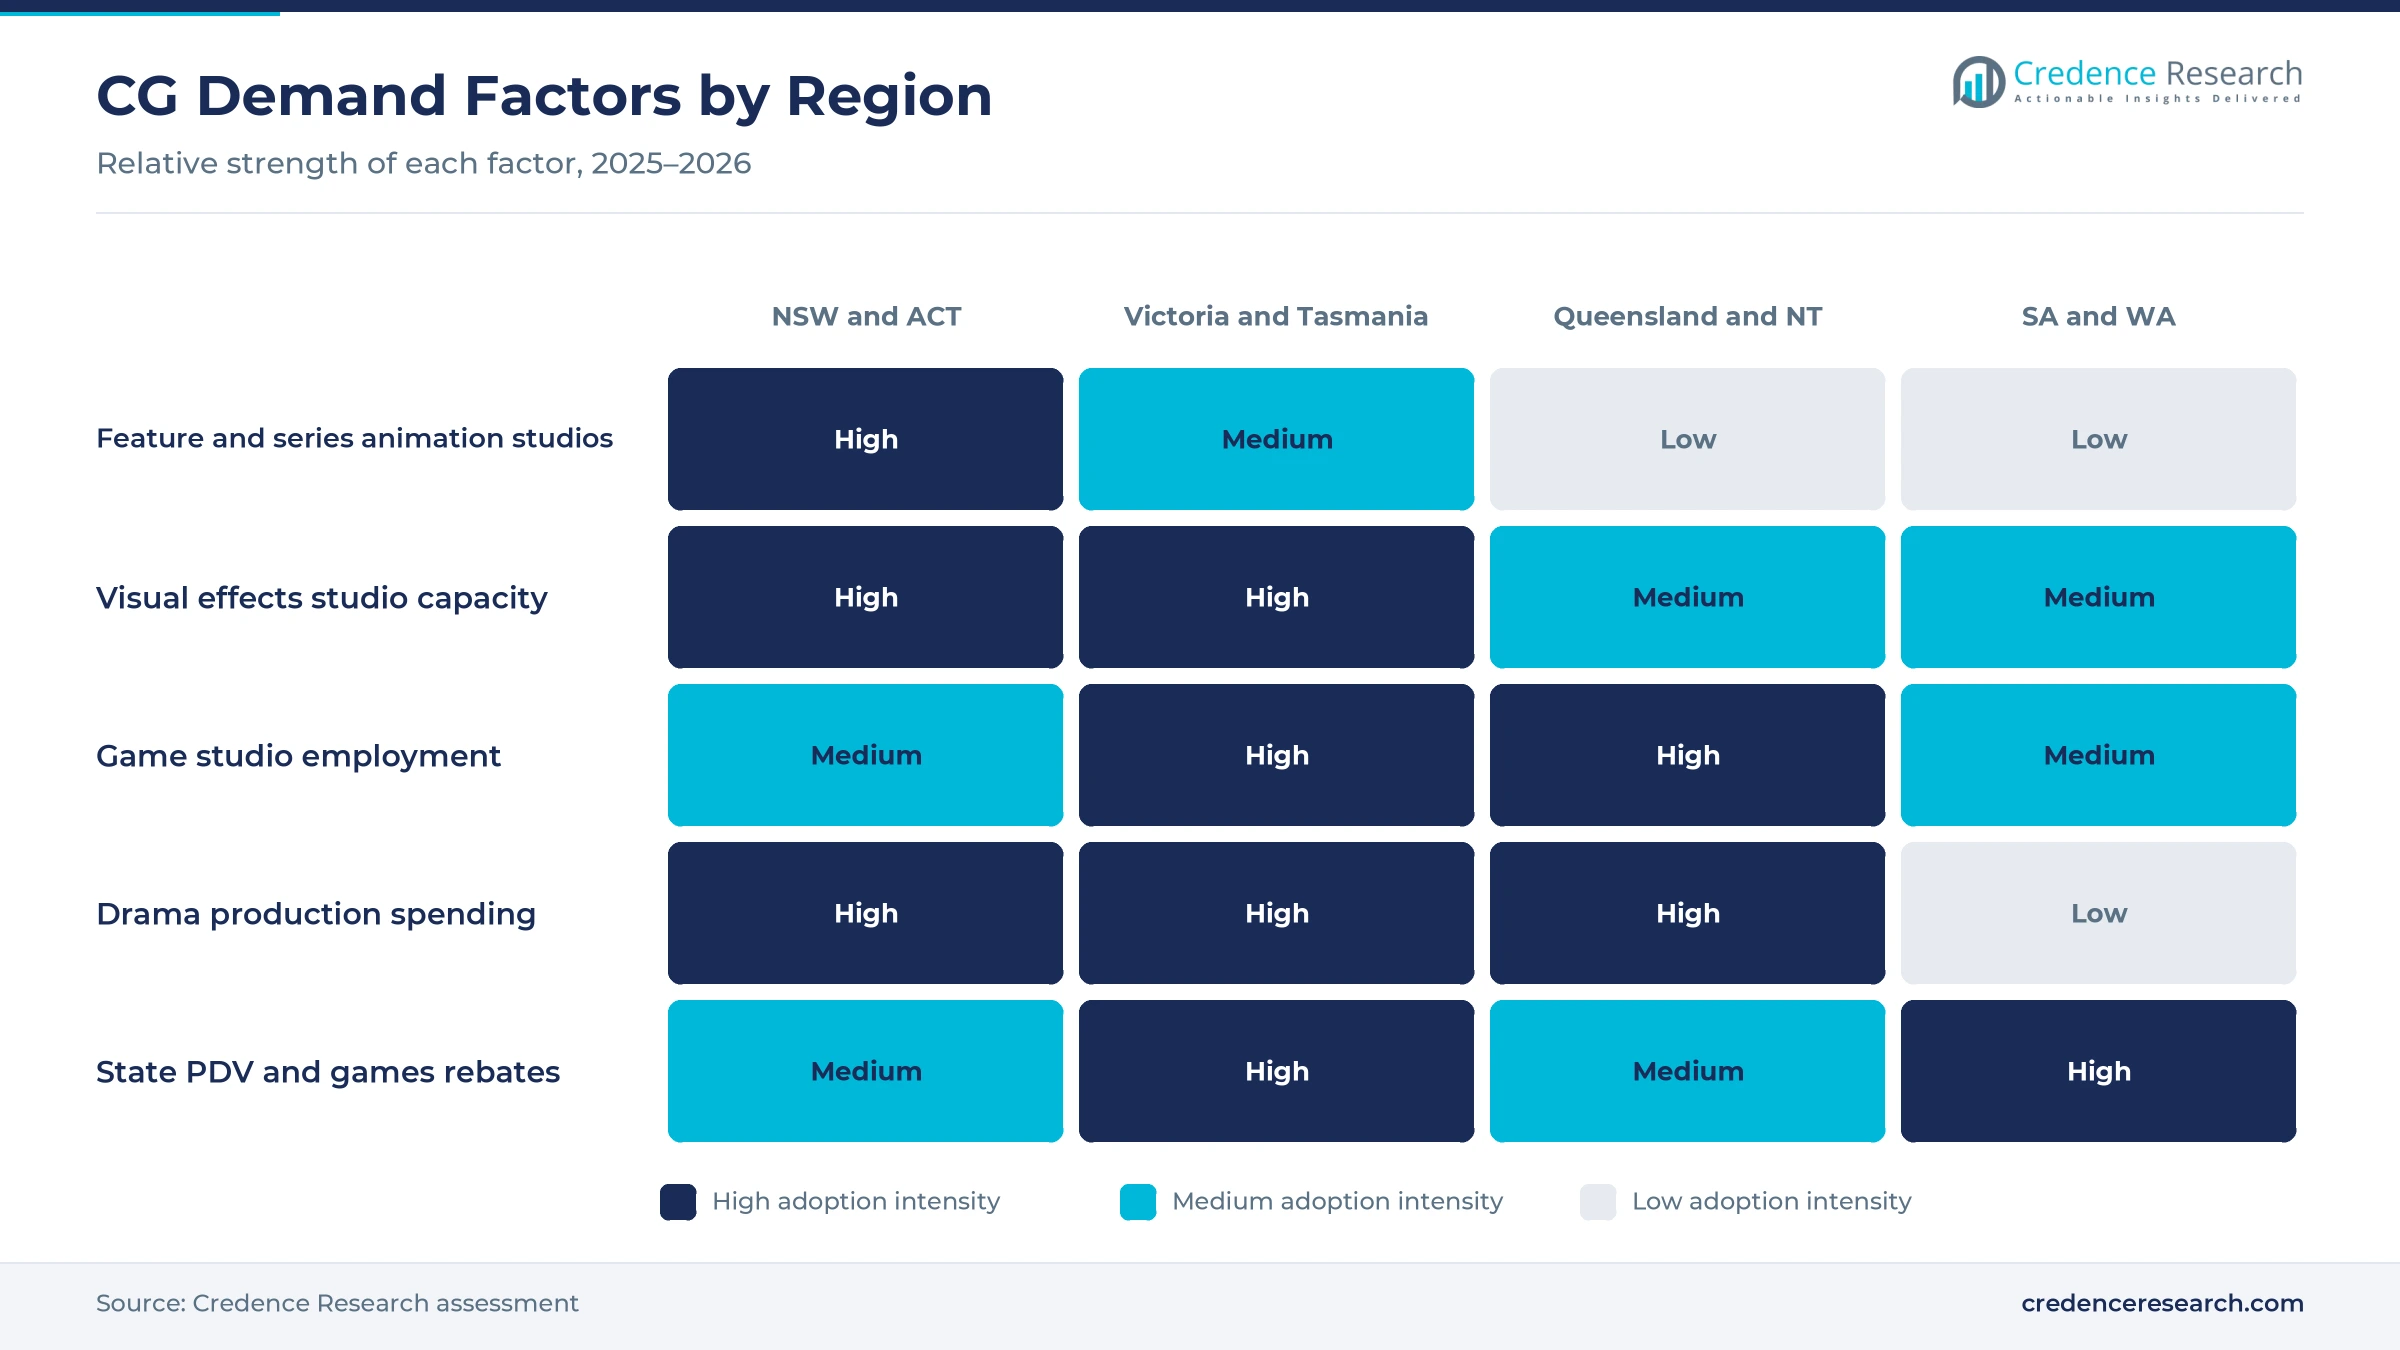
Federal tax rebates lower the cost of shooting and finishing large productions in the country, which channels effects, animation and finishing budgets to Australian studios. The Location Offset pays 30% for large-budget productions starting principal photography on or after July 1, 2023, and a separate PDV Offset rebates post, digital and visual effects work regardless of where a project is shot, according to the Office for the Arts. International features and streaming titles spent A$1.3 billion across 22 projects in 2024/25, nearly triple the previous year, according to Screen Australia. PDV spending on Australian and international titles reached A$762 million in the same year. As a result, screen and broadcast production holds 38.0% of 2025 value, the largest end-use share.
Why does game art production widen tool and service demand?
Game studios need modelers, animators, technical artists and engine programmers for every release, which ties game growth directly to creative software, workstations and outsourced art. The Digital Games Tax Offset, available for expenditure from July 1, 2022, refunds part of qualifying Australian development spending, with a minimum of A$500,000 and a cap of A$20 million per company each year, according to the Australian Taxation Office. Australian game studios generated A$608.5 million in FY25 and reported 2,443 full-time roles, according to a ScreenHub report on the Interactive Games & Entertainment Association survey. Studios lean heavily on game engines for real-time art pipelines. In turn, game development grows at 8.50% a year, the fastest end use.
How does real-time visualization procurement lift design spend?
Public owners and their consultants now ask for 3D models, renders and interactive walkthroughs before approving major projects, which pushes visualization deeper into design and engineering work. The Major Public Infrastructure Pipeline reached A$242 billion over five years, rising A$29 billion in a year, according to Infrastructure Australia on Nov. 13, 2025. Transport accounts for A$129 billion of that pipeline, and building work, including social housing, is projected to reach A$77 billion. The NSW Spatial Digital Twin lets agencies and councils view buildings, terrain and infrastructure in interactive 3D and 4D, according to NSW Spatial Services. As a result, interactive visualization grows at 8.72% a year, the fastest application.
Why do new streaming content rules add animation work?
Large streaming services now carry a legal obligation to fund Australian content, which adds demand for local animation, effects and finishing work beyond foreign shoots. Parliament passed the requirement on Nov. 27, 2025, and it has applied since Jan. 1, 2026, according to the Office for the Arts and Screen Australia. Services with at least one million Australian subscribers must invest 10% of local program expenditure or 7.5% of Australian revenue in drama, children's, documentary, arts and education content. Australian titles already drew A$1.1 billion of production spending in 2024/25, according to Screen Australia. In turn, studios that deliver animation and visual effects gain a steadier base of local commissions.
LED volumes, AI tools and cloud rendering reshape work
How is the rise of LED volume stages changing production?
LED volume stages display real-time 3D environments behind actors, which shifts effects work from post production into pre-production and the shoot itself. NantStudios built two in-camera effects stages at Docklands Studios Melbourne, the largest with a 289-foot wall of 6,000 panels, according to VicScreen. Curtin University opened an eight-meter by eight-meter wall and floor LED volume in Western Australia, described as the first configured to industry standards there, in October 2026. Screenwest moved to a flat 20% PDV rebate from July 1, 2025, according to Mediaweek. As a result, virtual production raises demand for real-time artists, environment builders and engine supervisors across the country.
Why is the shift to AI-assisted tools reshaping workflows?
Software vendors now build AI features into editing, color, compositing and image tools, which shifts artist time from manual cleanup toward creative decisions. Blackmagic Design, which has offices in Australia, announced DaVinci Resolve 20 in April 2025 with more than 100 new features, including AI tools such as Magic Mask, Depth Map and Set Extender. Adobe launched a Firefly mobile app for image and video generation in June 2025, according to IT Brief Australia. The same report says creators had produced more than 24 billion assets with Firefly generative models, and all Firefly content now carries Content Credentials. As a result, software tools grow at 8.36% a year, the fastest solution type.
Can series animation exports open larger studio contracts?
Australian animation studios increasingly win full series and feature packages from global streamers, which opens multiyear contracts for modeling, rigging, animation and rendering. Flying Bark Productions said its international work created more than 140 new roles at its Sydney studio and won the Creative Industries Award at the NSW Export Awards in October 2025. The studio's Netflix series Stranger Things Tales From '85 required more than 18 million final frames across 10 episodes, according to B&T on April 23, 2026. Netflix unveiled the Netflix Animation Studios brand in 2025 for one studio operating between Burbank, Sydney and Vancouver. In turn, CG services hold 40.0% of 2025 value, the largest solution type share.
Is there an opening in cloud rendering capacity?
Studios that rent remote GPU capacity can take on larger deliveries without building permanent render farms, which opens room for cloud and hybrid production services. About 96.1% of Australians used the internet in 2024, according to the World Bank, which supports remote review and distributed artist teams. Sovereign Australia AI announced 256 NVIDIA Blackwell B200 GPUs in NEXTDC data centers on Sept. 9, 2025, according to IT Brief Australia, adding large local accelerator capacity. The same report described it as the largest deployment of such AI hardware by an Australian entity to date. As a result, cloud production workflows grow at 9.38% a year, the fastest deployment model.
Footloose work, skills and incentive cuts test studios
How does footloose work expose studios to rival locations?
International productions can move effects and animation packages to any country that offers a better rebate or exchange rate, which makes studio pipelines volatile. State screen agencies set and revise their own PDV rebate terms, which shows how quickly state support can shift. As a result, studios carry idle capacity between packages and compete hard on price. Many respond by spreading work across several clients and signing longer series contracts.
Why do skills shortages limit studio capacity?
Effects, animation and game studios compete for the same pool of senior lighters, riggers, technical directors and engine programmers, which slows hiring when several large projects land at once. In turn, studios pay more for scarce staff or send work to overseas sites. Universities and studios respond with joint programs, such as the Visual Effects Celebration that Rising Sun Pictures and the University of South Australia held in Adelaide in November 2025.
How do fewer local titles weaken studio pipelines?
Local productions give studios steady work between large international packages, so a drop in Australian titles leaves gaps in schedules. The number of Australian titles entering production fell from 89 to 71 in 2024/25, according to Screen Australia, even though spending on them rose. As a result, smaller effects and animation teams face uneven workloads and cash flow. The new streaming content rule should ease this gap over time.
Why do hardware costs strain smaller creators?
Professional GPUs, workstations, storage and displays are priced in global markets and imported, which makes upgrades expensive for micro studios and independent creators. In turn, many smaller teams delay hardware refreshes and work on older machines for longer than planned. Rented cloud capacity, prosumer hardware and subscription software lower the entry cost, although they add ongoing monthly charges that small firms must budget for carefully.
Sydney and the ACT lead while Queensland grows fastest
| Region | Value, 2025 (USD million) | Share, 2025 | CAGR, 2026–2035 |
|---|---|---|---|
| New South Wales and ACT | 323.4 | 33.7% | 7.41% |
| Victoria and Tasmania | 236.0 | 24.6% | 7.71% |
| South Australia and Western Australia | 206.3 | 21.5% | 7.81% |
| Queensland and Northern Territory | 193.8 | 20.2% | 8.31% |
New South Wales and ACT leads on Sydney animation studios
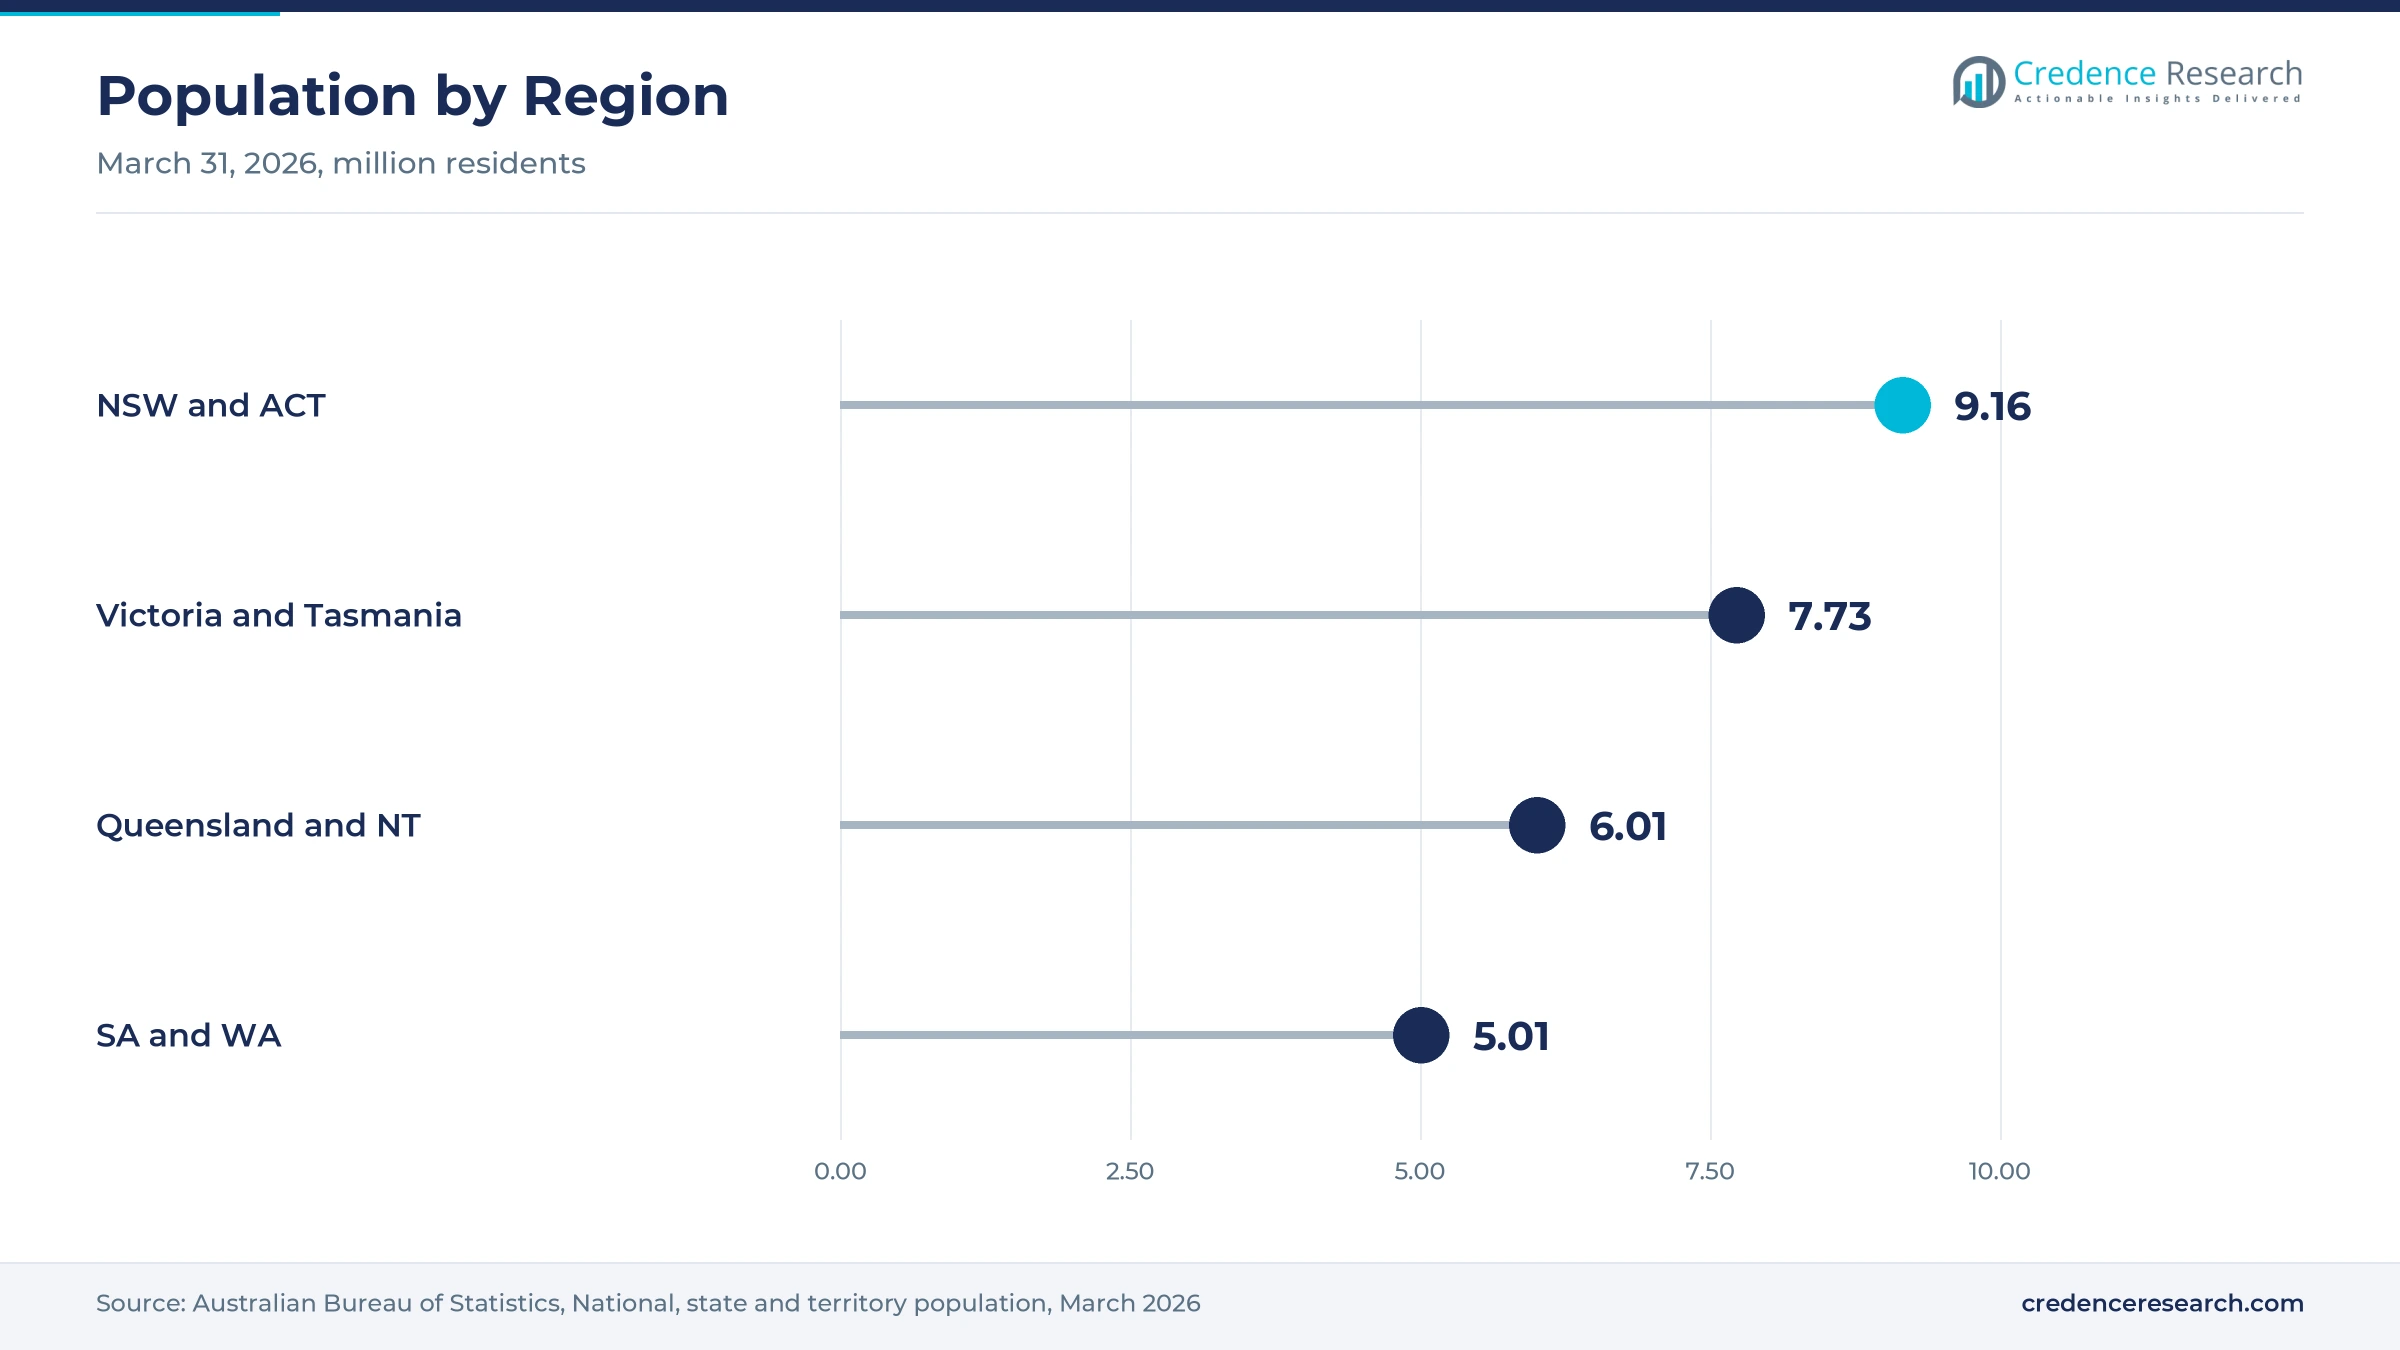
New South Wales and ACT held a 33.7% share of 2025 value and grows at 7.41% a year, because Sydney hosts the largest feature and series animation studios. Netflix Animation Studios runs one of its three production locations in Sydney, and Flying Bark Productions is headquartered in the city. Screen NSW pays a rebate on PDV work above A$500,000 of state spending. The state and territory together held about 9.16 million residents in March 2026, according to the Australian Bureau of Statistics.
How do Melbourne studios support Victoria and Tasmania?
Victoria and Tasmania held a 24.6% share of 2025 value and grows at 7.71% a year, because Melbourne combines effects houses, LED stages and the largest game studio cluster. Victoria hosts 27% of Australian game studios and 30% of developers, according to ScreenHub. Luma Pictures delivered 177 shots for Shang-Chi from Melbourne with support from the Victorian Screen Incentive. VicScreen also administers a A$15 million Victorian Digital Screen Rebate for games, animation and effects work.
Why does Queensland and Northern Territory grow fastest?
Queensland and Northern Territory held a 20.2% share of 2025 value and grows fastest at 8.31% a year, because large productions and game teams are expanding there. Queensland drew 34% of drama production spending in 2024/25, the highest of any state, according to Screen Australia. The state also hosts 27% of game studio employees, and that number is growing. As a result, local post and effects teams gain more work tied to shoots that already film in the state.
How do Adelaide and Perth add effects and game capacity?
South Australia and Western Australia held a 21.5% share of 2025 value and grows at 7.81% a year, because Adelaide effects work and Perth incentives add capacity. Rising Sun Pictures operates its visual effects studio in Adelaide, and the South Australian Film Corporation offers a games development rebate above A$250,000 of state spending. Western Australia hosts 14% of game studios and recorded the fastest population growth of any state in the year to March 2026.
Studio, policy and tool moves mark 2024 to 2026
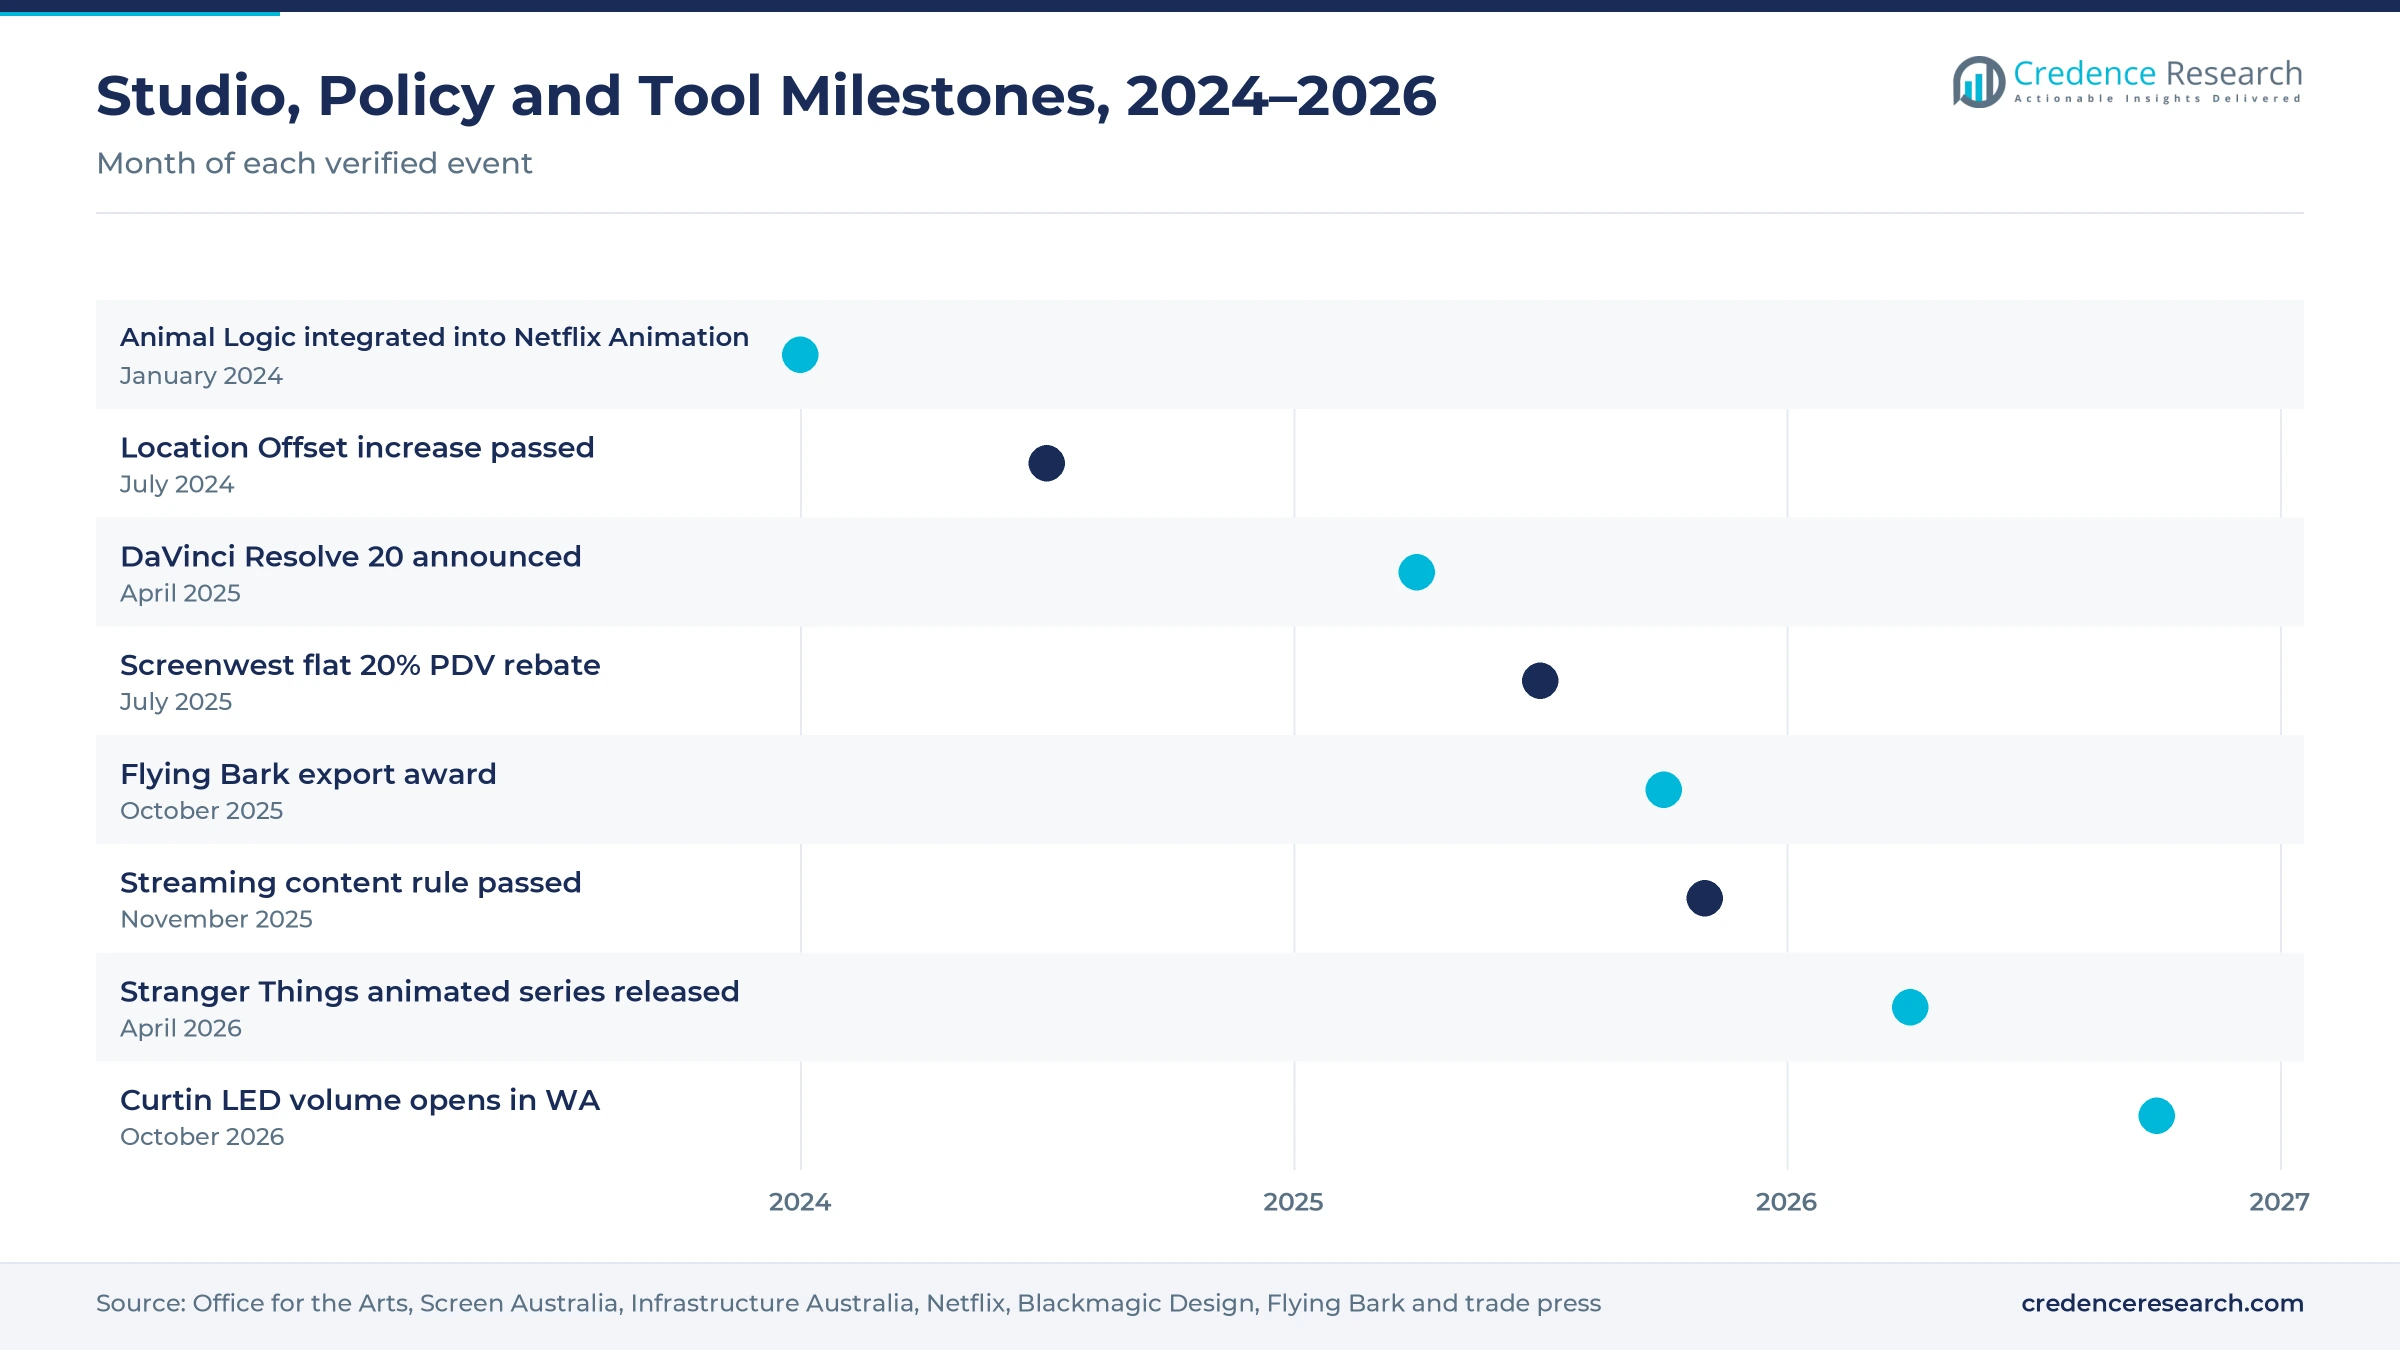
| Development | Status and market relevance |
|---|---|
| In January 2024, Netflix announced that Animal Logic would be fully integrated into Netflix Animation under Karen Toliver. | Consolidated Sydney feature animation |
| In April 2025, Blackmagic Design announced DaVinci Resolve 20 with more than 100 new features and new AI tools. | Widened AI finishing tools |
| In July 2025, Screenwest introduced a flat 20% rebate on qualifying post, digital and visual effects spending in Western Australia. | Raised state support for PDV work |
| In October 2025, Flying Bark Productions won the Creative Industries Award at the NSW Export Awards. | Recognized animation exports |
| In November 2025, Parliament passed the Australian screen content requirement for large streaming services. | Added local content obligations |
Real-time engines and GPU rendering shape pipelines
- Real-time engines render scenes instantly for games, LED stages and design reviews, which lets teams change lighting, layout and cameras during a session rather than waiting overnight.
- LED volume stages show live 3D environments behind performers, which moves environment building and lighting decisions into pre-production and onto the shoot.
- GPU and cloud rendering spread frame rendering across local or rented accelerators, which lets studios meet delivery peaks without permanent render farm expansion.
- AI-assisted editing and compositing tools automate masking, depth mapping, upscaling and cleanup, which frees artists for creative work and shortens finishing schedules.
Need a Custom Version of This Report?
Tailor the scope, geography, or segments to your exact requirements.
- Custom geography or segment scope
- Direct access to our analyst team
Global studios and local exporters compete for work
Competition combines global software and hardware vendors with locally rooted studios that sell services to international and Australian clients. Netflix Animation Studios operates a Sydney studio as one of three locations in its end-to-end pipeline, after integrating Animal Logic into Netflix Animation in 2024. Flying Bark Productions, headquartered in Sydney, works on Netflix series such as Stranger Things Tales From '85 and won an export award in 2025. Rising Sun Pictures in Adelaide and Luma Pictures in Melbourne compete for feature and series effects packages. Blackmagic Design, which has offices in Australia, sells DaVinci Resolve and production hardware, while Epic Games has run Unreal Engine filmmaking challenges with state screen agencies. Rivals compete on pipeline capacity, artist depth, incentive access, delivery reliability and real-time skills.
Which studios and vendors shape Australian CG work?
| Company | Type | Role in the market |
|---|---|---|
| Netflix Animation Studios Sydney | Feature animation studio | Runs one of three Netflix Animation production locations |
| Flying Bark Productions | Series animation studio | Produces Netflix and other animated series from Sydney |
| Rising Sun Pictures | Visual effects studio | Delivers feature and series effects from Adelaide |
| Luma Pictures | Visual effects studio | Delivers Marvel and other effects work from Melbourne |
| Blackmagic Design | Software and hardware vendor | Sells DaVinci Resolve and production hardware |
| Epic Games | Real-time engine vendor | Supports Unreal Engine filmmaking with state screen agencies |
Credence Research view on Australian CG production
Credence Research's view is that Australian demand for creative software, hardware and studio work will keep rising because federal offsets, state rebates and the streaming content rule make the country a reliable place to finish international and local productions. Studio services remain the largest spending pool, yet growth increasingly comes from software subscriptions, cloud rendering and real-time visualization for games, infrastructure and design. Studios that combine strong artist teams with engine skills and flexible rendering capacity should gain share as projects move faster.
How the software, hardware and services estimate was built
The report uses 2025 as the base year on a calendar basis, and market values come from the Credence Research model. That model combines national screen production spending, game industry survey data, infrastructure pipeline figures, population statistics, incentive program rules and company releases. Region growth rates and segment splits are Credence Research estimates built from state production spending shares and game studio employment shares. Sources used are government, statistical agency, international organization, trade press and company publications, and no interviews or surveys were used.
Streaming rules and real-time design drive growth to 2035
The Australia computer graphics market is expected to reach USD 2.04 billion by 2035, a 7.76% CAGR during 2026–2035, as screen offsets, game production and real-time design keep pulling creative work into the country. Growth should be strongest in cloud production workflows, game development, interactive visualization and Queensland and Northern Territory, because these groups gain most from new stages, studios and public projects. Demand for BIM software and related design tools will also widen the base of visualization buyers outside entertainment.
Frequently Asked Questions
How big is the Australia computer graphics market?
Which solution type leads spending?
Which region leads the market?
How much was spent on PDV work in Australia?
How large is the Australian game development industry?
How does the streaming content rule affect CG work?
Who are the leading companies in the market?
What are the main challenges for the market?
Table of Content
Chapter 1 Market Segmentation
- 1.1 Segmentation Framework
- 1.1.1 Product and Service Classification
- 1.1.2 Application and End-Use Classification
- 1.1.3 Technology and Solution Classification
- 1.1.4 Customer and Distribution Channel Classification
- 1.1.5 Geographic Segmentation
- 1.1.6 Market Segment Definitions and Boundaries
- 1.2 By Solution Type
- 1.2.1 CG Software Tools
- 1.2.2 Professional and Prosumer CG Hardware
- 1.2.3 CG Services
- 1.3 By Deployment Model
- 1.3.1 Local Production Workflows
- 1.3.2 Cloud Production Workflows
- 1.3.3 Hybrid Production Workflows
- 1.4 By End-Use Industry
- 1.4.1 Screen and Broadcast Production
- 1.4.2 Game Development
- 1.4.3 Architecture and Engineering
- 1.4.4 Advertising and Specialist Visualization
- 1.5 By Application
- 1.5.1 Asset Creation and Modeling
- 1.5.2 Animation and Simulation
- 1.5.3 Rendering and Compositing
- 1.5.4 Interactive Visualization
Chapter 2 Introduction
- 2.1 Report Objectives and Scope
- 2.2 Product Definition and Industry Terminology
- 2.3 Market Inclusions and Exclusions
- 2.4 Research Process
- 2.4.1 Primary Research and Expert Interviews
- 2.4.2 Secondary Research and Source Review
- 2.4.3 Top-Down and Bottom-Up Estimation
- 2.4.4 Data Triangulation and Verification
- 2.5 Market Size Measurement Basis
- 2.5.1 2025: USD 959.5 million → 2035: USD 2.04 billion
- 2.6 Historical and Forecast Reference Periods
- 2.6.1 Historical Period: 2018-2025
- 2.6.2 Base Year: 2025
- 2.6.3 Forecast Period: 2025-2035
- 2.7 Research Assumptions and Limitations
Chapter 3 Executive Summary
- 3.1 Market Snapshot and Key Findings
- 3.2 Base-Year Market Size, 2025
- 3.3 Forecast Market Size, 2035
- 3.4 Revenue and Volume Growth Outlook
- 3.5 Key Demand and Supply Indicators
- 3.6 Leading Market Segments
- 3.7 Fastest-Growing Market Opportunities
- 3.8 Regional Performance Highlights
- 3.9 Technology and Industry Transformation
- 3.10 Competitive Landscape Summary
- 3.11 Analyst View and Strategic Implications
Chapter 4 Australia Computer Graphics Market Trends and Developments
- 4.1 Historical Industry Development, 2018-2025
- 4.2 Recent Market Trends and Developments
- 4.3 Demand and Customer Behavior Trends
- 4.4 Technology and Product Innovation
- 4.5 Artificial Intelligence, Automation and Digitalization
- 4.6 Local Manufacturing and Supply Chain Realignment
- 4.7 Industry Partnerships, Mergers and Acquisitions
- 4.8 Sustainability and Circular Economy Developments
- 4.9 Government and Private Sector Investment Trends
- 4.10 Emerging Business Models and Commercialization
- 4.11 Industry Developments and Announcements
Chapter 5 Australia Computer Graphics Market Production, Supply and Demand Analysis
- 5.1 Demand Trend and Consumption Analysis, 2018-2025
- 5.2 Demand Forecast, 2025-2035
- 5.3 Production and Output Trend, 2018-2025
- 5.4 Production and Output Forecast, 2025-2035
- 5.5 Installed Capacity and Capacity Utilization
- 5.6 Company-Wise Production Plants and Statistics
- 5.6.1 Installed Production Capacity
- 5.6.2 Actual Production
- 5.6.3 Planned Capacity and Expansion Targets
- 5.7 Supply Chain Structure and Procurement Trends
- 5.8 Supply-Demand Gap and Bottlenecks
- 5.9 Import Dependence and Sourcing Structure
- 5.10 Contract Manufacturing and Outsourcing
- 5.11 Regional Supply and Demand Concentration
Chapter 6 Australia Computer Graphics Market Pricing Analysis
- 6.1 Pricing Structure and Measurement
- 6.2 Historical Pricing Trends, 2018-2025
- 6.3 Pricing Outlook, 2025-2035
- 6.4 Average Selling Price and Unit Economics
- 6.5 Pricing by Product and Market Segment
- 6.6 Geographic Pricing Differences
- 6.7 Key Input, Energy, Labor and Logistics Costs
- 6.8 Contract Pricing and Purchasing Models
- 6.9 Pricing Sensitivity and Competitive Positioning
- 6.10 Price, Margin and Profitability Implications
Chapter 7 Australia Computer Graphics Market Dynamics
- 7.1 Market Growth Drivers
- 7.1.1 Demand-Side Drivers
- 7.1.2 Technology and Innovation Drivers
- 7.1.3 Infrastructure and Investment Drivers
- 7.1.4 Regulatory and Policy Drivers
- 7.2 Market Restraints
- 7.2.1 Cost and Affordability Constraints
- 7.2.2 Technology and Adoption Barriers
- 7.2.3 Supply Chain and Operational Constraints
- 7.3 Market Challenges
- 7.3.1 Competitive Pressure and Margin Erosion
- 7.3.2 Skills, Infrastructure and Implementation Gaps
- 7.4 Emerging Market Opportunities
- 7.5 Market Dynamics Impact and Time-Horizon Assessment
Chapter 8 Australia Computer Graphics Value Chain Analysis
- 8.1 Industry Value Chain Overview
- 8.2 Upstream Suppliers and Critical Inputs
- 8.3 Technology and Component Providers
- 8.4 Manufacturing or Service Delivery
- 8.5 Distribution, Channel Partners and Integrators
- 8.6 Downstream Applications and End Users
- 8.7 Value Addition and Profit Pools
- 8.8 Vertical Integration and Outsourcing
- 8.9 Supplier Concentration and Risk
- 8.10 Supply Chain Localization and Resilience
Chapter 9 Australia Computer Graphics Market Regulations and Policies
- 9.1 Relevant Laws, Standards and Compliance Frameworks
- 9.2 Product, Service, Safety and Quality Requirements
- 9.3 Government Policies, Incentives and Subsidies
- 9.4 Imports, Exports and Trade Barriers
- 9.5 Public Procurement and Local Content Requirements
- 9.6 Environmental and Sustainability Compliance
- 9.7 Data Protection, AI and Cybersecurity Compliance
- 9.8 Upcoming Policy Changes and Market Implications
Chapter 10 Australia Computer Graphics Market Hotspots and Opportunities
- 10.1 Market Opportunity Mapping and Growth Hotspots
- 10.2 High-Growth Applications and Customer Groups
- 10.3 Underserved Markets and White-Space Opportunities
- 10.4 Emerging Technology and Product Opportunities
- 10.5 New Capacity and Investment Hotspots
- 10.6 Market Entry and Expansion Opportunities
- 10.7 Distribution and Partnership Opportunities
- 10.8 Near-Term and Long-Term Commercial Potential
- 10.9 Opportunity Attractiveness and Execution Risks
Chapter 11 Australia Computer Graphics Market Outlook, 2025-2035
- 11.1 Market Size and Analysis
- 11.1.1 Revenue (Market Measurement: 2025: USD 959.5 million → 2035: USD 2.04 billion)
- 11.1.2 Market Volume and Quantity Sold
- 11.1.3 Historical Market Size, 2018-2025
- 11.1.4 Base-Year Market Size, 2025
- 11.2 Market Forecast, 2025-2035
- 11.2.1 Revenue Forecast to 2035
- 11.2.2 Volume Forecast to 2035
- 11.2.3 CAGR and Year-on-Year Growth
- 11.2.4 Incremental Revenue Opportunity
- 11.3 Forecast Assumptions and Scenario Analysis
- 11.3.1 Base-Case Forecast
- 11.3.2 Optimistic and Conservative Scenarios
- 11.3.3 Technology, Pricing and Policy Sensitivities
- 11.4 Market Attractiveness and Growth Outlook
Chapter 12 Australia Computer Graphics Market Segmentation and Outlook
- 12.1 Segmentation Summary and Market Shares, 2025
- 12.2 Largest and Fastest-Growing Segments
- 12.3 By Solution Type - Market Size and Forecast, 2025-2035
- 12.3.1 Segment Definition and Scope
- 12.3.2 Historical Market Size, 2018-2025
- 12.3.3 Revenue Forecast, 2025-2035
- 12.3.4 Volume Forecast, 2025-2035
- 12.3.5 Base-Year Market Share, 2025
- 12.3.6 Segment CAGR and Growth Drivers
- 12.3.7 Subsegment Market Size and Forecast
- 12.3.7.1 CG Software Tools
- 12.3.7.2 Professional and Prosumer CG Hardware
- 12.3.7.3 CG Services
- 12.3.8 Subsegment Pricing and Adoption Trends
- 12.3.9 Leading Suppliers and Competition
- 12.3.10 Regional Demand and Opportunities
- 12.4 By Deployment Model - Market Size and Forecast, 2025-2035
- 12.4.1 Segment Definition and Scope
- 12.4.2 Historical Market Size, 2018-2025
- 12.4.3 Revenue Forecast, 2025-2035
- 12.4.4 Volume Forecast, 2025-2035
- 12.4.5 Base-Year Market Share, 2025
- 12.4.6 Segment CAGR and Growth Drivers
- 12.4.7 Subsegment Market Size and Forecast
- 12.4.7.1 Local Production Workflows
- 12.4.7.2 Cloud Production Workflows
- 12.4.7.3 Hybrid Production Workflows
- 12.4.8 Subsegment Pricing and Adoption Trends
- 12.4.9 Leading Suppliers and Competition
- 12.4.10 Regional Demand and Opportunities
- 12.5 By End-Use Industry - Market Size and Forecast, 2025-2035
- 12.5.1 Segment Definition and Scope
- 12.5.2 Historical Market Size, 2018-2025
- 12.5.3 Revenue Forecast, 2025-2035
- 12.5.4 Volume Forecast, 2025-2035
- 12.5.5 Base-Year Market Share, 2025
- 12.5.6 Segment CAGR and Growth Drivers
- 12.5.7 Subsegment Market Size and Forecast
- 12.5.7.1 Screen and Broadcast Production
- 12.5.7.2 Game Development
- 12.5.7.3 Architecture and Engineering
- 12.5.7.4 Advertising and Specialist Visualization
- 12.5.8 Subsegment Pricing and Adoption Trends
- 12.5.9 Leading Suppliers and Competition
- 12.5.10 Regional Demand and Opportunities
- 12.6 By Application - Market Size and Forecast, 2025-2035
- 12.6.1 Segment Definition and Scope
- 12.6.2 Historical Market Size, 2018-2025
- 12.6.3 Revenue Forecast, 2025-2035
- 12.6.4 Volume Forecast, 2025-2035
- 12.6.5 Base-Year Market Share, 2025
- 12.6.6 Segment CAGR and Growth Drivers
- 12.6.7 Subsegment Market Size and Forecast
- 12.6.7.1 Asset Creation and Modeling
- 12.6.7.2 Animation and Simulation
- 12.6.7.3 Rendering and Compositing
- 12.6.7.4 Interactive Visualization
- 12.6.8 Subsegment Pricing and Adoption Trends
- 12.6.9 Leading Suppliers and Competition
- 12.6.10 Regional Demand and Opportunities
- 12.7 Segment Growth Comparison
- 12.8 Segment Attractiveness and Priority Matrix
Chapter 13 Australia Computer Graphics End-Use and Application Market Outlook
- 13.1 End-Use Industry and Customer Demand Structure
- 13.2 Leading Applications and Customer Groups
- 13.3 End-Use Market Size, Share and Forecast
- 13.4 Major End-Use Industry Deep Dives
- 13.4.1 Customer Requirements and Use Cases
- 13.4.2 Demand and Replacement Cycles
- 13.4.3 Technical and Regulatory Considerations
- 13.4.4 Purchasing and Procurement Models
- 13.4.5 Leading Vendors and Distribution Channels
- 13.4.6 Forecast and Commercial Opportunities
- 13.5 Emerging Applications and Cross-Segment Demand
- 13.6 End-Use Industry Investment Priorities
Chapter 14 Australia Computer Graphics Geographic Market Outlook, 2025-2035
- 14.1 Domestic Market Distribution and Demand Clusters
- 14.2 State- or Province-Wise Market Size and Forecast, 2025-2035
- 14.3 City and Metropolitan Market Outlook
- 14.4 Industrial, Manufacturing and Commercial Clusters
- 14.5 Geographic Concentration of Key End Users
- 14.6 Local Pricing and Purchasing Differences
- 14.7 Domestic Production Facilities and Capacity Map
- 14.8 Local Infrastructure and Project Pipeline
- 14.9 State-Level Policy and Incentive Differences
- 14.10 Subnational Investment Hotspots and Opportunities
- 14.11 Distribution and Logistics Networks
- 14.12 Domestic Competitive Footprint
Chapter 15 Australia Computer Graphics Technology, Innovation and Sustainability Outlook
- 15.1 Technology Landscape and Maturity
- 15.2 Product, Process and Service Innovation
- 15.3 AI, Automation and Digital Tools in the Industry
- 15.4 Technology Adoption and Performance Benchmarking
- 15.5 Innovation Pipeline and R&D Investment
- 15.6 Patent and Intellectual Property Trends
- 15.7 Energy Efficiency and Resource Management
- 15.8 Sustainability, Recycling and Circularity
- 15.9 Technology Roadmap, 2025-2035
- 15.10 Risks of Obsolescence and Technology Substitution
Chapter 16 Australia Computer Graphics Market Key Strategic Imperatives
- 16.1 Growth and Market Entry Priorities
- 16.2 High-Return Products and Segments
- 16.3 Pricing, Profitability and Cost Optimization
- 16.4 Technology Investment and Product Differentiation
- 16.5 Supply Chain Localization and Resilience
- 16.6 Distribution and Customer Acquisition
- 16.7 Partnership, Acquisition and Capacity Strategy
- 16.8 Regional Expansion Priorities
- 16.9 Short-, Medium- and Long-Term Actions
Chapter 17 Competition Outlook
- 17.1 Industry Competition Characteristics
- 17.2 Market Structure and Concentration
- 17.3 Market Share and Competitive Positioning, 2025
- 17.4 Company-Wise Revenue and Product Benchmarking
- 17.5 Production and Service Capacity Benchmarking
- 17.6 Technology, Pricing and Differentiation
- 17.7 Regional Footprint and Distribution Strength
- 17.8 Mergers, Acquisitions and Strategic Alliances
- 17.9 New Entrants and Competitive Threats
- 17.10 Porter's Five Forces and Industry Attractiveness
- 17.11 Competitive Outlook, 2025-2035
Chapter 18 Company Profiles
- 18.1 Company Coverage and Selection Criteria
- 18.2 Adobe
- 18.2.1 Business Description
- 18.2.2 Company Ownership and Geographic Presence
- 18.2.3 Product and Service Portfolio
- 18.2.4 Manufacturing and Operating Footprint
- 18.2.5 Production Capacity and Expansion Plans
- 18.2.6 Financial Performance and Investment
- 18.2.7 Market Share and Competitive Position
- 18.2.8 Technology and Innovation Capabilities
- 18.2.9 Strategic Alliances or Partnerships
- 18.2.10 Recent Developments
- 18.2.11 Growth Strategy and Outlook
- 18.3 Autodesk
- 18.4 NVIDIA
- 18.5 Netflix Animation Studios Sydney
- 18.6 Flying Bark Productions
- 18.7 Epic Games
- 18.8 Blackmagic Design
- 18.9 Unity
- 18.10 Luma Pictures
- 18.11 Rising Sun Pictures
- 18.12 Other Relevant Market Participants
Note: Every listed company is profiled on the structure shown under the first company. The company list is preliminary and may change based on research findings, market developments, data availability and client requirements.
Chapter 19 Disclaimer
- 19.1 Research and Forecast Disclaimer
- 19.2 Data Source and Estimation Limitations
Note: The depth of individual sections depends on data availability for this market. Volume, capacity, trade and other unit-based metrics are included where applicable.

