
Property, car and job sites earn more per listing
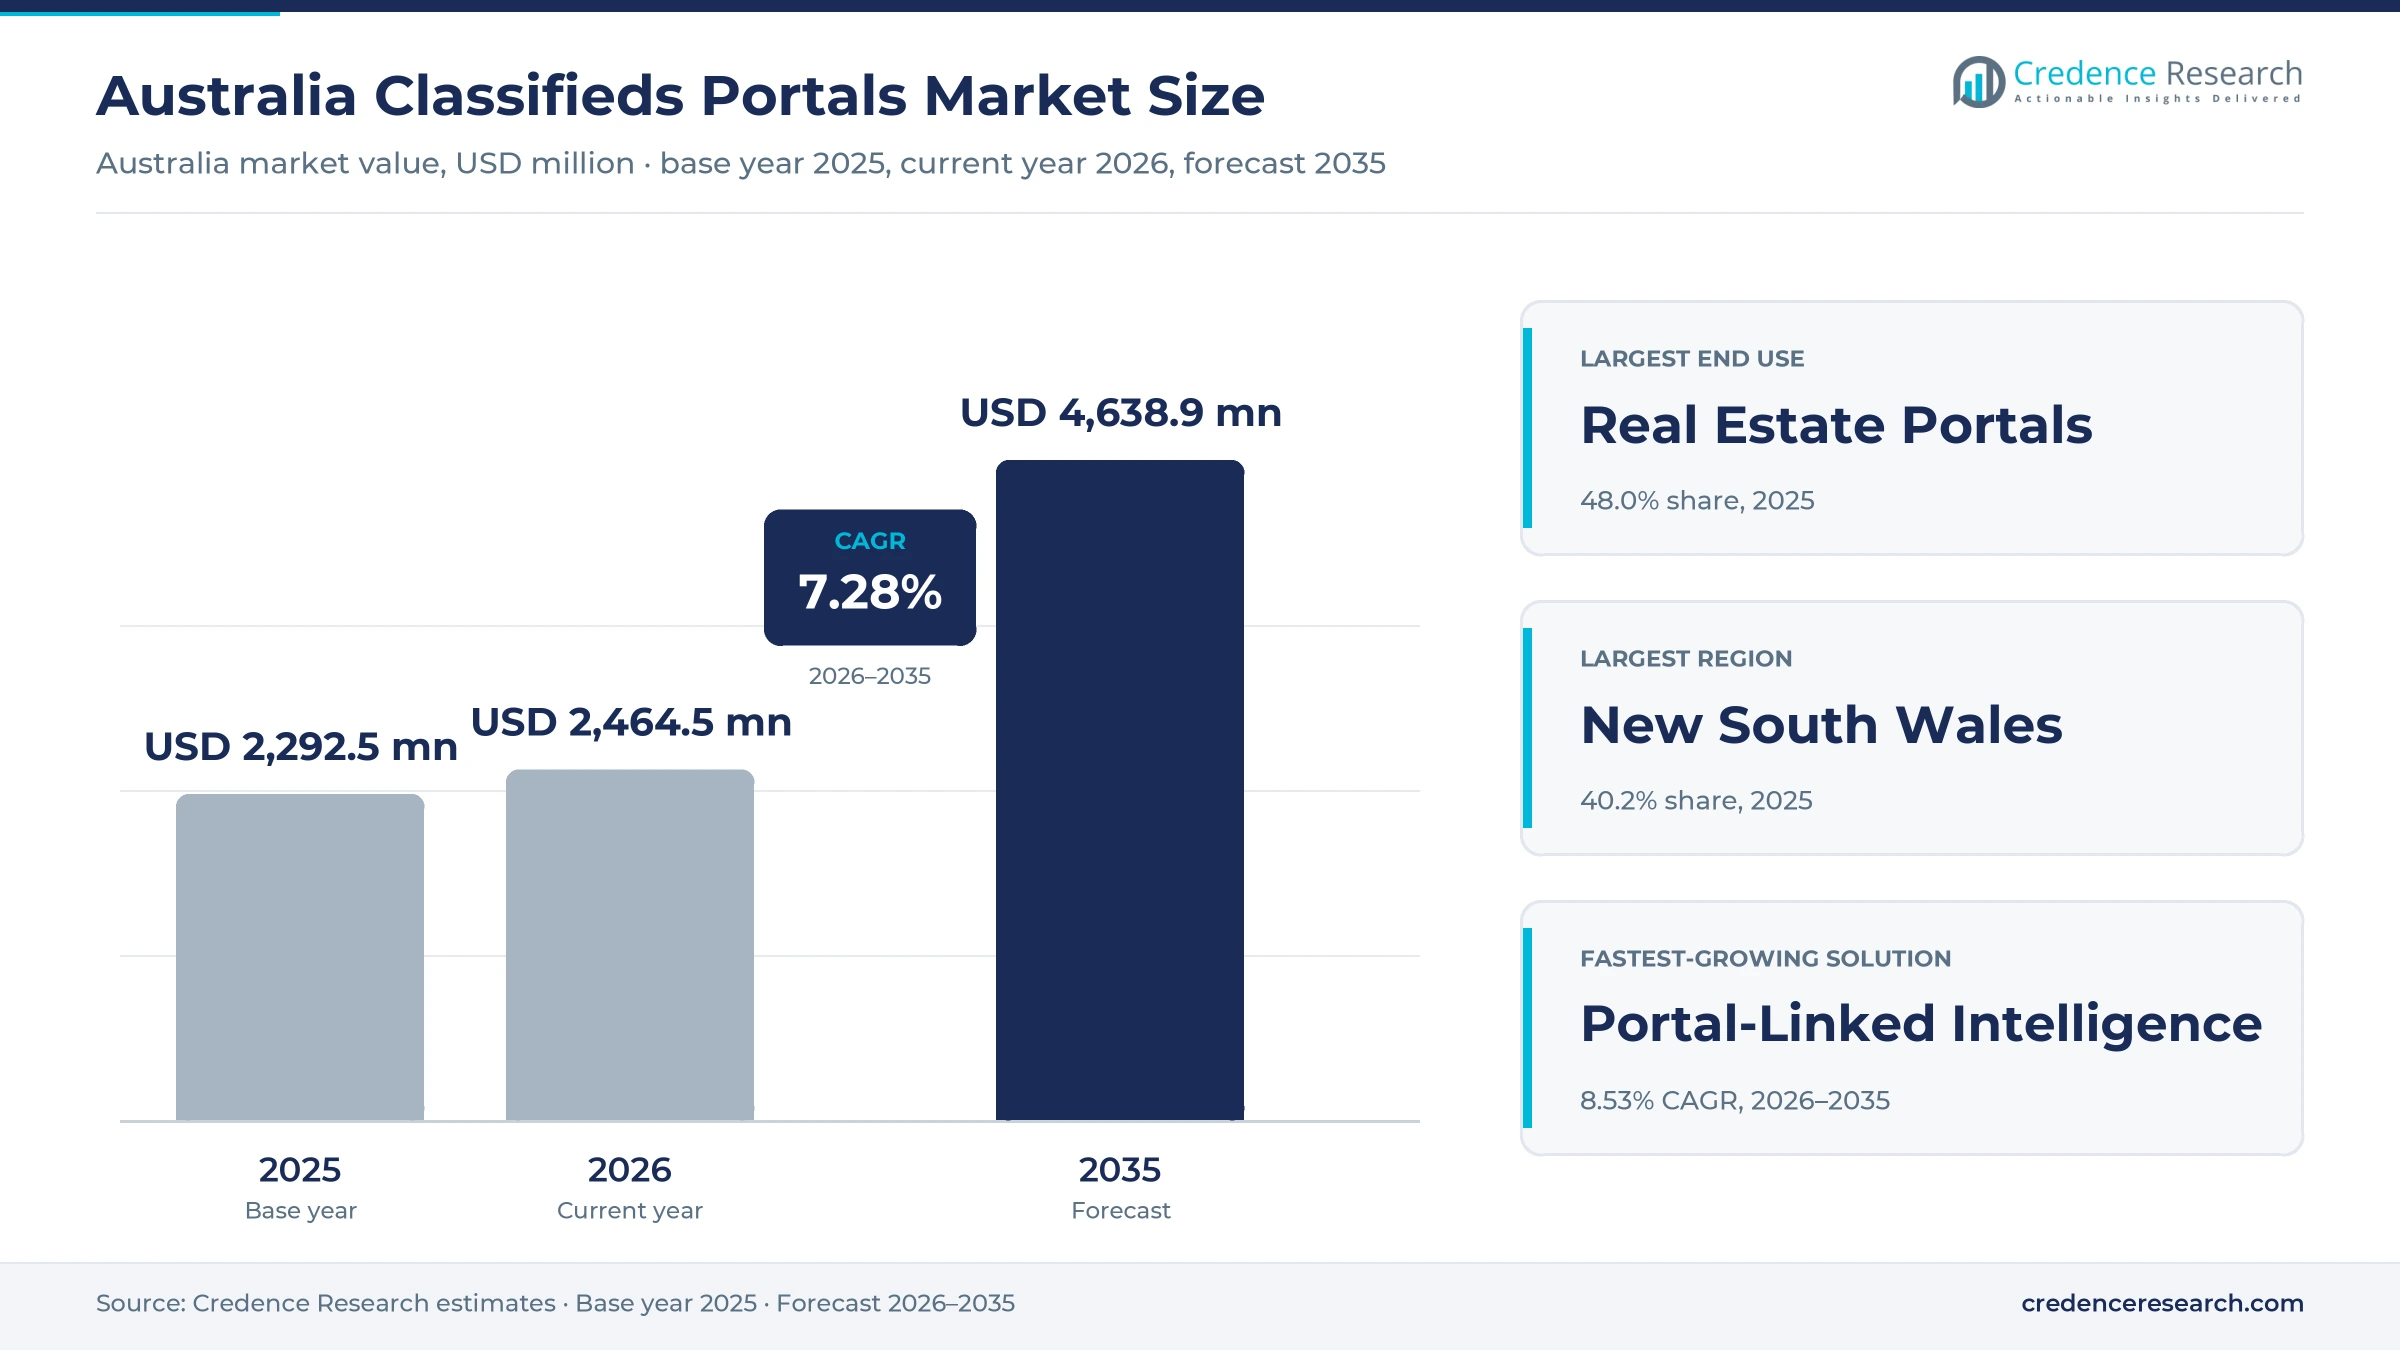
The Australia classifieds portals market was valued at USD 2.29 billion in 2025 and is projected to increase from USD 2.46 billion in 2026 to USD 4.64 billion by 2035, registering a CAGR of 7.28% during 2026–2035. Demand comes from real estate agents, car dealers, employers and private sellers that pay listing fees, subscriptions and premium upgrades to reach buyers, renters and jobseekers on property, automotive, employment and general marketplaces. New South Wales held the largest regional share, 40.2% in 2025, because Sydney concentrates the largest volume of high-value property campaigns, dealer stock and advertised jobs. Queensland is the fastest-growing region at 7.71% a year, as population growth and steady hiring add listings in Brisbane and the surrounding coast. At the same time, competition in property changed in August 2025, when CoStar Group completed its takeover of Domain and pledged heavy investment against the market leader.
Which listing and upgrade fees does the estimate count?
The estimate counts fees that advertisers pay to online marketplaces for property, vehicle, job and general goods listings, including base listing fees, subscription packages, premium placement upgrades, lead fees and display advertising sold alongside listings. It also counts portal-linked intelligence services such as market data, valuation tools and dealer or agent workflow software sold by the same platforms.
The estimate excludes print classifieds, transaction commissions on fully integrated online retail marketplaces, mortgage broking income and the overseas operations of Australian platform owners. The value chain links listing platforms, agents and dealers, recruitment firms, software integrators and media agencies, while private sellers mostly buy listings and upgrades through self-service checkouts.
Australia Classifieds Portals Market Insights
- The Australia classifieds portals market was valued at USD 2.29 billion in 2025 and is projected to reach USD 4.64 billion by 2035, registering a CAGR of 7.28% during 2026–2035.
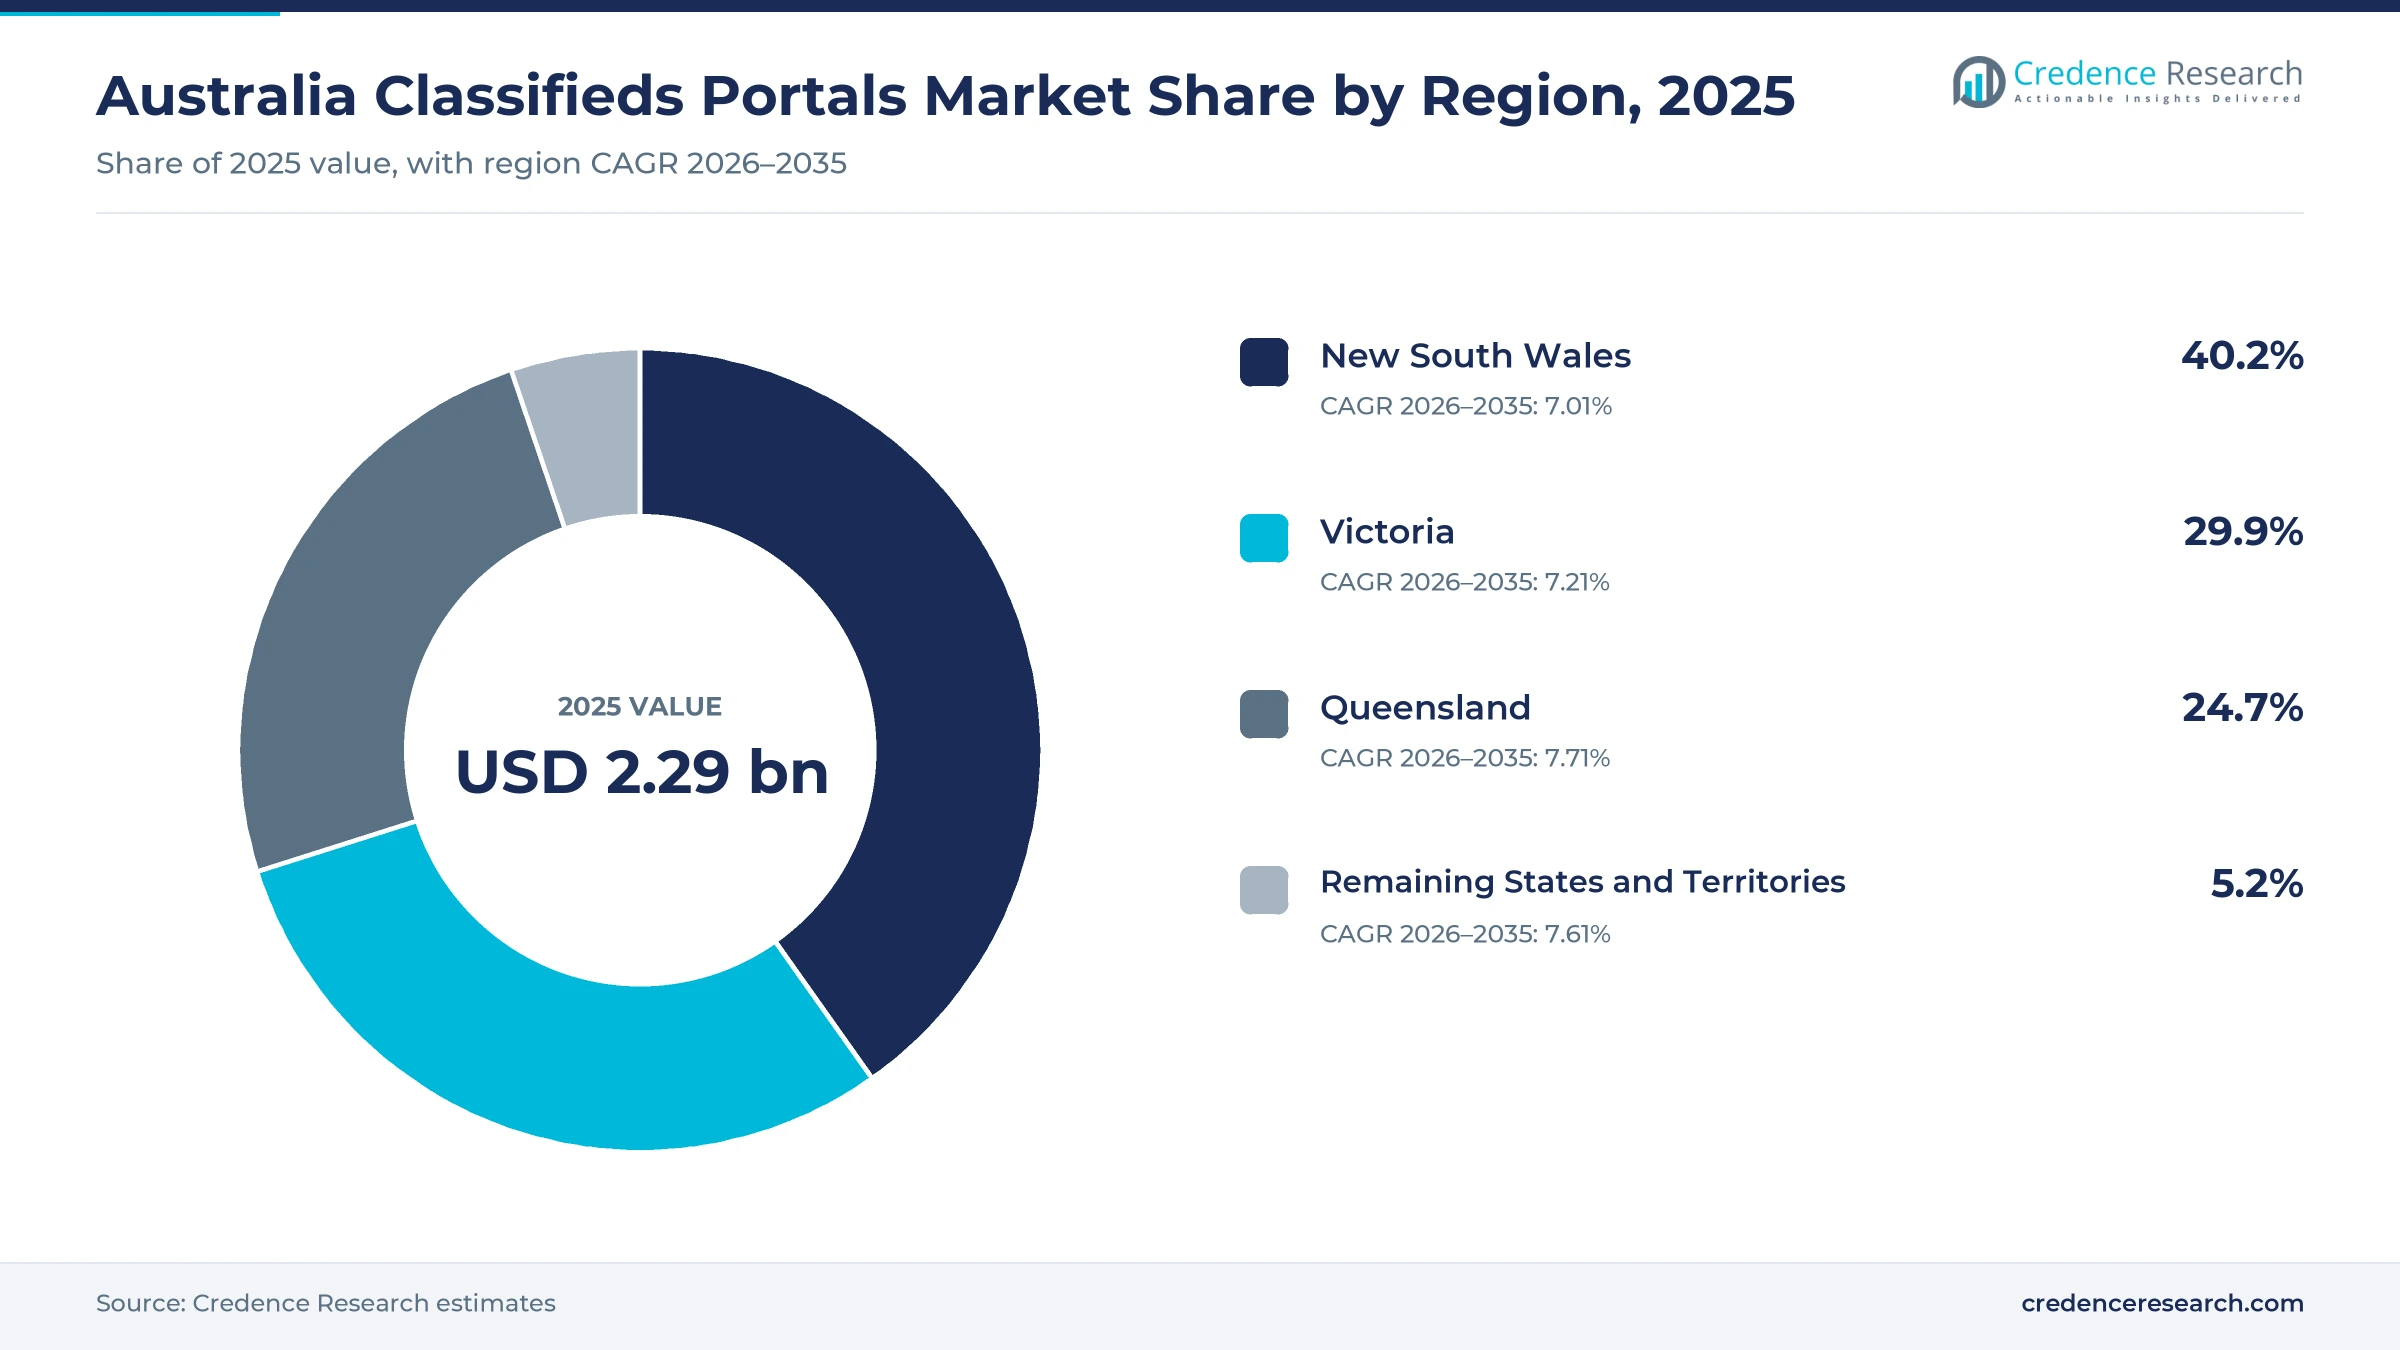
- New South Wales held a 40.2% share of 2025 value, because Sydney hosts the largest pool of property campaigns, dealer inventory and advertised vacancies in the country.
- Real Estate Portals led end-use industries with a 48.0% share of 2025 value, because agents pay for premium property listings on almost every sale campaign.
- REA Group reported 13% growth in residential Buy yield in fiscal 2026 while national Buy listings stayed flat, which shows that pricing and depth products now drive spending.
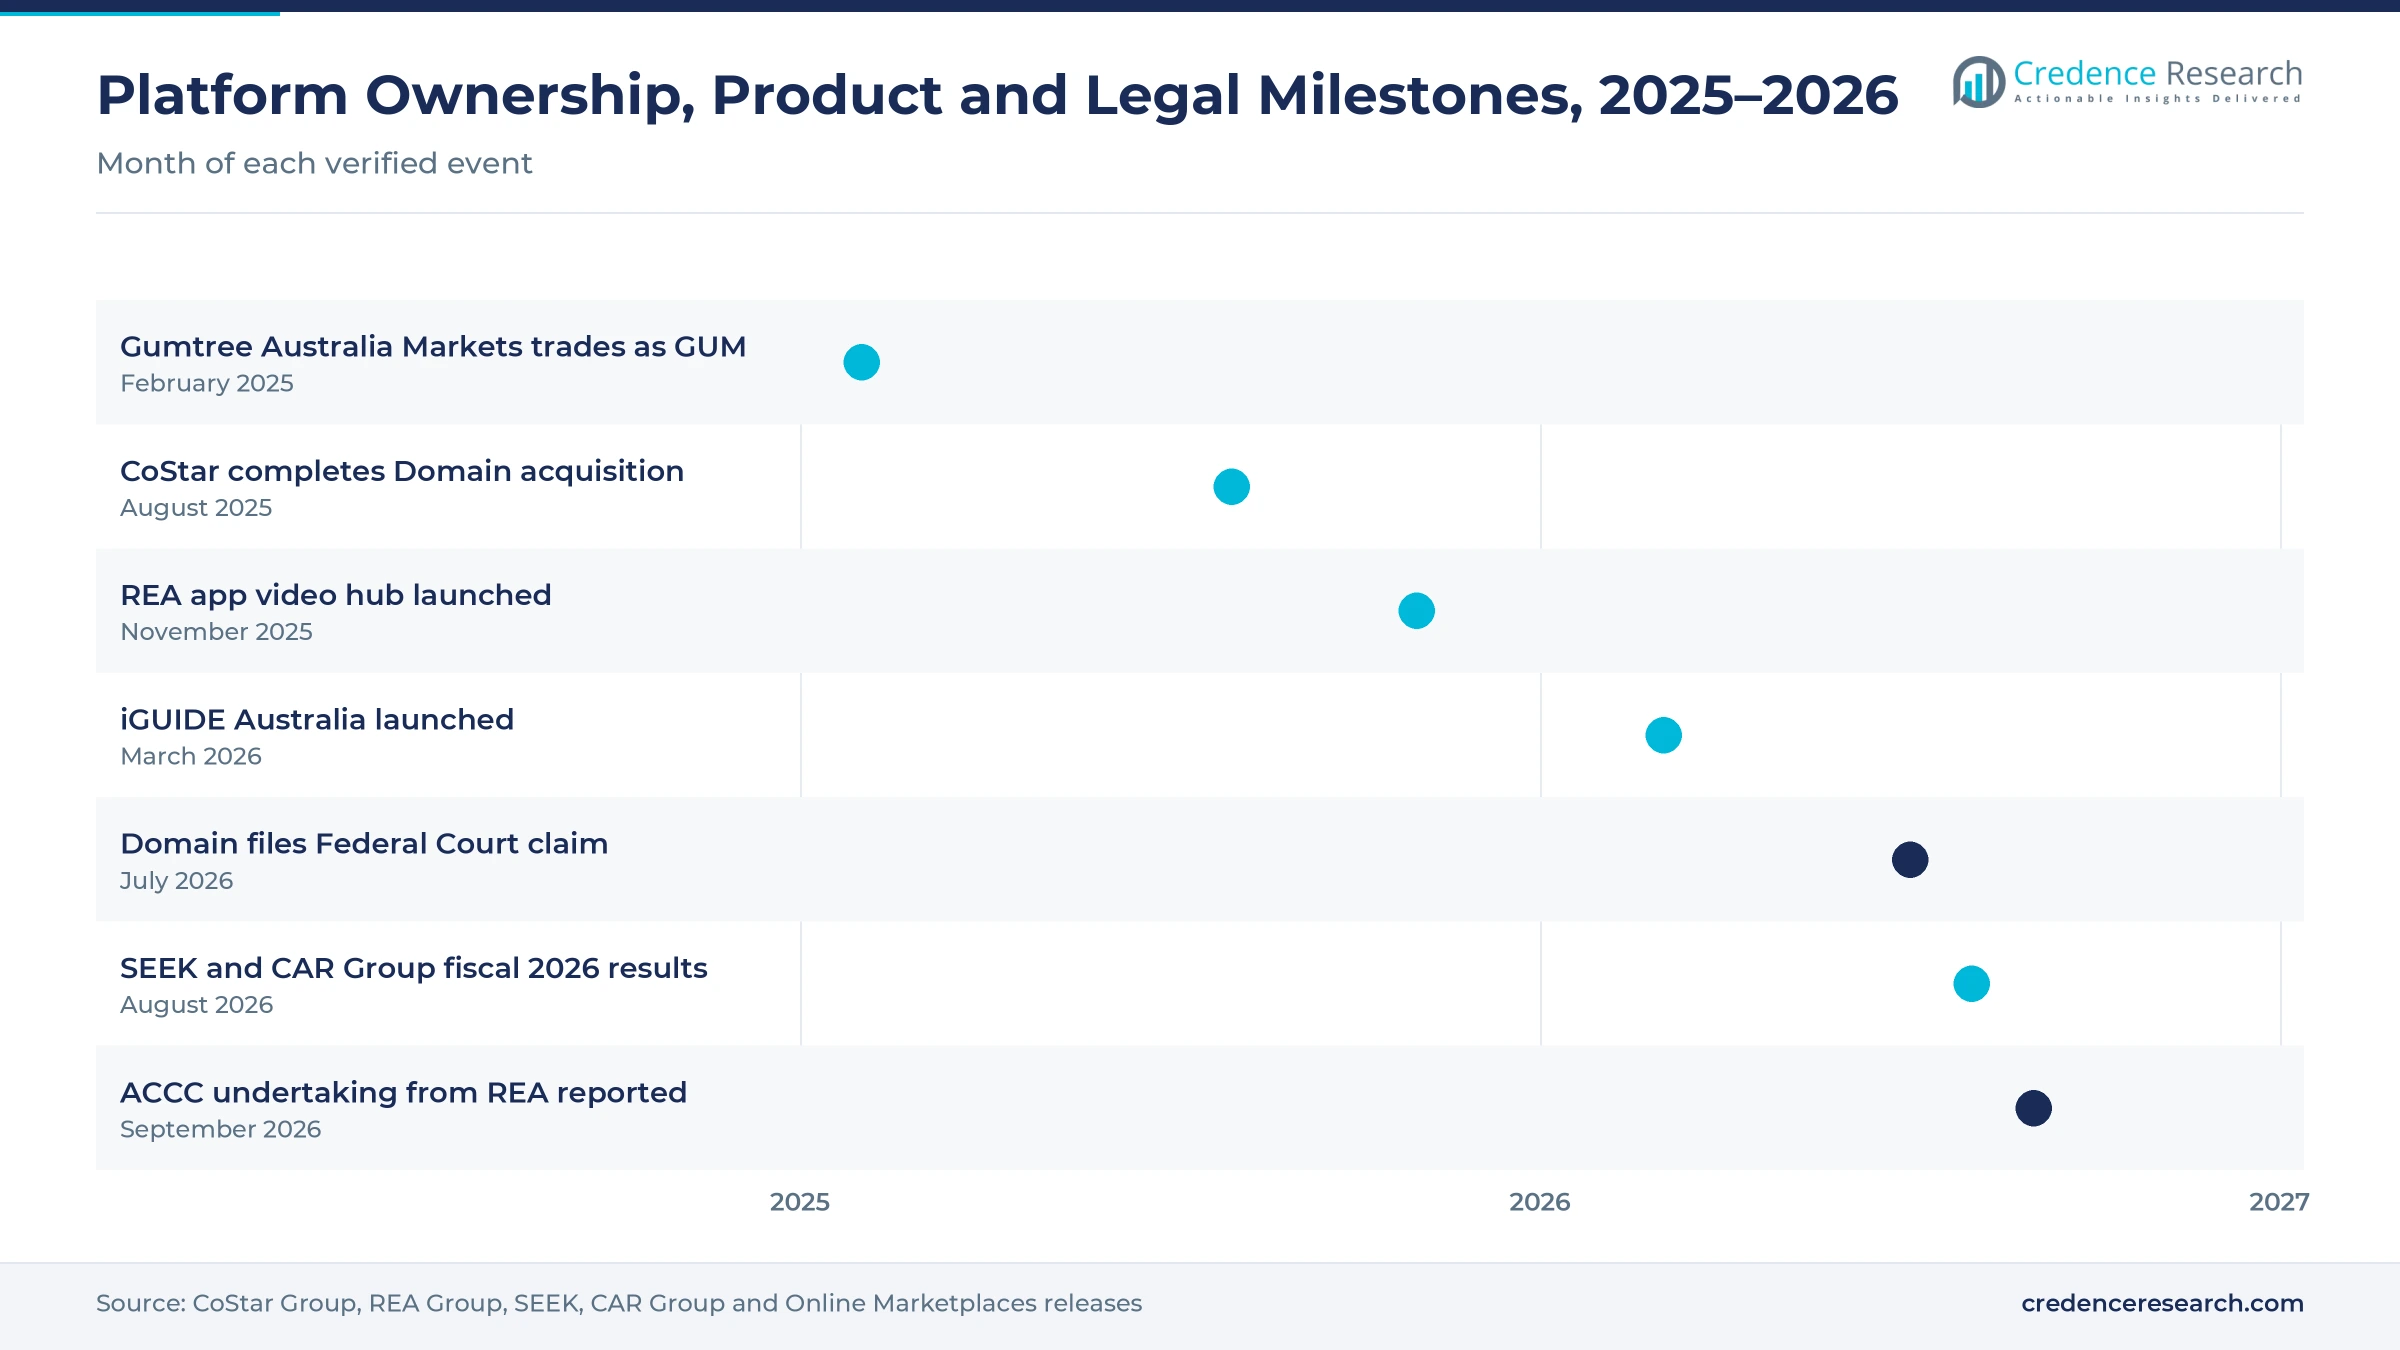
- CoStar Group completed its acquisition of Domain on Aug. 27, 2025, which brought a well-funded global owner into the property segment and raised marketing and product investment.
Core listings lead while intelligence services grow fastest
Why do base listings still form the largest fee pool?
Based on solution type, the market is categorized into core listing services, premium visibility services and portal-linked intelligence services. Core Listing Services led with a 52.0% share of 2025 value, because every property, vehicle and job advertisement starts with a paid base listing. Portal-Linked Intelligence Services grow fastest at 8.53% a year, as agents, dealers and employers buy data, valuation and workflow tools from the platforms they already use.
Which listing verticals generate the most advertiser spending?
Based on end-use industry, the market is categorized into real estate portals, automotive portals, employment portals and general and horizontal classifieds. Real Estate Portals led with a 48.0% share of 2025 value, because property campaigns carry high premium listing fees paid by vendors through agents. Real Estate Portals grow fastest at 7.57% a year, as price rises on top-tier listings continue even when listing volumes stay flat.
How are premium upgrades changing the revenue mix?
Based on revenue model, the market is categorized into listing fees, subscription packages, premium upgrades and lead fees, and advertising and portal-linked services. Listing Fees led with a 38.0% share of 2025 value, because pay-per-listing pricing still dominates private and small advertiser purchases. Premium Upgrades and Lead Fees grow fastest at 8.17% a year, as platforms move advertisers into higher-priced tiers with better placement and candidate or buyer targeting.
Why do direct account teams handle most portal spending?
Based on sales channel, the market is categorized into direct account sales, self-service purchasing and agency and integration partners. Direct Account Sales led with a 46.0% share of 2025 value, because large agency networks, dealer groups and employers negotiate annual contracts with platform sales teams. Agency and Integration Partners grow fastest at 7.67% a year, as listings flow automatically from agent, dealer and applicant tracking software into the platforms.
| Segment Group | Leading Sub-segment | Share, 2025 | Fastest-growing Sub-segment | CAGR, 2026–2035 |
|---|---|---|---|---|
| By Solution Type | Core Listing Services | 52.0% | Portal-Linked Intelligence Services | 8.53% |
| By End-Use Industry | Real Estate Portals | 48.0% | Real Estate Portals | 7.57% |
| By Revenue Model | Listing Fees | 38.0% | Premium Upgrades and Lead Fees | 8.17% |
| By Sales Channel | Direct Account Sales | 46.0% | Agency and Integration Partners | 7.67% |
Request a Free Sample
Fill in your details and we'll send you a free sample report.
- Sample data tables & charts
- Research methodology
Premium tiers, dealer tools and AI ads lift portal yield
How does premium property listing pricing lift spending?
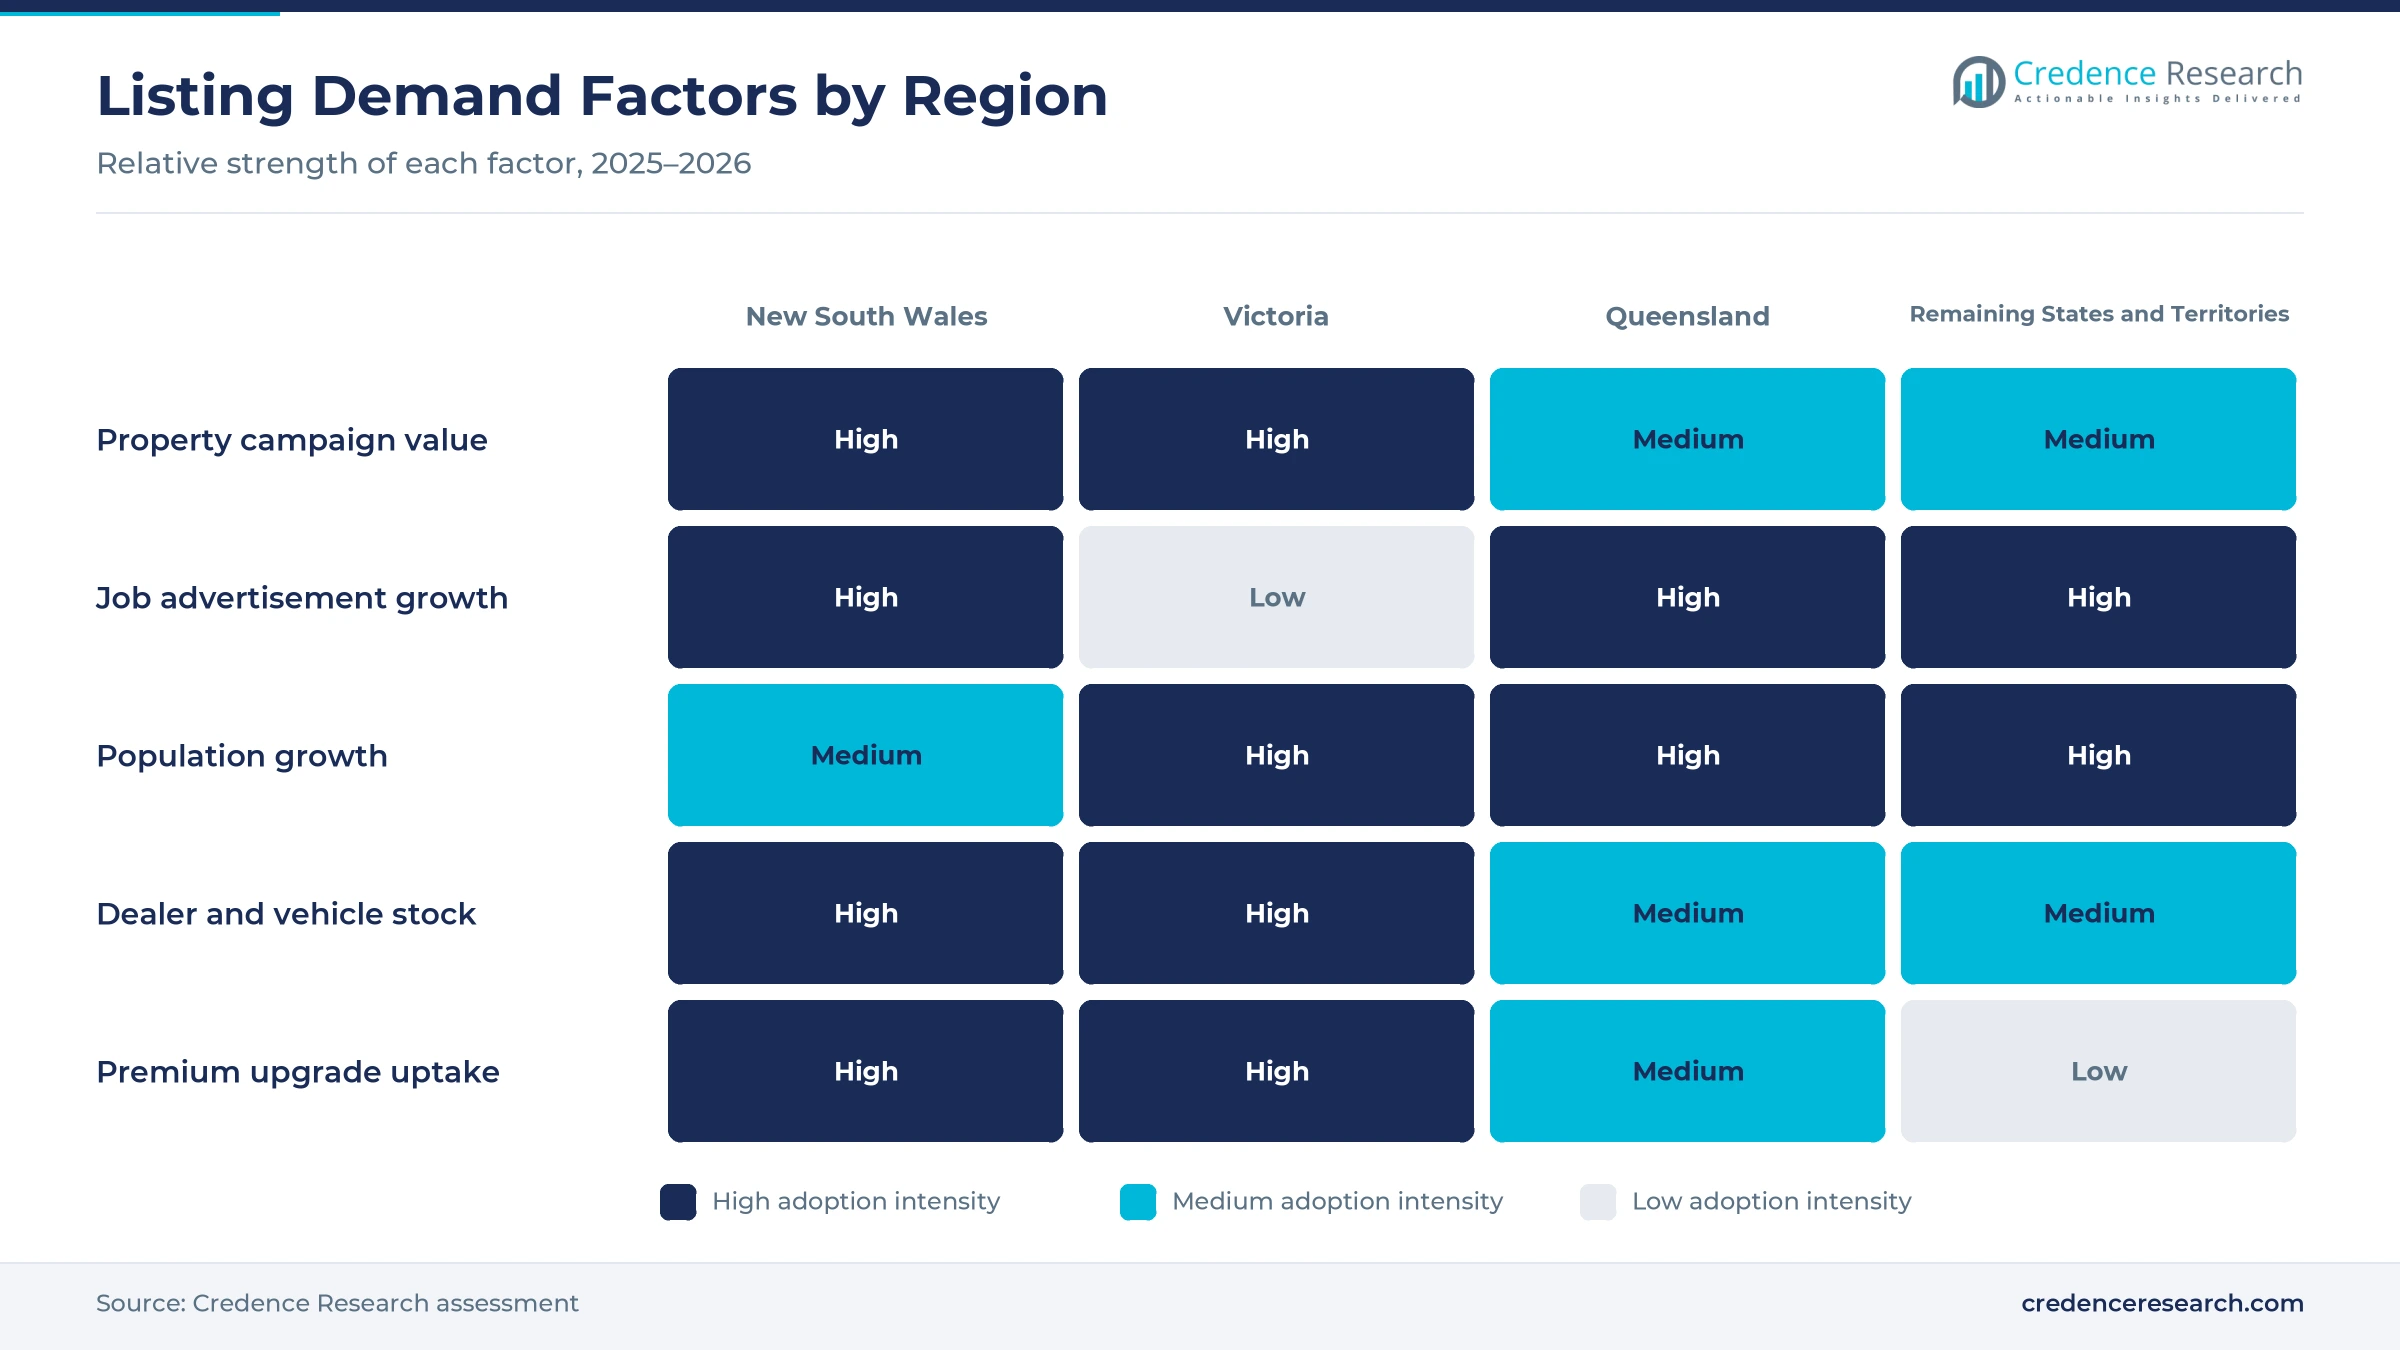
Property platforms now earn more from each listing because vendors keep paying for top-tier exposure even when the number of homes for sale barely moves. REA Group reported 13% growth in residential Buy yield in fiscal 2026 while national Buy listings finished flat, according to its full-year results release. The same release cites a 7% average Premiere+ price rise in fiscal 2026 and anticipates an 8% Premiere+ price rise in fiscal 2027. Realestate.com.au also averaged 146.4 million monthly visits, up 11%, which supports the pricing case for agents. As a result, real estate portals lead end-use industries with 48.0% of 2025 value.
Why do new automotive dealer products widen spending?
Car dealers spend more on marketplaces when platforms bundle listings with workflow, data and trade-in tools that help them turn stock faster. Australians bought a record 1,241,037 new vehicles in 2025, the third straight annual record, according to carsales, which keeps trade-ins and used stock flowing onto dealer listings. CAR Group launched Nexgate as its next-generation dealer platform, combining dealer workflow and data solutions under one brand, according to its Aug. 10, 2026, results release. The same release names volume, yield and depth penetration in Dealer, plus Instant Offer in Private, as drivers of fiscal 2027 growth. In turn, portal-linked intelligence services grow at 8.53% a year, the fastest solution type.
How do better job ad tiers and matching raise yield?
Employers now pay more per job advertisement because upgraded tiers promise more suitable applicants, even as the number of advertised roles softens. SEEK reported that job ad yield grew 14% in fiscal 2026 while Australian job ad volumes fell 2%, citing higher depth adoption after upgraded ad tiers launched. Its job ad range now runs from Basic to Advanced and Premium ads, and Premium ads are sent as exclusive recommendations to high-fit candidates. Premium buyers also get unlimited AI pre-screens and reference checks through the Assist hiring tool. As a result, premium upgrades and lead fees grow at 8.17% a year, the fastest revenue model.
Why does near-universal internet use support portal habits?
Buyers, renters and jobseekers now begin almost every search online, which keeps advertisers committed to the largest marketplaces. About 96.1% of Australians used the internet in 2024, according to the World Bank, leaving little offline audience for print classifieds. Domain recorded 46.2 million average monthly visits in the first quarter of 2026, up 35% from a year earlier, according to Elite Agent, while its app audience rose 25% to 1.2 million. The Australian population also grew 1.4% to about 27.9 million in the year to March 2026, which adds households that move, buy cars and change jobs. In turn, self-service purchasing grows faster than direct account sales.
AI search, video and data services reshape listings
How is the shift to AI search changing listing products?
Platforms now build AI assistants and conversational search into listings, which changes what advertisers expect from a premium placement. REA Group says its consumer-facing AI Assistant is available to 100% of members, and its Campaign Assist tool is open to every agency customer on Ignite. CAR Group says AI-led improvements to search, personalization and workflow tools improved the experience for consumers and dealers in fiscal 2026. SEEK includes 3 AI pre-screens with a Basic ad and 15 with an Advanced ad, and it describes its seekAi engine as learning from role requirements and hiring activity to target high-fit candidates for each advertisement. As a result, platforms compete on match quality rather than raw traffic, which supports faster growth in premium upgrades and lead fees.
Why is the rise of video and immersive media notable?
Property advertisers now pay for richer media because buyers screen homes online before booking inspections. REA Group added a video hub to its app home screen in November 2025, and the hub drew 2.9 million video views by the end of fiscal 2026. It also launched iGUIDE Australia in March 2026 to supply interactive floor plans and property tours for listings. Domain is rolling out Matterport virtual tours at scale, and its sale listing views rose 28% while app downloads rose 89% in the first quarter of 2026, according to Elite Agent. In turn, premium visibility services grow faster than core listings, because media add-ons are sold with top-tier property packages during 2026–2035.
Can the CoStar challenge open space for agent services?
A well-funded challenger in property advertising creates room for new agent tools and more competitive package pricing. CoStar Group completed its acquisition of Domain on Aug. 27, 2025, according to its completion release, which said Domain reaches about 7 million Australians each month. CoStar said it would apply its Homes.com playbook in Australia and build a more compelling experience at lower cost. Domain then claimed 7.7 million visitors in June 2026, its strongest month on record, according to Online Marketplaces. As a result, agents gain more choice, and agent CRM software vendors gain integration partners on both leading property sites.
Is there an opening in regional hiring and listings growth?
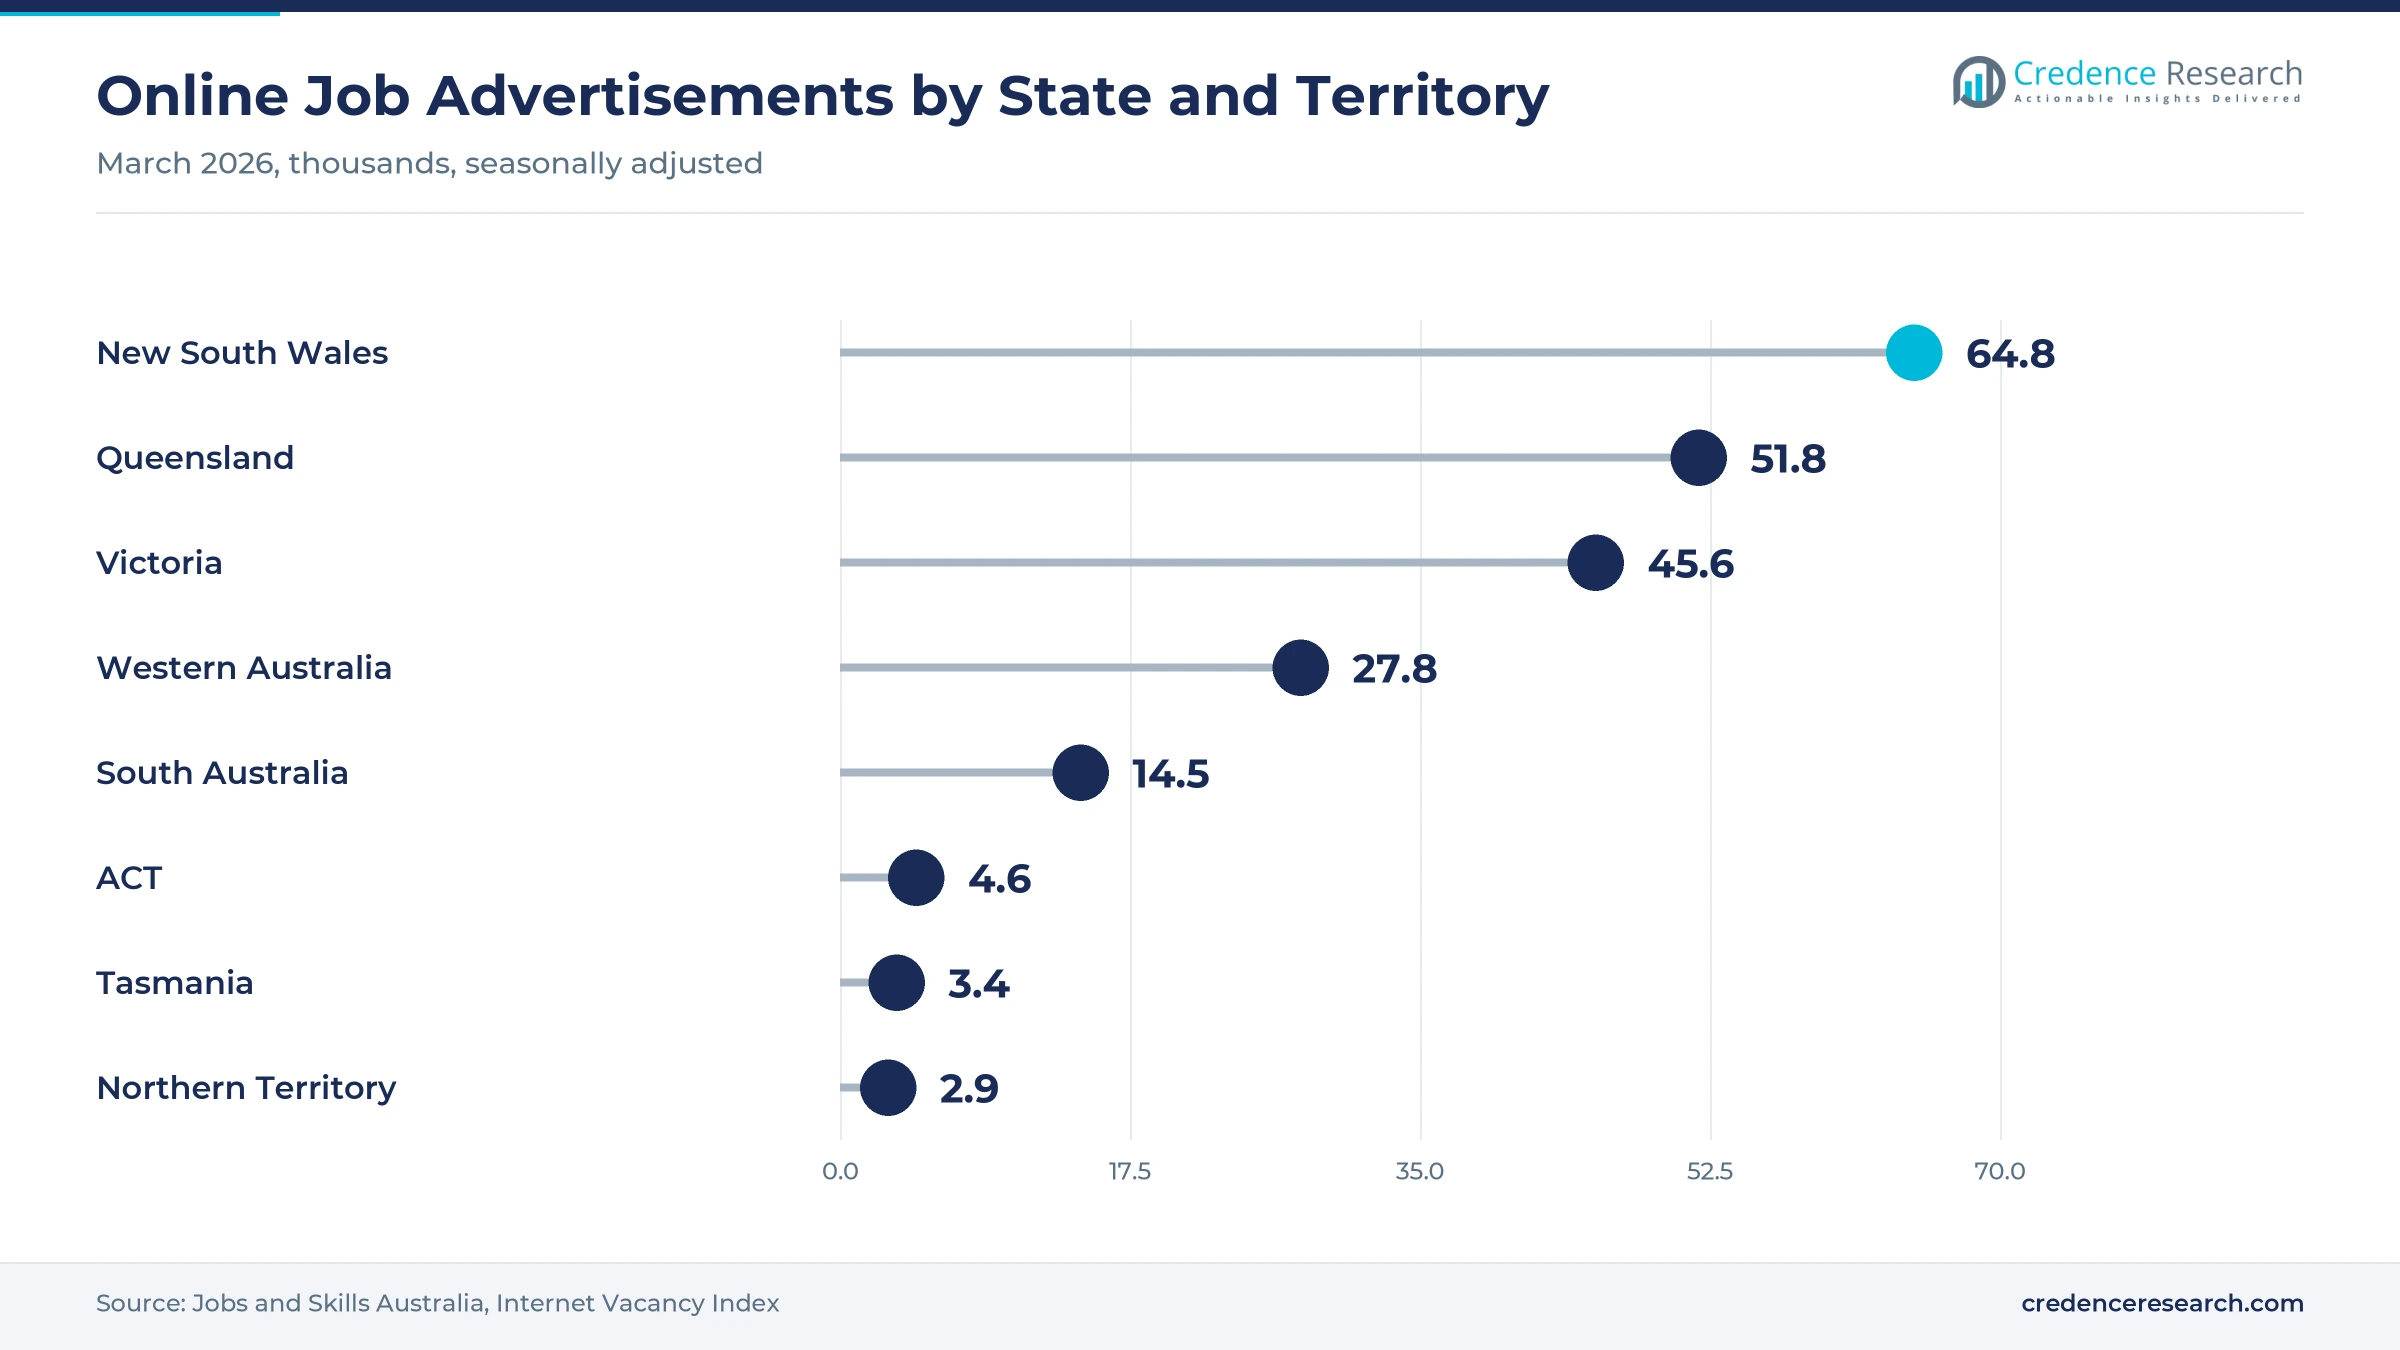
Hiring and housing activity outside Sydney and Melbourne now grow faster, which opens room for regional campaigns. Online job advertisements rose 6.5% in Queensland and 6.3% in Western Australia in the year to March 2026, against 0.4% in Victoria, according to the Internet Vacancy Index. REA Group reported that Brisbane, Perth and Adelaide listings rose 13% in July 2026, while combined Sydney and Melbourne listings fell 16%. Western Australia recorded the fastest population growth of any state, at 2.1% in the year to March 2026. In turn, Queensland is the fastest-growing region in this report, and online recruitment products gain regional demand.
Flat listings, legal fights and ACCC scrutiny test pricing
How do flat listing volumes cap portal growth?
National residential Buy listings finished fiscal 2026 where they started, and REA Group expects them to be flat to down in fiscal 2027, which limits volume growth. As a result, platforms rely on price rises and depth products to grow, which agents and vendors increasingly resist. SEEK faced a similar pattern as Australian job ad volumes fell 2% in fiscal 2026. Platforms respond with clearer return measures, such as estimated views and applications shown before an employer buys an ad.
Why does ACCC scrutiny limit bundling practices?
Online Marketplaces reported in September 2026 that the ACCC accepted an undertaking from REA Group after examining contracts that required agencies to list all properties on realestate.com.au. As a result, new agreements cannot require agents to list all or most properties on the site, and agencies may downgrade at least 25% of eligible sale listings. REA Group said in its ASX filing that there was no finding of legal wrongdoing. The change gives agents more freedom to split spending across platforms, which may slow yield gains.
How do marketing disputes raise competitive risk?
Domain filed a Federal Court claim in July 2026 against REA Group's marketing line that realestate.com.au attracts and engages the buyer on 9 in 10 listed properties, according to Online Marketplaces. REA counterclaimed that Domain misled the market about its own platform. As a result, both property platforms face legal costs and closer scrutiny of audience claims used in agent sales. Platforms respond by publishing independent audience measures, such as monthly visits and exclusive audience data.
Why do social marketplaces pressure paid listings?
The ACCC classed Facebook Marketplace and Gumtree as online classified ad platforms in its April 2022 marketplace review, because transactions are not completed on the platform itself. As a result, private sellers can reach buyers through social networks instead of paid vertical listings, which limits pricing power in general goods and low-value vehicles. This pressure mostly affects general and horizontal classifieds and low-value vehicles. Platforms respond with paid boosts, dealer packages and safer payment and messaging features for private sellers.
New South Wales leads while Queensland grows fastest
| Region | Value, 2025 (USD billion) | Share, 2025 | CAGR, 2026–2035 |
|---|---|---|---|
| New South Wales | 0.92 | 40.2% | 7.01% |
| Victoria | 0.69 | 29.9% | 7.21% |
| Queensland | 0.57 | 24.7% | 7.71% |
| Remaining States and Territories | 0.12 | 5.2% | 7.61% |
Why does Sydney anchor premium listing spending?
New South Wales held a 40.2% share of 2025 value and grows at 7.01% a year, because Sydney combines the highest property prices with the largest advertiser base. The state had about 8.67 million residents in March 2026, and it carried 64,800 online job advertisements that month, up 6.8% from a year earlier. Sydney Buy listings rose 3% in fiscal 2026, according to REA Group, yet growth in the state is now slower than in Queensland. As a result, yield, rather than volume, drives most new spending in New South Wales.
How do Melbourne listings shape spending in Victoria?
Victoria held a 29.9% share of 2025 value and grows at 7.21% a year, as Melbourne property campaigns and dealer stock support steady spending. Melbourne Buy listings rose 4% in fiscal 2026, according to REA Group, while the state population grew 1.6% to about 7.15 million in the year to March 2026. However, online job advertisements in Victoria rose only 0.4% over the same year, which weighs on employment portal spending. In turn, property and automotive advertising carry most growth in the state through 2035.
What drives the fastest growth in Queensland?
Queensland held a 24.7% share of 2025 value and grows fastest at 7.71% a year, because population, hiring and listings are all rising. The state population grew 1.6% to about 5.74 million in the year to March 2026, according to the Australian Bureau of Statistics. Online job advertisements in Queensland reached 51,800 in March 2026, up 6.5% from a year earlier, while Brisbane listings rose strongly in July 2026, according to REA Group. As a result, property and job platforms are adding more regional campaigns across the state.
Where do western and smaller markets add growth?
Remaining States and Territories held a 5.2% share of 2025 value and grow at 7.61% a year, covering Western Australia, South Australia, Tasmania and the two territories. Western Australia recorded the fastest population growth of any state, 2.1% in the year to March 2026, and its online job advertisements rose 6.3% to 27,800. South Australia added 6.4% more job advertisements over the same year. In turn, rising Perth and Adelaide listings support faster growth than in Sydney and Melbourne.
Takeovers, undertakings and AI ad tiers mark 2025–2026
| Development | Status and market relevance |
|---|---|
| In August 2025, CoStar Group completed its acquisition of Domain after Nine Entertainment backed the scheme with its full holding. | Brought a global owner into property listings |
| In November 2025, REA Group added a video hub to the realestate.com.au app home screen, and it drew 2.9 million views by the end of fiscal 2026. | Expanded premium media options for agents |
| In March 2026, REA Group launched iGUIDE Australia to supply interactive floor plans and property tours. | Added a portal-linked media service |
| In July 2026, Domain filed a Federal Court claim against REA Group over its 9 in 10 marketing line, and REA counterclaimed. | Raised scrutiny of audience claims |
| In August 2026, SEEK reported 14% job ad yield growth for fiscal 2026 as depth adoption rose after its upgraded ad tiers. | Confirmed the shift toward premium job ads |
Search, matching and media tools drive advertiser value
- AI search and matching ranks listings and candidates by fit, which lets platforms charge more for ads that reach the most suitable buyers, renters or applicants.
- Feed and software integrations pull listings automatically from agent property management systems, dealer systems and applicant tracking tools, which cuts manual work for large advertisers.
- Video and virtual tour tools add walkthroughs, floor plans and short videos to listings, which supports premium property packages and longer buyer engagement.
- Data and valuation services turn listing and search activity into price estimates, market reports and lead scores, which agents and dealers buy as subscriptions.
Need a Custom Version of This Report?
Tailor the scope, geography, or segments to your exact requirements.
- Custom geography or segment scope
- Direct access to our analyst team
Vertical leaders defend yield as challengers invest
Competition centers on a few vertical leaders that defend high yields, while challengers invest to win audience and agent loyalty. REA Group leads property listings through realestate.com.au and raises Premiere+ prices each year, while Domain, now owned by CoStar Group, is investing in traffic and agent tools. SEEK leads employment listings and sells Basic, Advanced and Premium ads backed by AI matching, while Indeed competes with SEEK for employer job advertising. CAR Group runs carsales and sells dealer data and workflow tools through Nexgate. Gumtree Australia Markets owns Gumtree, Carsguide and Autotrader, while Facebook Marketplace from Meta Platforms gives private sellers a social alternative. Nine Entertainment exited property listings when it sold its Domain stake. As a result, rivals compete mainly on audience reach, match quality and price.
Which platforms shape Australian listing spending?
| Company | Type | Role in the market |
|---|---|---|
| REA Group | Property listing leader | Runs realestate.com.au with Premiere+ depth listings |
| Domain Holdings Australia | Property challenger | Owned by CoStar Group since August 2025 |
| SEEK Limited | Employment listing leader | Sells Basic, Advanced and Premium AI-matched ads |
| CAR Group | Automotive listing leader | Runs carsales and the Nexgate dealer platform |
| Gumtree Australia Markets | Horizontal and auto operator | Owns Gumtree, Carsguide and Autotrader |
| Indeed Australia | Job search competitor | Competes with SEEK for employer job advertising |
| Meta Platforms | Social marketplace | Runs Facebook Marketplace, an online classified ad platform |
| Nine Entertainment | Former Domain shareholder | Backed the CoStar takeover with its full holding |
Credence Research view on Australian listing platforms
Credence Research's view is that Australian listing platforms will keep growing faster than listing volumes, because vendors, dealers and employers pay more for depth products that deliver better reach and matching. Property remains the largest fee pool, yet the CoStar-backed Domain and the 2026 ACCC undertaking give agents more bargaining power than before. Platforms that turn audience data into valuation, workflow and matching services should gain the most, because those services grow faster than base listings and are harder for social marketplaces to copy.
How the advertiser spending estimate was built
The report uses 2025 as the base year on a calendar basis, and market values come from the Credence Research model. That model draws on listed platform disclosures of yield, listing and audience trends, national population and online job advertisement statistics, new vehicle sales data and regulator releases. Zone growth rates and segment splits are Credence Research estimates built from population, job advertisement and listing data. Sources used are government, statistical agency, regulator, stock exchange and company publications, and no interviews or surveys were used.
Depth products and data services drive growth to 2035
The Australia classifieds portals market is expected to reach USD 4.64 billion by 2035, a 7.28% CAGR during 2026–2035, as property, automotive and job platforms sell more premium placements, data tools and AI matching. Growth should be strongest in portal-linked intelligence services, premium upgrades and Queensland, because these areas gain most from yield-led pricing and regional activity. Platform spending is also likely to track wider digital ad budgets, while flat listing volumes, legal disputes and ACCC oversight could slow price rises.
Frequently Asked Questions
How big is the Australia classifieds portals market?
Which listing vertical earns the most advertiser spending?
Which region leads the market?
How fast did property listing yield grow in fiscal 2026?
What changed in Australian job advertising in fiscal 2026?
Who owns Domain after the 2025 takeover?
Who are the leading companies in the market?
What are the main challenges for listing platforms?
Table of Content
Chapter 1 Market Segmentation
- 1.1 Segmentation Framework
- 1.1.1 Product and Service Classification
- 1.1.2 Application and End-Use Classification
- 1.1.3 Technology and Solution Classification
- 1.1.4 Customer and Distribution Channel Classification
- 1.1.5 Geographic Segmentation
- 1.1.6 Market Segment Definitions and Boundaries
- 1.2 By Solution Type
- 1.2.1 Core Listing Services
- 1.2.2 Premium Visibility Services
- 1.2.3 Portal-Linked Intelligence Services
- 1.3 By End-Use Industry
- 1.3.1 Real Estate Portals
- 1.3.2 Automotive Portals
- 1.3.3 Employment Portals
- 1.3.4 General and Horizontal Classifieds
- 1.4 By Revenue Model
- 1.4.1 Listing Fees
- 1.4.2 Subscription Packages
- 1.4.3 Premium Upgrades and Lead Fees
- 1.4.4 Advertising and Portal-Linked Services
- 1.5 By Sales Channel
- 1.5.1 Direct Account Sales
- 1.5.2 Self-Service Purchasing
- 1.5.3 Agency and Integration Partners
Chapter 2 Introduction
- 2.1 Report Objectives and Scope
- 2.2 Product Definition and Industry Terminology
- 2.3 Market Inclusions and Exclusions
- 2.4 Research Process
- 2.4.1 Primary Research and Expert Interviews
- 2.4.2 Secondary Research and Source Review
- 2.4.3 Top-Down and Bottom-Up Estimation
- 2.4.4 Data Triangulation and Verification
- 2.5 Market Size Measurement Basis
- 2.5.1 2025: USD 2.29 billion → 2035: USD 4.64 billion
- 2.6 Historical and Forecast Reference Periods
- 2.6.1 Historical Period: 2018-2025
- 2.6.2 Base Year: 2025
- 2.6.3 Forecast Period: 2025-2035
- 2.7 Research Assumptions and Limitations
Chapter 3 Executive Summary
- 3.1 Market Snapshot and Key Findings
- 3.2 Base-Year Market Size, 2025
- 3.3 Forecast Market Size, 2035
- 3.4 Revenue and Volume Growth Outlook
- 3.5 Key Demand and Supply Indicators
- 3.6 Leading Market Segments
- 3.7 Fastest-Growing Market Opportunities
- 3.8 Regional Performance Highlights
- 3.9 Technology and Industry Transformation
- 3.10 Competitive Landscape Summary
- 3.11 Analyst View and Strategic Implications
Chapter 4 Australia Classifieds Portals Market Trends and Developments
- 4.1 Historical Industry Development, 2018-2025
- 4.2 Recent Market Trends and Developments
- 4.3 Demand and Customer Behavior Trends
- 4.4 Technology and Product Innovation
- 4.5 Artificial Intelligence, Automation and Digitalization
- 4.6 Local Manufacturing and Supply Chain Realignment
- 4.7 Industry Partnerships, Mergers and Acquisitions
- 4.8 Sustainability and Circular Economy Developments
- 4.9 Government and Private Sector Investment Trends
- 4.10 Emerging Business Models and Commercialization
- 4.11 Industry Developments and Announcements
Chapter 5 Australia Classifieds Portals Market Production, Supply and Demand Analysis
- 5.1 Demand Trend and Consumption Analysis, 2018-2025
- 5.2 Demand Forecast, 2025-2035
- 5.3 Production and Output Trend, 2018-2025
- 5.4 Production and Output Forecast, 2025-2035
- 5.5 Installed Capacity and Capacity Utilization
- 5.6 Company-Wise Production Plants and Statistics
- 5.6.1 Installed Production Capacity
- 5.6.2 Actual Production
- 5.6.3 Planned Capacity and Expansion Targets
- 5.7 Supply Chain Structure and Procurement Trends
- 5.8 Supply-Demand Gap and Bottlenecks
- 5.9 Import Dependence and Sourcing Structure
- 5.10 Contract Manufacturing and Outsourcing
- 5.11 Regional Supply and Demand Concentration
Chapter 6 Australia Classifieds Portals Market Pricing Analysis
- 6.1 Pricing Structure and Measurement
- 6.2 Historical Pricing Trends, 2018-2025
- 6.3 Pricing Outlook, 2025-2035
- 6.4 Average Selling Price and Unit Economics
- 6.5 Pricing by Product and Market Segment
- 6.6 Geographic Pricing Differences
- 6.7 Key Input, Energy, Labor and Logistics Costs
- 6.8 Contract Pricing and Purchasing Models
- 6.9 Pricing Sensitivity and Competitive Positioning
- 6.10 Price, Margin and Profitability Implications
Chapter 7 Australia Classifieds Portals Market Dynamics
- 7.1 Market Growth Drivers
- 7.1.1 Demand-Side Drivers
- 7.1.2 Technology and Innovation Drivers
- 7.1.3 Infrastructure and Investment Drivers
- 7.1.4 Regulatory and Policy Drivers
- 7.2 Market Restraints
- 7.2.1 Cost and Affordability Constraints
- 7.2.2 Technology and Adoption Barriers
- 7.2.3 Supply Chain and Operational Constraints
- 7.3 Market Challenges
- 7.3.1 Competitive Pressure and Margin Erosion
- 7.3.2 Skills, Infrastructure and Implementation Gaps
- 7.4 Emerging Market Opportunities
- 7.5 Market Dynamics Impact and Time-Horizon Assessment
Chapter 8 Australia Classifieds Portals Value Chain Analysis
- 8.1 Industry Value Chain Overview
- 8.2 Upstream Suppliers and Critical Inputs
- 8.3 Technology and Component Providers
- 8.4 Manufacturing or Service Delivery
- 8.5 Distribution, Channel Partners and Integrators
- 8.6 Downstream Applications and End Users
- 8.7 Value Addition and Profit Pools
- 8.8 Vertical Integration and Outsourcing
- 8.9 Supplier Concentration and Risk
- 8.10 Supply Chain Localization and Resilience
Chapter 9 Australia Classifieds Portals Market Regulations and Policies
- 9.1 Relevant Laws, Standards and Compliance Frameworks
- 9.2 Product, Service, Safety and Quality Requirements
- 9.3 Government Policies, Incentives and Subsidies
- 9.4 Imports, Exports and Trade Barriers
- 9.5 Public Procurement and Local Content Requirements
- 9.6 Environmental and Sustainability Compliance
- 9.7 Data Protection, AI and Cybersecurity Compliance
- 9.8 Upcoming Policy Changes and Market Implications
Chapter 10 Australia Classifieds Portals Market Hotspots and Opportunities
- 10.1 Market Opportunity Mapping and Growth Hotspots
- 10.2 High-Growth Applications and Customer Groups
- 10.3 Underserved Markets and White-Space Opportunities
- 10.4 Emerging Technology and Product Opportunities
- 10.5 New Capacity and Investment Hotspots
- 10.6 Market Entry and Expansion Opportunities
- 10.7 Distribution and Partnership Opportunities
- 10.8 Near-Term and Long-Term Commercial Potential
- 10.9 Opportunity Attractiveness and Execution Risks
Chapter 11 Australia Classifieds Portals Market Outlook, 2025-2035
- 11.1 Market Size and Analysis
- 11.1.1 Revenue (Market Measurement: 2025: USD 2.29 billion → 2035: USD 4.64 billion)
- 11.1.2 Market Volume and Quantity Sold
- 11.1.3 Historical Market Size, 2018-2025
- 11.1.4 Base-Year Market Size, 2025
- 11.2 Market Forecast, 2025-2035
- 11.2.1 Revenue Forecast to 2035
- 11.2.2 Volume Forecast to 2035
- 11.2.3 CAGR and Year-on-Year Growth
- 11.2.4 Incremental Revenue Opportunity
- 11.3 Forecast Assumptions and Scenario Analysis
- 11.3.1 Base-Case Forecast
- 11.3.2 Optimistic and Conservative Scenarios
- 11.3.3 Technology, Pricing and Policy Sensitivities
- 11.4 Market Attractiveness and Growth Outlook
Chapter 12 Australia Classifieds Portals Market Segmentation and Outlook
- 12.1 Segmentation Summary and Market Shares, 2025
- 12.2 Largest and Fastest-Growing Segments
- 12.3 By Solution Type - Market Size and Forecast, 2025-2035
- 12.3.1 Segment Definition and Scope
- 12.3.2 Historical Market Size, 2018-2025
- 12.3.3 Revenue Forecast, 2025-2035
- 12.3.4 Volume Forecast, 2025-2035
- 12.3.5 Base-Year Market Share, 2025
- 12.3.6 Segment CAGR and Growth Drivers
- 12.3.7 Subsegment Market Size and Forecast
- 12.3.7.1 Core Listing Services
- 12.3.7.2 Premium Visibility Services
- 12.3.7.3 Portal-Linked Intelligence Services
- 12.3.8 Subsegment Pricing and Adoption Trends
- 12.3.9 Leading Suppliers and Competition
- 12.3.10 Regional Demand and Opportunities
- 12.4 By End-Use Industry - Market Size and Forecast, 2025-2035
- 12.4.1 Segment Definition and Scope
- 12.4.2 Historical Market Size, 2018-2025
- 12.4.3 Revenue Forecast, 2025-2035
- 12.4.4 Volume Forecast, 2025-2035
- 12.4.5 Base-Year Market Share, 2025
- 12.4.6 Segment CAGR and Growth Drivers
- 12.4.7 Subsegment Market Size and Forecast
- 12.4.7.1 Real Estate Portals
- 12.4.7.2 Automotive Portals
- 12.4.7.3 Employment Portals
- 12.4.7.4 General and Horizontal Classifieds
- 12.4.8 Subsegment Pricing and Adoption Trends
- 12.4.9 Leading Suppliers and Competition
- 12.4.10 Regional Demand and Opportunities
- 12.5 By Revenue Model - Market Size and Forecast, 2025-2035
- 12.5.1 Segment Definition and Scope
- 12.5.2 Historical Market Size, 2018-2025
- 12.5.3 Revenue Forecast, 2025-2035
- 12.5.4 Volume Forecast, 2025-2035
- 12.5.5 Base-Year Market Share, 2025
- 12.5.6 Segment CAGR and Growth Drivers
- 12.5.7 Subsegment Market Size and Forecast
- 12.5.7.1 Listing Fees
- 12.5.7.2 Subscription Packages
- 12.5.7.3 Premium Upgrades and Lead Fees
- 12.5.7.4 Advertising and Portal-Linked Services
- 12.5.8 Subsegment Pricing and Adoption Trends
- 12.5.9 Leading Suppliers and Competition
- 12.5.10 Regional Demand and Opportunities
- 12.6 By Sales Channel - Market Size and Forecast, 2025-2035
- 12.6.1 Segment Definition and Scope
- 12.6.2 Historical Market Size, 2018-2025
- 12.6.3 Revenue Forecast, 2025-2035
- 12.6.4 Volume Forecast, 2025-2035
- 12.6.5 Base-Year Market Share, 2025
- 12.6.6 Segment CAGR and Growth Drivers
- 12.6.7 Subsegment Market Size and Forecast
- 12.6.7.1 Direct Account Sales
- 12.6.7.2 Self-Service Purchasing
- 12.6.7.3 Agency and Integration Partners
- 12.6.8 Subsegment Pricing and Adoption Trends
- 12.6.9 Leading Suppliers and Competition
- 12.6.10 Regional Demand and Opportunities
- 12.7 Segment Growth Comparison
- 12.8 Segment Attractiveness and Priority Matrix
Chapter 13 Australia Classifieds Portals End-Use and Application Market Outlook
- 13.1 End-Use Industry and Customer Demand Structure
- 13.2 Leading Applications and Customer Groups
- 13.3 End-Use Market Size, Share and Forecast
- 13.4 Major End-Use Industry Deep Dives
- 13.4.1 Customer Requirements and Use Cases
- 13.4.2 Demand and Replacement Cycles
- 13.4.3 Technical and Regulatory Considerations
- 13.4.4 Purchasing and Procurement Models
- 13.4.5 Leading Vendors and Distribution Channels
- 13.4.6 Forecast and Commercial Opportunities
- 13.5 Emerging Applications and Cross-Segment Demand
- 13.6 End-Use Industry Investment Priorities
Chapter 14 Australia Classifieds Portals Geographic Market Outlook, 2025-2035
- 14.1 Domestic Market Distribution and Demand Clusters
- 14.2 State- or Province-Wise Market Size and Forecast, 2025-2035
- 14.3 City and Metropolitan Market Outlook
- 14.4 Industrial, Manufacturing and Commercial Clusters
- 14.5 Geographic Concentration of Key End Users
- 14.6 Local Pricing and Purchasing Differences
- 14.7 Domestic Production Facilities and Capacity Map
- 14.8 Local Infrastructure and Project Pipeline
- 14.9 State-Level Policy and Incentive Differences
- 14.10 Subnational Investment Hotspots and Opportunities
- 14.11 Distribution and Logistics Networks
- 14.12 Domestic Competitive Footprint
Chapter 15 Australia Classifieds Portals Technology, Innovation and Sustainability Outlook
- 15.1 Technology Landscape and Maturity
- 15.2 Product, Process and Service Innovation
- 15.3 AI, Automation and Digital Tools in the Industry
- 15.4 Technology Adoption and Performance Benchmarking
- 15.5 Innovation Pipeline and R&D Investment
- 15.6 Patent and Intellectual Property Trends
- 15.7 Energy Efficiency and Resource Management
- 15.8 Sustainability, Recycling and Circularity
- 15.9 Technology Roadmap, 2025-2035
- 15.10 Risks of Obsolescence and Technology Substitution
Chapter 16 Australia Classifieds Portals Market Key Strategic Imperatives
- 16.1 Growth and Market Entry Priorities
- 16.2 High-Return Products and Segments
- 16.3 Pricing, Profitability and Cost Optimization
- 16.4 Technology Investment and Product Differentiation
- 16.5 Supply Chain Localization and Resilience
- 16.6 Distribution and Customer Acquisition
- 16.7 Partnership, Acquisition and Capacity Strategy
- 16.8 Regional Expansion Priorities
- 16.9 Short-, Medium- and Long-Term Actions
Chapter 17 Competition Outlook
- 17.1 Industry Competition Characteristics
- 17.2 Market Structure and Concentration
- 17.3 Market Share and Competitive Positioning, 2025
- 17.4 Company-Wise Revenue and Product Benchmarking
- 17.5 Production and Service Capacity Benchmarking
- 17.6 Technology, Pricing and Differentiation
- 17.7 Regional Footprint and Distribution Strength
- 17.8 Mergers, Acquisitions and Strategic Alliances
- 17.9 New Entrants and Competitive Threats
- 17.10 Porter's Five Forces and Industry Attractiveness
- 17.11 Competitive Outlook, 2025-2035
Chapter 18 Company Profiles
- 18.1 Company Coverage and Selection Criteria
- 18.2 REA Group
- 18.2.1 Business Description
- 18.2.2 Company Ownership and Geographic Presence
- 18.2.3 Product and Service Portfolio
- 18.2.4 Manufacturing and Operating Footprint
- 18.2.5 Production Capacity and Expansion Plans
- 18.2.6 Financial Performance and Investment
- 18.2.7 Market Share and Competitive Position
- 18.2.8 Technology and Innovation Capabilities
- 18.2.9 Strategic Alliances or Partnerships
- 18.2.10 Recent Developments
- 18.2.11 Growth Strategy and Outlook
- 18.3 SEEK Limited
- 18.4 CAR Group
- 18.5 Domain Holdings Australia
- 18.6 Indeed Australia
- 18.7 Gumtree Australia Markets
- 18.8 Meta Platforms
- 18.9 Nine Entertainment
- 18.10 eBay Australia
- 18.11 Adzuna
- 18.12 Other Relevant Market Participants
Note: Every listed company is profiled on the structure shown under the first company. The company list is preliminary and may change based on research findings, market developments, data availability and client requirements.
Chapter 19 Disclaimer
- 19.1 Research and Forecast Disclaimer
- 19.2 Data Source and Estimation Limitations
Note: The depth of individual sections depends on data availability for this market. Volume, capacity, trade and other unit-based metrics are included where applicable.

