
Deficiency care and aging shape regional demand
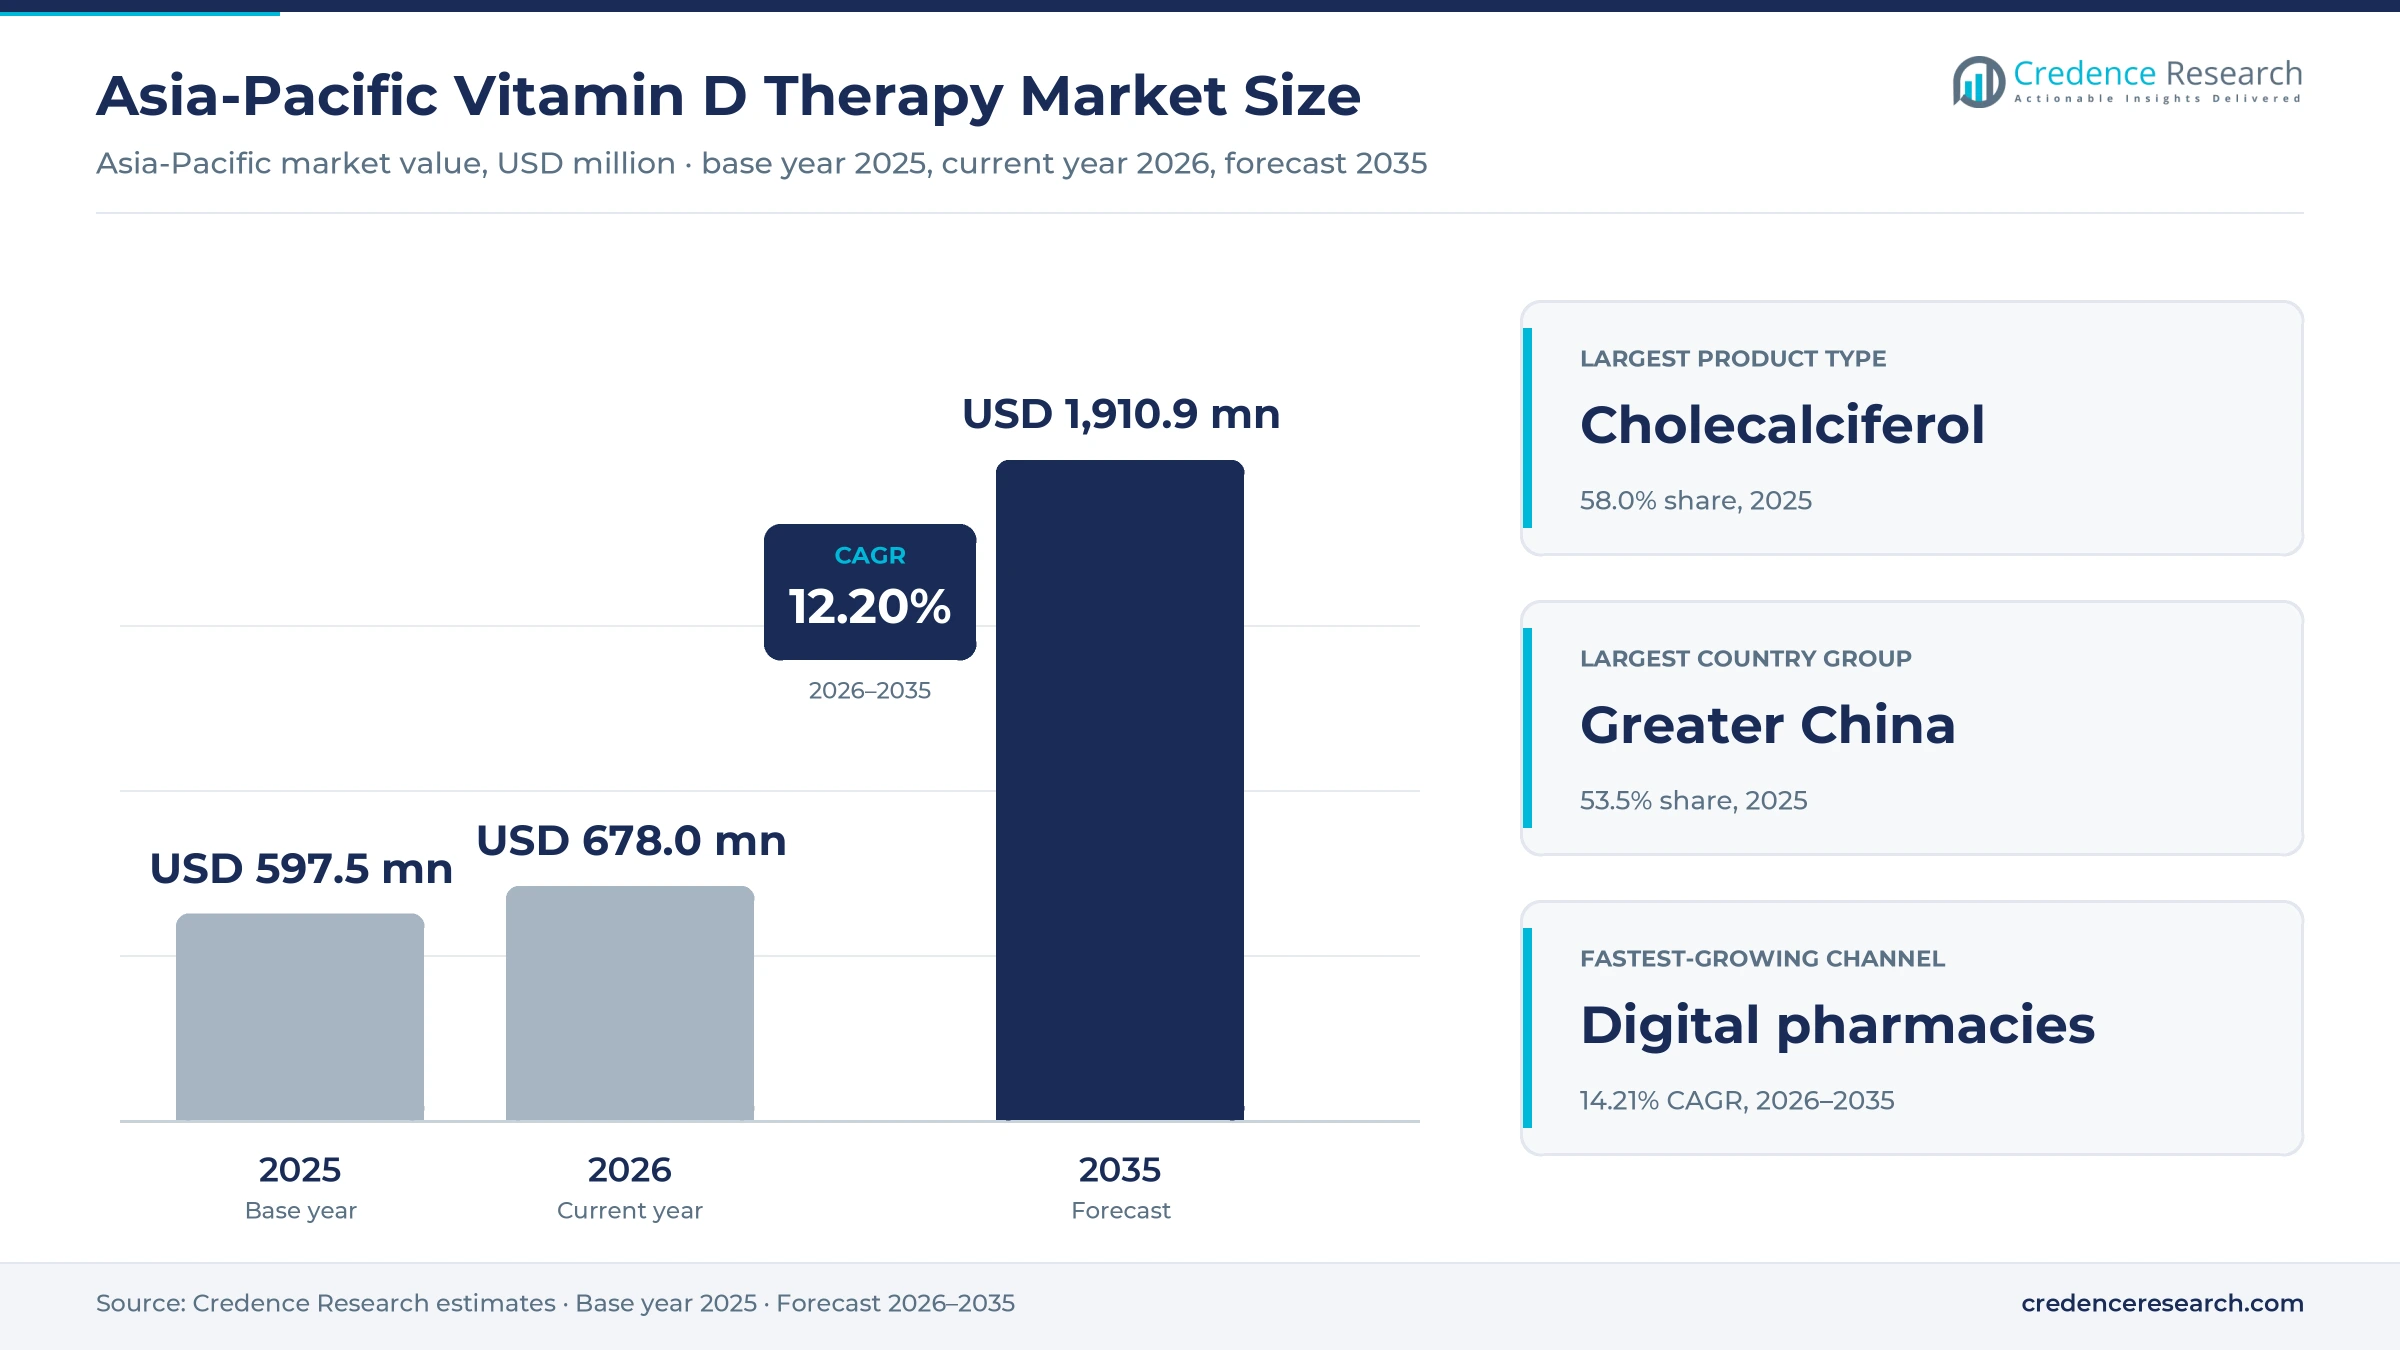
The Asia-Pacific vitamin D therapy market was valued at USD 597.5 million in 2025 and is projected to increase from USD 678.0 million in 2026 to USD 1.91 billion by 2035, registering a CAGR of 12.20% during 2026–2035. Demand comes from physicians who correct deficiency in bone, renal and pediatric patients, and from adults who buy maintenance doses at pharmacies. Greater China held the largest share, 53.5% in 2025, because its large aging population and heavy kidney disease burden support steady prescription use. India is the fastest-growing country at 14.08% a year, as low-cost weekly sachets and capsules reach more patients through community and online pharmacies. The main commercial change is the spread of digital pharmacies, which China brought under real-name and prescription verification rules in December 2022. Product development is also moving toward drops, gummies and water-dispersible liquids, after India's drug regulator approved a nano-carrier oral dispersion in August 2026.
Which products and buyers does the estimate cover?
The estimate measures the value of vitamin D products used to prevent or correct deficiency and to manage bone and mineral disorders in Asia-Pacific. It covers cholecalciferol, ergocalciferol and active metabolites and precursors such as calcitriol, alfacalcidol, eldecalcitol and calcifediol, sold as tablets, capsules, drops, sachets and injections.
The estimate excludes fortified foods, infant formula, animal feed premixes and multivitamins in which vitamin D is a minor ingredient. The value chain runs from active ingredient producers and formulators through distributors to community, hospital and digital pharmacies, which serve physicians, nephrologists, pediatricians and self-pay buyers.
Asia-Pacific Vitamin D Therapy Market Insights
- The Asia-Pacific vitamin D therapy market was valued at USD 597.5 million in 2025 and is projected to reach USD 1.91 billion by 2035, registering a CAGR of 12.20% during 2026–2035.
- Greater China held a 53.5% share of 2025 value, because its large aging population and kidney disease burden support steady prescription use.
- Cholecalciferol led with a 58.0% share of 2025 value, because weekly 60,000 IU sachets and capsules remain the standard correction regimen in India.
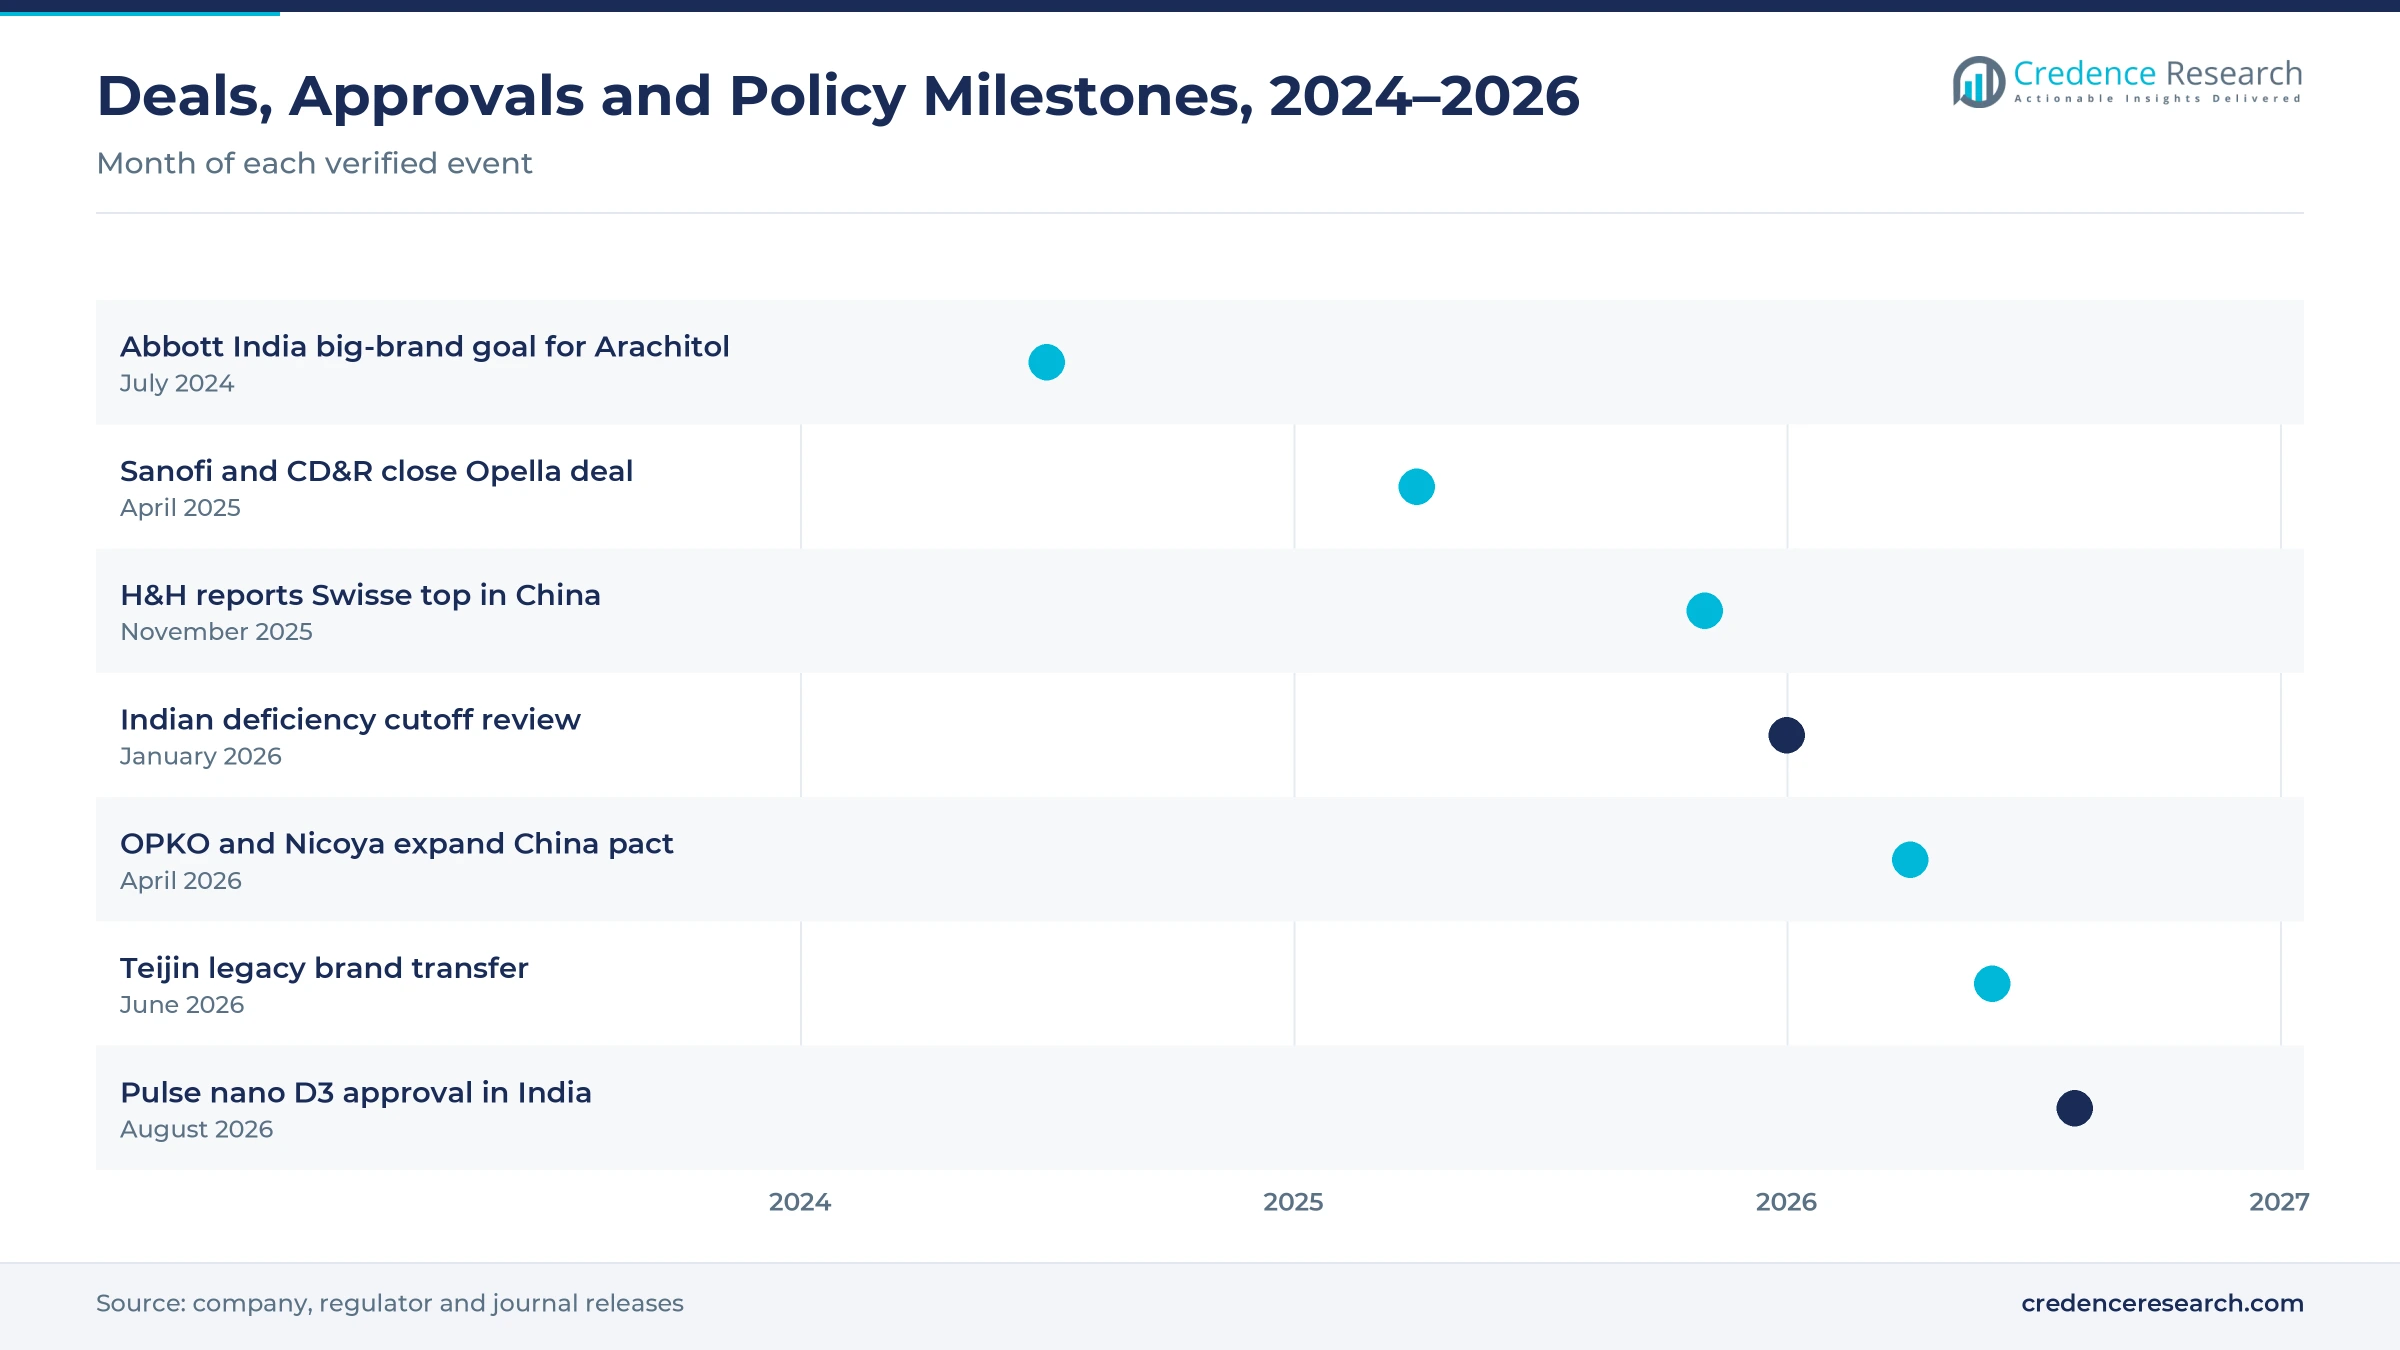
- India's drug regulator approved a nano-carrier vitamin D3 oral dispersion from Pulse Pharmaceuticals in August 2026, which widens the range of liquid formats.
- Digital pharmacies grow fastest at 14.21% a year during 2026–2035, as repeat refills move online under prescription verification rules.
Cholecalciferol leads as renal care grows fastest
Why does cholecalciferol hold the largest value?
Based on product type, the market is categorized into cholecalciferol, ergocalciferol and active metabolites and precursors. Cholecalciferol led with a 58.0% share of 2025 value, because physicians use it as the first-line molecule for loading and maintenance doses. Cholecalciferol also grows fastest at 12.60% a year, as low-cost weekly formats reach more self-pay buyers in India and Southeast Asia.
Which clinical uses account for the most spending?
Based on application, the market is categorized into osteoporosis and bone health, rickets and nutritional deficiency, renal mineral and bone disorders, and specialty deficiency management. Osteoporosis and Bone Health led with a 44.0% share of 2025 value, because older adults take vitamin D alongside fracture prevention. Renal Mineral and Bone Disorders grow fastest at 12.96% a year, as kidney disease and dialysis populations rise in China and Japan.
How are liquid formats changing the product mix?
Based on dosage form, the market is categorized into tablets and capsules, oral drops and solutions, sachets and granules, and injectables and ampoules. Tablets and Capsules led with a 52.0% share of 2025 value, because softgels and tablets suit both weekly loading and daily maintenance. Oral Drops and Solutions grow fastest at 12.92% a year, as nano drops and water-dispersible liquids improve adherence in children and older patients.
Where do patients buy their vitamin D?
Based on distribution channel, the market is categorized into community pharmacies, hospital pharmacies and digital pharmacies. Community Pharmacies led with a 56.0% share of 2025 value, because most prescriptions and self-pay purchases are filled close to home. Digital Pharmacies grow fastest at 14.21% a year, as monthly refills move to home delivery in China and India.
| Segment Group | Leading Sub-segment | Share, 2025 | Fastest-growing Sub-segment | CAGR, 2026–2035 |
|---|---|---|---|---|
| By Product Type | Cholecalciferol | 58.0% | Cholecalciferol | 12.60% |
| By Application | Osteoporosis and Bone Health | 44.0% | Renal Mineral and Bone Disorders | 12.96% |
| By Dosage Form | Tablets and Capsules | 52.0% | Oral Drops and Solutions | 12.92% |
| By Distribution Channel | Community Pharmacies | 56.0% | Digital Pharmacies | 14.21% |
Request a Free Sample
Fill in your details and we'll send you a free sample report.
- Sample data tables & charts
- Research methodology
Deficiency care, aging and renal disease lift demand
Why does clinically guided deficiency correction lift demand?
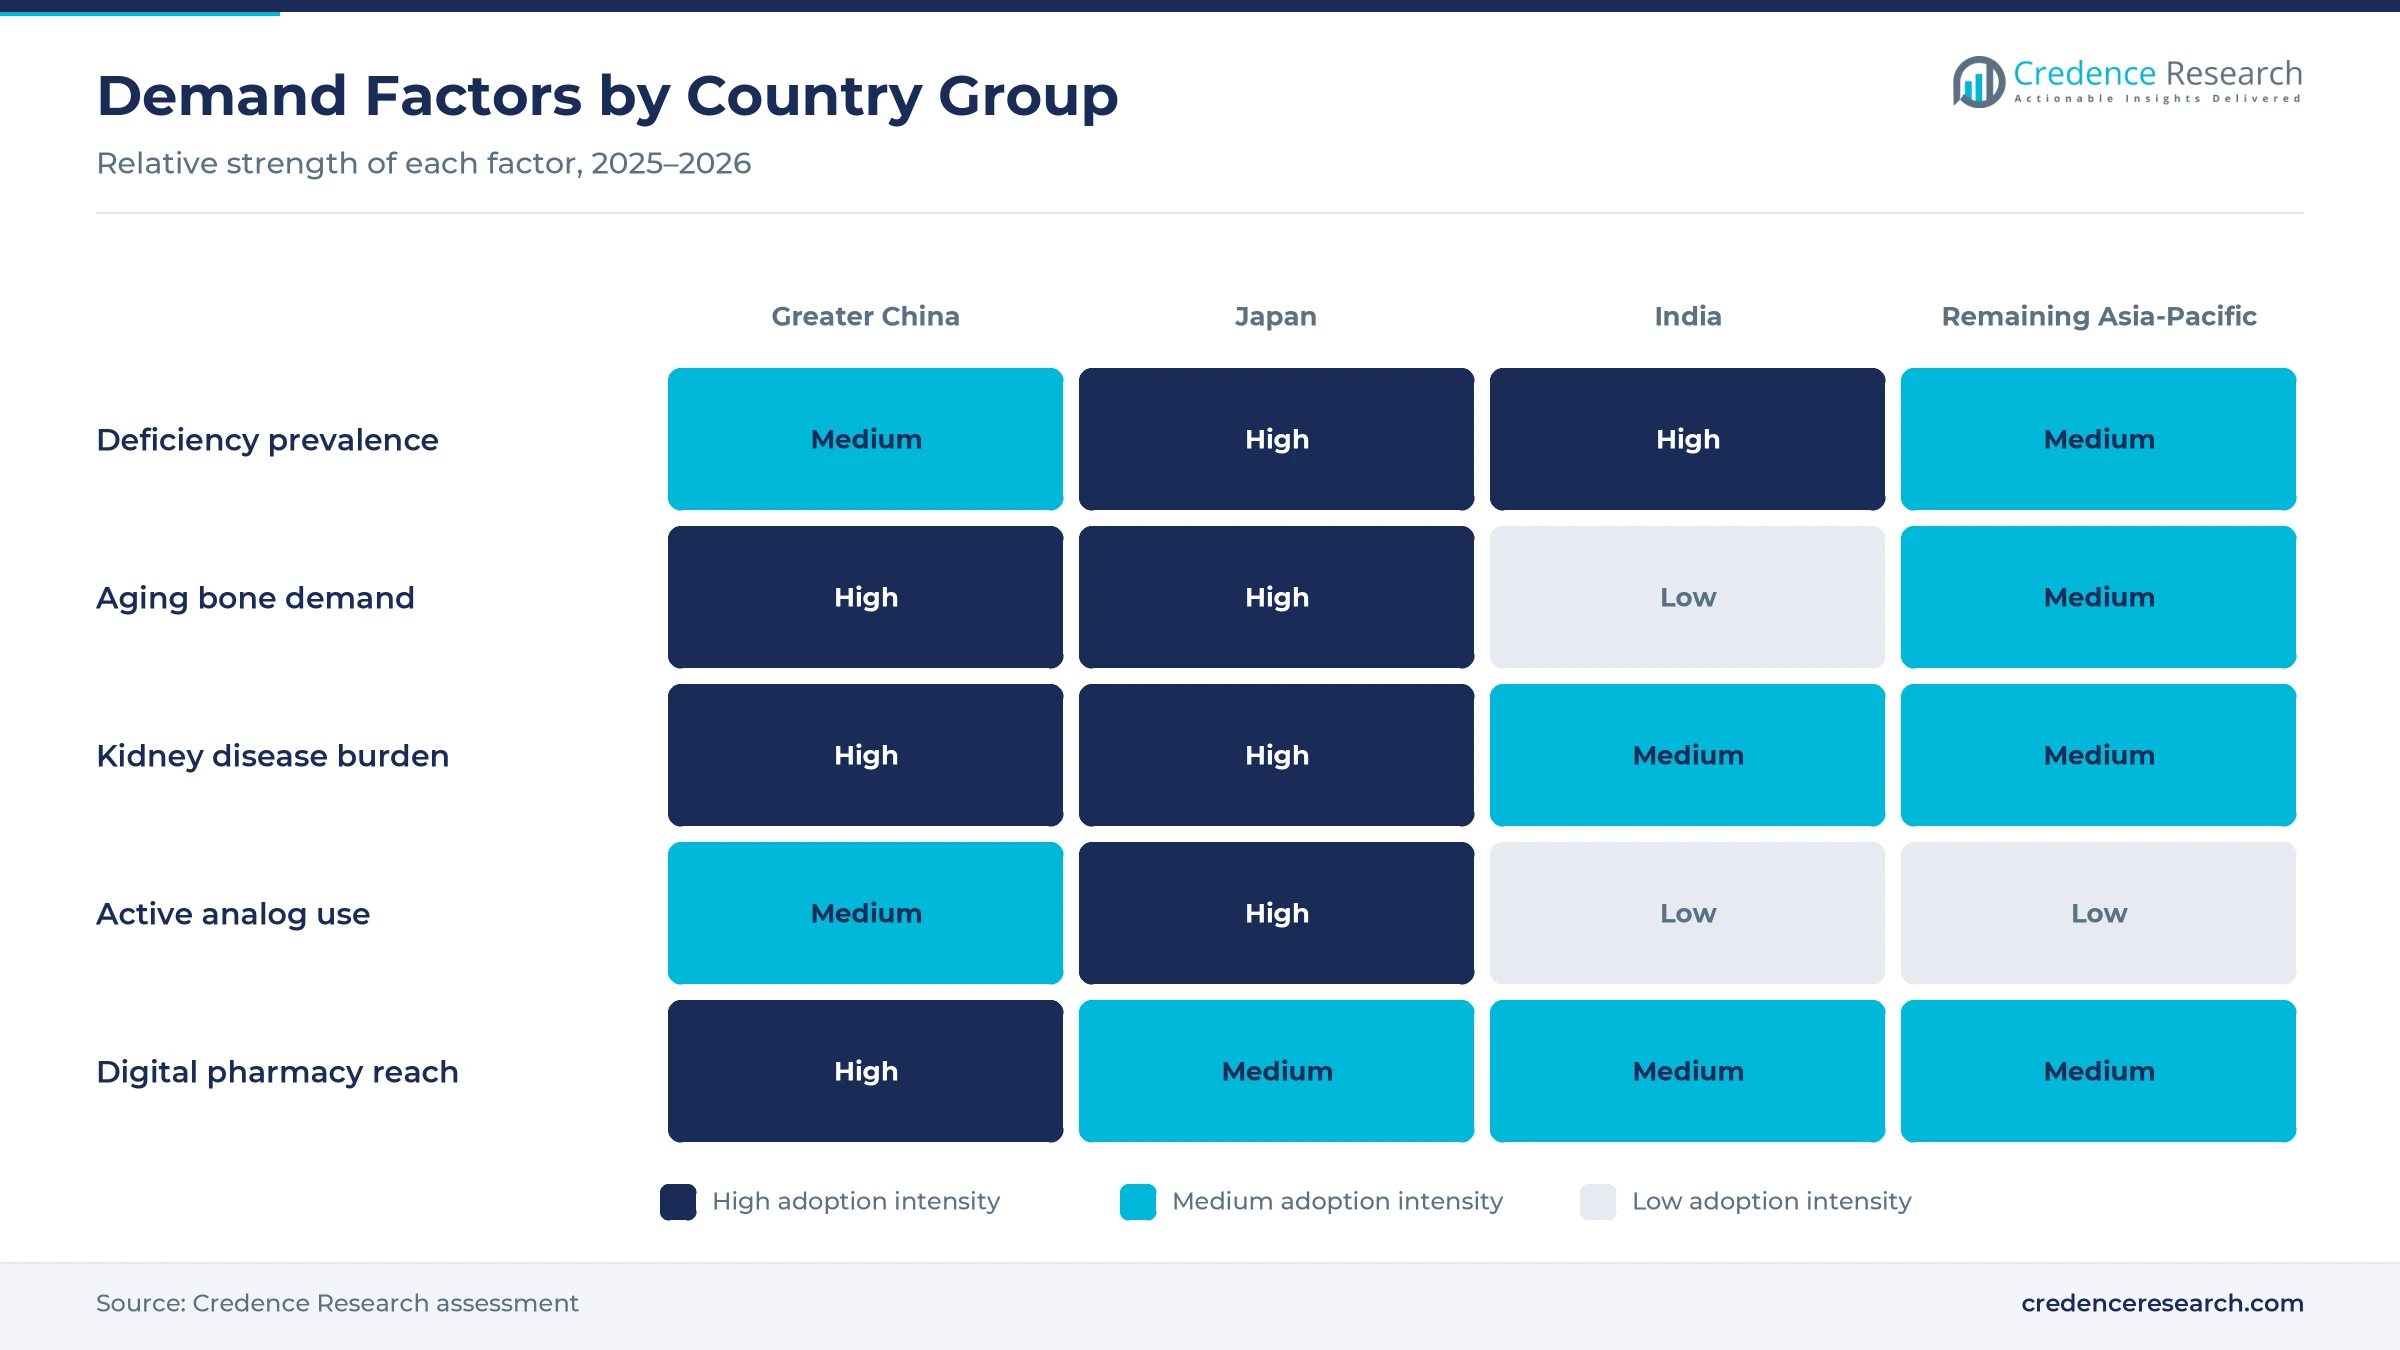
Physicians across the region now test and treat low vitamin D status within routine bone, renal and pediatric care, which turns a very large deficient population into prescriptions and repeat purchases. A January 2026 systematic review of 45 Indian studies with about 80,000 participants found deficiency rates between 40% and 90%, with a pooled estimate of 67%, according to a review in Cureus. The same review argued that India needs population-specific cutoffs, which steers treatment toward clinically confirmed cases. In Japan, Jikei University researchers found that 98% of 5,518 Tokyo health checkup participants fell below the 30 ng/mL threshold used by national endocrine and orthopedic societies. As a result, cholecalciferol holds 58.0% of 2025 value, because it remains the first-line correction molecule.
How does geriatric bone and mineral care widen use?
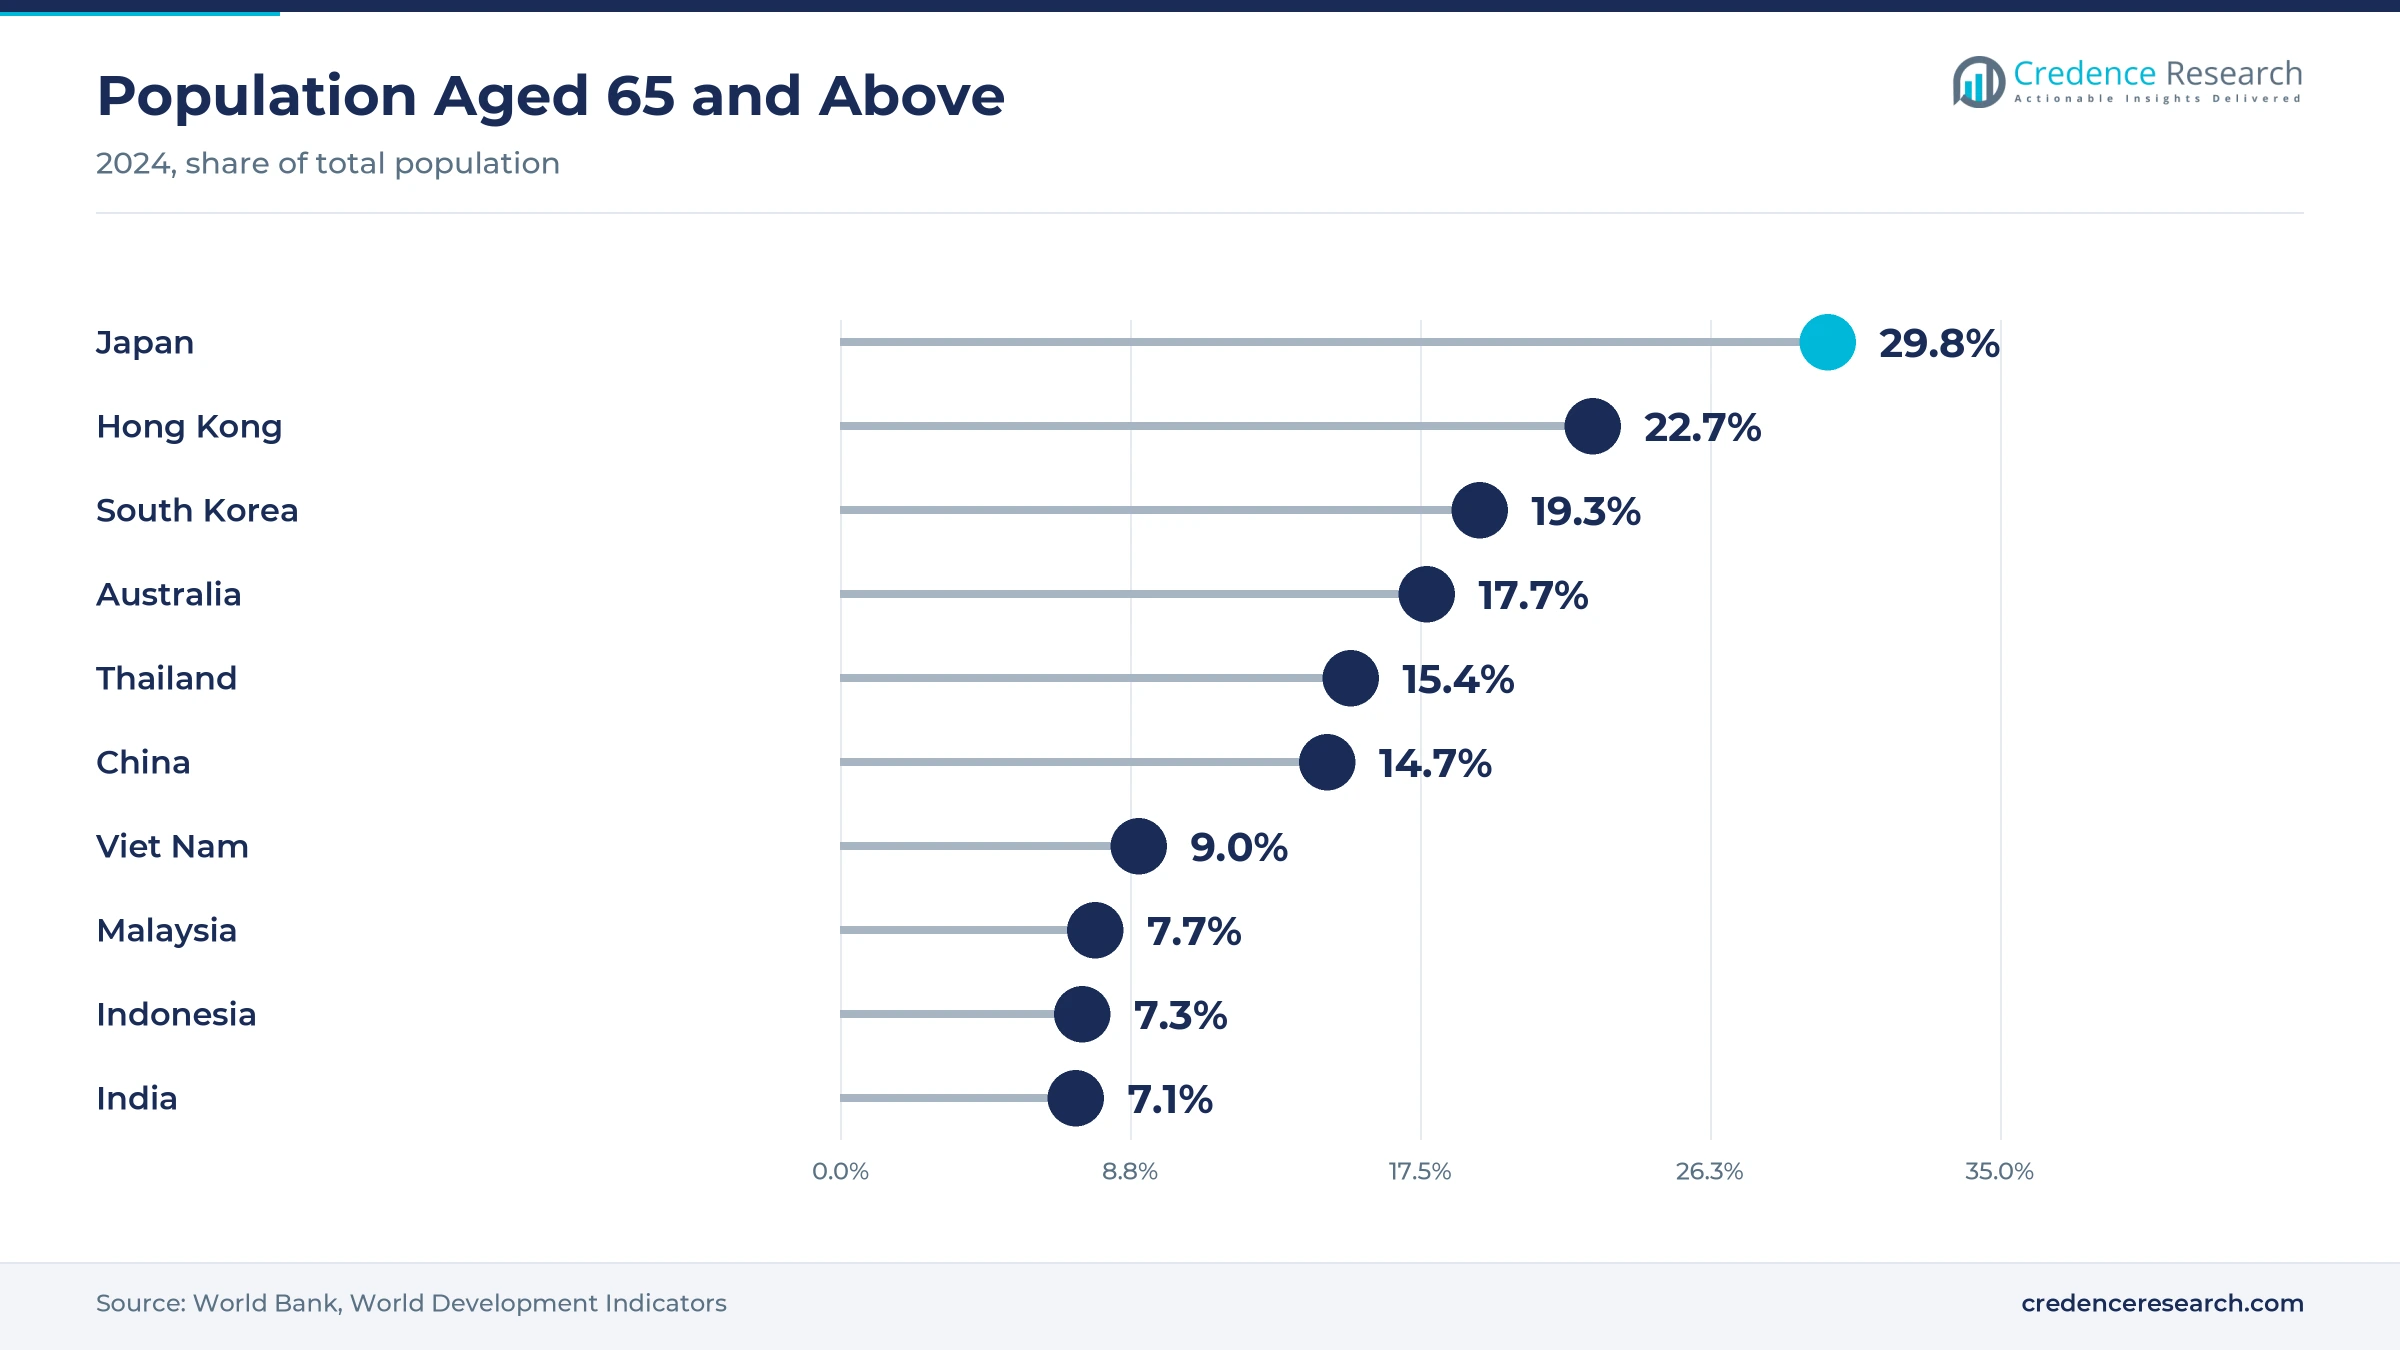
Older adults make and absorb less vitamin D, and physicians pair correction with fracture prevention, so aging lifts both prescription volume and the use of active analogs. Japan had 29.8% of its population aged 65 and above in 2024, while China had 14.7% and South Korea had 19.3%, according to the World Bank. A community cohort of 19,848 Chinese adults published in February 2023 put age-standardized osteoporosis prevalence at 33.49%. Chugai's eldecalcitol, sold as Edirol, won Chinese approval in December 2020 and reached Chinese patients by July 2022 with support from Roche China. In turn, osteoporosis and bone health holds 44.0% of 2025 value, as clinicians combine vitamin D with osteoporosis drugs for older patients.
Why do established correction and maintenance formats sustain sales?
Low-cost, high-dose formats let physicians correct deficiency within weeks and then move patients to maintenance doses, which keeps repeat purchases steady in community pharmacies. Cadila Pharmaceuticals sells its Calcirol 60,000 IU cholecalciferol sachet at a listed maximum retail price of INR 36.53, according to a PharmEasy product listing. Alkem Laboratories markets Uprise-D3 in the same 60,000 IU sachet strength, while Cipla and Sun Pharmaceutical sell 60,000 IU capsules under the Cipcal D3 and D Well AQ brands. Abbott India supplies Arachitol ampoules with 300,000 IU per milliliter for injection by a doctor or nurse in clinics. As a result, tablets and capsules hold 52.0% of 2025 value, because softgels and tablets suit weekly loading and daily maintenance.
How does renal mineral and bone disease add demand?
Damaged kidneys cannot convert vitamin D into its active hormone, so nephrologists prescribe calcitriol, alfacalcidol and related agents to control secondary hyperparathyroidism. A national survey of 176,874 adults put chronic kidney disease prevalence in mainland China at 8.2%, or about 82 million adults, in 2018 to 2019, according to JAMA Internal Medicine. Japan counted 347,474 chronic dialysis patients at the end of 2022, with a mean age of 69.87 years, based on the Japanese Society for Dialysis Therapy registry. OPKO Health also expanded its Greater China agreement with Nicoya for extended-release calcifediol on April 30, 2026, citing more than 20 million Chinese adults with stage 3 or 4 disease. In turn, renal mineral and bone disorders grow fastest at 12.96% a year, as more patients start kidney disease drugs.
Digital pharmacies and liquid formats gain ground
How is the shift to digital pharmacies changing access?
Online channels are taking a larger part of repeat purchases, because deficiency correction involves predictable monthly refills that suit home delivery. China's market regulator and drug regulator put online drug sale rules into force on Dec. 1, 2022, requiring real-name purchases and prescription checks before prescription drugs can be bought. H&H Group reported on Nov. 18, 2025, that its cross-border e-commerce sales rose 23.1% in the first nine months of the year, while Swisse kept its top position in China's vitamin, herbal and mineral supplement market. As a result, digital pharmacies grow fastest at 14.21% a year, as online pharmacies add verified prescription workflows.
Why is the rise of nano and liquid formats notable?
Makers are moving beyond plain tablets toward drops, gummies and water-dispersible liquids that improve adherence among children and older patients who struggle with capsules. Pulse Pharmaceuticals said in August 2026 that India's drug regulator had approved its nano-carrier entrapped vitamin D3 oral dispersion, and the company cited studies showing 50% to 60% higher serum levels than conventional formulations. Abbott India launched Arachitol Gummies with 300 IU during fiscal 2023-24, alongside its existing oral solution and drops. The gummies are approved as a health supplement by India's food safety regulator and are marketed to both children and adults. Pulse Pharmaceuticals also said it has worked in nano drug delivery since 2010 and is preparing a U.S. FDA application. In turn, oral drops and solutions grow fastest at 12.92% a year during 2026–2035.
Can pediatric deficiency programs open new demand?
Child and adolescent deficiency remains common in India, which leaves room for drops, chewables and school-age correction programs that pediatricians can prescribe. The Comprehensive National Nutrition Survey for 2016–18 found deficiency in 13.7% of children aged 1 to 4, 18.2% of children aged 5 to 9 and 23.9% of adolescents aged 10 to 19, according to UNICEF. The Indian Council of Medical Research has recommended 400 IU a day for Indians with minimal sun exposure since 2010, which gives pediatricians a simple maintenance target. These figures point to a large group of children that self-pay buyers and public programs have not yet reached. As a result, India holds 10.1% of 2025 value, and pediatric formats can lift that share as they spread beyond the largest cities.
Is consumer health consolidation an opening for maintenance brands?
Large owners are investing in vitamin brands that sell maintenance doses through pharmacies and online stores, which opens room for wider regional distribution. Kirin Holdings completed its acquisition of Australian vitamin maker Blackmores in August 2023, and the shares left the Australian Securities Exchange on Aug. 10, 2023, as Kirin targeted health science growth in Japan and Asia-Pacific. Sanofi and CD&R closed the Opella transaction on April 30, 2025, creating a consumer health company that operates in 100 countries. Sanofi said Opella ranks third worldwide in over-the-counter products and vitamins, minerals and supplements. In turn, the remaining Asia-Pacific countries hold 24.5% of 2025 value, where bone health supplements sell through large pharmacy chains.
Testing limits, low prices and misuse risks weigh
Why does testing restraint slow new diagnoses?
Payers worry that routine screening adds cost without better outcomes, so some health systems limit who can be tested. Australia's Medicare has funded serum vitamin D testing since Nov. 1, 2014, only for set risk groups such as osteoporosis symptoms, chronic renal failure and limited sun exposure, according to the Medicare Benefits Schedule. The Medical Journal of Australia noted that a test costs A$30.05, while basic supplementation costs about A$2.25 a month. As a result, fewer low-risk adults receive a formal diagnosis, and suppliers focus on renal, bone and pediatric specialists.
How do low retail prices squeeze Indian margins?
Indian vitamin D brands compete in a crowded generic field, where many makers sell the same 60,000 IU strength at low prices. An Arachitol ampoule with 300,000 IU per milliliter lists at INR 60.60 on Indian e-commerce sites, which shows how little room makers have for price increases. In turn, smaller brands struggle to fund physician outreach and quality upgrades. Larger makers respond with differentiated formats, such as nano drops, gummies and flavored sachets that command higher prices.
Why does high-dose misuse raise safety concerns?
High-strength sachets and injections are easy to buy, and some patients take them more often than prescribed, which can raise blood calcium to harmful levels. Product listings for 60,000 IU sachets state that the dose is not meant for daily use, yet self-pay buyers do not always follow that guidance. As a result, regulators and physicians watch for toxicity reports that could tighten sales rules. Makers respond with clearer labels, pharmacist counseling and lower-dose daily maintenance products.
How do Japanese price cuts reshape older portfolios?
Japan's national drug price list pays very little for older active vitamin D tablets, which reduces the incentive to promote them. Teijin Pharma's Onealfa alfacalcidol 1.0 microgram tablet lists at 9.8 yen, based on a Japanese drug database. Teijin announced an agreement in June 2026 to transfer seven legacy brands, including Feburic and the osteoporosis drug Bonalon, to LTL Pharma, as it shifts toward rare diseases. In turn, older products move to specialist owners, while makers promote newer analogs such as eldecalcitol.
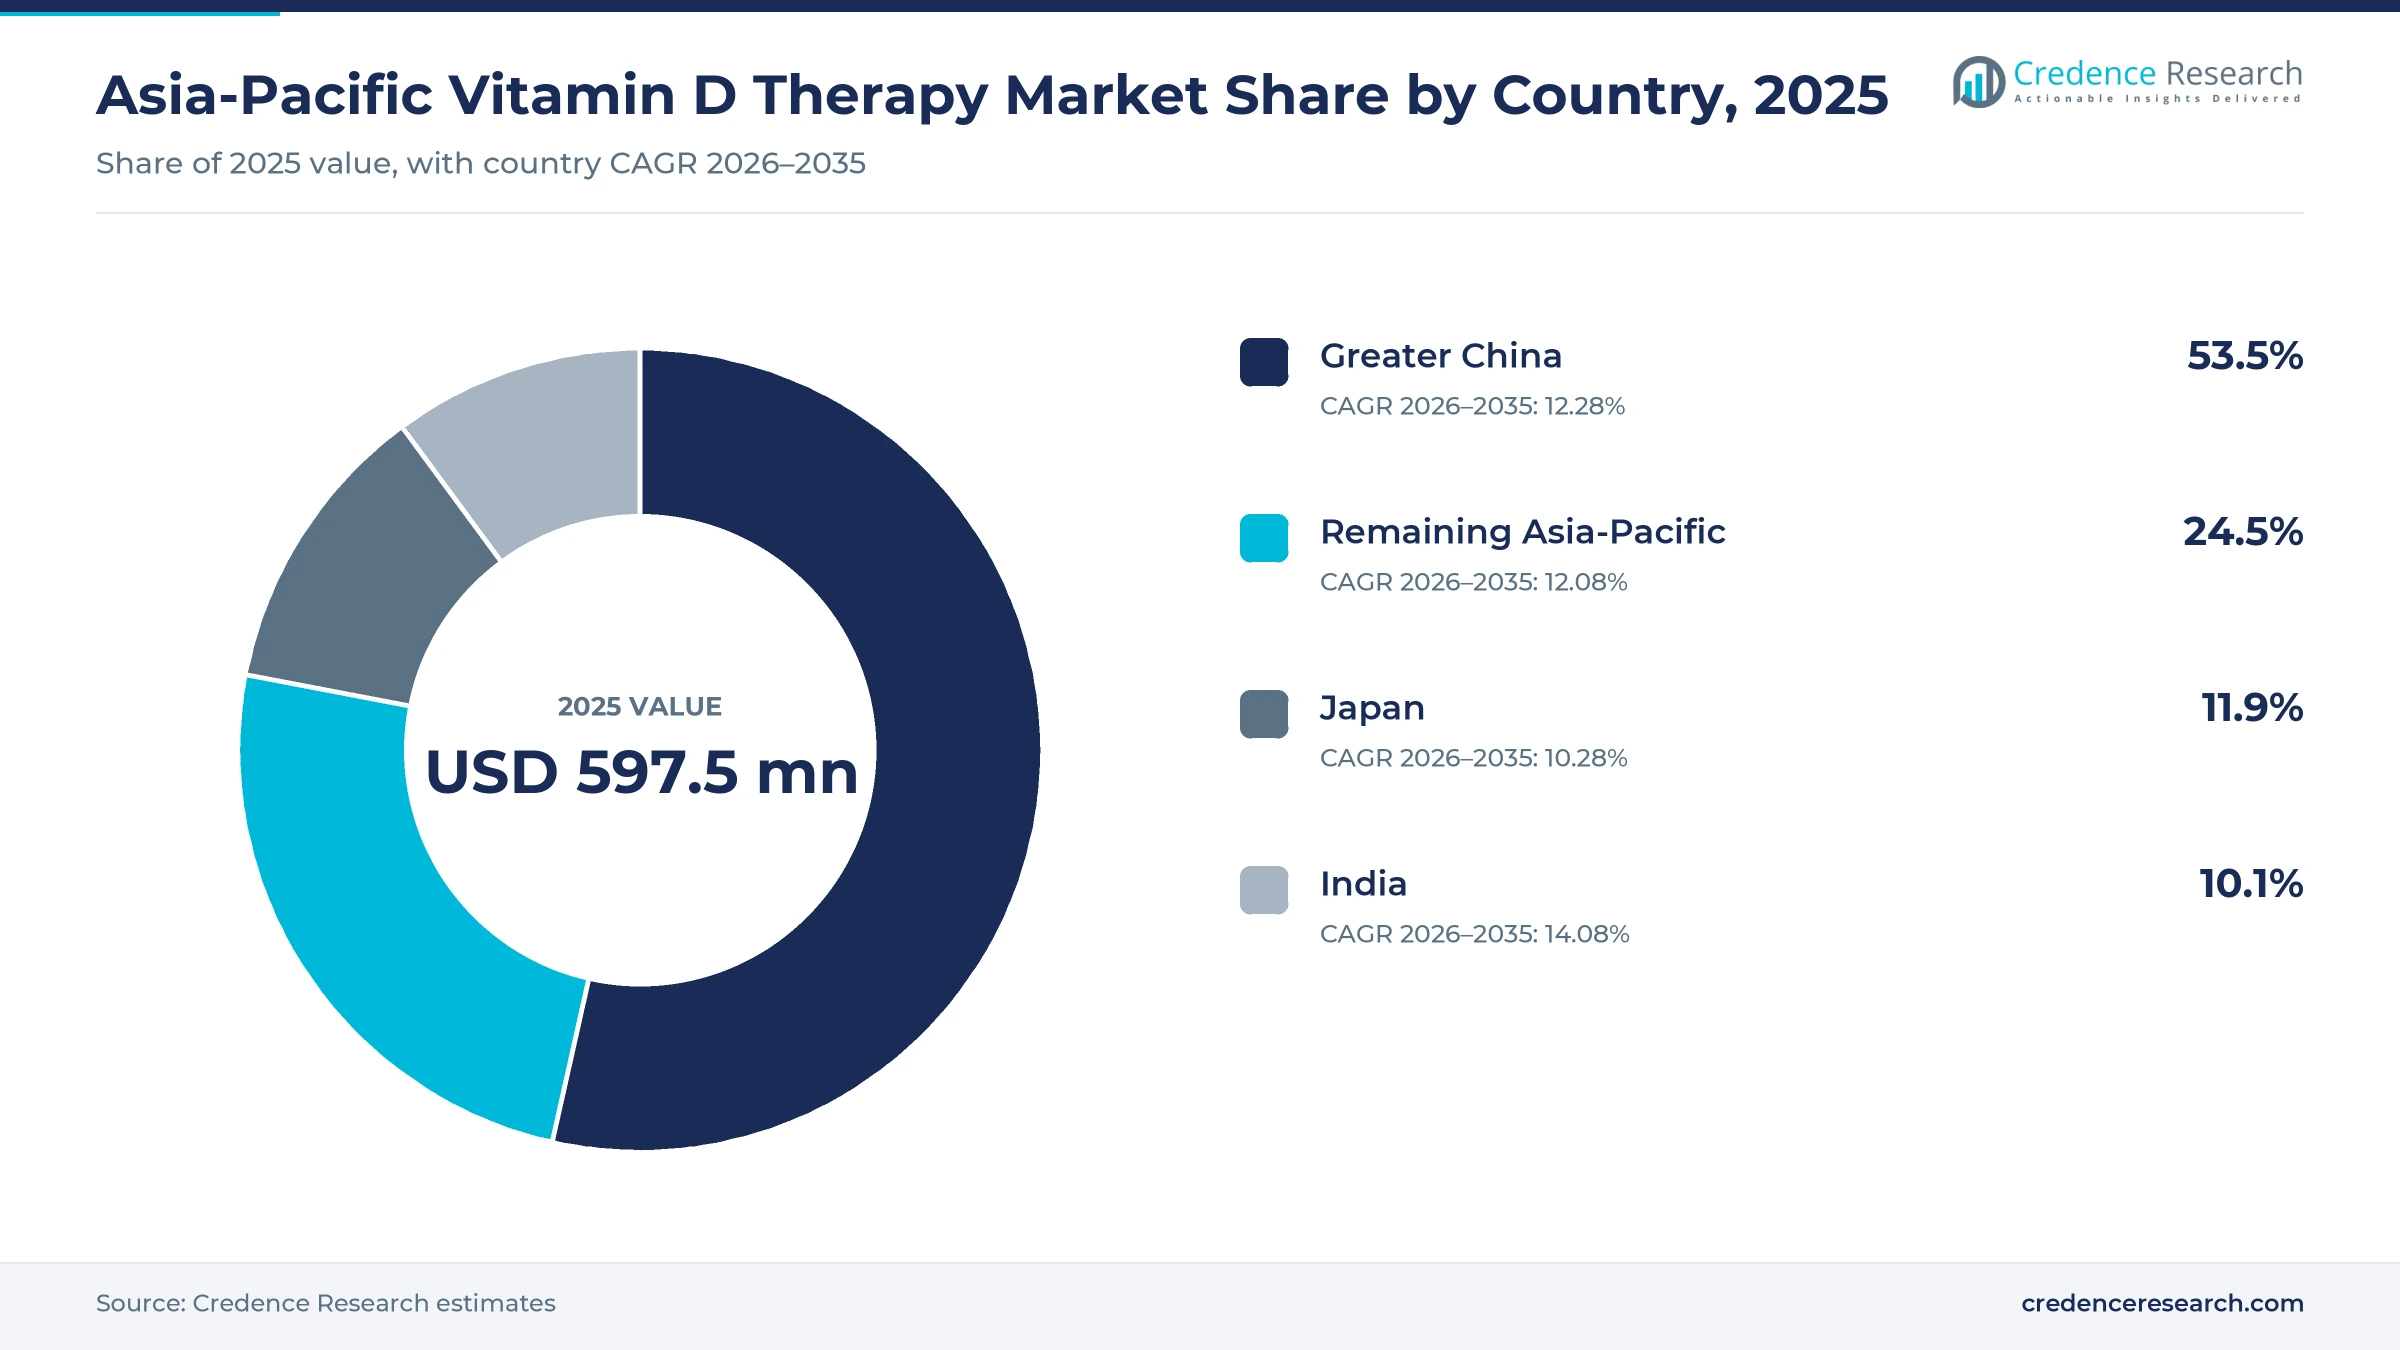
Greater China leads while India grows fastest
| Country | Value, 2025 (USD million) | Share, 2025 | CAGR, 2026–2035 |
|---|---|---|---|
| Greater China | 319.7 | 53.5% | 12.28% |
| Remaining Asia-Pacific | 146.4 | 24.5% | 12.08% |
| Japan | 71.1 | 11.9% | 10.28% |
| India | 60.3 | 10.1% | 14.08% |
Why does Greater China hold over half of regional value?
Greater China held a 53.5% share of 2025 value and grows at 12.28% a year, because a large aging population and heavy kidney disease burden support steady prescription demand. About 82 million adults in mainland China had chronic kidney disease in 2018 to 2019, which sustains the use of calcitriol and related agents. Chugai launched eldecalcitol in China in 2022 after approval in December 2020, which added a newer analog for postmenopausal osteoporosis. Online sale rules in force since December 2022 also bring prescription checks to digital channels.
How does Japan rely on active analogs?
Japan held an 11.9% share of 2025 value and grows at 10.28% a year, the slowest pace in the region, because prices for older analogs keep falling. Japan has the oldest population in the region, with 29.8% of residents aged 65 and above in 2024. Physicians rely heavily on alfacalcidol and eldecalcitol for osteoporosis, while 347,474 dialysis patients need mineral and bone disorder care. As a result, Japanese spending leans toward active metabolites rather than over-the-counter cholecalciferol.
What makes India the fastest-growing country?
India held 10.1% of 2025 value and grows fastest at 14.08% a year, because deficiency is widespread and weekly 60,000 IU formats are cheap and familiar to physicians. Abbott India, Alkem Laboratories, Cadila Pharmaceuticals, Cipla and Sun Pharmaceutical all sell high-dose cholecalciferol brands through community and online pharmacies. Pulse Pharmaceuticals announced regulatory approval for a nano-carrier oral dispersion in August 2026, which widens the liquid range. In turn, India gains share across the forecast period, although it was the smallest group by value in 2025.
How do the remaining countries contribute?
The remaining Asia-Pacific countries held 24.5% of 2025 value and grow at 12.08% a year, because Australia, South Korea and Southeast Asia combine mature pharmacy markets with aging populations. Thailand had 15.4% of its population aged 65 and above in 2024, and Australia had 17.7%. Kirin-owned Blackmores and H&H Group's Swisse brand both sell vitamins through Australian pharmacy chains and export channels. Australia's targeted testing rules, however, keep diagnosis focused on high-risk groups.
Deals, approvals and portfolio moves since 2024
| Development | Status and market relevance |
|---|---|
| In April 2025, Sanofi and CD&R closed the Opella transaction, creating a stand-alone consumer health company. | Opella operates in 100 countries |
| In November 2025, H&H Group reported that Swisse kept its top position in China's vitamin and supplement market. | Strengthens online and cross-border reach |
| In April 2026, OPKO Health expanded its Greater China agreement with Nicoya for extended-release calcifediol. | China approvals expected in 2027 |
| In June 2026, Teijin Pharma agreed to transfer seven legacy brands, including Bonalon, to LTL Pharma. | Reshapes older bone portfolios in Japan |
| In August 2026, Pulse Pharmaceuticals received Indian regulatory approval for a nano-carrier vitamin D3 oral dispersion. | Adds a water-dispersible liquid format |
Active analogs, nano carriers and weekly doses advance
- Active analogs such as alfacalcidol and eldecalcitol bypass the kidney conversion step, which suits older and dialysis patients in Japan and China.
- High-dose cholecalciferol in 60,000 IU sachets and capsules allows weekly loading, which lowers pill burden and cost for Indian patients.
- Nano-carrier dispersions carry fat-soluble vitamin D in water-based liquids, which Pulse Pharmaceuticals says raises serum levels by 50% to 60%.
- Extended-release calcifediol raises vitamin D levels gradually in kidney disease patients and is approved in Macau, with China approvals expected in 2027.
Need a Custom Version of This Report?
Tailor the scope, geography, or segments to your exact requirements.
- Custom geography or segment scope
- Direct access to our analyst team
Indian generics and consumer health brands compete
Competition combines Indian generic makers with broad cholecalciferol ranges, Japanese originators of active analogs and consumer health groups that sell maintenance doses. Abbott India competes with the Arachitol range of drops, oral solution, gummies and ampoules. Alkem Laboratories, Cadila Pharmaceuticals, Cipla and Sun Pharmaceutical compete with 60,000 IU sachets and capsules under the Uprise-D3, Calcirol, Cipcal D3 and D Well AQ brands. Chugai competes with eldecalcitol in Japan and China, while Teijin Pharma sells alfacalcidol in Japan. Kirin-owned Blackmores and H&H Group's Swisse brand compete in consumer vitamins across Australia and China. Opella became a stand-alone consumer health company in April 2025. Rivals compete on price, dose strength, flavor, physician outreach and pharmacy reach, which keeps distribution networks central to winning share.
Which suppliers serve Asia-Pacific pharmacies and clinics?
| Company | Type | Role in the market |
|---|---|---|
| Abbott India Limited | Branded generics maker | Arachitol drops, gummies and 300,000 IU ampoules in India |
| Alkem Laboratories Limited | Indian drug maker | Uprise-D3 60,000 IU sachets |
| Sun Pharmaceutical Industries Limited | Indian drug maker | D Well AQ 60,000 IU capsules |
| Cadila Pharmaceuticals Limited | Indian drug maker | Calcirol 60,000 IU sachets |
| Cipla Limited | Indian drug maker | Cipcal D3 60,000 IU capsules |
| Chugai Pharmaceutical Co., Ltd. | Japanese originator | Edirol eldecalcitol in Japan and China |
| Teijin Pharma Limited | Japanese drug maker | Onealfa alfacalcidol in Japan, legacy brand transfer agreed June 2026 |
| Blackmores Limited | Consumer vitamin maker | Owned by Kirin since August 2023 |
| Health and Happiness (H&H) International Holdings Limited | Consumer health group | Swisse holds top position in China supplements |
| Opella Healthcare Australia Pty Ltd | Consumer health company | Part of Opella, stand-alone since April 2025 |
Credence Research view on regional deficiency care
Credence Research's view is that Asia-Pacific vitamin D sales will grow quickly because aging, kidney disease and widespread deficiency keep enlarging the treated population across the region. Cholecalciferol remains the largest value pool, while renal care, liquid formats and digital pharmacies add the fastest growth. Testing restraint and debate over deficiency cutoffs will push treatment toward clinically confirmed cases rather than blanket screening. Suppliers that pair low-cost weekly formats with renal analogs and online reach should gain the most, because price pressure in India limits growth for single-format brands.
How the regional estimate was built
The report uses 2025 as the base year on a calendar basis, and market values come from the Credence Research model. That model combines international agency statistics on population and aging, national survey data on deficiency and kidney disease, peer-reviewed studies, payer schedules, pharmacy price listings and company releases. Country growth rates, segment splits and segment growth rates are Credence Research estimates from public data. Sources used are international agency data, government and payer releases, peer-reviewed studies, e-commerce listings and company releases, and no interviews or surveys were used.
Renal care and digital refills carry growth to 2035
The Asia-Pacific vitamin D therapy market is expected to reach USD 1.91 billion by 2035, a 12.20% CAGR during 2026–2035, as aging populations, kidney disease and deficiency correction bring more patients to treatment. Growth should be strongest in India, renal mineral and bone disorders and digital pharmacies, because these areas gain most from new formats and online refills. Testing limits, low retail prices and safety concerns over high doses could slow growth in some countries, while extended-release calcifediol and nano liquids should widen treatment choices.
Frequently Asked Questions
How big is the Asia-Pacific vitamin D therapy market?
Which product type leads the market?
Which country group leads the market?
Which application grows fastest?
How common is vitamin D deficiency in India?
Why are digital pharmacies growing?
Who are the leading companies in this market?
What are the main challenges for suppliers?
Table of Content
Chapter 1 Market Segmentation
- 1.1 Segmentation Framework
- 1.1.1 Product and Service Classification
- 1.1.2 Application and End-Use Classification
- 1.1.3 Technology and Solution Classification
- 1.1.4 Customer and Distribution Channel Classification
- 1.1.5 Geographic Segmentation
- 1.1.6 Market Segment Definitions and Boundaries
- 1.2 By Product Type
- 1.2.1 Cholecalciferol
- 1.2.2 Ergocalciferol
- 1.2.3 Active Metabolites and Precursors
- 1.3 By Application
- 1.3.1 Osteoporosis and Bone Health
- 1.3.2 Rickets and Nutritional Deficiency
- 1.3.3 Renal Mineral and Bone Disorders
- 1.3.4 Specialty Deficiency Management
- 1.4 By Dosage Form
- 1.4.1 Tablets and Capsules
- 1.4.2 Oral Drops and Solutions
- 1.4.3 Sachets and Granules
- 1.4.4 Injectables and Ampoules
- 1.5 By Country
- 1.5.1 Greater China
- 1.5.2 India
- 1.5.3 Japan
- 1.5.4 Remaining Asia-Pacific
Chapter 2 Introduction
- 2.1 Report Objectives and Scope
- 2.2 Product Definition and Industry Terminology
- 2.3 Market Inclusions and Exclusions
- 2.4 Research Process
- 2.4.1 Primary Research and Expert Interviews
- 2.4.2 Secondary Research and Source Review
- 2.4.3 Top-Down and Bottom-Up Estimation
- 2.4.4 Data Triangulation and Verification
- 2.5 Market Size Measurement Basis
- 2.5.1 2025: USD 597.5 million → 2035: USD 1.91 billion
- 2.6 Historical and Forecast Reference Periods
- 2.6.1 Historical Period: 2018-2025
- 2.6.2 Base Year: 2025
- 2.6.3 Forecast Period: 2025-2035
- 2.7 Research Assumptions and Limitations
Chapter 3 Executive Summary
- 3.1 Market Snapshot and Key Findings
- 3.2 Base-Year Market Size, 2025
- 3.3 Forecast Market Size, 2035
- 3.4 Revenue and Volume Growth Outlook
- 3.5 Key Demand and Supply Indicators
- 3.6 Leading Market Segments
- 3.7 Fastest-Growing Market Opportunities
- 3.8 Regional Performance Highlights
- 3.9 Technology and Industry Transformation
- 3.10 Competitive Landscape Summary
- 3.11 Analyst View and Strategic Implications
Chapter 4 Asia-Pacific Vitamin D Therapy Market Trends and Developments
- 4.1 Historical Industry Development, 2018-2025
- 4.2 Recent Market Trends and Developments
- 4.3 Demand and Customer Behavior Trends
- 4.4 Technology and Product Innovation
- 4.5 Artificial Intelligence, Automation and Digitalization
- 4.6 Local Manufacturing and Supply Chain Realignment
- 4.7 Industry Partnerships, Mergers and Acquisitions
- 4.8 Sustainability and Circular Economy Developments
- 4.9 Government and Private Sector Investment Trends
- 4.10 Emerging Business Models and Commercialization
- 4.11 Industry Developments and Announcements
Chapter 5 Asia-Pacific Vitamin D Therapy Market Production, Supply and Demand Analysis
- 5.1 Demand Trend and Consumption Analysis, 2018-2025
- 5.2 Demand Forecast, 2025-2035
- 5.3 Production and Output Trend, 2018-2025
- 5.4 Production and Output Forecast, 2025-2035
- 5.5 Installed Capacity and Capacity Utilization
- 5.6 Company-Wise Production Plants and Statistics
- 5.6.1 Installed Production Capacity
- 5.6.2 Actual Production
- 5.6.3 Planned Capacity and Expansion Targets
- 5.7 Supply Chain Structure and Procurement Trends
- 5.8 Supply-Demand Gap and Bottlenecks
- 5.9 Import Dependence and Sourcing Structure
- 5.10 Contract Manufacturing and Outsourcing
- 5.11 Regional Supply and Demand Concentration
Chapter 6 Asia-Pacific Vitamin D Therapy Market Pricing Analysis
- 6.1 Pricing Structure and Measurement
- 6.2 Historical Pricing Trends, 2018-2025
- 6.3 Pricing Outlook, 2025-2035
- 6.4 Average Selling Price and Unit Economics
- 6.5 Pricing by Product and Market Segment
- 6.6 Geographic Pricing Differences
- 6.7 Key Input, Energy, Labor and Logistics Costs
- 6.8 Contract Pricing and Purchasing Models
- 6.9 Pricing Sensitivity and Competitive Positioning
- 6.10 Price, Margin and Profitability Implications
Chapter 7 Asia-Pacific Vitamin D Therapy Market Dynamics
- 7.1 Market Growth Drivers
- 7.1.1 Demand-Side Drivers
- 7.1.2 Technology and Innovation Drivers
- 7.1.3 Infrastructure and Investment Drivers
- 7.1.4 Regulatory and Policy Drivers
- 7.2 Market Restraints
- 7.2.1 Cost and Affordability Constraints
- 7.2.2 Technology and Adoption Barriers
- 7.2.3 Supply Chain and Operational Constraints
- 7.3 Market Challenges
- 7.3.1 Competitive Pressure and Margin Erosion
- 7.3.2 Skills, Infrastructure and Implementation Gaps
- 7.4 Emerging Market Opportunities
- 7.5 Market Dynamics Impact and Time-Horizon Assessment
Chapter 8 Asia-Pacific Vitamin D Therapy Value Chain Analysis
- 8.1 Industry Value Chain Overview
- 8.2 Upstream Suppliers and Critical Inputs
- 8.3 Technology and Component Providers
- 8.4 Manufacturing or Service Delivery
- 8.5 Distribution, Channel Partners and Integrators
- 8.6 Downstream Applications and End Users
- 8.7 Value Addition and Profit Pools
- 8.8 Vertical Integration and Outsourcing
- 8.9 Supplier Concentration and Risk
- 8.10 Supply Chain Localization and Resilience
Chapter 9 Asia-Pacific Vitamin D Therapy Market Regulations and Policies
- 9.1 Relevant Laws, Standards and Compliance Frameworks
- 9.2 Product, Service, Safety and Quality Requirements
- 9.3 Government Policies, Incentives and Subsidies
- 9.4 Imports, Exports and Trade Barriers
- 9.5 Public Procurement and Local Content Requirements
- 9.6 Environmental and Sustainability Compliance
- 9.7 Upcoming Policy Changes and Market Implications
Chapter 10 Asia-Pacific Vitamin D Therapy Market Hotspots and Opportunities
- 10.1 Market Opportunity Mapping and Growth Hotspots
- 10.2 High-Growth Applications and Customer Groups
- 10.3 Underserved Markets and White-Space Opportunities
- 10.4 Emerging Technology and Product Opportunities
- 10.5 New Capacity and Investment Hotspots
- 10.6 Market Entry and Expansion Opportunities
- 10.7 Distribution and Partnership Opportunities
- 10.8 Near-Term and Long-Term Commercial Potential
- 10.9 Opportunity Attractiveness and Execution Risks
Chapter 11 Asia-Pacific Vitamin D Therapy Market Outlook, 2025-2035
- 11.1 Market Size and Analysis
- 11.1.1 Revenue (Market Measurement: 2025: USD 597.5 million → 2035: USD 1.91 billion)
- 11.1.2 Market Volume and Quantity Sold
- 11.1.3 Historical Market Size, 2018-2025
- 11.1.4 Base-Year Market Size, 2025
- 11.2 Market Forecast, 2025-2035
- 11.2.1 Revenue Forecast to 2035
- 11.2.2 Volume Forecast to 2035
- 11.2.3 CAGR and Year-on-Year Growth
- 11.2.4 Incremental Revenue Opportunity
- 11.3 Forecast Assumptions and Scenario Analysis
- 11.3.1 Base-Case Forecast
- 11.3.2 Optimistic and Conservative Scenarios
- 11.3.3 Technology, Pricing and Policy Sensitivities
- 11.4 Market Attractiveness and Growth Outlook
Chapter 12 Asia-Pacific Vitamin D Therapy Market Segmentation and Outlook
- 12.1 Segmentation Summary and Market Shares, 2025
- 12.2 Largest and Fastest-Growing Segments
- 12.3 By Product Type - Market Size and Forecast, 2025-2035
- 12.3.1 Segment Definition and Scope
- 12.3.2 Historical Market Size, 2018-2025
- 12.3.3 Revenue Forecast, 2025-2035
- 12.3.4 Volume Forecast, 2025-2035
- 12.3.5 Base-Year Market Share, 2025
- 12.3.6 Segment CAGR and Growth Drivers
- 12.3.7 Subsegment Market Size and Forecast
- 12.3.7.1 Cholecalciferol
- 12.3.7.2 Ergocalciferol
- 12.3.7.3 Active Metabolites and Precursors
- 12.3.8 Subsegment Pricing and Adoption Trends
- 12.3.9 Leading Suppliers and Competition
- 12.3.10 Regional Demand and Opportunities
- 12.4 By Application - Market Size and Forecast, 2025-2035
- 12.4.1 Segment Definition and Scope
- 12.4.2 Historical Market Size, 2018-2025
- 12.4.3 Revenue Forecast, 2025-2035
- 12.4.4 Volume Forecast, 2025-2035
- 12.4.5 Base-Year Market Share, 2025
- 12.4.6 Segment CAGR and Growth Drivers
- 12.4.7 Subsegment Market Size and Forecast
- 12.4.7.1 Osteoporosis and Bone Health
- 12.4.7.2 Rickets and Nutritional Deficiency
- 12.4.7.3 Renal Mineral and Bone Disorders
- 12.4.7.4 Specialty Deficiency Management
- 12.4.8 Subsegment Pricing and Adoption Trends
- 12.4.9 Leading Suppliers and Competition
- 12.4.10 Regional Demand and Opportunities
- 12.5 By Dosage Form - Market Size and Forecast, 2025-2035
- 12.5.1 Segment Definition and Scope
- 12.5.2 Historical Market Size, 2018-2025
- 12.5.3 Revenue Forecast, 2025-2035
- 12.5.4 Volume Forecast, 2025-2035
- 12.5.5 Base-Year Market Share, 2025
- 12.5.6 Segment CAGR and Growth Drivers
- 12.5.7 Subsegment Market Size and Forecast
- 12.5.7.1 Tablets and Capsules
- 12.5.7.2 Oral Drops and Solutions
- 12.5.7.3 Sachets and Granules
- 12.5.7.4 Injectables and Ampoules
- 12.5.8 Subsegment Pricing and Adoption Trends
- 12.5.9 Leading Suppliers and Competition
- 12.5.10 Regional Demand and Opportunities
- 12.6 By Country - Market Size and Forecast, 2025-2035
- 12.6.1 Segment Definition and Scope
- 12.6.2 Historical Market Size, 2018-2025
- 12.6.3 Revenue Forecast, 2025-2035
- 12.6.4 Volume Forecast, 2025-2035
- 12.6.5 Base-Year Market Share, 2025
- 12.6.6 Segment CAGR and Growth Drivers
- 12.6.7 Subsegment Market Size and Forecast
- 12.6.7.1 Greater China
- 12.6.7.2 India
- 12.6.7.3 Japan
- 12.6.7.4 Remaining Asia-Pacific
- 12.6.8 Subsegment Pricing and Adoption Trends
- 12.6.9 Leading Suppliers and Competition
- 12.6.10 Regional Demand and Opportunities
- 12.7 Segment Growth Comparison
- 12.8 Segment Attractiveness and Priority Matrix
Chapter 13 Asia-Pacific Vitamin D Therapy End-Use and Application Market Outlook
- 13.1 End-Use Industry and Customer Demand Structure
- 13.2 Leading Applications and Customer Groups
- 13.3 End-Use Market Size, Share and Forecast
- 13.4 Major End-Use Industry Deep Dives
- 13.4.1 Customer Requirements and Use Cases
- 13.4.2 Demand and Replacement Cycles
- 13.4.3 Technical and Regulatory Considerations
- 13.4.4 Purchasing and Procurement Models
- 13.4.5 Leading Vendors and Distribution Channels
- 13.4.6 Forecast and Commercial Opportunities
- 13.5 Emerging Applications and Cross-Segment Demand
- 13.6 End-Use Industry Investment Priorities
Chapter 14 Asia-Pacific Vitamin D Therapy Geographic Market Outlook, 2025-2035
- 14.1 Regional Market Size and Country-Level Shares, 2025
- 14.2 Country Market Size Comparison, 2025
- 14.3 Country Market Forecasts, 2025-2035
- 14.4 Subregional Industrial and Demand Clusters
- 14.5 Intra-Regional Pricing and Cost Differences
- 14.6 Cross-Border Trade and Supply Networks
- 14.7 Regional Supply and Demand Balances
- 14.8 Country Opportunity Comparison and Prioritization
Note: Every listed country is covered on the structure shown under the first country.
Chapter 15 Asia-Pacific Vitamin D Therapy Technology, Innovation and Sustainability Outlook
- 15.1 Technology Landscape and Maturity
- 15.2 Product, Process and Service Innovation
- 15.3 AI, Automation and Digital Tools in the Industry
- 15.4 Technology Adoption and Performance Benchmarking
- 15.5 Innovation Pipeline and R&D Investment
- 15.6 Patent and Intellectual Property Trends
- 15.7 Energy Efficiency and Resource Management
- 15.8 Sustainability, Recycling and Circularity
- 15.9 Technology Roadmap, 2025-2035
- 15.10 Risks of Obsolescence and Technology Substitution
Chapter 16 Asia-Pacific Vitamin D Therapy Market Key Strategic Imperatives
- 16.1 Growth and Market Entry Priorities
- 16.2 High-Return Products and Segments
- 16.3 Pricing, Profitability and Cost Optimization
- 16.4 Technology Investment and Product Differentiation
- 16.5 Supply Chain Localization and Resilience
- 16.6 Distribution and Customer Acquisition
- 16.7 Partnership, Acquisition and Capacity Strategy
- 16.8 Regional Expansion Priorities
- 16.9 Short-, Medium- and Long-Term Actions
Chapter 17 Competition Outlook
- 17.1 Industry Competition Characteristics
- 17.2 Market Structure and Concentration
- 17.3 Market Share and Competitive Positioning, 2025
- 17.4 Company-Wise Revenue and Product Benchmarking
- 17.5 Production and Service Capacity Benchmarking
- 17.6 Technology, Pricing and Differentiation
- 17.7 Regional Footprint and Distribution Strength
- 17.8 Mergers, Acquisitions and Strategic Alliances
- 17.9 New Entrants and Competitive Threats
- 17.10 Porter's Five Forces and Industry Attractiveness
- 17.11 Competitive Outlook, 2025-2035
Chapter 18 Company Profiles
- 18.1 Company Coverage and Selection Criteria
- 18.2 Abbott India Limited
- 18.2.1 Business Description
- 18.2.2 Company Ownership and Geographic Presence
- 18.2.3 Product and Service Portfolio
- 18.2.4 Manufacturing and Operating Footprint
- 18.2.5 Production Capacity and Expansion Plans
- 18.2.6 Financial Performance and Investment
- 18.2.7 Market Share and Competitive Position
- 18.2.8 Technology and Innovation Capabilities
- 18.2.9 Strategic Alliances or Partnerships
- 18.2.10 Recent Developments
- 18.2.11 Growth Strategy and Outlook
- 18.3 Alkem Laboratories Limited
- 18.4 Sun Pharmaceutical Industries Limited
- 18.5 Cadila Pharmaceuticals Limited
- 18.6 Cipla Limited
- 18.7 Chugai Pharmaceutical Co., Ltd.
- 18.8 Teijin Pharma Limited
- 18.9 Blackmores Limited
- 18.10 Health and Happiness (H&H) International Holdings Limited
- 18.11 Opella Healthcare Australia Pty Ltd
- 18.12 Other Relevant Market Participants
Note: Every listed company is profiled on the structure shown under the first company. The company list is preliminary and may change based on research findings, market developments, data availability and client requirements.
Chapter 19 Disclaimer
- 19.1 Research and Forecast Disclaimer
- 19.2 Data Source and Estimation Limitations
Note: The depth of individual sections depends on data availability for this market. Volume, capacity, trade and other unit-based metrics are included where applicable.

