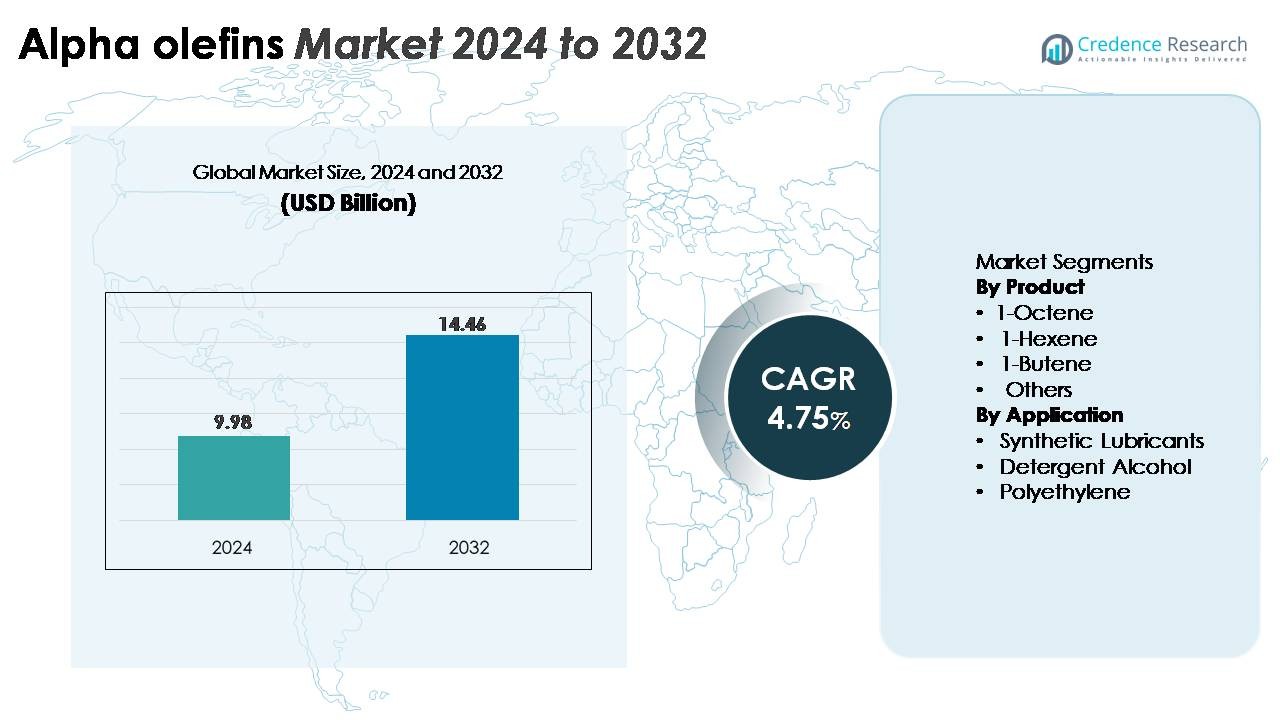
Home » Chemicals » Alpha Olefins Market

Alpha Olefins Market By Product (1-Butene, 1-Hexene, 1-Octene, 1-Decene, 1-Dodecene), By Application (Polyethylene, Detergent Alcohol, Synthetic Lubricant) – Growth, Future Prospects And Competitive Analysis, 2020 – 2030

Price: $4999

Published: | Report ID: 11923 | Report Format : PDF

Market Insights

In 2022, the worldwide market for alpha olefins stood at a valuation of USD 7.23 billion. Projections indicate that by 2030, the market is expected to ascend to an estimated worth of USD 10.36 billion, expanding at a compound annual growth rate (CAGR) of 5.27% over the decade spanning from 2020 to 2030.

Alpha-olefins constitute a significant class of organic molecules characterized as alkenes with the general molecular formula CₓH₂ₓ. These compounds are pivotal in a multitude of chemical applications, encompassing the production of polyethylene, detergent alcohols, and advanced synthetic lubricants. A key driver for the alpha-olefins market is the escalating demand for polyethylene within the packaging industry, which is expected to remain a primary growth catalyst. Moreover, the sector anticipates a boost in demand attributable to the increasing utilization of polyalphaolefins in synthetic lubricants, which are known for their superior performance in reducing engine wear and tear.

Environmental considerations, particularly concerning vehicular emissions, have historically spurred the uptake of polyalphaolefin-based synthetic lubricants. Additionally, a positive projection for oilfield drilling activities suggests further expansion in the demand for alpha-olefins in the foreseeable future.

Market segmentation by product type reveals a diverse array of alpha-olefins, including 1-Hexene, 1-Decene, 1-Butene, 1-Octene, 1-Dodecene, C10, and other higher olefins. In 2019, 1-Hexene dominated the global alpha-olefins market in terms of size and revenue, and it is anticipated to maintain its dominant position throughout the projected period. This dominance is supported by the compound’s extensive use in synthesizing linear low-density polyethylene. Concurrently, the need for 1-Decene is likely to intensify, propelled by its application in manufacturing synthetic lubricants.

The alpha-olefins market has been analyzed across five key regions: North America, Europe, Asia Pacific, Latin America, and the Middle East and Africa. North America emerged as the largest and most rapidly expanding market in 2019, accounting for more than 40% of global demand. Conversely, the Asia Pacific market is forecast to experience the most accelerated growth rate in the forthcoming years, driven by burgeoning demands from the synthetic lubricant and polyethylene sectors, especially in advancing economies such as Japan, China, and India.

Market Growth Drivers in the Alpha Olefins Market

The booming demand within the automotive industry is a major driver of the alpha-olefins market’s significant growth. As global automobile production and ownership escalate, there is a concomitant increase in the requirement for alpha-olefin-based synthetic lubricants. These lubricants are preferred due to their advanced performance attributes, such as higher kinematic viscosity, enhanced viscosity index, reduced pour points, and superior volatility profiles compared to mineral-based lubricants. Alpha-olefins are also integral in the formulation of various end products like plasticizers, surfactants, and additives, which are indispensable in automotive manufacturing and upkeep. The expansion of their application range, paired with their superior qualities, underpins a robust expansion of the alpha-olefins market.

Along with demand from the automotive industry, polyolefin co-monomers like polyethylene and polypropylene are being used more and more in many industries, such as packaging, construction, and automotive. This keeps the alpha-olefin consumption trend going. Alpha-olefins are becoming more and more important in surfactants and intermediates, which are essential for a variety of applications from personal care to industrial cleaning and reflect trends in population growth and urbanization. Additionally, the market is benefiting from a heightened interest in synthetic lubricants, recognized for their environmental advantages and operational efficiency. The sector is also experiencing a surge in research and development activities aimed at producing alpha-olefins from renewable feedstocks, motivated by environmental stewardship and the demand for sustainable product offerings. This R&D impetus, combined with the rapid industrialization and economic advancement in the Asia Pacific region—a principal market for alpha olefins—is creating a dynamic environment for market growth and diversification.

Design Element 2

Access crucial information at unmatched prices!

Request your free sample report today & start making informed decisions powered by Credence Research!

Download Free Sample
CTA Design Element 3

Market Restraints

The complex and delicate production process for alpha-olefins, which necessitates high-pressure and high-temperature conditions and requires deviations to result in significant product flaws and financial consequences, restricts market growth and may deter new entrants due to the sophistication of the manufacturing technology required. Concurrently, stringent environmental regulations targeting the industry’s fossil fuel reliance, volatile feedstock prices, and competition from economically advantageous or technologically simpler alternatives like LAB and MMA further complicate the market landscape. These factors collectively impose multifaceted challenges, impacting the production and competitive stance of alpha olefins, and must be adeptly navigated to sustain market growth amidst evolving regulatory and economic pressures.

Interesting Facts about the Alpha Olefins Industry

  • Alpha-olefins are a versatile class of chemicals with a wide range of applications. They are used to make plastics, detergents, lubricants, and many other products.
  • Alpha-olefins are a versatile class of chemicals with a wide range of applications. They are used to make plastics, detergents, lubricants, and many other products.
  • The alpha-olefins industry is highly concentrated, with a few major players controlling the market. The top three alpha-olefin producers in the world are Exxon Mobil, Shell, and Dow.
  • Alpha-olefins are produced from a variety of feedstocks, including ethylene, propylene, and butane. The most common feedstock is ethylene, which is used to produce ethylene-derived alpha olefins (EDAOs).
  • The alpha-olefins industry is facing a number of challenges, including environmental regulations and rising feedstock costs. However, the industry is also benefiting from new technologies and investments in new production facilities.
  • Alpha-olefins are used to make a variety of plastics, including polyethylene, polypropylene, and polyalpha-olefins. These plastics are used to make a wide range of products, including packaging, consumer goods, and automotive parts.
  • Alpha-olefins are also used to make detergents. Alpha-olefin sulfonates (AOS) are a type of detergent that is known for its high foaming and cleaning performance. AOS is used in a variety of detergents, including dishwashing liquids, laundry detergents, and shampoos.
  • Alpha-olefins are used to make lubricants. Alpha-olefin synthetic base oils (PAOs) are high-performance lubricants that are used in a variety of applications, including automotive engines, industrial machinery, and aerospace equipment.
  • Alpha-olefins are also used to make a variety of other products, including adhesives, paints, and pharmaceuticals.

 Competitive Analysis

In the dynamic landscape of the industry, key players are channeling funds into the research and development of innovative and intelligent strategies to maintain their competitive edge and stimulate market growth. These strategies encompass a variety of approaches, such as launching new products, engaging in mergers and acquisitions, forming collaborations and partnerships, and enhancing existing technological capabilities.

A noteworthy development occurred on February 25, 2022, when Axens and Univation Technologies forged a partnership designed to bolster both capital and operational efficiency in the manufacturing of linear alpha olefins, specifically butene-1 and hexene-1. These olefins are crucial for the production of polyethylene resins through the UNIPOL PE Process.

The report profiles prominent market players in the alpha-olefin sector, including

  • Qatar Chemical Company Ltd. (Q-Chem),
  • Chevron Phillips Chemical Company LLC,
  • Mitsubishi Chemical Corp.
  • Exxon Mobil Corporation,
  • INEOS Oligomers,
  • Petrochemicals Sdn. Bhd.
  • Royal Dutch Shell,
  • Evonik Industries,
  • JAM Petrochemicals Company


Shape Your Report to Specific Countries or Regions & Enjoy 30% Off!


Notable developments within the industry include:

  • In February 2023, Chevron Phillips Chemical (CPChem) partnered with Charter Next Generation (CNG), resulting in the forthcoming introduction of overwrap film made with CPChem’s Marlex® AnewTM Circular Polyethylene on US retail shelves. These versatile and efficient overwrap films are instrumental in preserving the quality of food, ensuring the sterility of medical instruments, and providing lightweight, robust packaging. It’s important to note that alpha-olefins primarily find their application in the production of polyethylene.
  • In April 2022, Shell Chemical achieved a significant milestone when it received the green light from the state Board of Commerce and Industry for a tax break under the Industrial Tax Exemption Program. This approval was for a substantial investment of USD 1.4 billion by the company, aimed at establishing a “world-scale” linear alpha-olefin production plant at their Geismar facility. Linear alpha-olefins are essential in a range of products, including detergents, waxes, plastics, and high-quality lubricants.

Market Segmentations

Report Scope by Segments

The purpose of this strategic research study titled “Alpha Olefins Market: Growth, Future Prospects, and Competitive Analysis, 2020–2030″ is to offer industry investors, company executives, and industry participants in-depth insights to enable them to make informed strategic decisions related to the opportunities in the global alpha olefins market.

Target Audience

  • Industry Investors
  • Procurement Managers from End-User Companies
  • Alpha Olefins Manufacturers
  • Distributors

Overall, the research study provides a holistic view of the global alpha-olefins market, offering market size and estimates for the period from 2020 to 2030, keeping in mind the above-mentioned factors.

Based on applications, the alpha-olefins market is categorized into the following segments:

  • Polyethylene
  • Detergent Alcohol
  • Synthetic Lubricant
  • Others (waxes, oilfield chemicals, plasticizer intermediates, specialty polymers, etc.)

The global alpha-olefins market revenue is expected to grow at a significant rate of 6% over 2020–2030. Among the considered applications, polyethylene dominates overall demand and offers strong growth potential in the upcoming years. Specialty polymers are finding huge growth potential due to their widespread use in flexible packaging. Synthetic lubricants are used mainly in mass transit applications for light vehicle crack-case lubricants, automatic gearbox transmission fluids, etc. Industrial applications include gear oils for wind turbines, machinery, etc. Synthetic lubricants have an excellent balance of properties concerning viscosity, pour point, oxidative stability, etc., making them an ideal choice for many applications, but they are relatively expensive. Today, however, more aggressive legislation is driving emissions reduction in the automotive industry, resulting in a new demand for synthetic lubricants. Increasing demand for alpha olefins, especially in the Asia Pacific, due to rapid population growth and industrialization in emerging economies such as India and China, is anticipated to fuel the demand for the global alpha olefins market over the forecast period of 2020–2030. Other factors, such as the growing demand for oilfield chemicals, waxes, plasticizer intermediates, specialty chemicals, etc., are expected to drive the growth of alpha-olefins during the forecast period.

Based on geographical distribution, the global alpha-olefins market is segmented into the following regional markets:

  • North America
    • U.S.
    • Canada
  • Europe
    • Germany
    • France
    • Italy
    • U.K.
    • Russia
    • Rest of Europe
  • Asia-Pacific
    • India
    • China
    • Japan
    • Rest of Asia-Pacific
  • Latin America
    • Brazil
    • Mexico
    • Rest of Latin America
  • Middle East and Africa
    • GCC Countries
    • South Africa
    • Rest of the Middle East and Africa

Based on geographical distribution, North America was the biggest manufacturing region for alpha-olefins and the largest consumer. It contributed over 40% of the global demand during 2020. However, the alpha-olefins market in North America is projected to record sluggish growth during the estimated period. The alpha-olefins market in Europe is also anticipated to experience a slow growth rate owing to the stagnated polyethylene industry in the region and the strict implementation of the rules concerning and related to ecological issues. On the other hand, the alpha-olefins market in the Asia Pacific zone is predicted to register the highest growth rate during the projected period, primarily attributed to growing demand from the synthetic lubricants sector and polyethylene industries, particularly from economies like Japan, China, and India. Growing production of synthetic lubricants, polyethylene, and detergent alcohol in Asia is predicted to boost the demand for alpha-olefins in the zone during the estimated period.

Chapter No. 1 : Introduction  23

1.1.        Report Description  23

1.1.1.    Purpose of the Report 23

1.1.2.    USP & Key Offerings  23

1.2.        Key Benefits for Stakeholders  23

1.3.        Target Audience  24

1.4.        Report Scope  25

Chapter No. 2 : Executive Summary  27

2.1.        Alpha Olefin Market Snapshot  27

2.2.        Global Alpha Olefin Market, 2017 – 2022 (Kilo Tons) (USD Million) 28

Chapter No. 3 : Impact Analysis of COVID 19 & Russia-Ukraine War on Alpha Olefin Market  29

3.1.        Impact Assessment of COVID-19 Pandemic, By Region  29

3.1.1.    Supply chain disruptions  29

3.1.2.    Demand fluctuations  29

3.1.3.    Shift in product mix  29

3.1.4.    Reduced industrial activity  29

3.1.5.    Temporary disruptions and delays  29

3.1.6.    Shift in focus towards essential services  29

3.2.        Russia-Ukraine War Impacts  30

3.2.1.    Uncertainty and economic instability  30

3.2.2.    Supply chain disruptions  30

3.2.3.    Regional market shifts  30

3.2.4.    Shift in government priorities  30

Chapter No. 4 : Alpha Olefin Market – Industry Analysis  31

4.1.        Introduction  31

4.2.        Market Drivers  32

4.2.1.    Driving Factor 1 Analysis  32

4.2.2.    Driving Factor 2 Analysis  33

4.3.        Market Restraints  34

4.3.1.    Restraining Factor Analysis  34

4.4.        Market Opportunities  35

4.4.1.    Market Opportunity Analysis  35

4.5.        Porter’s Five Forces Analysis  36

4.6.        Value Chain Analysis  37

4.7.        Buying Criteria  38

Chapter No. 5 : Import Export Analysis  39

5.1.        Import Analysis by Region  39

5.1.1.    Global Alpha Olefin Market Import Volume/Revenue, By Region, 2017 – 2022  39

5.2.        Export Analysis by Region  40

5.2.1.    Global Alpha Olefin Market Export Volume/Revenue, By Region, 2017 – 2022  40

Chapter No. 6 : Demand Supply Analysis  41

6.1.        Demand Analysis by Region  41

6.1.1.    Global Alpha Olefin Market Demand Volume/Revenue, By Region, 2017 – 2022  41

6.2.        Supply Analysis by Region  42

6.2.1.    Global Alpha Olefin Market Supply Volume/Revenue, By Region, 2017 – 2022  42

Chapter No. 7 : Production Analysis  43

7.1.        Production Analysis by Region  43

7.1.1.    Global Alpha Olefin Market Production, By Region, 2017 – 2022  43

7.1.2.    Global Alpha Olefin Market Production Volume, By Region, 2017 – 2022 (Kilo Tons) 43

Chapter No. 8 : Price Analysis  44

8.1.        Price Analysis by Region  44

8.1.1.    Global Alpha Olefin Market Price, By Region, 2017 – 2022  44

8.1.2.    Global Type Market Price, By Region, 2017 – 2022  44

8.2.        Price Analysis by Type  45

8.2.1.    Global Alpha Olefin Market Price, By Type, 2017 – 2022  45

8.2.2.    Global Type Market Price, By Type, 2017 – 2022  45

Chapter No. 9 : Raw Materials Analysis  46

9.1.        Key Raw Materials and Suppliers  46

9.2.        Key Raw Materials Price Trend  46

Chapter No. 10 :              Manufacturing Cost Analysis  47

10.1.     Manufacturing Cost Analysis  47

10.1.1.  Manufacturing Cost Analysis  47

10.2.     Manufacturing Process  47

10.2.1.  Manufacturing Process  47

Chapter No. 11 :              Analysis Competitive Landscape  48

11.1.     Company Market Share Analysis – 2022  48

11.1.1.  Global Alpha Olefin Market: Company Market Share, by Volume, 2022  48

11.1.2.  Global Alpha Olefin Market: Company Market Share, by Revenue2022  48

11.1.3.  Global Alpha Olefin Market: Top 6 Company Market Share, by Revenue2022  49

11.1.4.  Global Alpha Olefin Market: Top 3 Company Market Share, by Revenue2022  49

11.1.     Global Alpha Olefin Market Company Volume Market Share, 2022  50

11.2.     Global Alpha Olefin Market Company Revenue Market Share, 2022  51

11.3.     Company Assessment Metrics, 2022  52

11.3.1.  Stars  52

11.3.2.  Emerging Leaders  52

11.3.3.  Pervasive Players  52

11.3.4.  Participants  52

11.4.     Start-ups /SMEs Assessment Metrics, 2022  52

11.4.1.  Progressive Companies  52

11.4.2.  Responsive Companies  52

11.4.3.  Dynamic Companies  52

11.4.4.  Starting Blocks  52

11.5.     Strategic Developments  53

11.5.1.  Acquisitions & Mergers  53

11.5.2.  New Product Launch  53

11.5.3.  Regional Expansion  53

11.6.     Key Players Product Matrix  54

Chapter No. 12 :              PESTEL & Adjacent Market Analysis  55

12.1.     PESTEL  55

12.1.1.  Political Factors  55

12.1.2.  Economic Factors  55

12.1.3.  Social Factors  55

12.1.4.  Technological Factors  55

12.1.5.  Environmental Factors  55

12.1.6.  Legal Factors  55

12.2.     Adjacent Market Analysis  55

Chapter No. 13 :              Alpha Olefin Market – By Type Segment Analysis  56

13.1.     Alpha Olefin Market Overview, by Type Segment  56

13.1.1.  Alpha Olefin Market Volume Share, By Type, 2022 & 2030  57

13.1.2.  Alpha Olefin Market Revenue Share, By Type, 2022 & 2030  57

13.1.3.  Alpha Olefin Market Attractiveness Analysis, By Type  58

13.1.4.  Incremental Revenue Growth Opportunity, by Type, 2023 – 2030  58

13.1.5.  Alpha Olefin Market Revenue, By Type, 2017, 2022, 2026 & 2030  59

13.2.     1-butene  60

13.2.1.  Global 1-butene Alpha Olefin Market Volume & Revenue, By Region, 2017 – 2022 (Kilo Tons) (USD Million) 61

13.2.2.  Global 1-butene Alpha Olefin Market Volume & Revenue, By Region, 2017 – 2022 (Kilo Tons) (USD Million) 61

13.3.     1-hexene  62

13.3.1.  Global 1-hexene Alpha Olefin Market Volume & Revenue, By Region, 2017 – 2022 (Kilo Tons) (USD Million) 63

13.3.2.  Global 1-hexene Alpha Olefin Market Volume & Revenue, By Region, 2017 – 2022 (Kilo Tons) (USD Million) 63

13.4.     1-octene  64

13.4.1.  Global 1-octene Alpha Olefin Market Volume & Revenue, By Region, 2017 – 2022 (Kilo Tons) (USD Million) 65

13.4.2.  Global 1-octene Alpha Olefin Market Volume & Revenue, By Region, 2017 – 2022 (Kilo Tons) (USD Million) 65

13.5.     1-decene  66

13.5.1.  Global 1-decene Alpha Olefin Market Volume & Revenue, By Region, 2017 – 2022 (Kilo Tons) (USD Million) 67

13.5.2.  Global 1-decene Alpha Olefin Market Volume & Revenue, By Region, 2017 – 2022 (Kilo Tons) (USD Million) 67

13.6.     1-dodecene  68

13.6.1.  Global 1-dodecene Alpha Olefin Market Volume & Revenue, By Region, 2017 – 2022 (Kilo Tons) (USD Million) 69

13.6.2.  Global 1-dodecene Alpha Olefin Market Volume & Revenue, By Region, 2017 – 2022 (Kilo Tons) (USD Million) 69

Chapter No. 14 :              Alpha Olefin Market – By Application Segment Analysis  70

14.1.     Alpha Olefin Market Overview, by Application Segment  70

14.1.1.  Alpha Olefin Market Volume Share, By Application, 2022 & 2030  71

14.1.2.  Alpha Olefin Market Revenue Share, By Application, 2022 & 2030  71

14.1.3.  Alpha Olefin Market Attractiveness Analysis, By Application  72

14.1.4.  Incremental Revenue Growth Opportunity, by Application, 2023 – 2030  72

14.1.5.  Alpha Olefin Market Revenue, By Application, 2017, 2022, 2026 & 2030  73

14.2.     Polyolefin Co-monomers  74

14.2.1.  Global Polyolefin Co-monomers Alpha Olefin Market Volume & Revenue, By Region, 2017 – 2022 (Kilo Tons) (USD Million) 75

14.2.2.  Global Polyolefin Co-monomers Alpha Olefin Market Volume & Revenue, By Region, 2017 – 2022 (Kilo Tons) (USD Million) 75

14.3.     Surfactants and Intermediates  76

14.3.1.  Global Surfactants and Intermediates Alpha Olefin Market Volume & Revenue, By Region, 2017 – 2022 (Kilo Tons) (USD Million) 77

14.3.2.  Global Surfactants and Intermediates Alpha Olefin Market Volume & Revenue, By Region, 2017 – 2022 (Kilo Tons) (USD Million) 77

14.4.     Fine Chemicals  78

14.4.1.  Global Fine Chemicals Alpha Olefin Market Volume & Revenue, By Region, 2017 – 2022 (Kilo Tons) (USD Million) 79

14.4.2.  Global Fine Chemicals Alpha Olefin Market Volume & Revenue, By Region, 2017 – 2022 (Kilo Tons) (USD Million) 79

14.5.     Lubricants  80

14.5.1.  Global Lubricants Alpha Olefin Market Volume & Revenue, By Region, 2017 – 2022 (Kilo Tons) (USD Million) 81

14.5.2.  Global Lubricants Alpha Olefin Market Volume & Revenue, By Region, 2017 – 2022 (Kilo Tons) (USD Million) 81

14.6.     Plasticizers  82

14.6.1.  Global Plasticizers Alpha Olefin Market Volume & Revenue, By Region, 2017 – 2022 (Kilo Tons) (USD Million) 83

14.6.2.  Global Plasticizers Alpha Olefin Market Volume & Revenue, By Region, 2017 – 2022 (Kilo Tons) (USD Million) 83

Chapter No. 15 :              Alpha Olefin Market – Regional Analysis  84

15.1.     Alpha Olefin Market Overview, by Regional Segments  84

15.2.     Region  85

15.2.1.  Global Alpha Olefin Market Volume Share, By Region, 2022 & 2030  85

15.2.2.  Global Alpha Olefin Market Revenue Share, By Region, 2022 & 2030  85

15.2.3.  Alpha Olefin Market Attractiveness Analysis, By Region  86

15.2.4.  Incremental Revenue Growth Opportunity, by Region, 2023 – 2030  86

15.2.5.  Alpha Olefin Market Revenue, By Region, 2017, 2022, 2026 & 2030  87

15.2.6.  Global Alpha Olefin Market Volume & Revenue, By Region, 2017 – 2022 (Kilo Tons) (USD Million) 88

15.2.7.  Global Alpha Olefin Market Volume & Revenue, By Region, 2023 – 2030 (Kilo Tons) (USD Million) 88

15.3.     Type  89

15.3.1.  Global Alpha Olefin Market Volume & Revenue, By Type, 2017 – 2022 (Kilo Tons) (USD Million) 89

15.3.2.  Global Alpha Olefin Market Volume & Revenue, By Type, 2023 – 2030 (Kilo Tons) (USD Million) 89

15.4.     Application  90

15.4.1.  Global Alpha Olefin Market Volume & Revenue, By Application, 2017 – 2022 (Kilo Tons) (USD Million) 90

15.4.2.  Global Alpha Olefin Market Volume & Revenue, By Application, 2023 – 2030 (Kilo Tons) (USD Million) 90

Chapter No. 16 :              Alpha Olefin Market – North America  91

16.1.     North America  91

16.1.     Key Highlights  91

16.1.1.  North America Alpha Olefin Market Volume, By Country, 2017 – 2022 (Kilo Tons) 92

16.1.2.  North America Alpha Olefin Market Revenue, By Country, 2017 – 2022 (USD Million) 92

16.1.2.1.             North America Alpha Olefin Market Volume, By Type, 2017 – 2022 (Kilo Tons) 93

16.1.3.  North America Alpha Olefin Market Revenue, By Type, 2017 – 2022 (USD Million) 94

16.1.4.  North America Alpha Olefin Market Volume, By Application, 2017 – 2022 (Kilo Tons) 95

16.1.5.  North America Alpha Olefin Market Revenue, By Application, 2017 – 2022 (USD Million) 96

16.1.6.  U.S. 97

16.1.7.  Canada  97

16.1.8.  Mexico  97

Chapter No. 17 :              Alpha Olefin Market – Europe  98

17.1.     Europe  98

17.2.     Key Highlights  98

17.2.1.  Europe Alpha Olefin Market Volume, By Country, 2017 – 2022 (Kilo Tons) 99

17.2.2.  Europe Alpha Olefin Market Revenue, By Country, 2017 – 2022 (USD Million) 100

17.2.3.  Europe Alpha Olefin Market Volume, By Type, 2017 – 2022 (Kilo Tons) 101

17.2.4.  Europe Alpha Olefin Market Revenue, By Type, 2017 – 2022 (USD Million) 102

17.2.5.  Europe Alpha Olefin Market Volume, By Application, 2017 – 2022 (Kilo Tons) 103

17.2.6.  Europe Alpha Olefin Market Revenue, By Application, 2017 – 2022 (USD Million) 104

17.2.7.  UK  105

17.2.8.  France  105

17.2.9.  Germany  105

17.2.10.              Italy  105

17.2.11.              Spain  105

17.2.12.              Russia  105

17.2.13.              BENELUX  105

17.2.14.              Sweden  105

17.2.15.              Denmark  105

17.2.16.              Poland  105

17.2.17.              Austria  105

17.2.18.              Rest of Europe  105

Chapter No. 18 :              Alpha Olefin Market – Asia Pacific  106

18.1.     Asia Pacific  106

18.2.     Key Highlights  106

18.2.1.  Asia Pacific Alpha Olefin Market Volume, By Country, 2017 – 2022 (Kilo Tons) 107

18.2.2.  Asia Pacific Alpha Olefin Market Revenue, By Country, 2017 – 2022 (USD Million) 108

18.2.3.  Asia Pacific Alpha Olefin Market Volume, By Type, 2017 – 2022 (Kilo Tons) 109

18.2.4.  Asia Pacific Alpha Olefin Market Revenue, By Type, 2017 – 2022 (USD Million) 110

18.2.5.  Asia Pacific Alpha Olefin Market Volume, By Application, 2017 – 2022 (Kilo Tons) 111

18.2.6.  Asia Pacific Alpha Olefin Market Revenue, By Application, 2017 – 2022 (USD Million) 112

18.2.7.  China  113

18.2.8.  Japan  113

18.2.9.  South Korea  113

18.2.10.              India  113

18.2.11.              Thailand  113

18.2.12.              Indonesia  113

18.2.13.              Vietnam    113

18.2.14.              Malaysia  113

18.2.15.              Philippines  113

18.2.16.              Taiwan  113

18.2.17.              Rest of Asia Pacific  113

Chapter No. 19 :              Alpha Olefin Market – Latin America  114

19.1.     Latin America  114

19.2.     Key Highlights  114

19.2.1.  Latin America Alpha Olefin Market Volume, By Country, 2017 – 2022 (Kilo Tons) 115

19.2.2.  Latin America Alpha Olefin Market Revenue, By Country, 2017 – 2022 (USD Million) 116

19.2.3.  Latin America Alpha Olefin Market Volume, By Type, 2017 – 2022 (Kilo Tons) 117

19.2.4.  Latin America Alpha Olefin Market Revenue, By Type, 2017 – 2022 (USD Million) 118

19.2.5.  Latin America Alpha Olefin Market Volume, By Application, 2017 – 2022 (Kilo Tons) 119

19.2.6.  Latin America Alpha Olefin Market Revenue, By Application, 2017 – 2022 (USD Million) 120

19.2.7.  Brazil 121

19.2.8.  Argentina  121

19.2.9.  Colombia  121

19.2.10.              Chile  121

19.2.11.              Peru  121

19.2.12.              Rest of Latin America  121

Chapter No. 20 :              Alpha Olefin Market – Middle East  122

20.1.     The Middle-East  122

20.2.     Key Highlights  122

20.2.1.  Middle East Alpha Olefin Market Volume, By Country, 2017 – 2022 (Kilo Tons) 123

20.2.2.  Middle East Alpha Olefin Market Revenue, By Country, 2017 – 2022 (USD Million) 124

20.2.3.  Middle East Alpha Olefin Market Volume, By Type, 2017 – 2022 (Kilo Tons) 125

20.2.4.  Middle East Alpha Olefin Market Revenue, By Type, 2017 – 2022 (USD Million) 126

20.2.5.  Middle East Alpha Olefin Market Volume, By Application, 2017 – 2022 (Kilo Tons) 127

20.2.6.  Middle East Alpha Olefin Market Revenue, By Application, 2017 – 2022 (USD Million) 128

20.2.7.  GCC Countries  129

20.2.8.  Israel 129

20.2.9.  Turkey  129

20.2.10.              Iran  129

20.2.11.              Rest of Middle East & Africa  129

Chapter No. 21 :              Alpha Olefin Market – Africa  130

21.1.     Africa  130

21.2.     Key Highlights  130

21.2.1.  Africa Alpha Olefin Market Volume, By Country, 2017 – 2022 (Kilo Tons) 131

21.2.2.  Africa Alpha Olefin Market Revenue, By Country, 2017 – 2022 (USD Million) 132

21.2.3.  Africa Alpha Olefin Market Volume, By Type, 2017 – 2022 (Kilo Tons) 133

21.2.4.  Africa Alpha Olefin Market Revenue, By Type, 2017 – 2022 (USD Million) 134

21.2.5.  Africa Alpha Olefin Market Volume, By Application, 2017 – 2022 (Kilo Tons) 135

21.2.6.  Africa Alpha Olefin Market Revenue, By Application, 2017 – 2022 (USD Million) 136

21.2.7.  South Africa  137

21.2.8.  Egypt 137

21.2.9.  Nigeria  137

21.2.10.              Algeria  137

21.2.11.              Morocco  137

21.2.12.              Rest of Africa  137

Chapter No. 22 :              Company Profiles  138

22.1.     Shell Chemicals Limited  138

22.1.1.  Company Overview   138

22.1.2.  Product Portfolio  138

22.1.3.  Swot Analysis  138

22.1.4.  Business Strategy  139

22.1.5.  Financial Overview   139

22.2.     INEOS Oligomers  140

22.3.     Sinopec Beijing Yanhua  140

22.4.     Idemitsu Petrochemical Company Limited  140

22.5.     Nizhnekamskneftekhim    140

22.6.     Chevron Phillips Chemical Company LLC  140

22.7.     Sasol Limited  140

22.8.     ExxonMobil Corporation  140

22.9.     ONGC  140

22.10.   Qatar Chemical Company II Limited  140

22.11.   The Dow Chemical Company  140

22.12.   Royal Dutch Shell Plc. 140

22.13.   Mitsubishi Chemical Corporation  140

22.14.   Qatar Chemical Company Limited  140

22.15.   Saudi Arabia Basic Industries Corporation  140

22.16.   Evonik Industries AG   140

22.17.   TPC Group  140

22.18.   Ineos Group Limited  140

Chapter No. 23 :              Research Methodology  141

23.1.     Research Methodology  141

23.2.     Phase I – Secondary Research  142

23.3.     Phase II – Data Modeling  142

23.3.1.  Company Share Analysis Model 143

23.3.2.  Revenue Based Modeling  143

23.4.     Phase III – Primary Research  144

23.5.     Research Limitations  145

23.5.1.  Assumptions  145


List of Figures

FIG NO. 1.           Global Alpha Olefin Market Volume & Revenue, 2017 – 2022 (Kilo Tons) (USD Million) 28

FIG NO. 2.           Porter’s Five Forces Analysis for Global Alpha Olefin Market 36

FIG NO. 3.           Value Chain Analysis for Global Alpha Olefin Market 37

FIG NO. 4.           Global Alpha Olefin Market Import Volume/Revenue, By Region, 2017 – 2022  39

FIG NO. 5.           Global Alpha Olefin Market Export Volume/Revenue, By Region, 2017 – 2022  40

FIG NO. 6.           Global Alpha Olefin Market Demand Volume/Revenue, By Region, 2017 – 2022  41

FIG NO. 7.           Global Alpha Olefin Market Supply Volume/Revenue, By Region, 2017 – 2022  42

FIG NO. 8.           Global Alpha Olefin Market Production, By Region, 2017 – 2022  43

FIG NO. 9.           Global Alpha Olefin Market Price, By Region, 2017 – 2022  44

FIG NO. 10.        Global Alpha Olefin Market Price, By Type, 2017 – 2022  45

FIG NO. 11.        Raw Materials Price Trend Analysis, 2017 – 2022  46

FIG NO. 12.        Manufacturing Cost Analysis  47

FIG NO. 13.        Manufacturing Process  47

FIG NO. 14.        Company Share Analysis, 2022  48

FIG NO. 15.        Company Share Analysis, 2022  48

FIG NO. 16.        Company Share Analysis, 2022  49

FIG NO. 17.        Company Share Analysis, 2022  49

FIG NO. 18.        Alpha Olefin Market – Company Volume  Market Share, 2022  50

FIG NO. 19.        Alpha Olefin Market – Company Revenue Market Share, 2022  51

FIG NO. 20.        Alpha Olefin Market Volume Share, By Type, 2022 & 2030  57

FIG NO. 21.        Alpha Olefin Market Revenue Share, By Type, 2022 & 2030  57

FIG NO. 22.        Market Attractiveness Analysis, By Type  58

FIG NO. 23.        Incremental Revenue Growth Opportunity by Type  58

FIG NO. 24.        Alpha Olefin Market Revenue, By Type, 2017, 2022, 2026 & 2030  59

FIG NO. 25.        Global Alpha Olefin Market for 1-butene, Volume & Revenue (Kilo Tons) (USD Million) 2017 – 2030  60

FIG NO. 26.        Global Alpha Olefin Market for 1-hexene, Volume & Revenue (Kilo Tons) (USD Million) 2017 – 2030  62

FIG NO. 27.        Global Alpha Olefin Market for 1-octene, Volume & Revenue (Kilo Tons) (USD Million) 2017 – 2030  64

FIG NO. 28.        Global Alpha Olefin Market for 1-decene, Volume & Revenue (Kilo Tons) (USD Million) 2017 – 2030  66

FIG NO. 29.        Global Alpha Olefin Market for 1-dodecene, Volume & Revenue (Kilo Tons) (USD Million) 2017 – 2030  68

FIG NO. 30.        Alpha Olefin Market Volume Share, By Application, 2022 & 2030  71

FIG NO. 31.        Alpha Olefin Market Revenue Share, By Application, 2022 & 2030  71

FIG NO. 32.        Market Attractiveness Analysis, By Application  72

FIG NO. 33.        Incremental Revenue Growth Opportunity by Application  72

FIG NO. 34.        Alpha Olefin Market Revenue, By Application, 2017, 2022, 2026 & 2030  73

FIG NO. 35.        Global Alpha Olefin Market for Polyolefin Co-monomers, Volume & Revenue (Kilo Tons) (USD Million) 2017 – 2030  74

FIG NO. 36.        Global Alpha Olefin Market for Surfactants and Intermediates, Volume & Revenue (Kilo Tons) (USD Million) 2017 – 2030  76

FIG NO. 37.        Global Alpha Olefin Market for Fine Chemicals, Volume & Revenue (Kilo Tons) (USD Million) 2017 – 2030  78

FIG NO. 38.        Global Alpha Olefin Market for Lubricants, Volume & Revenue (Kilo Tons) (USD Million) 2017 – 2030  80

FIG NO. 39.        Global Alpha Olefin Market for Plasticizers, Volume & Revenue (Kilo Tons) (USD Million) 2017 – 2030  82

FIG NO. 40.        Global Alpha Olefin Market Volume Share, By Region, 2022 & 2030  85

FIG NO. 41.        Global Alpha Olefin Market Revenue Share, By Region, 2022 & 2030  85

FIG NO. 42.        Market Attractiveness Analysis, By Region  86

FIG NO. 43.        Incremental Revenue Growth Opportunity by Region  86

FIG NO. 44.        Alpha Olefin Market Revenue, By Region, 2017, 2022, 2026 & 2030  87

FIG NO. 45.        North America Alpha Olefin Market Volume & Revenue, 2017 – 2022 (Kilo Tons) (USD Million) 91

FIG NO. 46.        Europe Alpha Olefin Market Volume & Revenue, 2017 – 2022 (Kilo Tons) (USD Million) 98

FIG NO. 47.        Asia Pacific Alpha Olefin Market Volume & Revenue, 2017 – 2022 (Kilo Tons) (USD Million) 106

FIG NO. 48.        Latin America Alpha Olefin Market Volume & Revenue, 2017 – 2022 (Kilo Tons) (USD Million) 114

FIG NO. 49.        The Middle-East Alpha Olefin Market Volume & Revenue, 2017 – 2022 (Kilo Tons) (USD Million) 122

FIG NO. 50.        Africa Alpha Olefin Market Volume & Revenue, 2017 – 2022 (Kilo Tons) (USD Million) 130

FIG NO. 51.        Research Methodology – Detailed View   141

FIG NO. 52.        Research Methodology  142


List of Tables

l

TABLE NO. 1. :   Global Alpha Olefin Market: Snapshot 28

TABLE NO. 2. :   Drivers for the Alpha Olefin Market: Impact Analysis  33

TABLE NO. 3. :   Restraints for the Alpha Olefin Market: Impact Analysis  35

TABLE NO. 4. :   Global Alpha Olefin Market Volume & Revenue, By Region, 2017 – 2022 (Kilo Tons) 44

TABLE NO. 5. :   Global Alpha Olefin Market Volume & Revenue, By Region, 2017 – 2022  45

TABLE NO. 6. :   Global Alpha Olefin Market Volume & Revenue, By Type, 2017 – 2022  46

TABLE NO. 7. :   Key Raw Materials & Suppliers  47

TABLE NO. 8. :   Global 1-butene Alpha Olefin Market Volume & Revenue, By Region, 2017 – 2022 (Kilo Tons) (USD Million) 62

TABLE NO. 9. :   Global 1-butene Alpha Olefin Market Volume & Revenue, By Region, 2023– 2030 (Kilo Tons) (USD Million) 62

TABLE NO. 10. : Global 1-hexene Alpha Olefin Market Volume & Revenue, By Region, 2017 – 2022 (Kilo Tons) (USD Million) 64

TABLE NO. 11. : Global 1-hexene Alpha Olefin Market Volume & Revenue, By Region, 2023– 2030 (Kilo Tons) (USD Million) 64

TABLE NO. 12. : Global 1-octene Alpha Olefin Market Volume & Revenue, By Region, 2017 – 2022 (Kilo Tons) (USD Million) 66

TABLE NO. 13. : Global 1-octene Alpha Olefin Market Volume & Revenue, By Region, 2023– 2030 (Kilo Tons) (USD Million) 66

TABLE NO. 14. : Global 1-decene Alpha Olefin Market Volume & Revenue, By Region, 2017 – 2022 (Kilo Tons) (USD Million) 68

TABLE NO. 15. : Global 1-decene Alpha Olefin Market Volume & Revenue, By Region, 2023– 2030 (Kilo Tons) (USD Million) 68

TABLE NO. 16. : Global 1-dodecene Alpha Olefin Market Volume & Revenue, By Region, 2017 – 2022 (Kilo Tons) (USD Million) 70

TABLE NO. 17. : Global 1-dodecene Alpha Olefin Market Volume & Revenue, By Region, 2023– 2030 (Kilo Tons) (USD Million) 70

TABLE NO. 18. : Global Polyolefin Co-monomers Alpha Olefin Market Volume & Revenue, By Region, 2017 – 2022 (Kilo Tons) (USD Million) 76

TABLE NO. 19. : Global Polyolefin Co-monomers Alpha Olefin Market Volume & Revenue, By Region, 2023– 2030 (Kilo Tons) (USD Million) 76

TABLE NO. 20. : Global Surfactants and Intermediates Alpha Olefin Market Volume & Revenue, By Region, 2017 – 2022 (Kilo Tons) (USD Million) 78

TABLE NO. 21. : Global Surfactants and Intermediates Alpha Olefin Market Volume & Revenue, By Region, 2023– 2030 (Kilo Tons) (USD Million) 78

TABLE NO. 22. : Global Fine Chemicals Alpha Olefin Market Volume & Revenue, By Region, 2017 – 2022 (Kilo Tons) (USD Million) 80

TABLE NO. 23. : Global Fine Chemicals Alpha Olefin Market Volume & Revenue, By Region, 2023– 2030 (Kilo Tons) (USD Million) 80

TABLE NO. 24. : Global Lubricants Alpha Olefin Market Volume & Revenue, By Region, 2017 – 2022 (Kilo Tons) (USD Million) 82

TABLE NO. 25. : Global Lubricants Alpha Olefin Market Volume & Revenue, By Region, 2023– 2030 (Kilo Tons) (USD Million) 82

TABLE NO. 26. : Global Plasticizers Alpha Olefin Market Volume & Revenue, By Region, 2017 – 2022 (Kilo Tons) (USD Million) 84

TABLE NO. 27. : Global Plasticizers Alpha Olefin Market Volume & Revenue, By Region, 2023– 2030 (Kilo Tons) (USD Million) 84

TABLE NO. 28. : Global Alpha Olefin Market Volume & Revenue, By Region, 2017 – 2022 (Kilo Tons) (USD Million) 89

TABLE NO. 29. : Global Alpha Olefin Market Volume & Revenue, By Region, 2023– 2030 (Kilo Tons) (USD Million) 89

TABLE NO. 30. : Global Alpha Olefin Market Volume & Revenue, By Type, 2017 – 2022 (Kilo Tons) (USD Million) 90

TABLE NO. 31. : Global Alpha Olefin Market Volume & Revenue, By Type, 2023– 2030 (Kilo Tons) (USD Million) 90

TABLE NO. 32. : Global Alpha Olefin Market Volume & Revenue, By Application, 2017 – 2022 (Kilo Tons) (USD Million) 91

TABLE NO. 33. : Global Alpha Olefin Market Volume & Revenue, By Application, 2023– 2030 (Kilo Tons) (USD Million) 91

TABLE NO. 34. : North America Alpha Olefin Market Volume, By Country, 2017 – 2022 (Kilo Tons) 93

TABLE NO. 35. : North America Alpha Olefin Market Volume, By Country, 2023– 2030 (Kilo Tons) 93

TABLE NO. 36. : North America Alpha Olefin Market Revenue, By Country, 2017 – 2022 (USD Million) 93

TABLE NO. 37. : North America Alpha Olefin Market Revenue, By Country, 2023– 2030 (USD Million) 93

TABLE NO. 38. : North America Alpha Olefin Market Volume, By Type, 2017 – 2022 (Kilo Tons) 94

TABLE NO. 39. : North America Alpha Olefin Market Volume, By Type, 2023– 2030 (Kilo Tons) 94

TABLE NO. 40. : North America Alpha Olefin Market Revenue, By Type, 2017 – 2022 (USD Million) 95

TABLE NO. 41. : North America Alpha Olefin Market Revenue, By Type, 2023– 2030 (USD Million) 95

TABLE NO. 42. : North America Alpha Olefin Market Volume, By Application, 2017 – 2022 (Kilo Tons) 96

TABLE NO. 43. : North America Alpha Olefin Market Volume, By Application, 2023– 2030 (Kilo Tons) 96

TABLE NO. 44. : North America Alpha Olefin Market Revenue, By Application, 2017 – 2022 (USD Million) 97

TABLE NO. 45. : North America Alpha Olefin Market Revenue, By Application, 2023– 2030 (USD Million) 97

TABLE NO. 46. : Europe Alpha Olefin Market Volume, By Country, 2017 – 2022 (Kilo Tons) 100

TABLE NO. 47. : Europe Alpha Olefin Market Volume, By Country, 2023– 2030 (Kilo Tons) 100

TABLE NO. 48. : Europe Alpha Olefin Market Revenue, By Country, 2017 – 2022 (USD Million) 101

TABLE NO. 49. : Europe Alpha Olefin Market Revenue, By Country, 2023– 2030 (USD Million) 101

TABLE NO. 50. : Europe Alpha Olefin Market Volume, By Type, 2017 – 2022 (Kilo Tons) 102

TABLE NO. 51. : Europe Alpha Olefin Market Volume, By Type, 2023– 2030 (Kilo Tons) 102

TABLE NO. 52. : Europe Alpha Olefin Market Revenue, By Type, 2017 – 2022 (USD Million) 103

TABLE NO. 53. : Europe Alpha Olefin Market Revenue, By Type, 2023– 2030 (USD Million) 103

TABLE NO. 54. : Europe Alpha Olefin Market Volume, By Application, 2017 – 2022 (Kilo Tons) 104

TABLE NO. 55. : Europe Alpha Olefin Market Volume, By Application, 2023– 2030 (Kilo Tons) 104

TABLE NO. 56. : Europe Alpha Olefin Market Revenue, By Application, 2017 – 2022 (USD Million) 105

TABLE NO. 57. : Europe Alpha Olefin Market Revenue, By Application, 2023– 2030 (USD Million) 105

TABLE NO. 58. : Asia Pacific Alpha Olefin Market Volume, By Country, 2017 – 2022 (Kilo Tons) 108

TABLE NO. 59. : Asia Pacific Alpha Olefin Market Volume, By Country, 2023– 2030 (Kilo Tons) 108

TABLE NO. 60. : Asia Pacific Alpha Olefin Market Revenue, By Country, 2017 – 2022 (USD Million) 109

TABLE NO. 61. : Asia Pacific Alpha Olefin Market Revenue, By Country, 2023– 2030 (USD Million) 109

TABLE NO. 62. : Asia Pacific Alpha Olefin Market Volume, By Type, 2017 – 2022 (Kilo Tons) 110

TABLE NO. 63. : Asia Pacific Alpha Olefin Market Volume, By Type, 2023– 2030 (Kilo Tons) 110

TABLE NO. 64. : Asia Pacific Alpha Olefin Market Revenue, By Type, 2017 – 2022 (USD Million) 111

TABLE NO. 65. : Asia Pacific Alpha Olefin Market Revenue, By Type, 2023– 2030 (USD Million) 111

TABLE NO. 66. : Asia Pacific Alpha Olefin Market Volume, By Application, 2017 – 2022 (Kilo Tons) 112

TABLE NO. 67. : Asia Pacific Alpha Olefin Market Volume, By Application, 2023– 2030 (Kilo Tons) 112

TABLE NO. 68. : Asia Pacific Alpha Olefin Market Revenue, By Application, 2017 – 2022 (USD Million) 113

TABLE NO. 69. : Asia Pacific Alpha Olefin Market Revenue, By Application, 2023– 2030 (USD Million) 113

TABLE NO. 70. : Latin America Alpha Olefin Market Volume, By Country, 2017 – 2022 (Kilo Tons) 116

TABLE NO. 71. : Latin America Alpha Olefin Market Volume, By Country, 2023– 2030 (Kilo Tons) 116

TABLE NO. 72. : Latin America Alpha Olefin Market Revenue, By Country, 2017 – 2022 (USD Million) 117

TABLE NO. 73. : Latin America Alpha Olefin Market Revenue, By Country, 2023– 2030 (USD Million) 117

TABLE NO. 74. : Latin America Alpha Olefin Market Volume, By Type, 2017 – 2022 (Kilo Tons) 118

TABLE NO. 75. : Latin America Alpha Olefin Market Volume, By Type, 2023– 2030 (Kilo Tons) 118

TABLE NO. 76. : Latin America Alpha Olefin Market Revenue, By Type, 2017 – 2022 (USD Million) 119

TABLE NO. 77. : Latin America Alpha Olefin Market Revenue, By Type, 2023– 2030 (USD Million) 119

TABLE NO. 78. : Latin America Alpha Olefin Market Volume, By Application, 2017 – 2022 (Kilo Tons) 120

TABLE NO. 79. : Latin America Alpha Olefin Market Volume, By Application, 2023– 2030 (Kilo Tons) 120

TABLE NO. 80. : Latin America Alpha Olefin Market Revenue, By Application, 2017 – 2022 (USD Million) 121

TABLE NO. 81. : Latin America Alpha Olefin Market Revenue, By Application, 2023– 2030 (USD Million) 121

TABLE NO. 82. : Middle East Alpha Olefin Market Volume, By Country, 2017 – 2022 (Kilo Tons) 124

TABLE NO. 83. : Middle East Alpha Olefin Market Volume, By Country, 2023– 2030 (Kilo Tons) 124

TABLE NO. 84. : Middle East Alpha Olefin Market Revenue, By Country, 2017 – 2022 (USD Million) 125

TABLE NO. 85. : Middle East Alpha Olefin Market Revenue, By Country, 2023– 2030 (USD Million) 125

TABLE NO. 86. : Middle East Alpha Olefin Market Volume, By Type, 2017 – 2022 (Kilo Tons) 126

TABLE NO. 87. : Middle East Alpha Olefin Market Volume, By Type, 2023– 2030 (Kilo Tons) 126

TABLE NO. 88. : Middle East Alpha Olefin Market Revenue, By Type, 2017 – 2022 (USD Million) 127

TABLE NO. 89. : Middle East Alpha Olefin Market Revenue, By Type, 2023– 2030 (USD Million) 127

TABLE NO. 90. : Middle East Alpha Olefin Market Volume, By Application, 2017 – 2022 (Kilo Tons) 128

TABLE NO. 91. : Middle East Alpha Olefin Market Volume, By Application, 2023– 2030 (Kilo Tons) 128

TABLE NO. 92. : Middle East Alpha Olefin Market Revenue, By Application, 2017 – 2022 (USD Million) 129

TABLE NO. 93. : Middle East Alpha Olefin Market Revenue, By Application, 2023– 2030 (USD Million) 129

TABLE NO. 94. : Africa Alpha Olefin Market Volume, By Country, 2017 – 2022 (Kilo Tons) 132

TABLE NO. 95. : Africa Alpha Olefin Market Volume, By Country, 2023– 2030 (Kilo Tons) 132

TABLE NO. 96. : Africa Alpha Olefin Market Revenue, By Country, 2017 – 2022 (USD Million) 133

TABLE NO. 97. : Africa Alpha Olefin Market Revenue, By Country, 2023– 2030 (USD Million) 133

TABLE NO. 98. : Africa Alpha Olefin Market Volume, By Type, 2017 – 2022 (Kilo Tons) 134

TABLE NO. 99. : Africa Alpha Olefin Market Volume, By Type, 2023– 2030 (Kilo Tons) 134

TABLE NO. 100. :             Africa Alpha Olefin Market Revenue, By Type, 2017 – 2022 (USD Million) 135

TABLE NO. 101. :             Africa Alpha Olefin Market Revenue, By Type, 2023– 2030 (USD Million) 135

TABLE NO. 102. :             Africa Alpha Olefin Market Volume, By Application, 2017 – 2022 (Kilo Tons) 136

TABLE NO. 103. :             Africa Alpha Olefin Market Volume, By Application, 2023– 2030 (Kilo Tons) 136

TABLE NO. 104. :             Africa Alpha Olefin Market Revenue, By Application, 2017 – 2022 (USD Million) 137

TABLE NO. 105. :             Africa Alpha Olefin Market Revenue, By Application, 2023– 2030 (USD Million) 137


Frequently Asked Questions

What is the size of Alpha Olefins Market?

The market for Alpha Olefins is expected to reach XX Bn in 2024.

What is the Alpha Olefins Market CAGR?

The Alpha Olefins market is expected to see significant CAGR growth over the coming years, at XX%.

What is the Forecast period considered for Alpha Olefins Market?

The report is forecasted from 2016-2024.

What is the base year considered for Alpha Olefins Market?

The base year of this report is 2023.

Who are the major players in this market?

Competitive Dashboard, Key Alpha Olefins Manufacturers, Chevron Phillips Chemical Company LLC., Business Description, Financial Performance, Product Portfolio, Key Developments, Dow Chemical Co. are some of the major players in the global market.

Cosmetic Ingredients Market

Published:
Report ID: 3703

Hydrocolloids Market

Published:
Report ID: 36265

Ion Exchange Resins Market

Published:
Report ID: 36220

Herbal Extract Market

Published:
Report ID: 36211

Fiber Reinforced Polymer (FRP) Composites Market

Published:
Report ID: 36197

Bio-based Polycarbonate Market

Published:
Report ID: 36188

Middle East and Africa Carbon Black Market

Published:
Report ID: 36181

India Thermic Fluids Market

Published:
Report ID: 36178

Europe Green Hydrogen Market

Published:
Report ID: 36175

Dodecanedioic Acid Market

Published:
Report ID: 36167

Asia Pacific Nickel Mining Market

Published:
Report ID: 36084

Asphalt Additives Market

Published:
Report ID: 36074

Purchase Options

$2999
Delivery Format: Excel.
$4999
Designed for the individual purchaser.
$6999
Users located at a single corporate site or regional office.
$7999
Allowed for unlimited sharing globally within one company.
Smallform of Sample request

Have a question?

User Profile

Don’t settle for less – trust Mitul to help you find the best solution.

Report delivery within 24 to 48 hours

– Other Info –

What people say?-

User Review

I am very impressed with the information in this report. The author clearly did their research when they came up with this product and it has already given me a lot of ideas.

Jana Schmidt
CEDAR CX Technologies

– Connect with us –

Phone

+91 6232 49 3207


support

24/7 Research Support


sales@credenceresearch.com

– Research Methodology –

Going beyond the basics: advanced techniques in research methodology

– Trusted By –

Pepshi, LG, Nestle
Motorola, Honeywell, Johnson and johnson
LG Chem, SIEMENS, Pfizer
Unilever, Samsonite, QIAGEN