
Tractor replacement and precision kit set farm demand
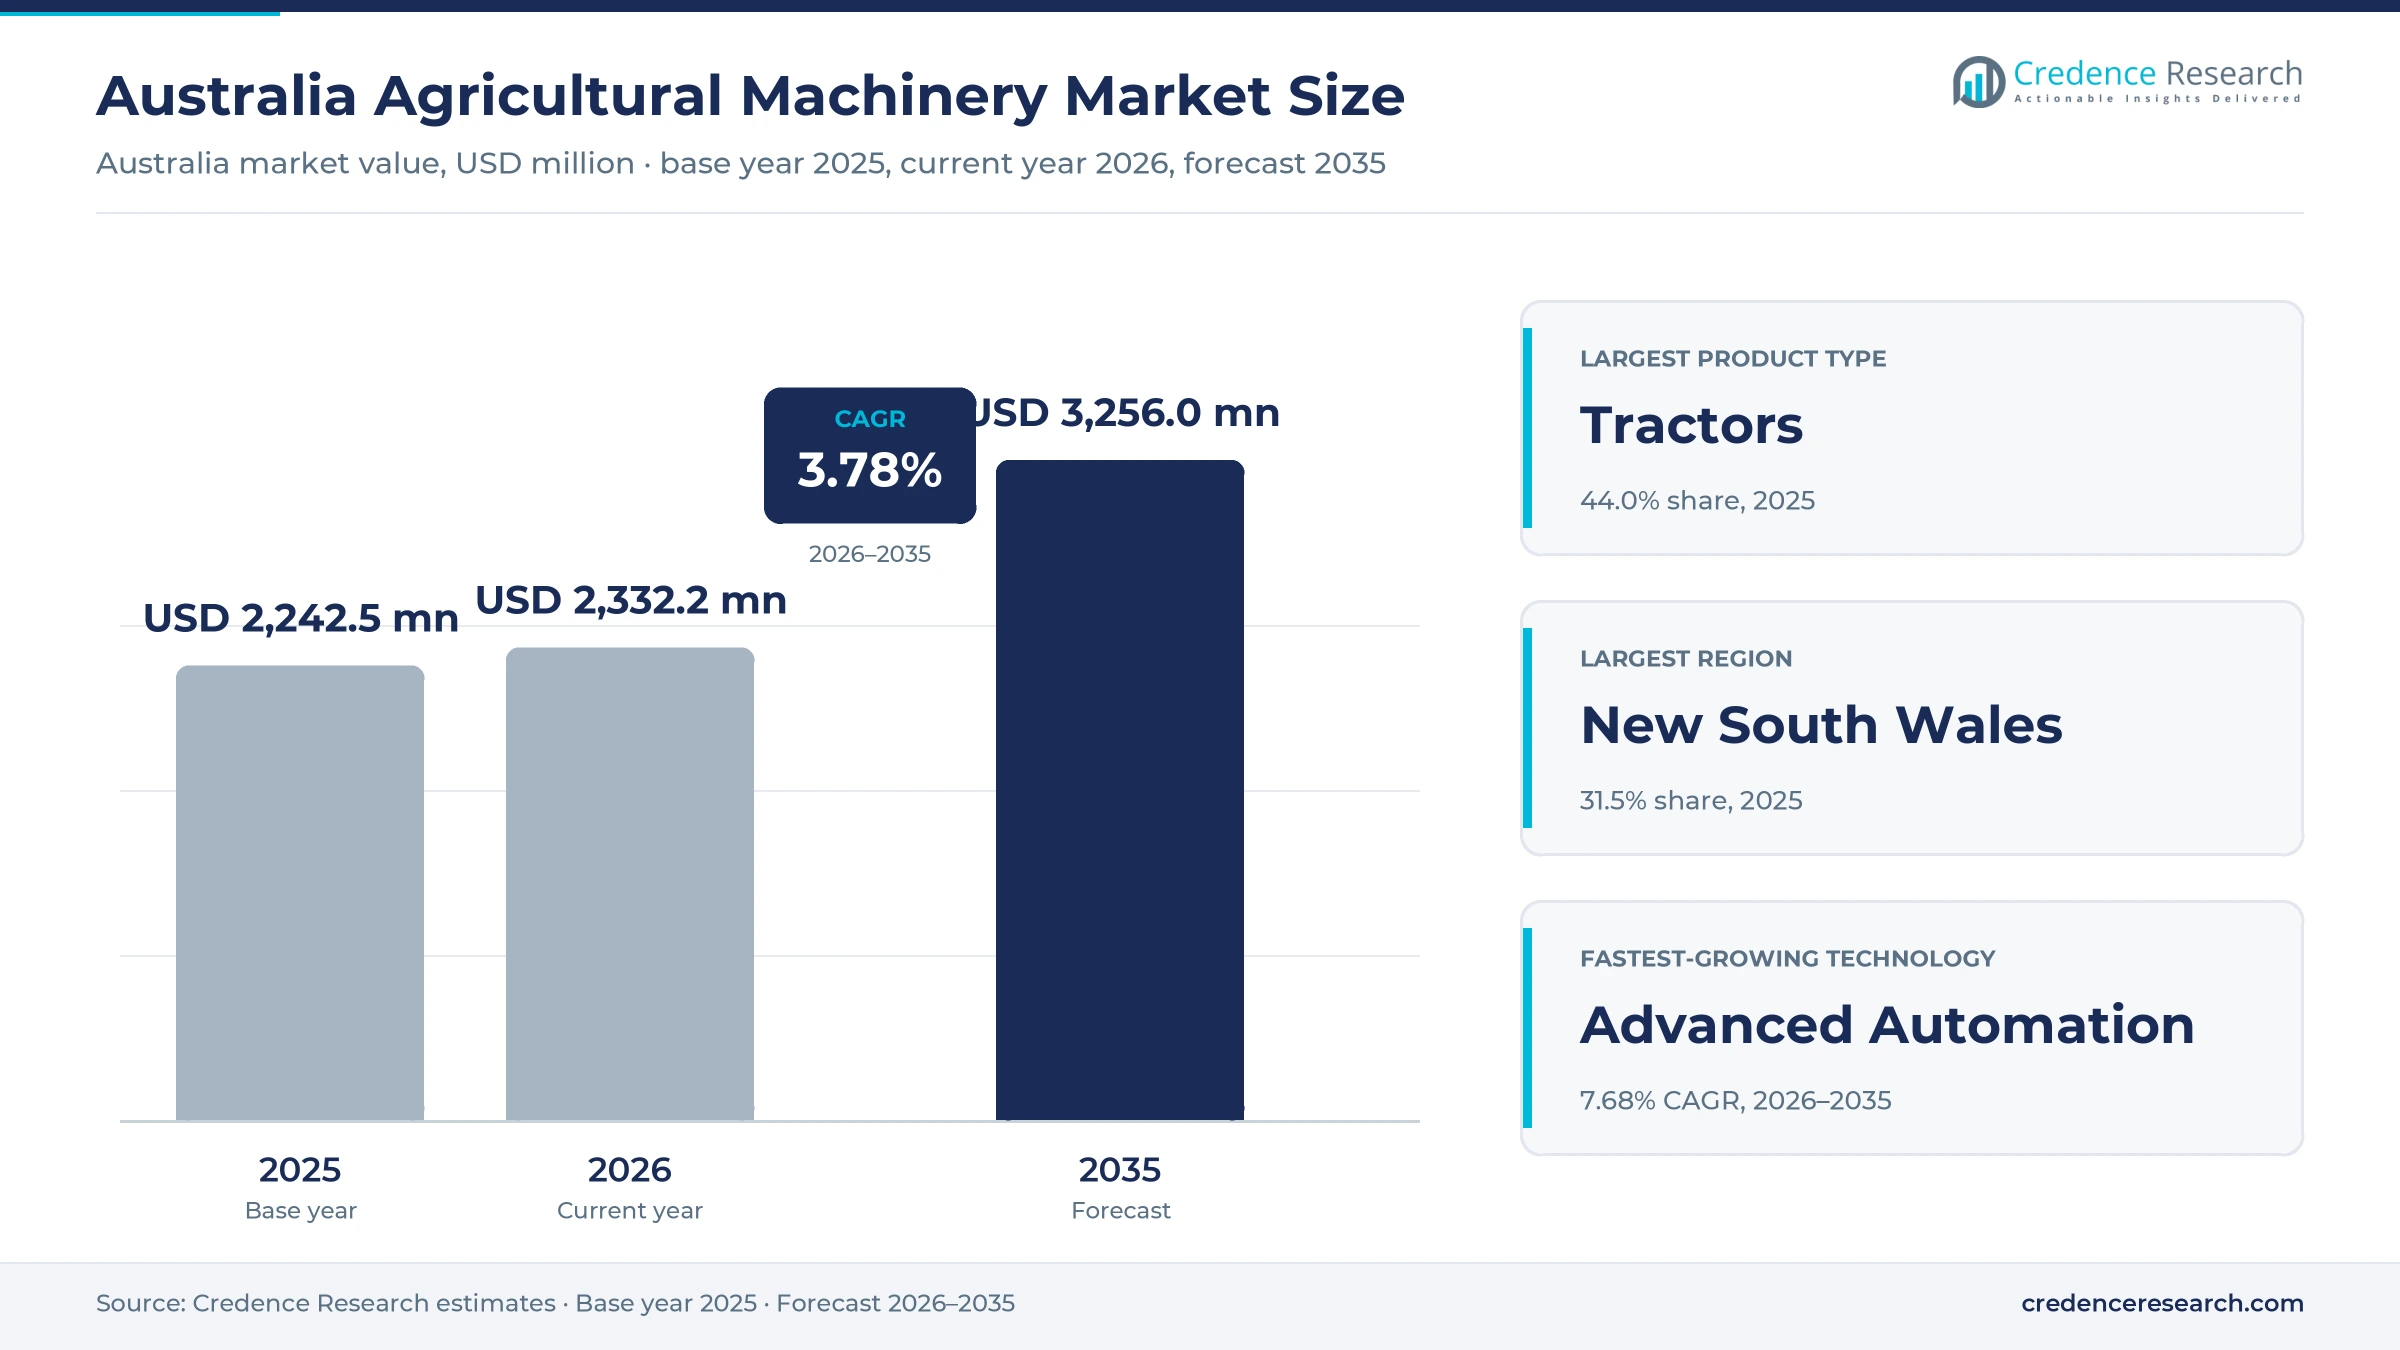
The Australia agricultural machinery market was valued at USD 2.24 billion in 2025 and is projected to increase from USD 2.33 billion in 2026 to USD 3.26 billion by 2035, registering a CAGR of 3.78% during 2026–2035. Demand rests on the replacement of tractors, headers and sprayers across grain, livestock and horticulture farms, after three years of falling unit sales left many fleets older. New South Wales held the largest regional share, 31.5% in 2025, because it combines large winter crop areas with the biggest state tractor fleet. Western Australia is the fastest-growing region at 4.26% a year, as its grain belt produced the largest state winter crop in 2025-26. Meanwhile, the Australian Government made the A$20,000 instant asset write-off permanent from July 1, 2026, which supports smaller equipment purchases by family farms. As a result, spending is shifting toward guided sprayers, seeders and tractors that save labor, fuel and chemicals on every pass.
What does the estimate count on Australian farms?
The estimate counts new tractors, combine harvesters, crop establishment and protection equipment such as seeders, tillage tools and sprayers, and forage and farm support equipment such as balers and hay tools sold in Australia. It covers sales to owner-operated farms, agricultural contractors and corporate or public farm operators through authorized dealers, direct manufacturer sales and specialist implement distributors.
The estimate excludes used machines, parts and service revenue, irrigation systems, quad bikes, utility vehicles and construction or forestry equipment. The value chain runs from mostly imported machines through national distributors and dealer networks to the farm, where finance terms and trade-in values shape each purchase decision.
Australia Agricultural Machinery Market Insights
- The Australia agricultural machinery market was valued at USD 2.24 billion in 2025 and is projected to reach USD 3.26 billion by 2035, registering a CAGR of 3.78% during 2026–2035.
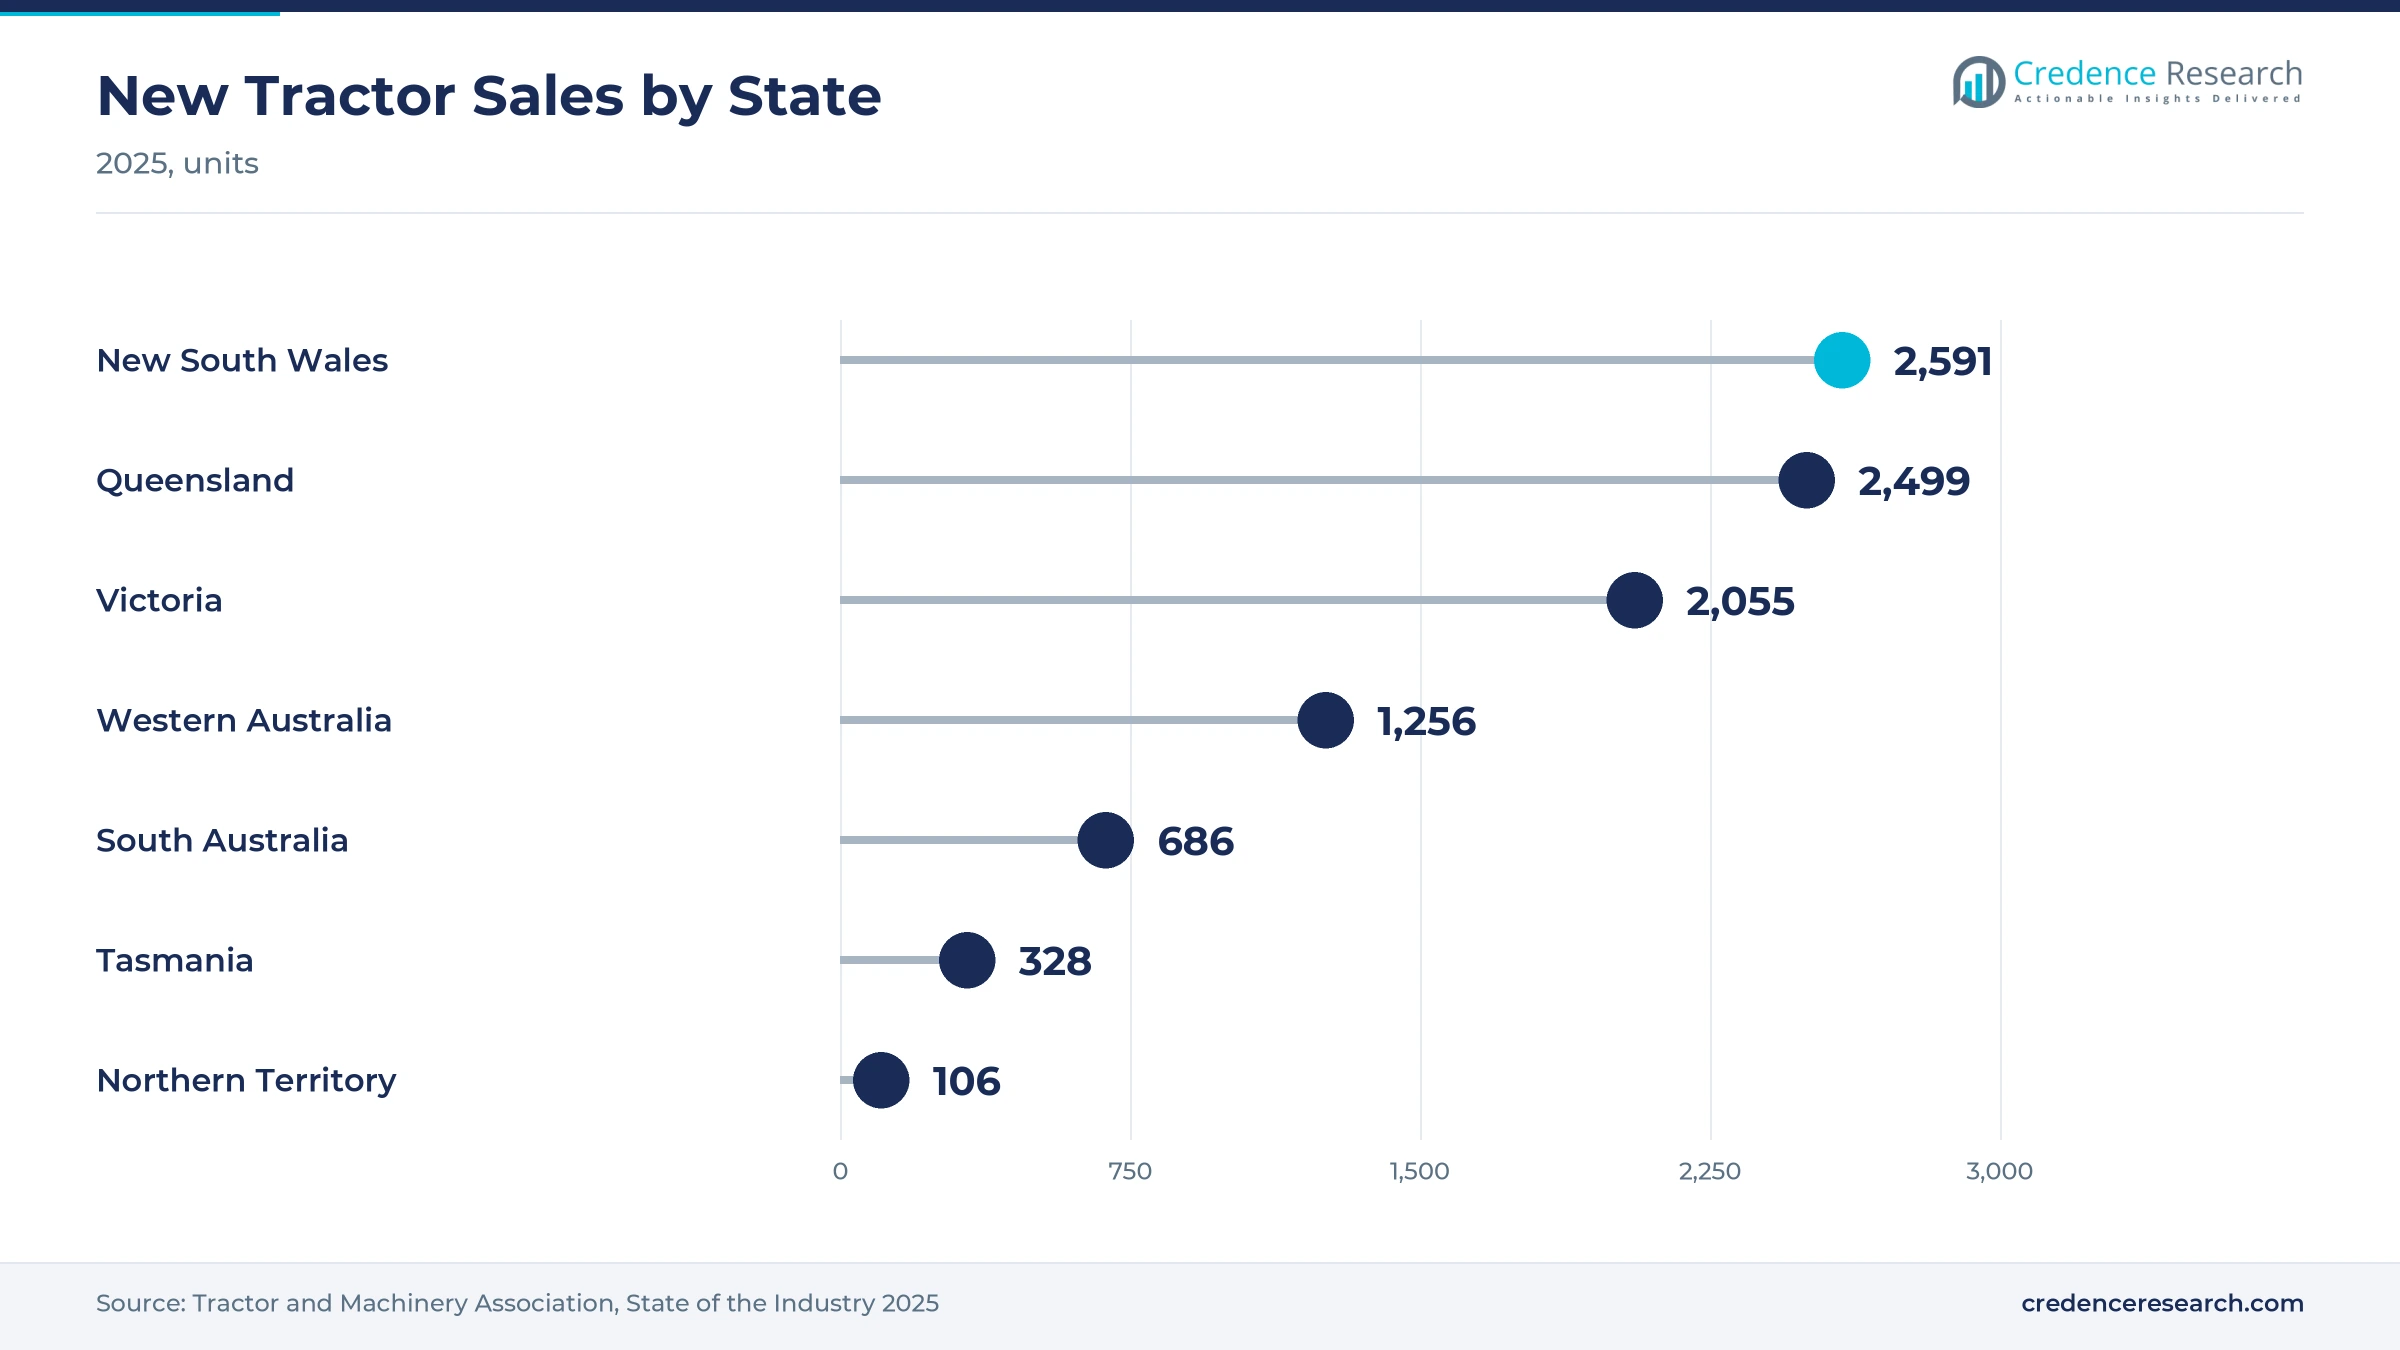
- New South Wales held 31.5% of 2025 value, because it bought 2,591 new tractors in 2025, the most of any state in industry data.
- Tractors led product demand with 44.0% of 2025 value, as tractor sales reached A$1.7 billion in 2025, the largest category in industry data.
- New tractor sales fell 7% to 9,521 units in 2025, the lowest level since before 2020, which built a replacement backlog for coming seasons.
- John Deere reported See & Spray use on more than 10 million acres across Australia by September 2026, with average herbicide savings of 74%.
Tractors lead while sprayers and seeders grow fastest
Why do tractors hold the largest product share?
Based on product type, the market is categorized into tractors, combine harvesters, crop establishment and protection equipment, and forage and farm support equipment. Tractors led with 44.0% of 2025 value, because every farm type needs tractor power, and tractor sales reached A$1.7 billion in 2025. Crop Establishment and Protection Equipment grows fastest at 4.30% a year, as growers replace sprayers and seeders with guided, section-controlled units that cut spending on crop protection chemicals and seed.
Which farm types spend most on new equipment?
Based on application, the market is categorized into broadacre grain cropping, livestock and dairy farming, horticulture and specialty crops and farm support. Broadacre Grain Cropping led with 48.0% of 2025 value, because headers, large tractors and air seeders serve a winter crop that ABARES forecast at 66.3 million metric tons in 2025-26. Horticulture grows fastest at 4.49% a year, as orchards and vegetable farms mechanize spraying and handling to reduce seasonal labor needs.
How far has guidance spread across new machines?
Based on technology, the market is categorized into conventional equipment, satellite-guided equipment, precision agriculture enabled equipment, and advanced automation and low-emission equipment. Satellite-Guided Equipment led with 38.0% of 2025 value, because autosteer is now a standard option on mid-size and large tractors, headers and sprayers. Advanced Automation and Low-Emission Equipment grows fastest at 7.68% a year from a small base, as growers trial autonomous tractors and camera-guided spraying.
Who buys most new equipment in Australia?
Based on customer type, the market is categorized into owner-operated farms, agricultural contractors and corporate and public farm operators. Owner-Operated Farms led with 62.0% of 2025 value, because family businesses still run most cropping and grazing properties and buy through local dealers. Corporate and Public Farm Operators grow fastest at 4.38% a year, as large aggregations standardize fleets, guidance systems and data platforms across many properties.
| Segment Group | Leading Sub-segment | Share, 2025 | Fastest-growing Sub-segment | CAGR, 2026–2035 |
|---|---|---|---|---|
| By Product Type | Tractors | 44.0% | Crop Establishment and Protection Equipment | 4.30% |
| By Application | Broadacre Grain Cropping | 48.0% | Horticulture | 4.49% |
| By Technology | Satellite-Guided Equipment | 38.0% | Advanced Automation and Low-Emission Equipment | 7.68% |
| By Customer Type | Owner-Operated Farms | 62.0% | Corporate and Public Farm Operators | 4.38% |
Request a Free Sample
Fill in your details and we'll send you a free sample report.
- Sample data tables & charts
- Research methodology
Replacement backlog, guidance and safety lift spending
Why will older fleets need replacing soon?
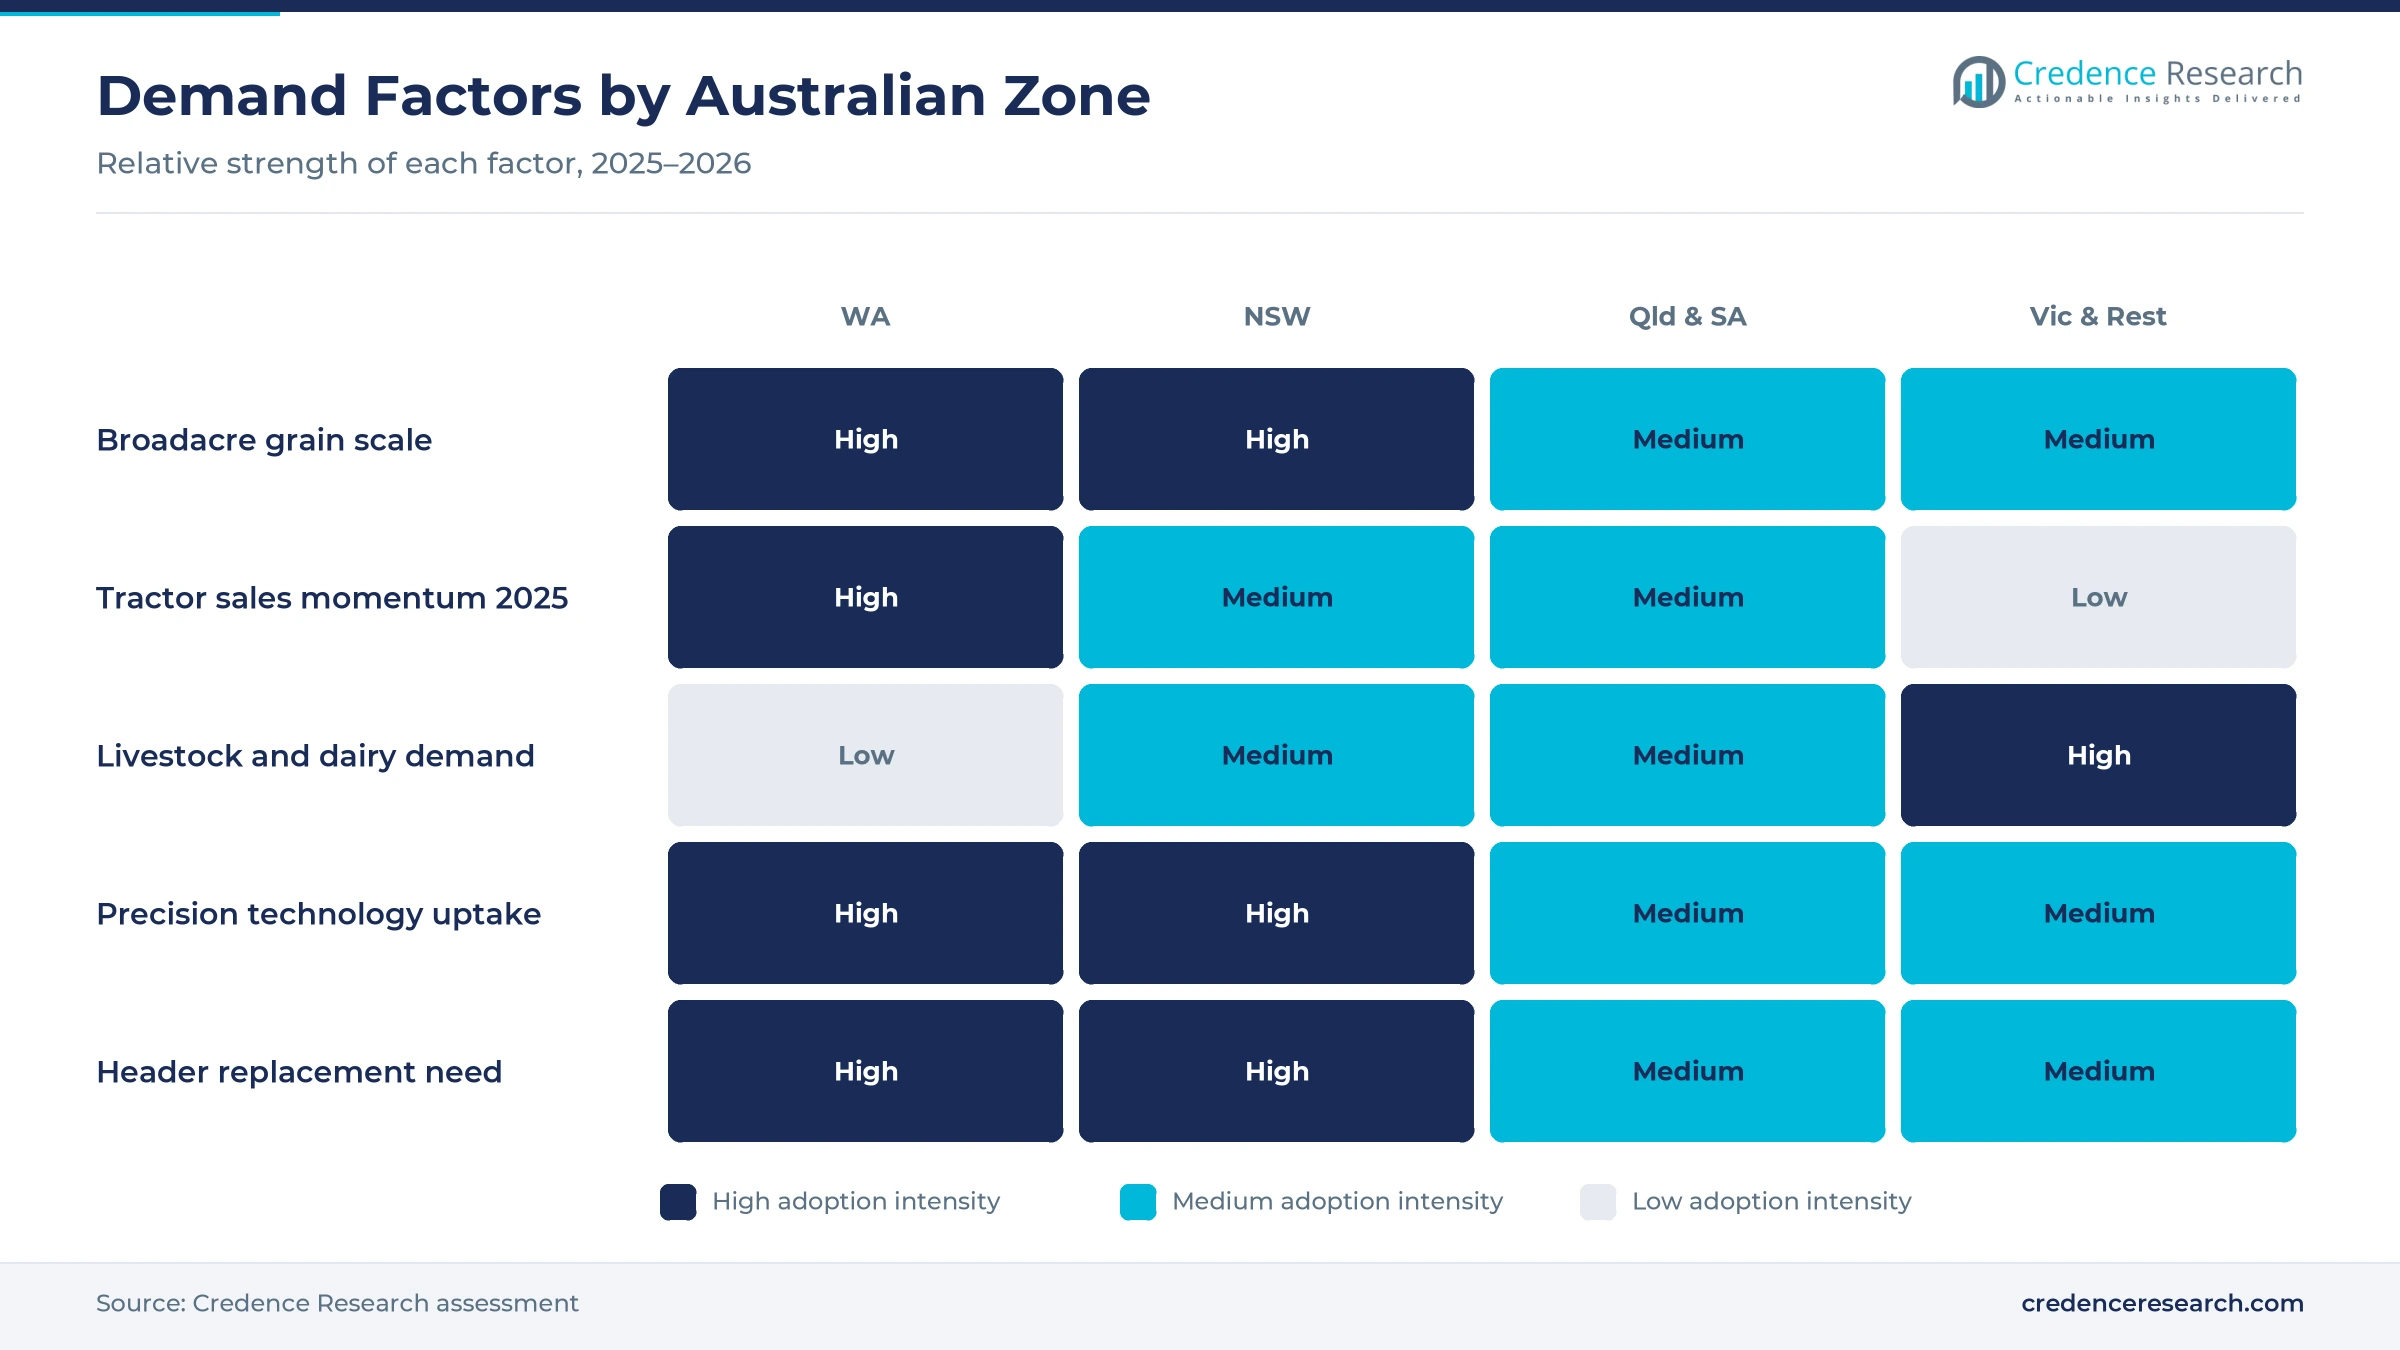
Replacement demand is the main driver, because three years of falling unit sales have left many farms running older tractors and headers. New tractor sales fell 7% to 9,521 units in 2025, after declines of 23% in 2024 and 25% in 2023, according to the Tractor and Machinery Association report covered by Rural News Group. Tractor sales were 29.9% below the five-year average, while combine sales sat 25% below their own average. Industry sales still reached A$4.6 billion in 2025, against A$5.6 billion in the 2022 peak year reported by Grain Central. As a result, tractors keep 44.0% of 2025 value, because deferred replacements return once farm cash flow and seasonal conditions allow.
What do growers gain from cameras and guidance?
Precision hardware adoption lifts the value of each machine sold, because growers now pay for guidance, cameras and rate control as standard options. John Deere launched See & Spray Select with in-season variable rate in Australia in April 2025, factory fitted on model year 2026 400 and 600 Series sprayers. The company reported more than 10 million acres treated across Australia by September 2026, with average herbicide savings of 74%. Controlled traffic farming already covered 34% of the national cropping area in the GRDC 2021 Farm Practices Survey, and that practice depends on accurate guidance. Therefore, satellite-guided equipment holds 38.0% of 2025 value, and spending moves toward camera and sensor upgrades.
What role do injury rates and scarce operators play?
Safety and labor efficiency push farms toward newer, more automated machines that need fewer operators. Agriculture, forestry and fishing recorded 44 worker deaths in 2024, a rate of 13.7 per 100,000 workers, the highest of any industry in Safe Work Australia data. Vehicle incidents caused 42% of all worker deaths that year. Agriculture also employed only about 2.2% of the Australian workforce in 2025, based on World Bank estimates, which keeps skilled operators scarce. In an ABARES survey for 2022-23, around 40% of horticulture farms used more efficient machinery to reduce labor demand. In turn, horticulture grows fastest among applications at 4.49% a year.
Which deductions and loans help buyers in 2026?
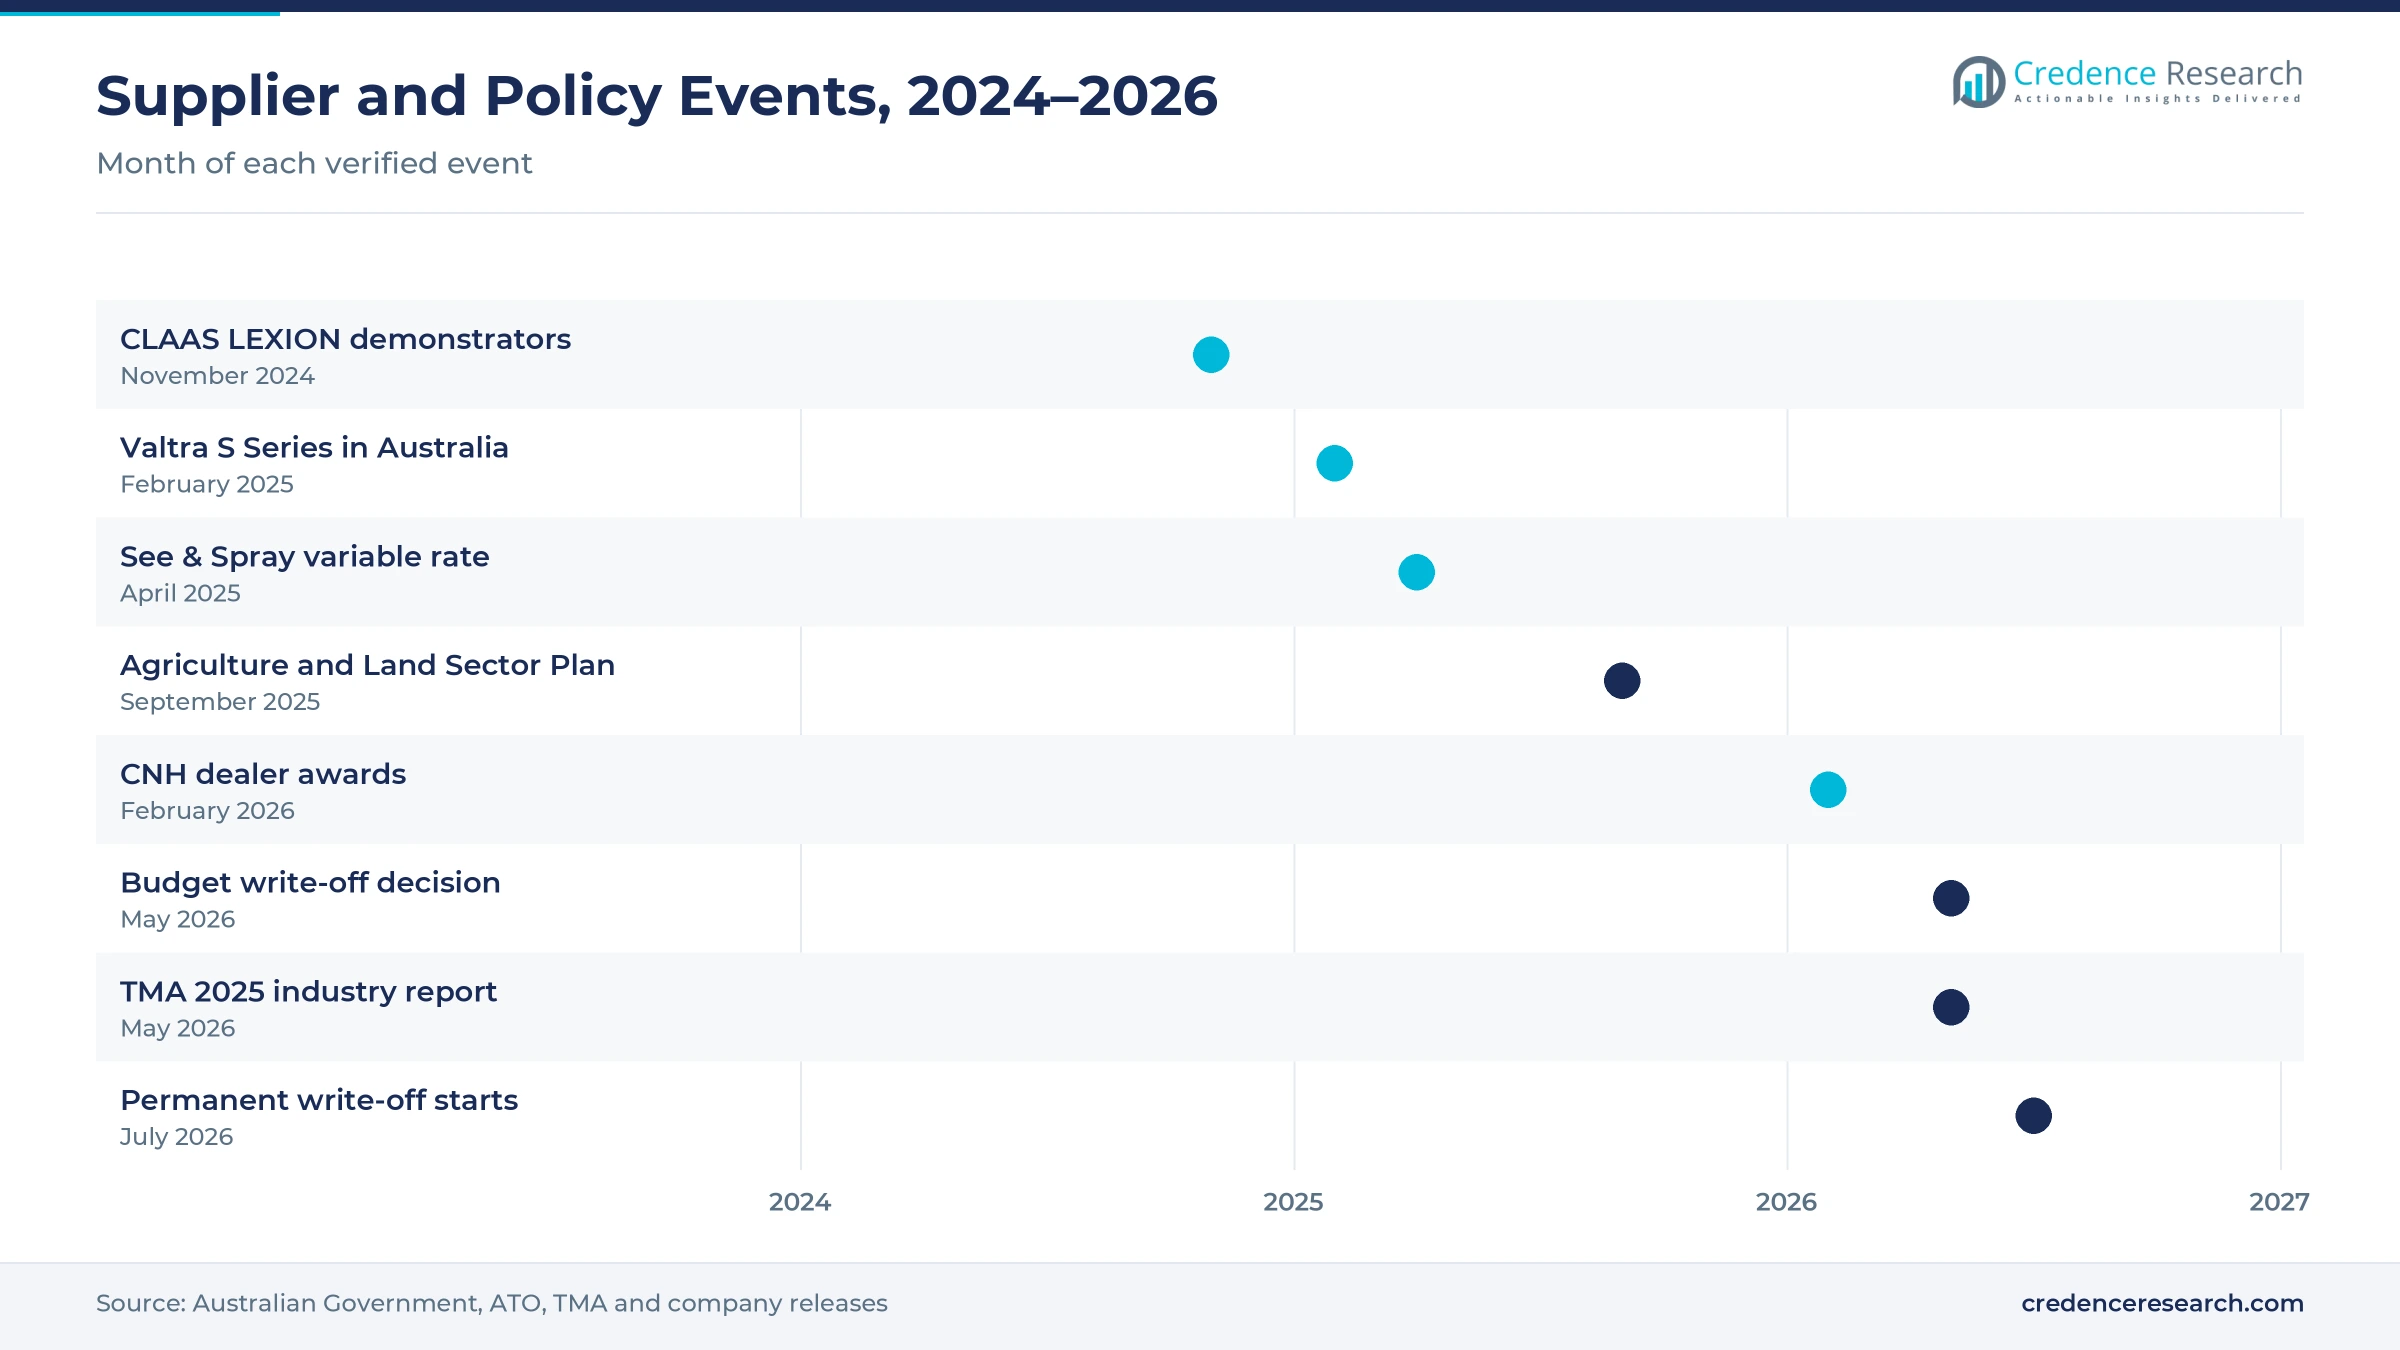
Tax and finance settings support purchases, because most machines are bought on credit and timed around year-end deductions. The Australian Taxation Office confirms that the A$20,000 instant asset write-off for businesses with turnover under A$10 million became permanent from July 1, 2026, after its announcement in the May 12, 2026 Budget. The Agriculture and Land Sector Plan, released on Sept. 18, 2025, added A$1 billion for Regional Investment Corporation loans covering productivity and climate resilience. The write-off applies to each eligible asset costing less than A$20,000, which brings many implements, small sprayers and attachments bought by family farms within reach of the deduction. Therefore, owner-operated farms keep 62.0% of 2025 value, because family businesses respond most to deductions and concessional loans.
Large tractors return as autonomy reaches the paddock
Which horsepower classes recovered first in 2026?
A shift back toward high-horsepower tractors is emerging in 2026, as large grain farms resume replacements after a weak 2025. Tractors above 200 hp fell 15.6% in 2025, while the 40 to 100 hp class rose 1.5%, according to Farm Machinery Sales. By April 2026, however, sales of 200 hp-plus tractors were up 2.6% year to date, while units under 40 hp were down 21%. Total tractor sales to April 2026 were still 8.5% lower than a year earlier. As a result, dollar value is recovering faster than unit numbers, because each large tractor carries guidance, telematics and high-flow hydraulics that raise the average selling price.
Why are fewer, larger dealer groups emerging?
Dealer networks are consolidating into larger multi-branch groups that can support precision technology across wide farming districts. Case IH named Intersales, a dealer with four branches including Temora and Wagga Wagga, its 2025 dealer of the year at an Adelaide conference on Feb. 24, 2026. The CNH awards weigh a precision technology focus alongside parts, service and market share, and Boekeman Machinery, with 118 staff across five Western Australian branches, won the combined CNH award. Larwoods Ag Services, a dealer for more than 50 years, won the parts and service award. Landpower, the Melbourne-based importer of CLAAS LEXION harvesters, brought nine European demonstrators into Australian paddocks for the 2024 harvest, according to Grain Central. Consequently, authorized dealers remain the main channel, because buyers want local setup and harvest service.
Where can driverless machines find early buyers?
Autonomous and camera-guided equipment is a clear opening, because growers see productivity gains but still need proof and support. A 2025 survey of 207 grain growers by Grain Producers Australia, the Tractor and Machinery Association and the Society of Precision Agriculture Australia found 61% wanted to learn more about autonomous machines. Respondents ranked productivity (73%) and time savings (65%) as the top benefits, while 52% cited affordability as the main barrier. John Deere's See & Spray Generation 2 reached model year 2027 sprayers in 2026, adding green-on-green detection. Therefore, advanced automation and low-emission equipment grows fastest at 7.68% a year, as suppliers pair precision farming IoT platforms with retrofits and demonstrations.
What could rural data links add to machine sales?
Better farm connectivity is a second opening, because guidance corrections, telematics and remote monitoring need reliable data links across large paddocks. The On Farm Connectivity Program provided A$18 million for Round 2 in 2024-25, with rebates of up to 50% of eligible equipment cost and a cap of A$30,000. Eligible categories include farm management and remote automation and control equipment, which lets growers link machine data with smart irrigation sensors and weather stations. The 2025 grower survey on autonomy also listed poor internet and mobile coverage as a barrier. As a result, corporate and public farm operators grow fastest at 4.38% a year, because large aggregations can justify private networks first.
Farm income dips and import prices slow big purchases
What happens to orders when farm profits fall?
Lower farm earnings delay large purchases, because headers and high-horsepower tractors are usually bought when cash flow is strong. ABARES expects the gross value of agricultural production to fall 6% to A$95 billion in 2026-27, after about A$101 billion in 2025-26. Average farm business profit is also forecast to decline, which leads growers to extend the life of existing machines. Dealers respond with finance offers, demonstration programs and stronger trade-in support for used units.
Why do overseas costs hit Australian buyers?
High machine prices weigh on buyers, because most equipment is imported and priced against overseas production and freight. The U.S. International Trade Administration noted in September 2025 that more than 60% of farm equipment in Australia is imported. Tractor dollar sales fell 28% in December 2025 even though unit sales rose 1%, which shows how quickly the mix moves toward cheaper machines when budgets tighten. Manufacturers counter with subsidized finance and upgrade kits for older machines.
What holds back driverless machines on farms?
Skills gaps and unclear guidance slow the uptake of autonomous machines, even where growers see the benefit. In the 2025 grower survey, 80% had never heard of the 2019 Code of Practice covering autonomous functions. Setup costs were cited by 39% of respondents as a barrier, after affordability. As a result, early adoption concentrates on large farms with in-house technicians, while dealers expand training and field days.
How do state-by-state seasons affect dealers?
Uneven seasons make dealer demand volatile, because sales in each state follow rainfall, crop size and commodity prices. In 2025, Victorian tractor sales fell 16% while Western Australian sales rose 1.6%, which shows how far regional results can diverge in one year. Northern Territory sales rose 9.3%, although from a small base of 106 tractors. Dealers manage this by sharing stock across branches and building parts and service revenue.
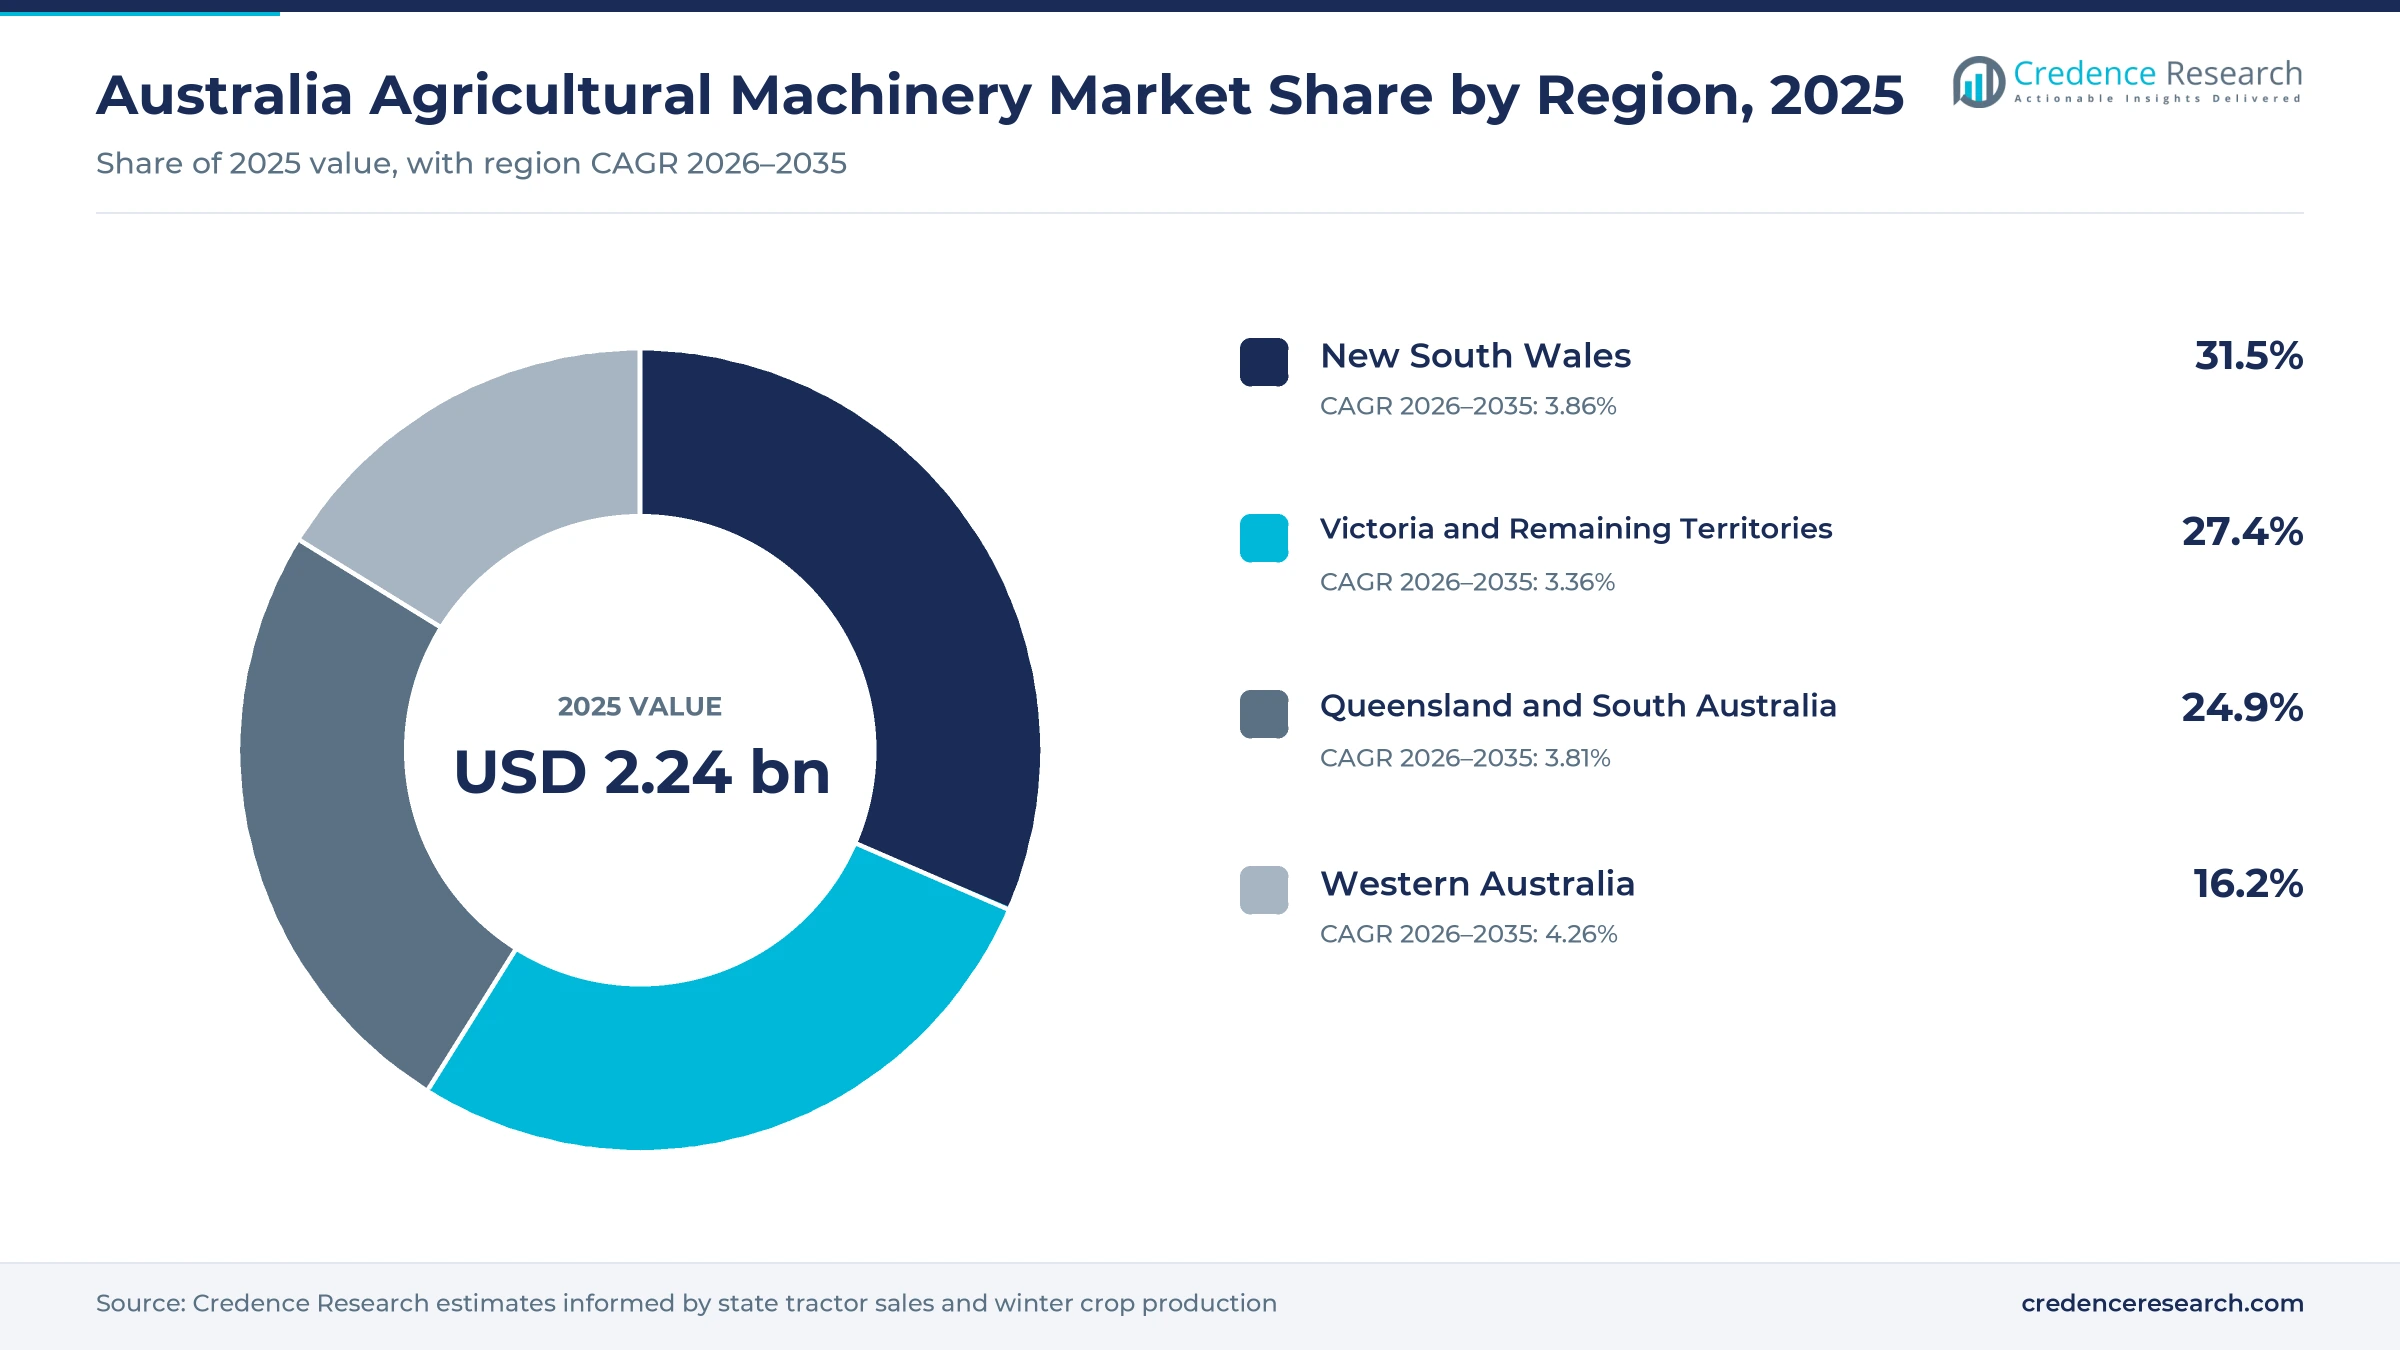
New South Wales leads as the western grain belt grows
| Region | Value, 2025 (USD billion) | Share, 2025 | CAGR, 2026–2035 |
|---|---|---|---|
| New South Wales | 0.71 | 31.5% | 3.86% |
| Victoria and Remaining Territories | 0.61 | 27.4% | 3.36% |
| Queensland and South Australia | 0.56 | 24.9% | 3.81% |
| Western Australia | 0.36 | 16.2% | 4.26% |
Why does New South Wales lead equipment demand?
New South Wales held 31.5% of 2025 value and grows at 3.86% a year, the largest regional share in the country. The state bought 2,591 new tractors in 2025, down 7.7%, and its winter crop is forecast at 18.3 million metric tons in 2025-26, its fourth-highest on record. Demand spans broadacre cropping, irrigated summer crops and beef and dairy farms. As a result, dealers in New South Wales sell the widest mix of tractors, headers, sprayers and hay tools in Australia.
How do Victoria and the remaining territories differ?
Victoria and Remaining Territories held 27.4% of 2025 value and grows at 3.36% a year, the slowest of the four zones. Victoria bought 2,055 tractors in 2025, a fall of 16% and the steepest of any state, while Tasmania bought 328 and the Northern Territory 106. Dairy and mixed farms in this zone buy many mid-size tractors and hay and forage equipment. However, a forecast Victorian winter crop of 9.1 million metric tons in 2025-26 supports header and seeder demand.
What drives demand in Queensland and South Australia?
Queensland and South Australia held 24.9% of 2025 value and grows at 3.81% a year. Queensland bought 2,499 tractors in 2025, the second-highest state total, and its winter crop is forecast at 3.7 million metric tons in 2025-26, which would be the second-highest on record. South Australia bought 686 tractors, down 9%, but its forecast 8.7 million metric tons of winter crop in 2025-26 included a state record lentil harvest of 937 kt. Therefore, the zone combines a large Queensland tractor fleet with header and seeder demand in South Australian grain districts.
What lifts western grain belt spending fastest?
Western Australia held 16.2% of 2025 value but grows fastest at 4.26% a year. It was the only large state where tractor sales rose in 2025, up 1.6% to 1,256 units. Its winter crop is forecast at 26.2 million metric tons in 2025-26, the largest of any state, including a record 7.2 million metric tons of barley. Because the state grows the biggest crop, buyers favor high-capacity headers, sprayers and seeders, which lift the value of each sale.
Sprayer launches, dealer awards and tax changes
| Development | Status and market relevance |
|---|---|
| In November 2024, Landpower brought nine European CLAAS LEXION demonstrators to Australia for harvest comparisons across five states. | Measured yields, losses, fuel burn and throughput against growers' own machines |
| In April 2025, John Deere launched See & Spray Select with in-season variable rate for Australian sprayers. | Factory fitted on model year 2026 400 and 600 Series sprayers, with upgrade kits for older units |
| In September 2025, the Australian Government released the Agriculture and Land Sector Plan with A$1 billion for Regional Investment Corporation loans. | Extends concessional finance to farm productivity and climate resilience |
| In February 2026, CNH named its 2025 Case IH and CNH dealer award winners at a conference in Adelaide. | Awards weigh precision technology focus, parts and service, and market share |
| In May 2026, the federal Budget made the A$20,000 instant asset write-off permanent from July 1, 2026. | Supports smaller equipment purchases by businesses with turnover under A$10 million |
Camera spraying and harvest sensing reshape machines
- Camera-guided spot spraying detects weeds in real time and opens only the nozzles needed, which John Deere says delivered average herbicide savings of 74% on Australian acres.
- In-season variable rate adjusts product volume from each nozzle according to green biomass, which lets growers apply fungicides and desiccants more precisely.
- Harvest loss sensing adjusts sieves, fan speed and engine power on headers during harvest, which CLAAS demonstrators used to target about 1% cereal loss.
- Turn automation steers sprayers through end-of-pass turns without operator input, which reduces fatigue during long spraying and seeding shifts.
Need a Custom Version of This Report?
Tailor the scope, geography, or segments to your exact requirements.
- Custom geography or segment scope
- Direct access to our analyst team
Five global makers compete through dealer networks
Competition centers on five global manufacturers that sell through dealer networks rather than direct to most farms. John Deere leads in precision spraying with See & Spray, a system developed in Australia and launched in 2021. CNH Industrial sells Case IH and New Holland through dealers such as Intersales and Boekeman Machinery, and rewards dealers for precision technology focus. AGCO markets Fendt and Valtra tractors, and its sixth-generation Valtra S Series became available in Australia in February 2025. CLAAS harvesters and tractors reach Australian growers through the Melbourne-based importer Landpower. Kubota Australia distributes Kubota tractors alongside Great Plains, Krone and Land Pride implements. Competition turns on dealer coverage, harvest-time parts support, finance offers and guidance systems that work across mixed fleets.
Companies profiled and their roles in this market
| Company | Type | Role in the market |
|---|---|---|
| John Deere | Global manufacturer | Tractors, headers and sprayers with See & Spray, developed and launched in Australia in 2021 |
| CNH Industrial | Global manufacturer | Case IH and New Holland brands sold through dealers such as Intersales and Boekeman Machinery |
| AGCO | Global manufacturer | Fendt and Valtra tractors, including the sixth-generation Valtra S Series launched in Australia in 2025 |
| CLAAS | Global manufacturer | LEXION combine harvesters imported and supported by Landpower in Melbourne |
| Kubota | Global manufacturer | Kubota Australia distributes Kubota tractors with Great Plains, Krone and Land Pride implements |
Credence Research view on the recovery path
Credence Research's view is that the Australia agricultural machinery market has passed the low point of its unit cycle, but recovery will show in value before volume. Tractor numbers fell for three straight years to 2025, while large tractors began to recover in early 2026. Growers will spend first on sprayers, guidance and large tractors that cut chemical, fuel and labor costs. However, weaker farm earnings in 2026-27 will keep buyers selective, so dealers with strong finance and service support are best placed to win share.
Tractor unit sales and TMA totals anchor the model
The report uses 2025 as the base year on a calendar basis, with forecasts to 2035. Market values come from the Credence Research model, which links new machine unit sales by category to typical prices and checks the total against industry sales published by the Tractor and Machinery Association. Regional and segment splits are Credence Research estimates informed by state tractor sales, ABARES winter crop production and product value mix. Sources used are government statistics, tax office pages, industry association data and company releases, and no interviews or surveys were conducted.
Precision upgrades carry demand through 2035
Spending is expected to reach USD 3.26 billion by 2035, a 3.78% CAGR during 2026–2035, as replacement demand returns and precision features become standard on new machines. Growth should be firmest in the late 2020s, when tractors bought during the 2021 and 2022 peak reach replacement age. After that, camera spraying, autonomy and low-emission power will lift the value of each unit sold. Dry seasons and weaker farm earnings may slow single years, but the long-term outlook for the Australia agricultural machinery market remains steady.
Frequently Asked Questions
How big is the Australia agricultural machinery market?
Why does New South Wales buy the most farm equipment?
Why do tractors take the biggest slice of spending?
Why did tractor sales fall in 2025?
How does precision technology affect spending?
Why is Western Australia growing fastest to 2035?
Which manufacturers sell tractors and headers in Australia?
What policies support machinery purchases in Australia?
Table of Content
Chapter 1 Market Segmentation
- 1.1 Segmentation Framework
- 1.1.1 Product and Service Classification
- 1.1.2 Application and End-Use Classification
- 1.1.3 Technology and Solution Classification
- 1.1.4 Customer and Distribution Channel Classification
- 1.1.5 Geographic Segmentation
- 1.1.6 Market Segment Definitions and Boundaries
- 1.2 By Product Type
- 1.2.1 Tractors
- 1.2.2 Combine Harvesters
- 1.2.3 Crop Establishment and Protection Equipment
- 1.2.4 Forage and Farm Support Equipment
- 1.3 By Application
- 1.3.1 Broadacre Grain Cropping
- 1.3.2 Livestock and Dairy Farming
- 1.3.3 Horticulture
- 1.3.4 Specialty Crops and Farm Support
- 1.4 By Technology
- 1.4.1 Conventional Equipment
- 1.4.2 Satellite-Guided Equipment
- 1.4.3 Precision Agriculture Enabled Equipment
- 1.4.4 Advanced Automation and Low-Emission Equipment
- 1.5 By Customer Type
- 1.5.1 Owner-Operated Farms
- 1.5.2 Agricultural Contractors
- 1.5.3 Corporate and Public Farm Operators
Chapter 2 Introduction
- 2.1 Report Objectives and Scope
- 2.2 Product Definition and Industry Terminology
- 2.3 Market Inclusions and Exclusions
- 2.4 Research Process
- 2.4.1 Primary Research and Expert Interviews
- 2.4.2 Secondary Research and Source Review
- 2.4.3 Top-Down and Bottom-Up Estimation
- 2.4.4 Data Triangulation and Verification
- 2.5 Market Size Measurement Basis
- 2.5.1 2025: USD 2.24 billion → 2035: USD 3.26 billion
- 2.6 Historical and Forecast Reference Periods
- 2.6.1 Historical Period: 2018-2025
- 2.6.2 Base Year: 2025
- 2.6.3 Forecast Period: 2025-2035
- 2.7 Research Assumptions and Limitations
Chapter 3 Executive Summary
- 3.1 Market Snapshot and Key Findings
- 3.2 Base-Year Market Size, 2025
- 3.3 Forecast Market Size, 2035
- 3.4 Revenue and Volume Growth Outlook
- 3.5 Key Demand and Supply Indicators
- 3.6 Leading Market Segments
- 3.7 Fastest-Growing Market Opportunities
- 3.8 Regional Performance Highlights
- 3.9 Technology and Industry Transformation
- 3.10 Competitive Landscape Summary
- 3.11 Analyst View and Strategic Implications
Chapter 4 Australia Agricultural Machinery Market Trends and Developments
- 4.1 Historical Industry Development, 2018-2025
- 4.2 Recent Market Trends and Developments
- 4.3 Demand and Customer Behavior Trends
- 4.4 Technology and Product Innovation
- 4.5 Artificial Intelligence, Automation and Digitalization
- 4.6 Local Manufacturing and Supply Chain Realignment
- 4.7 Industry Partnerships, Mergers and Acquisitions
- 4.8 Sustainability and Circular Economy Developments
- 4.9 Government and Private Sector Investment Trends
- 4.10 Emerging Business Models and Commercialization
- 4.11 Industry Developments and Announcements
Chapter 5 Australia Agricultural Machinery Market Production, Supply and Demand Analysis
- 5.1 Demand Trend and Consumption Analysis, 2018-2025
- 5.2 Demand Forecast, 2025-2035
- 5.3 Production and Output Trend, 2018-2025
- 5.4 Production and Output Forecast, 2025-2035
- 5.5 Installed Capacity and Capacity Utilization
- 5.6 Company-Wise Production Plants and Statistics
- 5.6.1 Installed Production Capacity
- 5.6.2 Actual Production
- 5.6.3 Planned Capacity and Expansion Targets
- 5.7 Supply Chain Structure and Procurement Trends
- 5.8 Supply-Demand Gap and Bottlenecks
- 5.9 Import Dependence and Sourcing Structure
- 5.10 Contract Manufacturing and Outsourcing
- 5.11 Regional Supply and Demand Concentration
Chapter 6 Australia Agricultural Machinery Market Pricing Analysis
- 6.1 Pricing Structure and Measurement
- 6.2 Historical Pricing Trends, 2018-2025
- 6.3 Pricing Outlook, 2025-2035
- 6.4 Average Selling Price and Unit Economics
- 6.5 Pricing by Product and Market Segment
- 6.6 Geographic Pricing Differences
- 6.7 Key Input, Energy, Labor and Logistics Costs
- 6.8 Contract Pricing and Purchasing Models
- 6.9 Pricing Sensitivity and Competitive Positioning
- 6.10 Price, Margin and Profitability Implications
Chapter 7 Australia Agricultural Machinery Market Dynamics
- 7.1 Market Growth Drivers
- 7.1.1 Demand-Side Drivers
- 7.1.2 Technology and Innovation Drivers
- 7.1.3 Infrastructure and Investment Drivers
- 7.1.4 Regulatory and Policy Drivers
- 7.2 Market Restraints
- 7.2.1 Cost and Affordability Constraints
- 7.2.2 Technology and Adoption Barriers
- 7.2.3 Supply Chain and Operational Constraints
- 7.3 Market Challenges
- 7.3.1 Competitive Pressure and Margin Erosion
- 7.3.2 Skills, Infrastructure and Implementation Gaps
- 7.4 Emerging Market Opportunities
- 7.5 Market Dynamics Impact and Time-Horizon Assessment
Chapter 8 Australia Agricultural Machinery Value Chain Analysis
- 8.1 Industry Value Chain Overview
- 8.2 Upstream Suppliers and Critical Inputs
- 8.3 Technology and Component Providers
- 8.4 Manufacturing or Service Delivery
- 8.5 Distribution, Channel Partners and Integrators
- 8.6 Downstream Applications and End Users
- 8.7 Value Addition and Profit Pools
- 8.8 Vertical Integration and Outsourcing
- 8.9 Supplier Concentration and Risk
- 8.10 Supply Chain Localization and Resilience
Chapter 9 Australia Agricultural Machinery Market Regulations and Policies
- 9.1 Relevant Laws, Standards and Compliance Frameworks
- 9.2 Product, Service, Safety and Quality Requirements
- 9.3 Government Policies, Incentives and Subsidies
- 9.4 Imports, Exports and Trade Barriers
- 9.5 Public Procurement and Local Content Requirements
- 9.6 Environmental and Sustainability Compliance
- 9.7 Upcoming Policy Changes and Market Implications
Chapter 10 Australia Agricultural Machinery Market Hotspots and Opportunities
- 10.1 Market Opportunity Mapping and Growth Hotspots
- 10.2 High-Growth Applications and Customer Groups
- 10.3 Underserved Markets and White-Space Opportunities
- 10.4 Emerging Technology and Product Opportunities
- 10.5 New Capacity and Investment Hotspots
- 10.6 Market Entry and Expansion Opportunities
- 10.7 Distribution and Partnership Opportunities
- 10.8 Near-Term and Long-Term Commercial Potential
- 10.9 Opportunity Attractiveness and Execution Risks
Chapter 11 Australia Agricultural Machinery Market Outlook, 2025-2035
- 11.1 Market Size and Analysis
- 11.1.1 Revenue (Market Measurement: 2025: USD 2.24 billion → 2035: USD 3.26 billion)
- 11.1.2 Market Volume and Quantity Sold
- 11.1.3 Historical Market Size, 2018-2025
- 11.1.4 Base-Year Market Size, 2025
- 11.2 Market Forecast, 2025-2035
- 11.2.1 Revenue Forecast to 2035
- 11.2.2 Volume Forecast to 2035
- 11.2.3 CAGR and Year-on-Year Growth
- 11.2.4 Incremental Revenue Opportunity
- 11.3 Forecast Assumptions and Scenario Analysis
- 11.3.1 Base-Case Forecast
- 11.3.2 Optimistic and Conservative Scenarios
- 11.3.3 Technology, Pricing and Policy Sensitivities
- 11.4 Market Attractiveness and Growth Outlook
Chapter 12 Australia Agricultural Machinery Market Segmentation and Outlook
- 12.1 Segmentation Summary and Market Shares, 2025
- 12.2 Largest and Fastest-Growing Segments
- 12.3 By Product Type - Market Size and Forecast, 2025-2035
- 12.3.1 Segment Definition and Scope
- 12.3.2 Historical Market Size, 2018-2025
- 12.3.3 Revenue Forecast, 2025-2035
- 12.3.4 Volume Forecast, 2025-2035
- 12.3.5 Base-Year Market Share, 2025
- 12.3.6 Segment CAGR and Growth Drivers
- 12.3.7 Subsegment Market Size and Forecast
- 12.3.7.1 Tractors
- 12.3.7.2 Combine Harvesters
- 12.3.7.3 Crop Establishment and Protection Equipment
- 12.3.7.4 Forage and Farm Support Equipment
- 12.3.8 Subsegment Pricing and Adoption Trends
- 12.3.9 Leading Suppliers and Competition
- 12.3.10 Regional Demand and Opportunities
- 12.4 By Application - Market Size and Forecast, 2025-2035
- 12.4.1 Segment Definition and Scope
- 12.4.2 Historical Market Size, 2018-2025
- 12.4.3 Revenue Forecast, 2025-2035
- 12.4.4 Volume Forecast, 2025-2035
- 12.4.5 Base-Year Market Share, 2025
- 12.4.6 Segment CAGR and Growth Drivers
- 12.4.7 Subsegment Market Size and Forecast
- 12.4.7.1 Broadacre Grain Cropping
- 12.4.7.2 Livestock and Dairy Farming
- 12.4.7.3 Horticulture
- 12.4.7.4 Specialty Crops and Farm Support
- 12.4.8 Subsegment Pricing and Adoption Trends
- 12.4.9 Leading Suppliers and Competition
- 12.4.10 Regional Demand and Opportunities
- 12.5 By Technology - Market Size and Forecast, 2025-2035
- 12.5.1 Segment Definition and Scope
- 12.5.2 Historical Market Size, 2018-2025
- 12.5.3 Revenue Forecast, 2025-2035
- 12.5.4 Volume Forecast, 2025-2035
- 12.5.5 Base-Year Market Share, 2025
- 12.5.6 Segment CAGR and Growth Drivers
- 12.5.7 Subsegment Market Size and Forecast
- 12.5.7.1 Conventional Equipment
- 12.5.7.2 Satellite-Guided Equipment
- 12.5.7.3 Precision Agriculture Enabled Equipment
- 12.5.7.4 Advanced Automation and Low-Emission Equipment
- 12.5.8 Subsegment Pricing and Adoption Trends
- 12.5.9 Leading Suppliers and Competition
- 12.5.10 Regional Demand and Opportunities
- 12.6 By Customer Type - Market Size and Forecast, 2025-2035
- 12.6.1 Segment Definition and Scope
- 12.6.2 Historical Market Size, 2018-2025
- 12.6.3 Revenue Forecast, 2025-2035
- 12.6.4 Volume Forecast, 2025-2035
- 12.6.5 Base-Year Market Share, 2025
- 12.6.6 Segment CAGR and Growth Drivers
- 12.6.7 Subsegment Market Size and Forecast
- 12.6.7.1 Owner-Operated Farms
- 12.6.7.2 Agricultural Contractors
- 12.6.7.3 Corporate and Public Farm Operators
- 12.6.8 Subsegment Pricing and Adoption Trends
- 12.6.9 Leading Suppliers and Competition
- 12.6.10 Regional Demand and Opportunities
- 12.7 Segment Growth Comparison
- 12.8 Segment Attractiveness and Priority Matrix
Chapter 13 Australia Agricultural Machinery End-Use and Application Market Outlook
- 13.1 End-Use Industry and Customer Demand Structure
- 13.2 Leading Applications and Customer Groups
- 13.3 End-Use Market Size, Share and Forecast
- 13.4 Major End-Use Industry Deep Dives
- 13.4.1 Customer Requirements and Use Cases
- 13.4.2 Demand and Replacement Cycles
- 13.4.3 Technical and Regulatory Considerations
- 13.4.4 Purchasing and Procurement Models
- 13.4.5 Leading Vendors and Distribution Channels
- 13.4.6 Forecast and Commercial Opportunities
- 13.5 Emerging Applications and Cross-Segment Demand
- 13.6 End-Use Industry Investment Priorities
Chapter 14 Australia Agricultural Machinery Geographic Market Outlook, 2025-2035
- 14.1 Domestic Market Distribution and Demand Clusters
- 14.2 State- or Province-Wise Market Size and Forecast, 2025-2035
- 14.3 City and Metropolitan Market Outlook
- 14.4 Industrial, Manufacturing and Commercial Clusters
- 14.5 Geographic Concentration of Key End Users
- 14.6 Local Pricing and Purchasing Differences
- 14.7 Domestic Production Facilities and Capacity Map
- 14.8 Local Infrastructure and Project Pipeline
- 14.9 State-Level Policy and Incentive Differences
- 14.10 Subnational Investment Hotspots and Opportunities
- 14.11 Distribution and Logistics Networks
- 14.12 Domestic Competitive Footprint
Chapter 15 Australia Agricultural Machinery Technology, Innovation and Sustainability Outlook
- 15.1 Technology Landscape and Maturity
- 15.2 Product, Process and Service Innovation
- 15.3 AI, Automation and Digital Tools in the Industry
- 15.4 Technology Adoption and Performance Benchmarking
- 15.5 Innovation Pipeline and R&D Investment
- 15.6 Patent and Intellectual Property Trends
- 15.7 Energy Efficiency and Resource Management
- 15.8 Sustainability, Recycling and Circularity
- 15.9 Technology Roadmap, 2025-2035
- 15.10 Risks of Obsolescence and Technology Substitution
Chapter 16 Australia Agricultural Machinery Market Key Strategic Imperatives
- 16.1 Growth and Market Entry Priorities
- 16.2 High-Return Products and Segments
- 16.3 Pricing, Profitability and Cost Optimization
- 16.4 Technology Investment and Product Differentiation
- 16.5 Supply Chain Localization and Resilience
- 16.6 Distribution and Customer Acquisition
- 16.7 Partnership, Acquisition and Capacity Strategy
- 16.8 Regional Expansion Priorities
- 16.9 Short-, Medium- and Long-Term Actions
Chapter 17 Competition Outlook
- 17.1 Industry Competition Characteristics
- 17.2 Market Structure and Concentration
- 17.3 Market Share and Competitive Positioning, 2025
- 17.4 Company-Wise Revenue and Product Benchmarking
- 17.5 Production and Service Capacity Benchmarking
- 17.6 Technology, Pricing and Differentiation
- 17.7 Regional Footprint and Distribution Strength
- 17.8 Mergers, Acquisitions and Strategic Alliances
- 17.9 New Entrants and Competitive Threats
- 17.10 Porter's Five Forces and Industry Attractiveness
- 17.11 Competitive Outlook, 2025-2035
Chapter 18 Company Profiles
- 18.1 Company Coverage and Selection Criteria
- 18.2 John Deere
- 18.2.1 Business Description
- 18.2.2 Company Ownership and Geographic Presence
- 18.2.3 Product and Service Portfolio
- 18.2.4 Manufacturing and Operating Footprint
- 18.2.5 Production Capacity and Expansion Plans
- 18.2.6 Financial Performance and Investment
- 18.2.7 Market Share and Competitive Position
- 18.2.8 Technology and Innovation Capabilities
- 18.2.9 Strategic Alliances or Partnerships
- 18.2.10 Recent Developments
- 18.2.11 Growth Strategy and Outlook
- 18.3 CNH Industrial
- 18.4 AGCO
- 18.5 CLAAS
- 18.6 Kubota
- 18.7 Other Relevant Market Participants
Note: Every listed company is profiled on the structure shown under the first company. The company list is preliminary and may change based on research findings, market developments, data availability and client requirements.
Chapter 19 Disclaimer
- 19.1 Research and Forecast Disclaimer
- 19.2 Data Source and Estimation Limitations
Note: The depth of individual sections depends on data availability for this market. Volume, capacity, trade and other unit-based metrics are included where applicable.

