
Export proof and animal records drive farm data spending
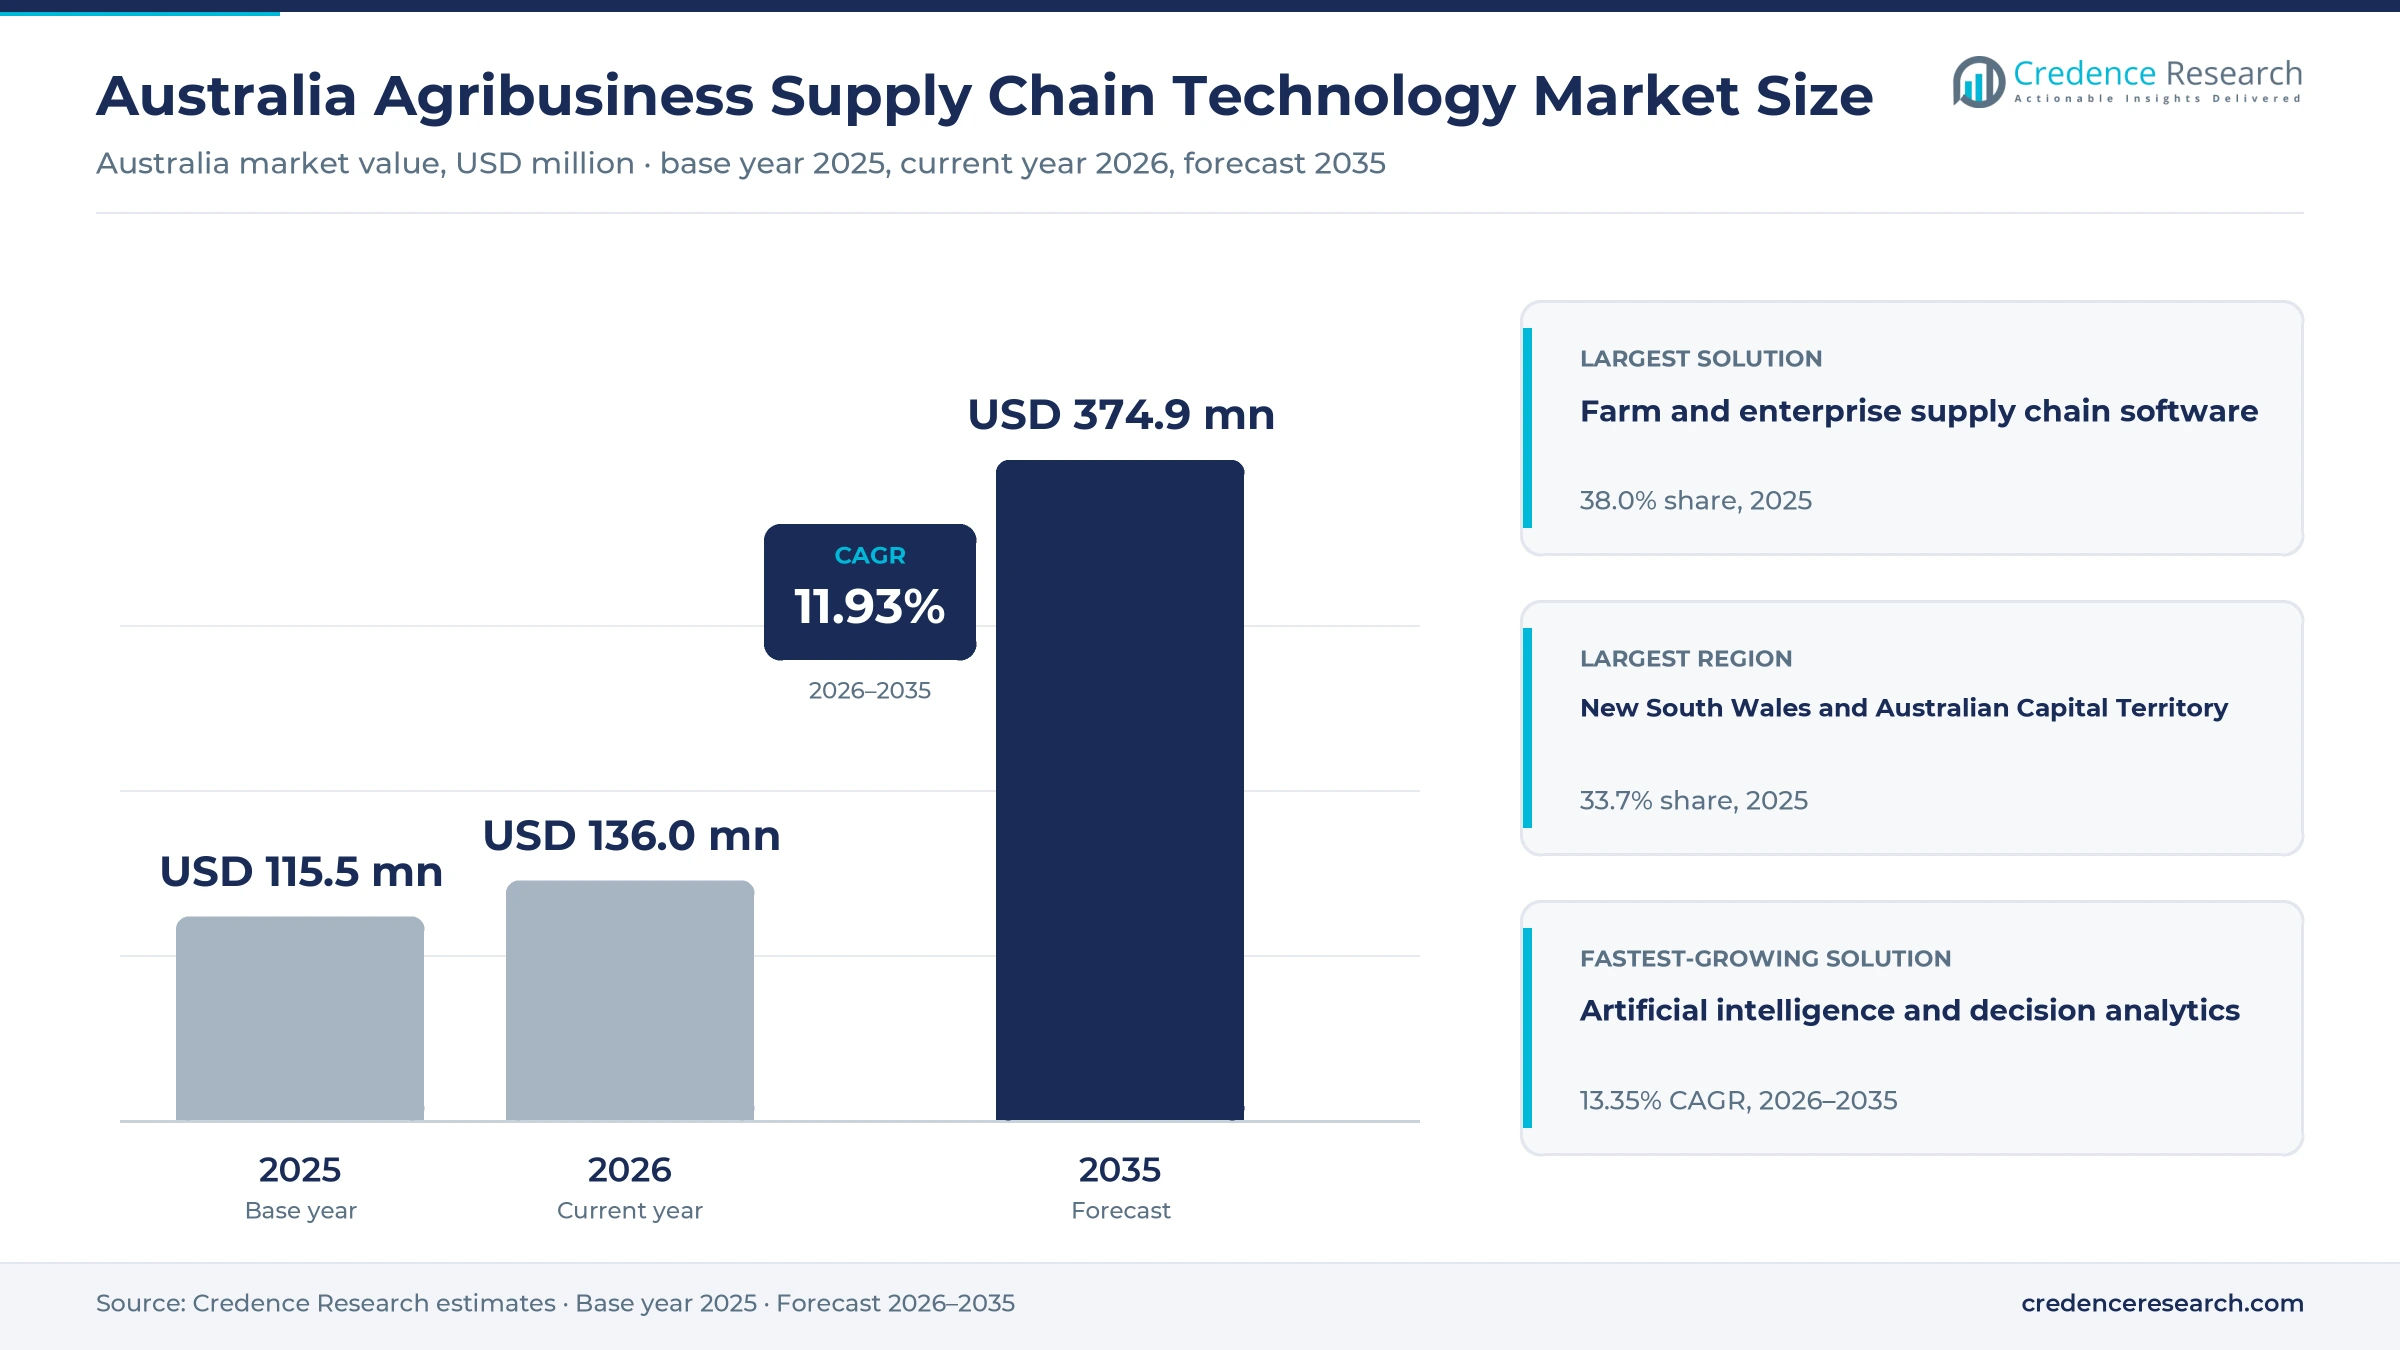
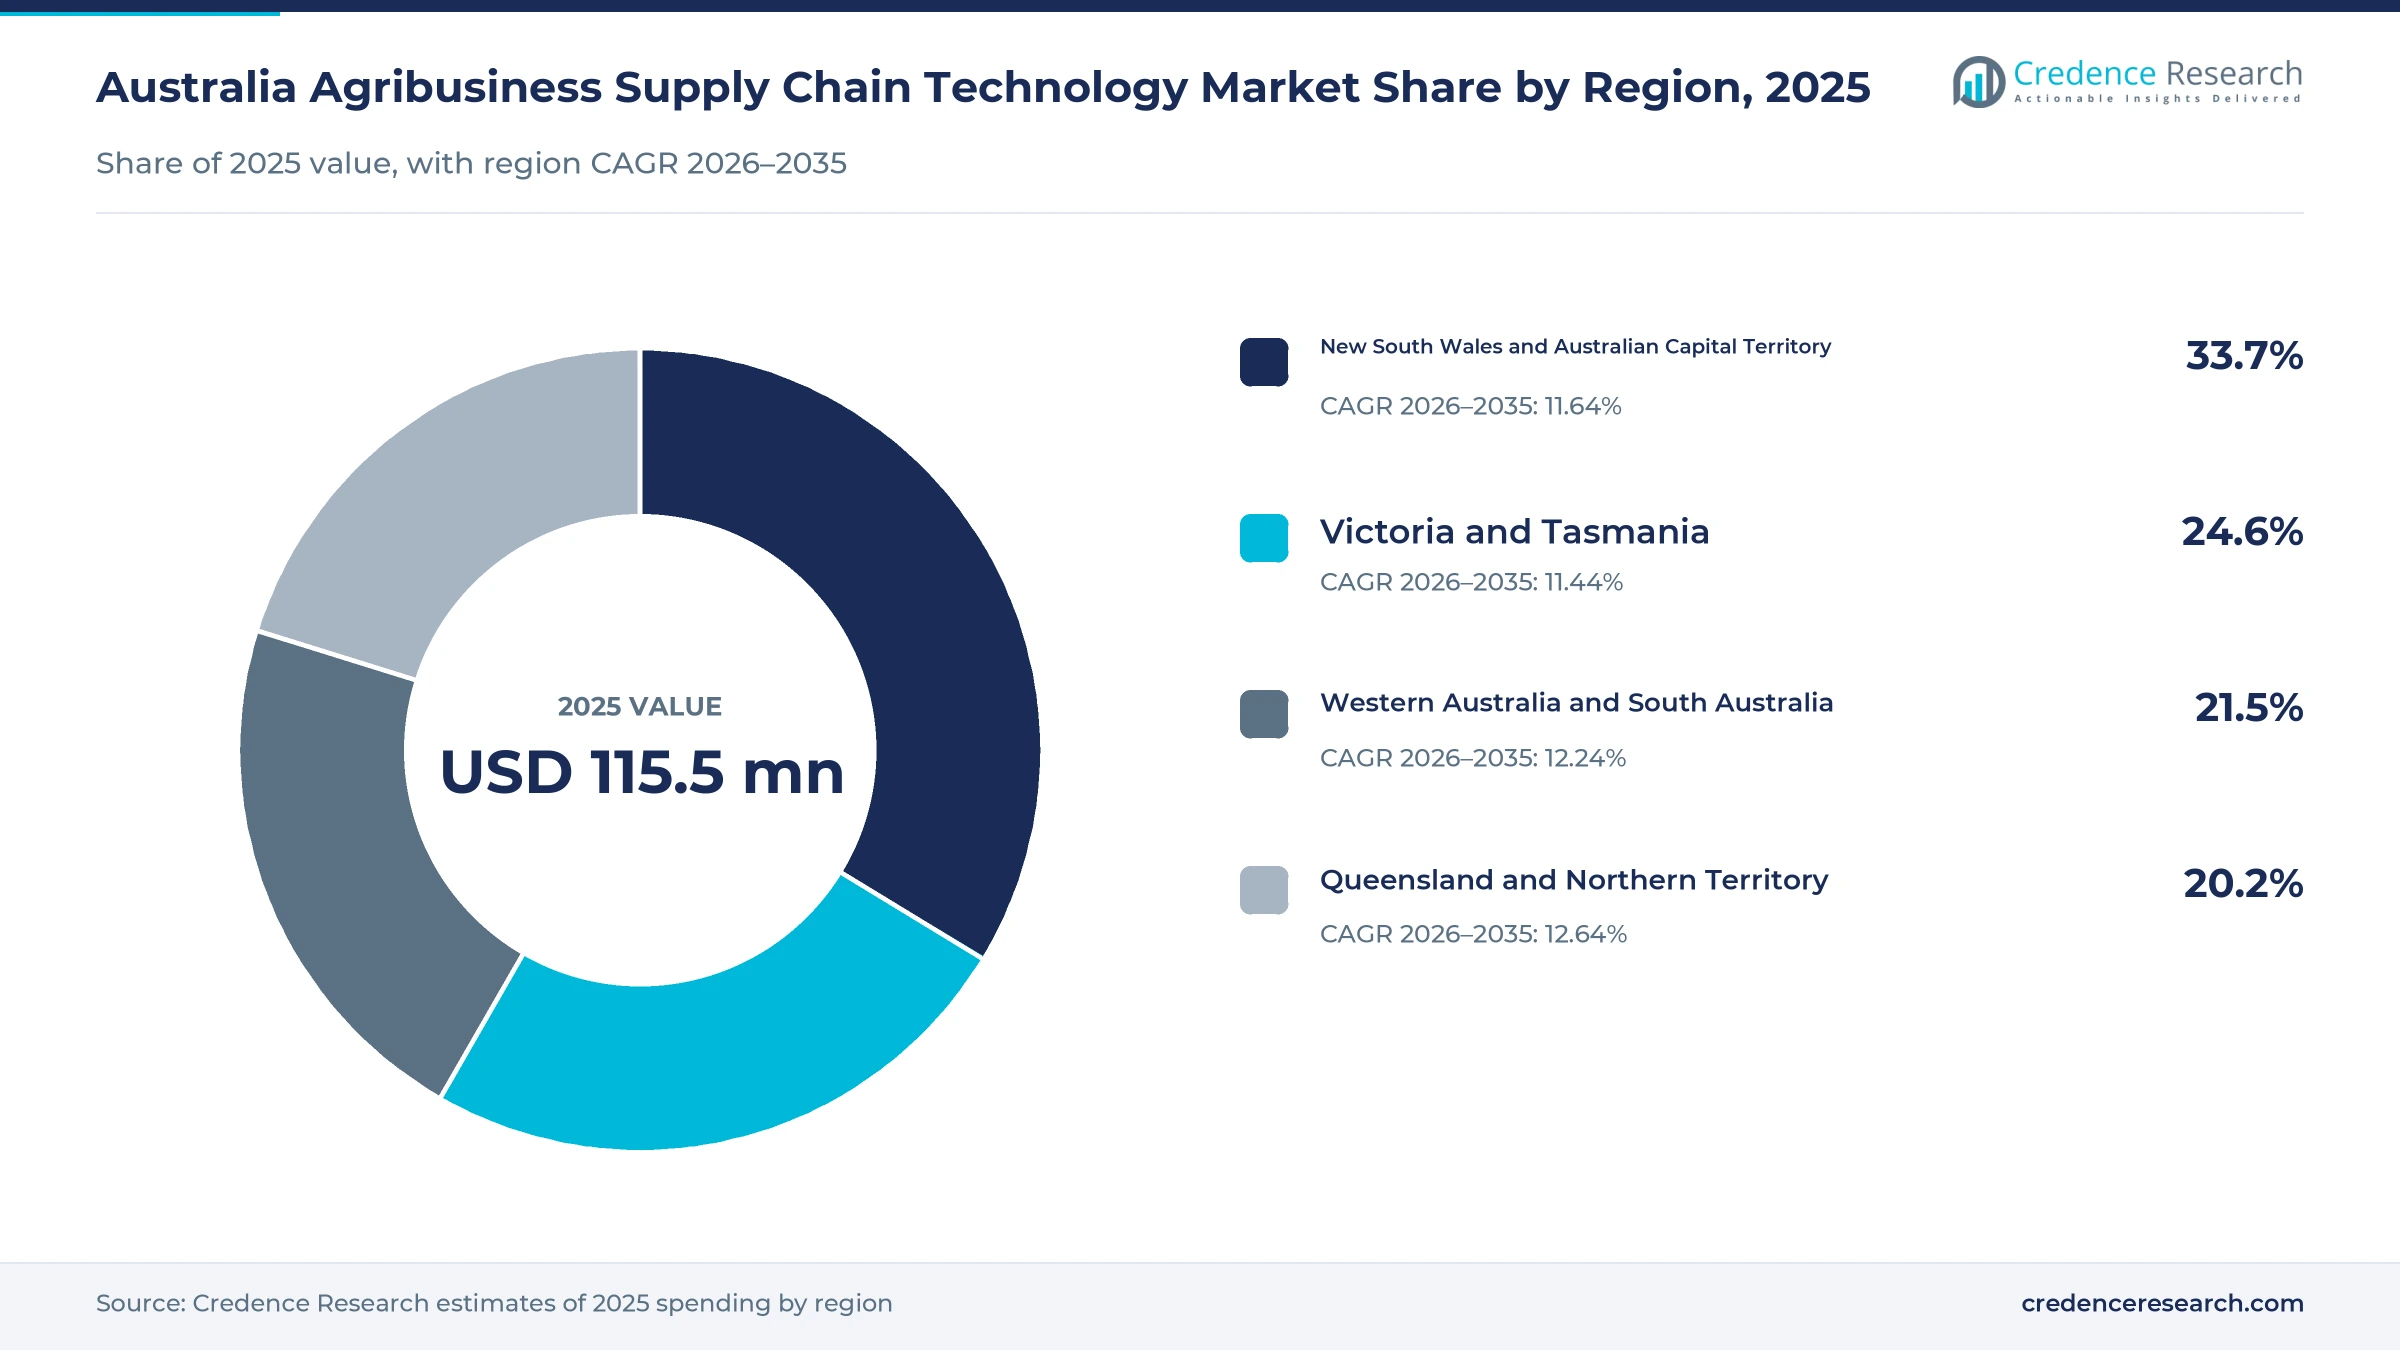
The Australia agribusiness supply chain technology market was valued at USD 115.5 million in 2025 and is projected to increase from USD 136.0 million in 2026 to USD 374.9 million by 2035, registering a CAGR of 11.93% during 2026–2035. Demand comes from grain handlers, livestock producers, processors, horticulture packers and exporters that use software, connected sensors and analytics to plan sales, record animal movements and prove origin to overseas buyers. New South Wales and Australian Capital Territory held the largest regional share, 33.7% in 2025, because the region combines a large grain harvest with dense livestock selling networks. Queensland and Northern Territory is the fastest-growing region at 12.64% a year, as northern beef businesses digitize animal records and pasture checks. Mandatory electronic tags for sheep and goats born from Jan. 1, 2025, have turned individual animal records into a national compliance task. Satellite links for machines and sensors are also extending connected services into areas without mobile coverage.
Which tools and services fall inside this estimate?
Spending by Australian farms, grain handlers, saleyards, processors, packers and exporters on software and data services that move produce from the paddock to domestic and export buyers is counted here. The scope covers farm and enterprise supply chain software, connected monitoring platforms, artificial intelligence and decision analytics, and traceability and compliance platforms, paid through subscriptions, licenses, implementation fees and usage-linked charges.
The estimate excludes tractors, harvesters, tags sold as hardware alone, freight, storage and general office software with no farm or food chain function. The value chain runs from global machinery and enterprise software brands through Australian platform developers and resellers to producers, agents, bulk handlers, processors and exporters.
Australia Agribusiness Supply Chain Technology Market Insights
- The Australia agribusiness supply chain technology market was valued at USD 115.5 million in 2025 and is projected to reach USD 374.9 million by 2035, registering a CAGR of 11.93% during 2026–2035.
- New South Wales and Australian Capital Territory held a 33.7% share of 2025 value, because the region pairs large grain sales with busy livestock markets.
- Farm and enterprise supply chain software led solution demand with a 38.0% share of 2025 value, because grain contracts, deliveries and payments run through it.
- Sheep and goats born since the start of 2025 must carry electronic tags, which makes individual animal records a national requirement.
- AgriDigital reported in July 2025 that about 108 million metric tons of grain had been transacted through its platform since launch.
Transaction software leads while analytics grows fastest
Why does transaction software take the largest budget share?
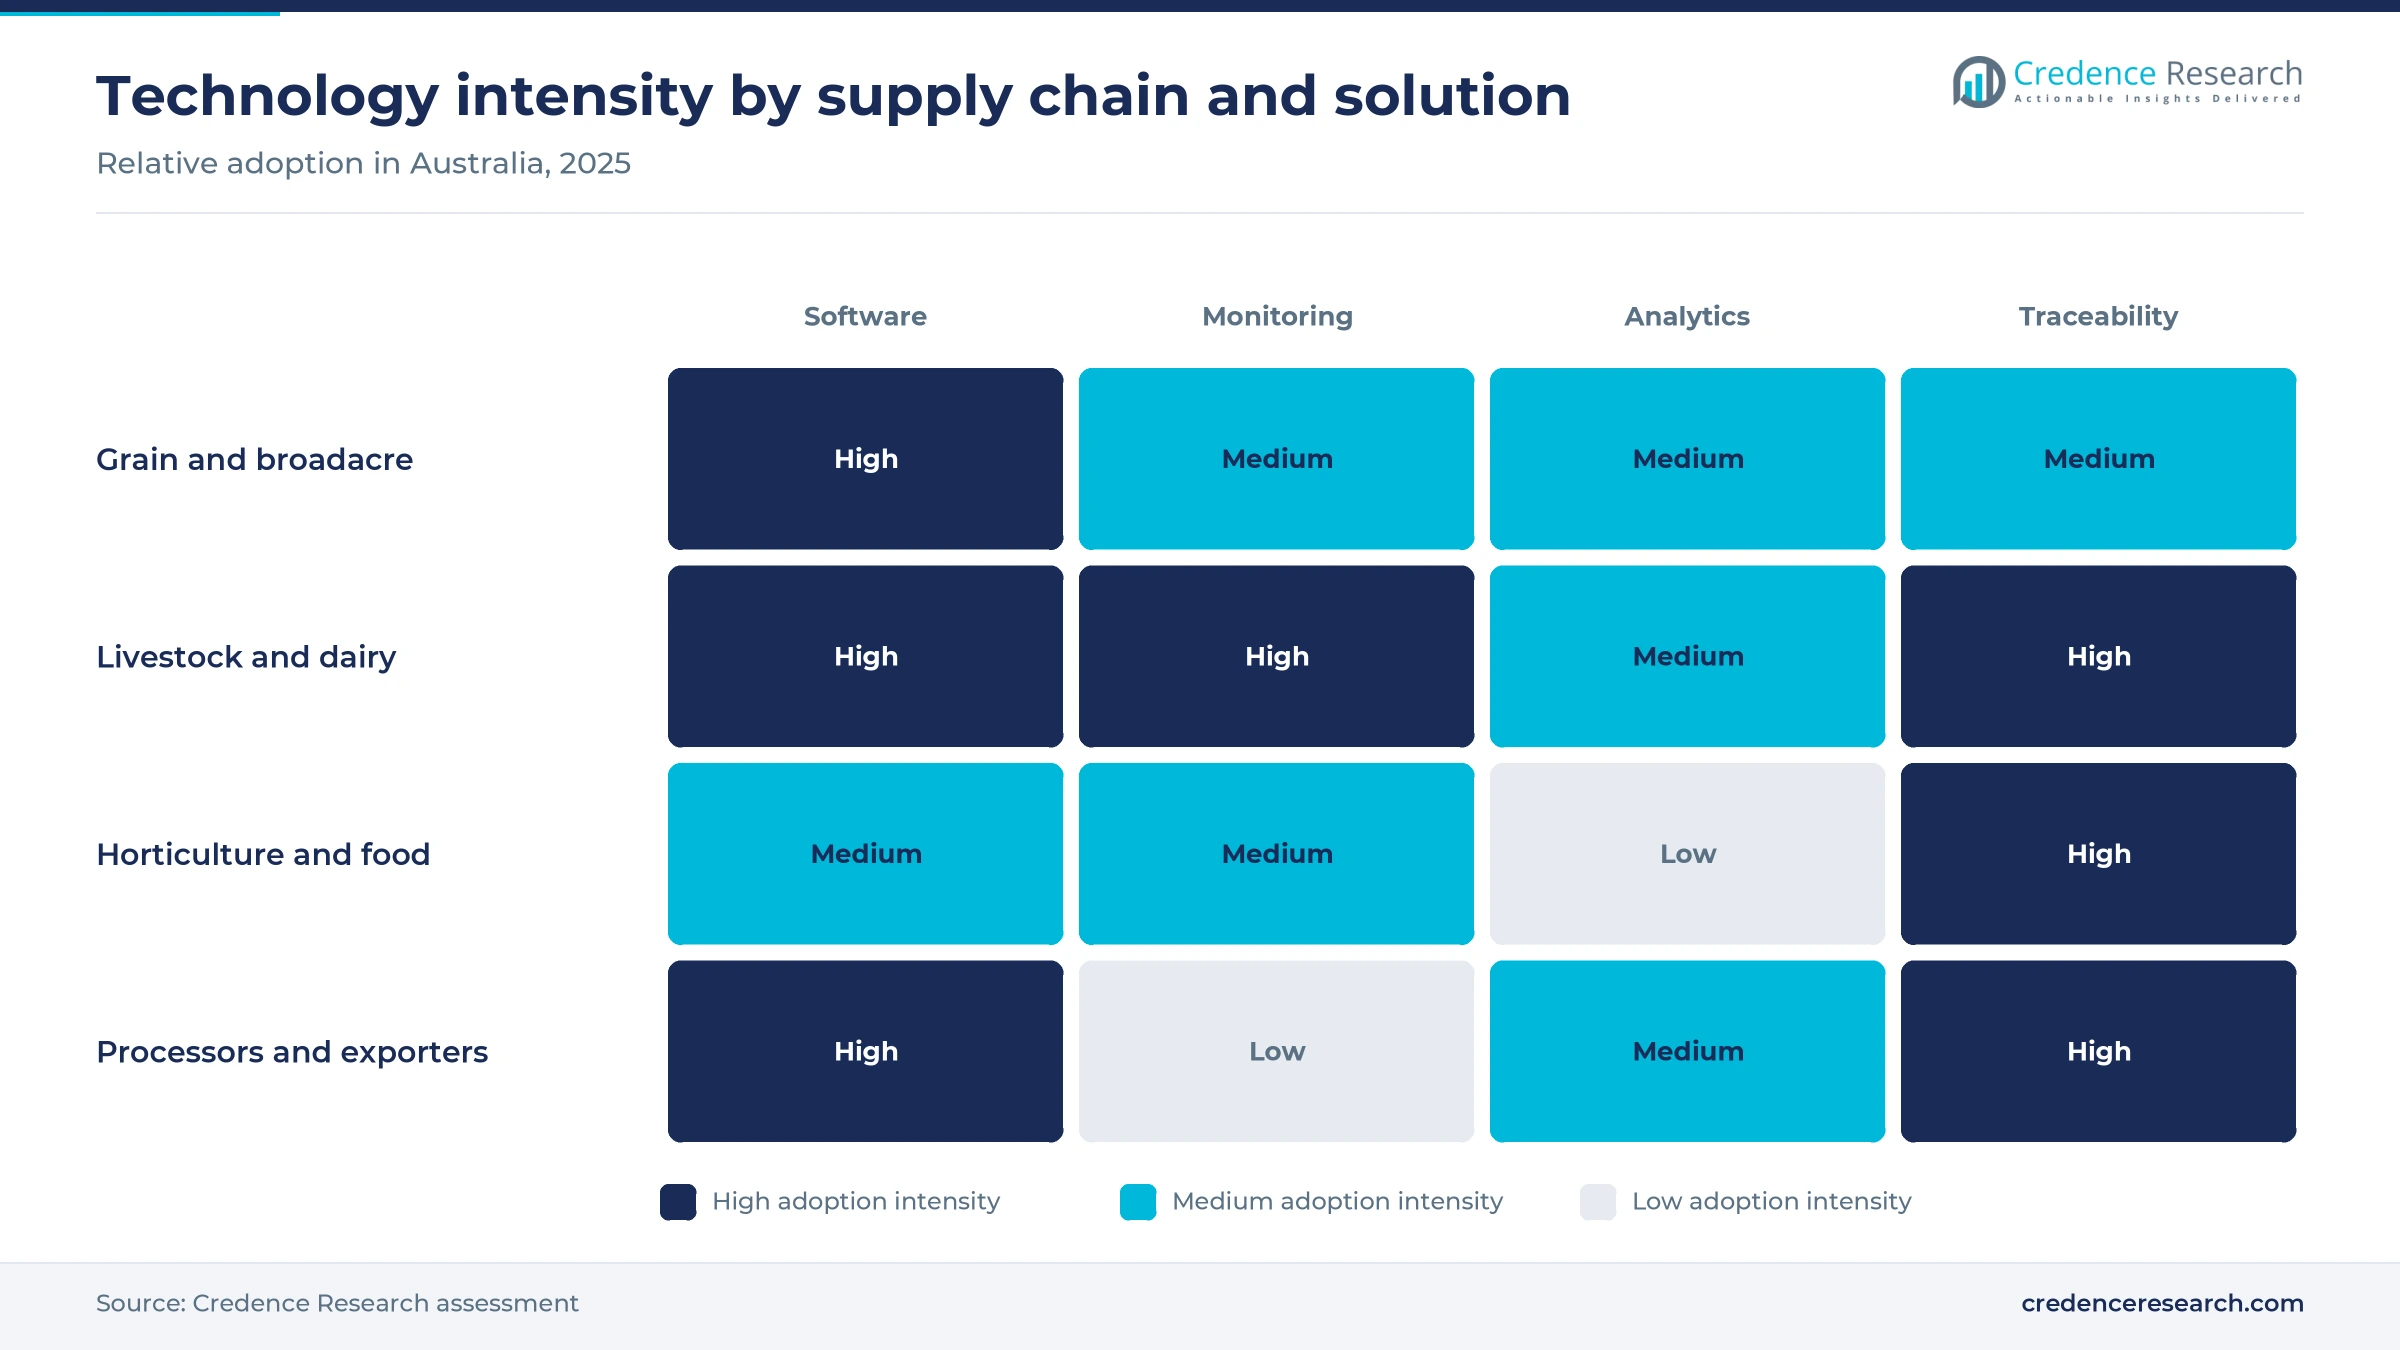
Based on solution type, the market is categorized into farm and enterprise supply chain software, connected monitoring platforms, artificial intelligence and decision analytics, and traceability and compliance platforms. Farm and enterprise supply chain software led with a 38.0% share of 2025 value, because grain contracts, livestock sales and payments already run through it. Artificial intelligence and decision analytics grows fastest at 13.35% a year, as satellite pasture and yield models move into daily decisions.
How do grain and livestock chains split demand?
Based on end-use industry, the market is categorized into grain and broadacre supply chains, livestock and dairy supply chains, and horticulture and diversified food supply chains. Grain and broadacre supply chains led with a 40.0% share of 2025 value, because bulk handlers and traders process millions of metric tons each harvest. Livestock and dairy supply chains grow fastest at 12.49% a year, as electronic tags turn every sheep and goat movement into a digital record.
Why are forecasting tools gaining on transaction work?
Based on application, the market is categorized into planning and transaction execution, traceability and compliance execution, and forecasting and optimization. Planning and transaction execution led with a 46.0% share of 2025 value, because every grain delivery and livestock sale needs contracts, invoices and records. Forecasting and optimization grows fastest at 12.72% a year, as producers use pasture, water and price models to time sales and feeding.
Why do managed cloud services dominate new contracts?
Based on deployment model, the market is categorized into managed cloud, customer-hosted and hybrid deployment. Managed cloud led with a 62.0% share of 2025 value and also grows fastest at 12.31% a year, because producers want apps that work on phones and sync when coverage returns. Customer-hosted systems remain mainly with large processors and bulk handlers that run their own enterprise systems.
| Segment Group | Leading Sub-segment | Share, 2025 | Fastest-growing Sub-segment | CAGR, 2026–2035 |
|---|---|---|---|---|
| By Solution Type | Farm and enterprise supply chain software | 38.0% | Artificial intelligence and decision analytics | 13.35% |
| By End-Use Industry | Grain and broadacre supply chains | 40.0% | Livestock and dairy supply chains | 12.49% |
| By Application | Planning and transaction execution | 46.0% | Forecasting and optimization | 12.72% |
| By Deployment Model | Managed cloud | 62.0% | Managed cloud | 12.31% |
Request a Free Sample
Fill in your details and we'll send you a free sample report.
- Sample data tables & charts
- Research methodology
Export rules, eID tags and farm links lift demand
Why do export traceability and documentation rules lift spending?
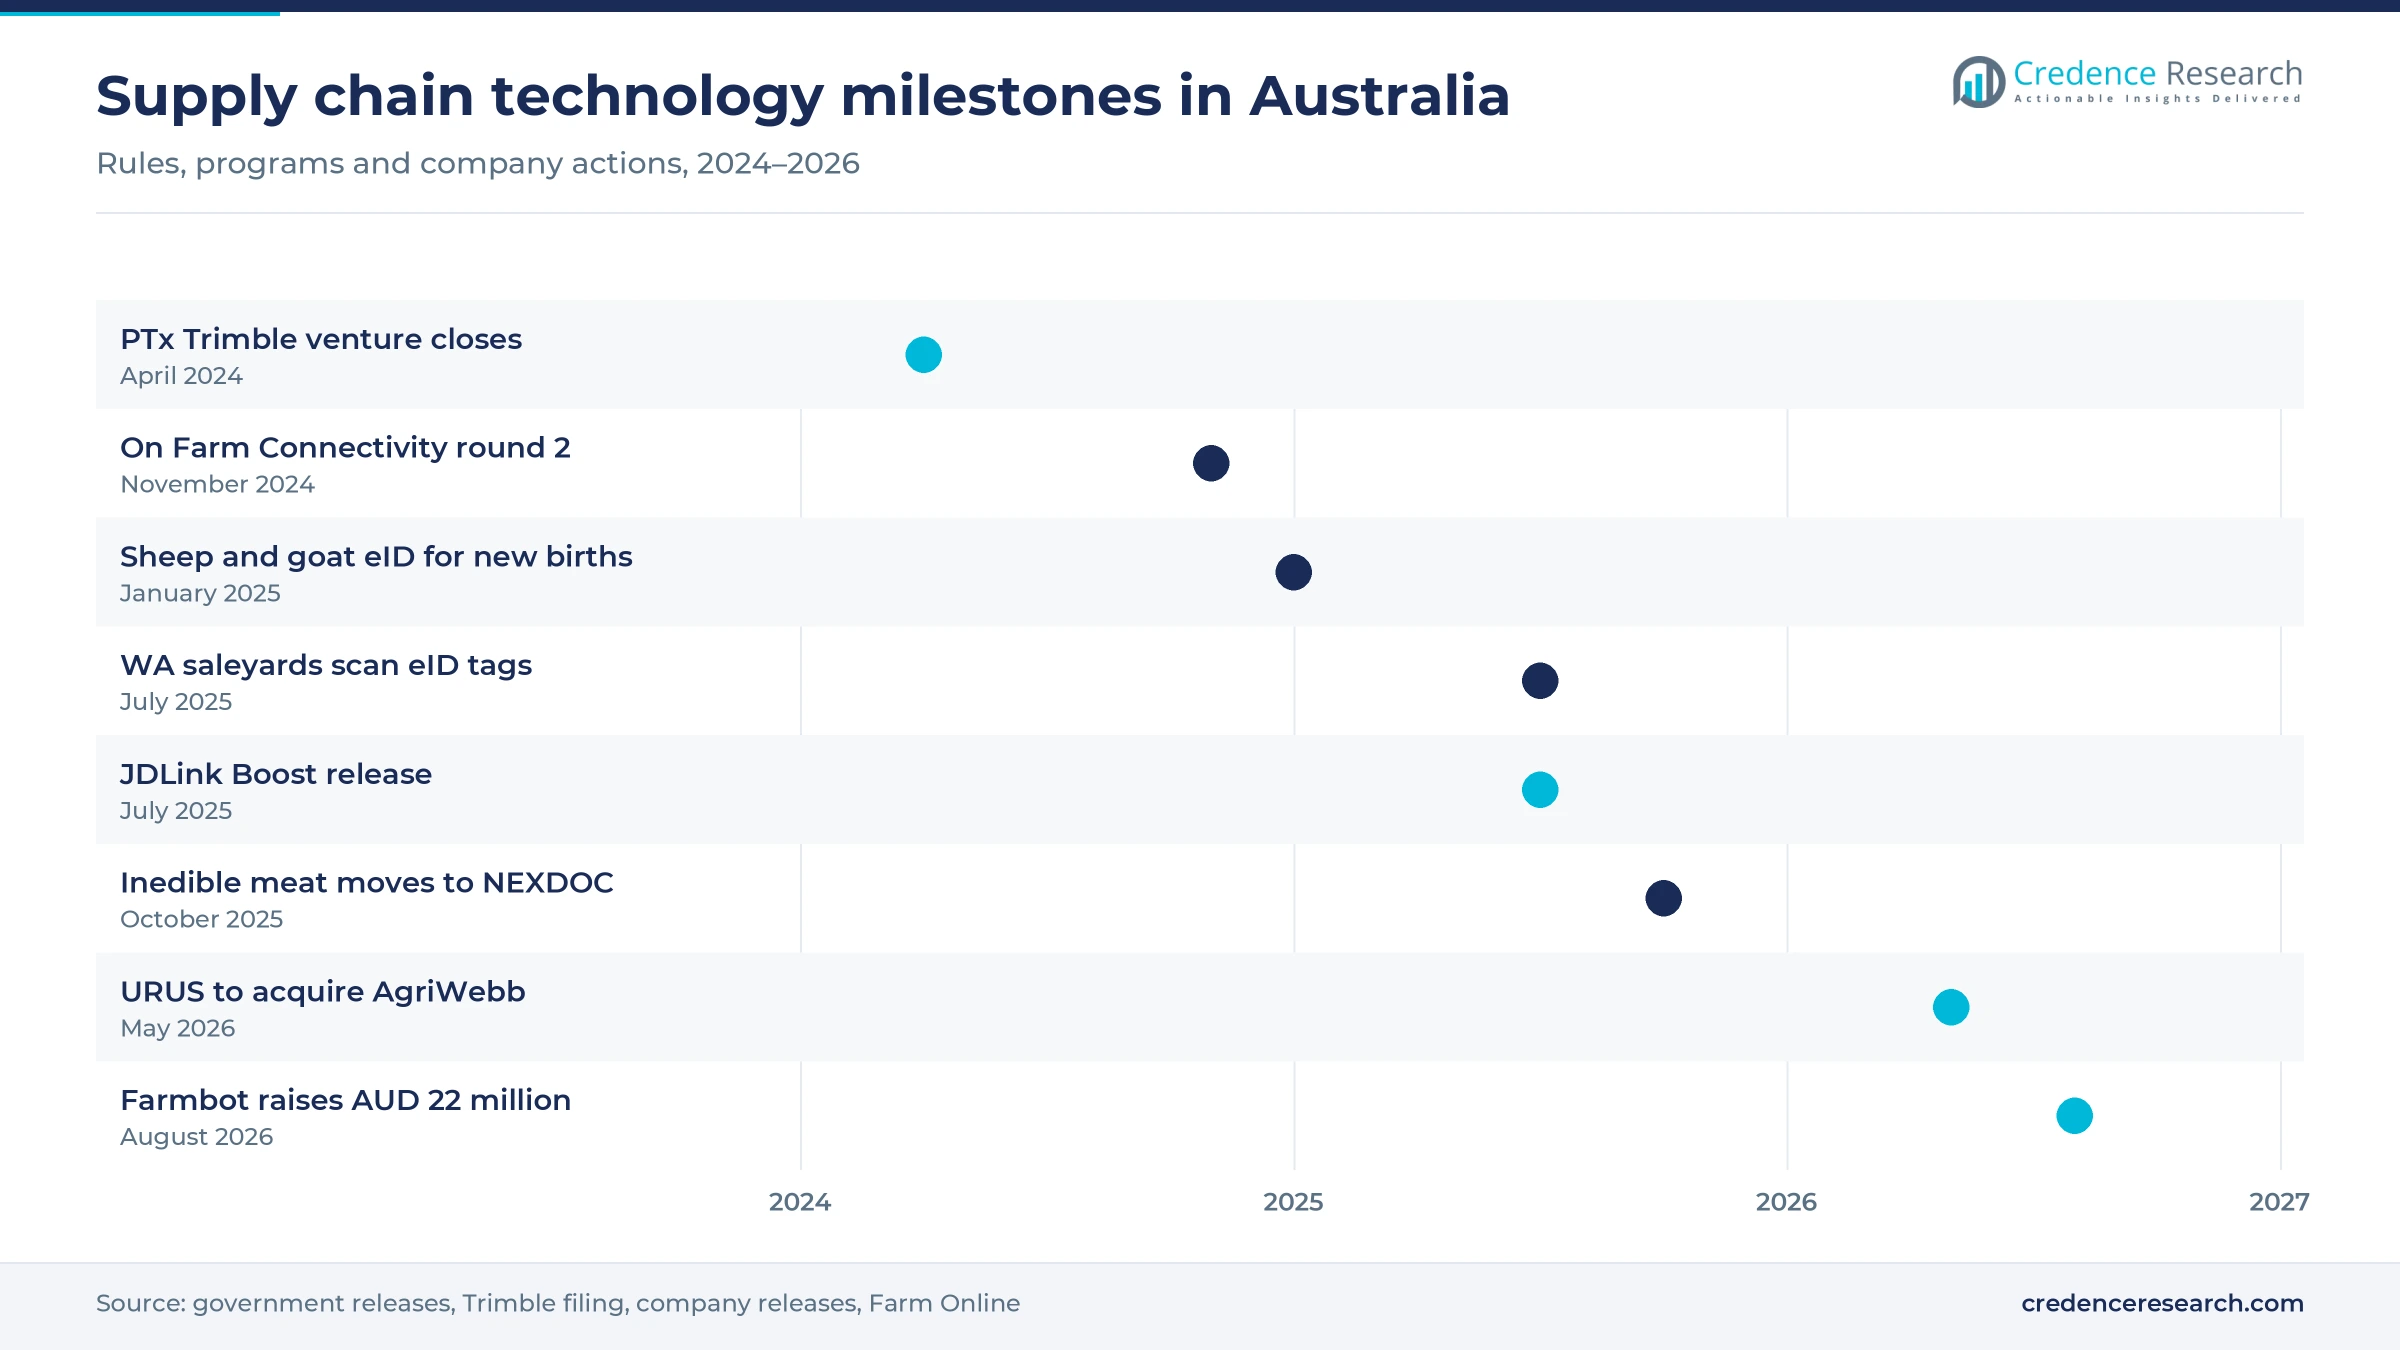
Overseas buyers and regulators want proof of origin, safety and handling, which pushes exporters to replace paper records with digital systems. Agricultural, fisheries and forestry exports were projected to reach AUD 83 billion in 2025-26 across more than 160 markets, according to the federal agriculture minister. The same release backed grants of AUD 50,000 to AUD 500,000 for interoperable traceability systems under the National Agricultural Traceability Strategy 2023 to 2033. The Department of Agriculture, Fisheries and Forestry also moved inedible meat export certificates from its EXDOC system to NEXDOC on Oct. 27, 2025. As a result, export firms shift more budget to traceability and compliance platforms, which lifts that application's share of spending.
How does livestock electronic identification create demand?
Individual tags for sheep and goats turn every movement into a data record, which forces producers, agents, saleyards and processors to buy scanning and recording tools. Agriculture ministers agreed that sheep and goats born on or after Jan. 1, 2025, must carry an electronic tag, and governments committed around AUD 150 million to the national rollout. In Western Australia, saleyards and abattoirs had to scan tagged animals from July 1, 2025, and nearly 4.8 million tags were sold under a discount scheme before 2025, according to the state Department of Primary Industries and Regional Development. The Commonwealth is also funding a AUD 26.6 million upgrade of the national livestock database. In turn, livestock and dairy supply chains grow fastest at 12.49% a year.
How do connected farm deployment rebates widen services?
Sensors and machine links pay off only when data reaches the office, so better rural connectivity directly expands the market for monitoring platforms. The federal On Farm Connectivity Program covers 50% of approved equipment costs, and its AUD 18 million second round was fully allocated within a week, according to Farm Online. More than 300 suppliers signed up for that round, compared with 79 suppliers in the first round, Farm Online reported. John Deere also made its Starlink-based JDLink Boost service available to all Australian customers in July 2025. As a result, managed cloud services lead with 62.0% of 2025 value, because connected devices report straight to hosted apps.
Why are grain marketing and payments moving onto platforms?
Large harvests multiply contracts, deliveries and payments, which makes digital transaction platforms more valuable to growers, traders and bulk handlers. Australia sold 34.8 million metric tons of wheat in 2024-25, up 24% from the previous year, according to the Australian Bureau of Statistics. New South Wales sold about 13.1 million metric tons and Western Australia about 12.4 million metric tons, which places most grain volume in two regional blocks. AgriDigital said on July 30, 2025, that about 108 million metric tons of grain worth roughly AUD 17 billion had passed through its platform, as it agreed to share data with FarmSimple, according to an AgriDigital release. As a result, grain and broadacre supply chains lead end-use demand with 40.0% of 2025 value.
Satellite analytics and mixed-fleet data reshape buying
Why is the shift to satellite pasture analytics gaining ground?
Graziers are moving from visual pasture checks to satellite estimates, which shifts spending toward analytics subscriptions. Cibo Labs' Australian Feedbase Monitor uses European Space Agency Sentinel 2 imagery to estimate pasture biomass at one-hectare resolution, with updates every five days, The Land reported in March 2024. The model draws on 7,500 field sites, and Meat and Livestock Australia members receive free access through a partnership with the company. A Northern Tablelands producer used the tool to bring his 2023 supplementary feeding program forward by one month. As a result, artificial intelligence and decision analytics grows fastest at 13.35% a year, and forecasting and optimization rises at 12.72%.
How is the rise of mixed-fleet machine data changing buying?
Farmers run machines from several brands, which raises demand for platforms that collect data across a mixed fleet. Trimble contributed its agriculture business to PTx Trimble, and after closing Trimble owns 15% and AGCO 85% of the venture, according to a Trimble quarterly filing. The venture closed on April 1, 2024, and offers factory-fit and retrofit products for mixed fleets, Farmers Hotline reported. John Deere tested its satellite machine link in cotton picking, spraying and seeding in Queensland and New South Wales before release. In turn, growers expect machine records to feed farm management software and grain contracts, which keeps farm and enterprise software at 38.0% of value.
Can provenance labels open a horticulture export opportunity?
Fresh produce exporters need to prove origin and cold handling, which opens an opportunity for serialized labels and shared records. The Australian Table Grape Association introduced carton-level digital identities based on GS1 Digital Link in a AUD 650,000 project funded by Agriculture Victoria, Food Processing reported in March 2022. Table grapes are the country's largest fresh horticulture export, with about AUD 623 million of export product. Trust Provenance has piloted blockchain-secured tracking with Citrus Australia for Sunraysia fruit, according to Stock Journal. As a result, horticulture and diversified food supply chains offer room for suppliers of food traceability systems that link packers with retailers and importers.
Is there an opening in remote water and asset monitoring?
Remote stations lose time and stock when water fails, which creates an opening for monitoring services sold by subscription. Farmbot raised more than AUD 22 million in August 2026 from investors including the Cultiv8 Livestock Technology Fund, Sustainability Matters reported. The company said its more than 12,000 customers manage around 10 million cattle and 15 million sheep, up from more than 3,500 farms and stations in June 2024, according to Agriculture Dive. The country held 29.7 million cattle and 65.8 million sheep and lambs on June 30, 2025, according to the Australian Bureau of Statistics. As a result, connected monitoring platforms still have a large unserved base, and usage and hardware-linked fees should grow alongside subscriptions.
Coverage gaps, grant cuts and costs slow adoption
Why does patchy rural coverage limit connected services?
Many paddocks, stock routes and water points sit outside mobile coverage, so sensors and machines cannot send data reliably. As a result, producers delay monitoring projects or pay extra for satellite and private network links. The speed at which rebate rounds sold out shows how large the unmet need remains. Suppliers respond with long-range radio networks, satellite modems and devices that store data offline, the same approach used for smart irrigation controllers.
How do short grant cycles slow traceability projects?
Many traceability pilots depend on government grants, which makes long-term planning hard for industry bodies and suppliers. Farm Online reported that AUD 6 million of uncommitted export traceability funds was clawed back in the May 12, 2026, budget. In turn, some sectors may wait longer for shared systems, which slows platform rollouts across their supply chains. Suppliers respond by tying projects to mandatory rules such as electronic tags and export certification, where demand does not depend on grants.
Why do small producers resist extra software costs?
Most of the 170,185 agricultural businesses counted in 2025-26 are small family operations, so each new subscription competes with feed, fuel and labor. As a result, many producers use free or entry-level tiers and add paid modules only when buyers or regulators require the data. This pattern keeps average spending per farm low outside large stations and corporate farms. Suppliers respond with bundled pricing through agents, saleyards and industry bodies, which spreads costs across members.
Why does weak data interoperability raise costs?
Producers, agents, carriers and processors often run different systems, so the same consignment data is keyed in several times. In turn, errors and duplicate entries reduce trust in digital records and slow the move away from paper. The federal traceability grants now fund interoperable systems, which shows that the gap remains significant. Platform developers respond with shared data agreements, such as the AgriDigital and FarmSimple deal, and with open interfaces to national livestock systems.
New South Wales leads while the north grows fastest
| Region | Value, 2025 (USD million) | Share, 2025 | CAGR, 2026–2035 |
|---|---|---|---|
| New South Wales and Australian Capital Territory | 38.9 | 33.7% | 11.64% |
| Victoria and Tasmania | 28.4 | 24.6% | 11.44% |
| Western Australia and South Australia | 24.8 | 21.5% | 12.24% |
| Queensland and Northern Territory | 23.3 | 20.2% | 12.64% |
Why do New South Wales grain and livestock chains lead?
New South Wales and Australian Capital Territory held a 33.7% share of 2025 value and grows at 11.64% a year, because the state combines the largest wheat sales with large cattle and sheep markets. New South Wales sold about 13.1 million metric tons of wheat in 2024-25, the highest of any state, according to the Australian Bureau of Statistics. John Deere also tested its satellite machine link on New South Wales farms before its national release in 2025.
How does northern beef growth lift Queensland demand?
Queensland and Northern Territory held a 20.2% share of 2025 value and grows fastest at 12.64% a year, because large beef stations are adopting digital animal, water and pasture records. Queensland held 13.5 million beef cattle on June 30, 2025, the largest share of the national herd, the Australian Bureau of Statistics reported. Queensland sheep and goat producers also tag newborn animals under the national rule, which adds demand for livestock identification and recording tools.

Why do Victorian dairy and fruit chains digitize early?
Victoria and Tasmania held a 24.6% share of 2025 value and grows at 11.44% a year, because dairy, sheep and fruit chains here adopted digital records early. Victoria has the largest dairy herd with 1.3 million head, and it has used electronic tags for sheep and goats since 2017. Producers and exporters in Victorian growing districts also generate about 90% of the country's table grape exports. Growth is slower because many users already run core platforms.
How do western grain and new tag rules shape demand?
Western Australia and South Australia held a 21.5% share of 2025 value and grows at 12.24% a year, because export grain and new sheep tagging rules drive spending. Western Australia sold about 12.4 million metric tons of wheat in 2024-25, close behind New South Wales. The state also set aside AUD 25.6 million for its tag transition, and all properties must scan tags on arrival from July 1, 2026.
Platform deals and machine links marked 2024 to 2026
| Development | Status and market relevance |
|---|---|
| In April 2024, AGCO and Trimble closed the PTx Trimble venture for mixed-fleet precision farming products. | Created a combined factory-fit and retrofit platform for growers |
| In July 2025, John Deere released JDLink Boost satellite machine connectivity to customers in Australia and New Zealand. | Extended machine data links beyond mobile coverage |
| In July 2025, AgriDigital and FarmSimple agreed to share data and build verified grain records from farm to buyer. | Supports grain traceability and sustainability reporting |
| In May 2026, URUS Group signed a definitive agreement to acquire livestock software developer AgriWebb. | Combines animal genetics records with farm management data |
| In August 2026, Farmbot raised more than AUD 22 million to expand its remote water monitoring services. | Funds growth across more than 12,000 customers |
Tags, satellites and shared records link the farm gate
- Electronic ear tags and scanners record each sheep, goat and head of cattle as it moves, which feeds national livestock databases.
- Satellite pasture and crop models estimate biomass and ground cover every few days, which helps producers plan feed and sales.
- Satellite and long-range radio links carry machine and sensor data from remote paddocks, which extends monitoring beyond mobile coverage.
- Digital export certificates replace paper forms with online records and QR codes, which speeds clearance for meat, dairy and produce.
Need a Custom Version of This Report?
Tailor the scope, geography, or segments to your exact requirements.
- Custom geography or segment scope
- Direct access to our analyst team
Local platforms compete with global machinery brands
Competition combines global machinery and enterprise software brands with Australian platforms built for local farm and export rules. John Deere and PTx Trimble bundle machine data, guidance and connectivity with their equipment and retrofit kits, which ties software to fleet purchases. Case IH sells AFS Connect telematics on its Puma tractors with remote dealer access. AgriDigital focuses on grain contracts, deliveries and payments, while AgriWebb serves livestock records and is being acquired by URUS Group. Farmbot sells remote water monitoring by subscription to cattle and sheep producers. Cibo Labs offers satellite pasture estimates through free and paid tiers, and Trust Provenance supplies blockchain-secured provenance tracking for produce. Suppliers compete on offline use, links to national livestock systems, export compliance features and support through agents rather than on price alone.
Companies profiled and their roles in this market
| Company | Type | Role in the market |
|---|---|---|
| PTx Trimble | Global precision farming venture | Supplies mixed-fleet guidance, data and retrofit products, owned 85% by AGCO |
| John Deere Digital Solutions | Global machinery brand | Offers JDLink Boost satellite connectivity and Operations Center data in Australia |
| Case IH Digital Solutions | Global machinery brand | Offers AFS Connect telematics on Puma tractors sold in Australia from May 2024 |
| AgriDigital | Australian grain platform | Runs grain contracts, deliveries and payments with about 108 million metric tons transacted |
| AgriWebb | Australian livestock software developer | Provides livestock records used for more than 25% of Australian farm livestock |
| Farmbot | Australian monitoring provider | Sells remote water monitoring to more than 12,000 customers |
| Cibo Labs | Australian analytics developer | Runs the Australian Feedbase Monitor for satellite pasture estimates |
| Trust Provenance | Australian traceability developer | Supplies blockchain-secured produce tracking piloted with Citrus Australia |
Credence Research view on digital farm-to-export chains
Credence Research's view is that Australian demand for agribusiness supply chain tools will keep rising because export buyers and regulators now expect digital proof of origin and animal movements. Transaction software remains the largest budget, while analytics and monitoring grow fastest as satellite and sensor data become routine. Livestock chains gain most from electronic tagging, especially in Queensland and Western Australia. However, patchy coverage, short grant cycles and cost pressure on small farms will slow uptake. Suppliers that link with national livestock systems and sell through agents should gain share.
How the estimate for Australian farm data was built
The supply chain technology report uses 2025 as the base year on a calendar basis, and market values come from the Credence Research model. That model combines official crop, livestock and business counts, government program data and company information on customers, platform volumes and product releases. Segment splits and regional growth rates are Credence Research estimates, and regional shares follow the Credence Research regional model. Sources used are official statistics, government websites, farm press and company releases, and no interviews or surveys were used.
Traceability mandates carry demand through 2035
Supply chain technology value in Australia is expected to reach USD 374.9 million by 2035, an 11.93% CAGR during 2026–2035, as export traceability, electronic tagging and connected farms keep demand rising. Growth should be strongest in northern beef regions, where stations are adding animal, water and pasture records. After 2028, analytics and shared data services will matter more than basic record keeping for winning contracts. Wider satellite coverage would raise this outlook, while weaker export prices would lower it. Suppliers with strong links to agents, saleyards and national databases are expected to gain the most.
Frequently Asked Questions
How big is the Australia agribusiness supply chain technology market?
Which solution type leads spending in Australia?
Which region leads Australian spending on these tools?
Which end-use industry buys the most supply chain tools?
When did electronic tags for sheep and goats become mandatory?
How does the On Farm Connectivity Program support adoption?
How much grain has moved through AgriDigital?
Which deployment model leads and grows fastest?
Table of Content
Chapter 1 Market Segmentation
- 1.1 Segmentation Framework
- 1.1.1 Product and Service Classification
- 1.1.2 Application and End-Use Classification
- 1.1.3 Technology and Solution Classification
- 1.1.4 Customer and Distribution Channel Classification
- 1.1.5 Geographic Segmentation
- 1.1.6 Market Segment Definitions and Boundaries
- 1.2 By Solution Type
- 1.2.1 Farm and enterprise supply chain software
- 1.2.2 Connected monitoring platforms
- 1.2.3 Traceability and compliance platforms
- 1.2.4 Artificial intelligence and decision analytics
- 1.3 By End-Use Industry
- 1.3.1 Grain and broadacre supply chains
- 1.3.2 Livestock and dairy supply chains
- 1.3.3 Horticulture and diversified food supply chains
- 1.4 By Application
- 1.4.1 Planning and transaction execution
- 1.4.2 Traceability and compliance execution
- 1.4.3 Forecasting and optimization
- 1.5 By Deployment Model
- 1.5.1 Managed cloud
- 1.5.2 Hybrid deployment
- 1.5.3 Customer-hosted
Chapter 2 Introduction
- 2.1 Report Objectives and Scope
- 2.2 Product Definition and Industry Terminology
- 2.3 Market Inclusions and Exclusions
- 2.4 Research Process
- 2.4.1 Primary Research and Expert Interviews
- 2.4.2 Secondary Research and Source Review
- 2.4.3 Top-Down and Bottom-Up Estimation
- 2.4.4 Data Triangulation and Verification
- 2.5 Market Size Measurement Basis
- 2.5.1 2025: USD 115.5 million → 2035: USD 374.9 million
- 2.6 Historical and Forecast Reference Periods
- 2.6.1 Historical Period: 2018-2025
- 2.6.2 Base Year: 2025
- 2.6.3 Forecast Period: 2025-2035
- 2.7 Research Assumptions and Limitations
Chapter 3 Executive Summary
- 3.1 Market Snapshot and Key Findings
- 3.2 Base-Year Market Size, 2025
- 3.3 Forecast Market Size, 2035
- 3.4 Revenue and Volume Growth Outlook
- 3.5 Key Demand and Supply Indicators
- 3.6 Leading Market Segments
- 3.7 Fastest-Growing Market Opportunities
- 3.8 Regional Performance Highlights
- 3.9 Technology and Industry Transformation
- 3.10 Competitive Landscape Summary
- 3.11 Analyst View and Strategic Implications
Chapter 4 Australia Agribusiness Supply Chain Technology Market Trends and Developments
- 4.1 Historical Industry Development, 2018-2025
- 4.2 Recent Market Trends and Developments
- 4.3 Demand and Customer Behavior Trends
- 4.4 Technology and Product Innovation
- 4.5 Artificial Intelligence, Automation and Digitalization
- 4.6 Local Manufacturing and Supply Chain Realignment
- 4.7 Industry Partnerships, Mergers and Acquisitions
- 4.8 Sustainability and Circular Economy Developments
- 4.9 Government and Private Sector Investment Trends
- 4.10 Emerging Business Models and Commercialization
- 4.11 Industry Developments and Announcements
Chapter 5 Australia Agribusiness Supply Chain Technology Market Production, Supply and Demand Analysis
- 5.1 Demand Trend and Consumption Analysis, 2018-2025
- 5.2 Demand Forecast, 2025-2035
- 5.3 Production and Output Trend, 2018-2025
- 5.4 Production and Output Forecast, 2025-2035
- 5.5 Installed Capacity and Capacity Utilization
- 5.6 Company-Wise Production Plants and Statistics
- 5.6.1 Installed Production Capacity
- 5.6.2 Actual Production
- 5.6.3 Planned Capacity and Expansion Targets
- 5.7 Supply Chain Structure and Procurement Trends
- 5.8 Supply-Demand Gap and Bottlenecks
- 5.9 Import Dependence and Sourcing Structure
- 5.10 Contract Manufacturing and Outsourcing
- 5.11 Regional Supply and Demand Concentration
Chapter 6 Australia Agribusiness Supply Chain Technology Market Pricing Analysis
- 6.1 Pricing Structure and Measurement
- 6.2 Historical Pricing Trends, 2018-2025
- 6.3 Pricing Outlook, 2025-2035
- 6.4 Average Selling Price and Unit Economics
- 6.5 Pricing by Product and Market Segment
- 6.6 Geographic Pricing Differences
- 6.7 Key Input, Energy, Labor and Logistics Costs
- 6.8 Contract Pricing and Purchasing Models
- 6.9 Pricing Sensitivity and Competitive Positioning
- 6.10 Price, Margin and Profitability Implications
Chapter 7 Australia Agribusiness Supply Chain Technology Market Dynamics
- 7.1 Market Growth Drivers
- 7.1.1 Demand-Side Drivers
- 7.1.2 Technology and Innovation Drivers
- 7.1.3 Infrastructure and Investment Drivers
- 7.1.4 Regulatory and Policy Drivers
- 7.2 Market Restraints
- 7.2.1 Cost and Affordability Constraints
- 7.2.2 Technology and Adoption Barriers
- 7.2.3 Supply Chain and Operational Constraints
- 7.3 Market Challenges
- 7.3.1 Competitive Pressure and Margin Erosion
- 7.3.2 Skills, Infrastructure and Implementation Gaps
- 7.4 Emerging Market Opportunities
- 7.5 Market Dynamics Impact and Time-Horizon Assessment
Chapter 8 Australia Agribusiness Supply Chain Technology Value Chain Analysis
- 8.1 Industry Value Chain Overview
- 8.2 Upstream Suppliers and Critical Inputs
- 8.3 Technology and Component Providers
- 8.4 Manufacturing or Service Delivery
- 8.5 Distribution, Channel Partners and Integrators
- 8.6 Downstream Applications and End Users
- 8.7 Value Addition and Profit Pools
- 8.8 Vertical Integration and Outsourcing
- 8.9 Supplier Concentration and Risk
- 8.10 Supply Chain Localization and Resilience
Chapter 9 Australia Agribusiness Supply Chain Technology Market Regulations and Policies
- 9.1 Relevant Laws, Standards and Compliance Frameworks
- 9.2 Product, Service, Safety and Quality Requirements
- 9.3 Government Policies, Incentives and Subsidies
- 9.4 Imports, Exports and Trade Barriers
- 9.5 Public Procurement and Local Content Requirements
- 9.6 Environmental and Sustainability Compliance
- 9.7 Upcoming Policy Changes and Market Implications
Chapter 10 Australia Agribusiness Supply Chain Technology Market Hotspots and Opportunities
- 10.1 Market Opportunity Mapping and Growth Hotspots
- 10.2 High-Growth Applications and Customer Groups
- 10.3 Underserved Markets and White-Space Opportunities
- 10.4 Emerging Technology and Product Opportunities
- 10.5 New Capacity and Investment Hotspots
- 10.6 Market Entry and Expansion Opportunities
- 10.7 Distribution and Partnership Opportunities
- 10.8 Near-Term and Long-Term Commercial Potential
- 10.9 Opportunity Attractiveness and Execution Risks
Chapter 11 Australia Agribusiness Supply Chain Technology Market Outlook, 2025-2035
- 11.1 Market Size and Analysis
- 11.1.1 Revenue (Market Measurement: 2025: USD 115.5 million → 2035: USD 374.9 million)
- 11.1.2 Market Volume and Quantity Sold
- 11.1.3 Historical Market Size, 2018-2025
- 11.1.4 Base-Year Market Size, 2025
- 11.2 Market Forecast, 2025-2035
- 11.2.1 Revenue Forecast to 2035
- 11.2.2 Volume Forecast to 2035
- 11.2.3 CAGR and Year-on-Year Growth
- 11.2.4 Incremental Revenue Opportunity
- 11.3 Forecast Assumptions and Scenario Analysis
- 11.3.1 Base-Case Forecast
- 11.3.2 Optimistic and Conservative Scenarios
- 11.3.3 Technology, Pricing and Policy Sensitivities
- 11.4 Market Attractiveness and Growth Outlook
Chapter 12 Australia Agribusiness Supply Chain Technology Market Segmentation and Outlook
- 12.1 Segmentation Summary and Market Shares, 2025
- 12.2 Largest and Fastest-Growing Segments
- 12.3 By Solution Type - Market Size and Forecast, 2025-2035
- 12.3.1 Segment Definition and Scope
- 12.3.2 Historical Market Size, 2018-2025
- 12.3.3 Revenue Forecast, 2025-2035
- 12.3.4 Volume Forecast, 2025-2035
- 12.3.5 Base-Year Market Share, 2025
- 12.3.6 Segment CAGR and Growth Drivers
- 12.3.7 Subsegment Market Size and Forecast
- 12.3.7.1 Farm and enterprise supply chain software
- 12.3.7.2 Connected monitoring platforms
- 12.3.7.3 Traceability and compliance platforms
- 12.3.7.4 Artificial intelligence and decision analytics
- 12.3.8 Subsegment Pricing and Adoption Trends
- 12.3.9 Leading Suppliers and Competition
- 12.3.10 Regional Demand and Opportunities
- 12.4 By End-Use Industry - Market Size and Forecast, 2025-2035
- 12.4.1 Segment Definition and Scope
- 12.4.2 Historical Market Size, 2018-2025
- 12.4.3 Revenue Forecast, 2025-2035
- 12.4.4 Volume Forecast, 2025-2035
- 12.4.5 Base-Year Market Share, 2025
- 12.4.6 Segment CAGR and Growth Drivers
- 12.4.7 Subsegment Market Size and Forecast
- 12.4.7.1 Grain and broadacre supply chains
- 12.4.7.2 Livestock and dairy supply chains
- 12.4.7.3 Horticulture and diversified food supply chains
- 12.4.8 Subsegment Pricing and Adoption Trends
- 12.4.9 Leading Suppliers and Competition
- 12.4.10 Regional Demand and Opportunities
- 12.5 By Application - Market Size and Forecast, 2025-2035
- 12.5.1 Segment Definition and Scope
- 12.5.2 Historical Market Size, 2018-2025
- 12.5.3 Revenue Forecast, 2025-2035
- 12.5.4 Volume Forecast, 2025-2035
- 12.5.5 Base-Year Market Share, 2025
- 12.5.6 Segment CAGR and Growth Drivers
- 12.5.7 Subsegment Market Size and Forecast
- 12.5.7.1 Planning and transaction execution
- 12.5.7.2 Traceability and compliance execution
- 12.5.7.3 Forecasting and optimization
- 12.5.8 Subsegment Pricing and Adoption Trends
- 12.5.9 Leading Suppliers and Competition
- 12.5.10 Regional Demand and Opportunities
- 12.6 By Deployment Model - Market Size and Forecast, 2025-2035
- 12.6.1 Segment Definition and Scope
- 12.6.2 Historical Market Size, 2018-2025
- 12.6.3 Revenue Forecast, 2025-2035
- 12.6.4 Volume Forecast, 2025-2035
- 12.6.5 Base-Year Market Share, 2025
- 12.6.6 Segment CAGR and Growth Drivers
- 12.6.7 Subsegment Market Size and Forecast
- 12.6.7.1 Managed cloud
- 12.6.7.2 Hybrid deployment
- 12.6.7.3 Customer-hosted
- 12.6.8 Subsegment Pricing and Adoption Trends
- 12.6.9 Leading Suppliers and Competition
- 12.6.10 Regional Demand and Opportunities
- 12.7 Segment Growth Comparison
- 12.8 Segment Attractiveness and Priority Matrix
Chapter 13 Australia Agribusiness Supply Chain Technology End-Use and Application Market Outlook
- 13.1 End-Use Industry and Customer Demand Structure
- 13.2 Leading Applications and Customer Groups
- 13.3 End-Use Market Size, Share and Forecast
- 13.4 Major End-Use Industry Deep Dives
- 13.4.1 Customer Requirements and Use Cases
- 13.4.2 Demand and Replacement Cycles
- 13.4.3 Technical and Regulatory Considerations
- 13.4.4 Purchasing and Procurement Models
- 13.4.5 Leading Vendors and Distribution Channels
- 13.4.6 Forecast and Commercial Opportunities
- 13.5 Emerging Applications and Cross-Segment Demand
- 13.6 End-Use Industry Investment Priorities
Chapter 14 Australia Agribusiness Supply Chain Technology Geographic Market Outlook, 2025-2035
- 14.1 Domestic Market Distribution and Demand Clusters
- 14.2 State- or Province-Wise Market Size and Forecast, 2025-2035
- 14.3 City and Metropolitan Market Outlook
- 14.4 Industrial, Manufacturing and Commercial Clusters
- 14.5 Geographic Concentration of Key End Users
- 14.6 Local Pricing and Purchasing Differences
- 14.7 Domestic Production Facilities and Capacity Map
- 14.8 Local Infrastructure and Project Pipeline
- 14.9 State-Level Policy and Incentive Differences
- 14.10 Subnational Investment Hotspots and Opportunities
- 14.11 Distribution and Logistics Networks
- 14.12 Domestic Competitive Footprint
Chapter 15 Australia Agribusiness Supply Chain Technology Technology, Innovation and Sustainability Outlook
- 15.1 Technology Landscape and Maturity
- 15.2 Product, Process and Service Innovation
- 15.3 AI, Automation and Digital Tools in the Industry
- 15.4 Technology Adoption and Performance Benchmarking
- 15.5 Innovation Pipeline and R&D Investment
- 15.6 Patent and Intellectual Property Trends
- 15.7 Energy Efficiency and Resource Management
- 15.8 Sustainability, Recycling and Circularity
- 15.9 Technology Roadmap, 2025-2035
- 15.10 Risks of Obsolescence and Technology Substitution
Chapter 16 Australia Agribusiness Supply Chain Technology Market Key Strategic Imperatives
- 16.1 Growth and Market Entry Priorities
- 16.2 High-Return Products and Segments
- 16.3 Pricing, Profitability and Cost Optimization
- 16.4 Technology Investment and Product Differentiation
- 16.5 Supply Chain Localization and Resilience
- 16.6 Distribution and Customer Acquisition
- 16.7 Partnership, Acquisition and Capacity Strategy
- 16.8 Regional Expansion Priorities
- 16.9 Short-, Medium- and Long-Term Actions
Chapter 17 Competition Outlook
- 17.1 Industry Competition Characteristics
- 17.2 Market Structure and Concentration
- 17.3 Market Share and Competitive Positioning, 2025
- 17.4 Company-Wise Revenue and Product Benchmarking
- 17.5 Production and Service Capacity Benchmarking
- 17.6 Technology, Pricing and Differentiation
- 17.7 Regional Footprint and Distribution Strength
- 17.8 Mergers, Acquisitions and Strategic Alliances
- 17.9 New Entrants and Competitive Threats
- 17.10 Porter's Five Forces and Industry Attractiveness
- 17.11 Competitive Outlook, 2025-2035
Chapter 18 Company Profiles
- 18.1 Company Coverage and Selection Criteria
- 18.2 PTx Trimble
- 18.2.1 Business Description
- 18.2.2 Company Ownership and Geographic Presence
- 18.2.3 Product and Service Portfolio
- 18.2.4 Manufacturing and Operating Footprint
- 18.2.5 Production Capacity and Expansion Plans
- 18.2.6 Financial Performance and Investment
- 18.2.7 Market Share and Competitive Position
- 18.2.8 Technology and Innovation Capabilities
- 18.2.9 Strategic Alliances or Partnerships
- 18.2.10 Recent Developments
- 18.2.11 Growth Strategy and Outlook
- 18.3 John Deere Digital Solutions
- 18.4 Case IH Digital Solutions
- 18.5 AgriDigital
- 18.6 AgriWebb
- 18.7 Farmbot
- 18.8 Cibo Labs
- 18.9 Trust Provenance
- 18.10 Other Relevant Market Participants
Note: Every listed company is profiled on the structure shown under the first company. The company list is preliminary and may change based on research findings, market developments, data availability and client requirements.
Chapter 19 Disclaimer
- 19.1 Research and Forecast Disclaimer
- 19.2 Data Source and Estimation Limitations
Note: The depth of individual sections depends on data availability for this market. Volume, capacity, trade and other unit-based metrics are included where applicable.

