Distributed Energy Resource Management System Market Overview:
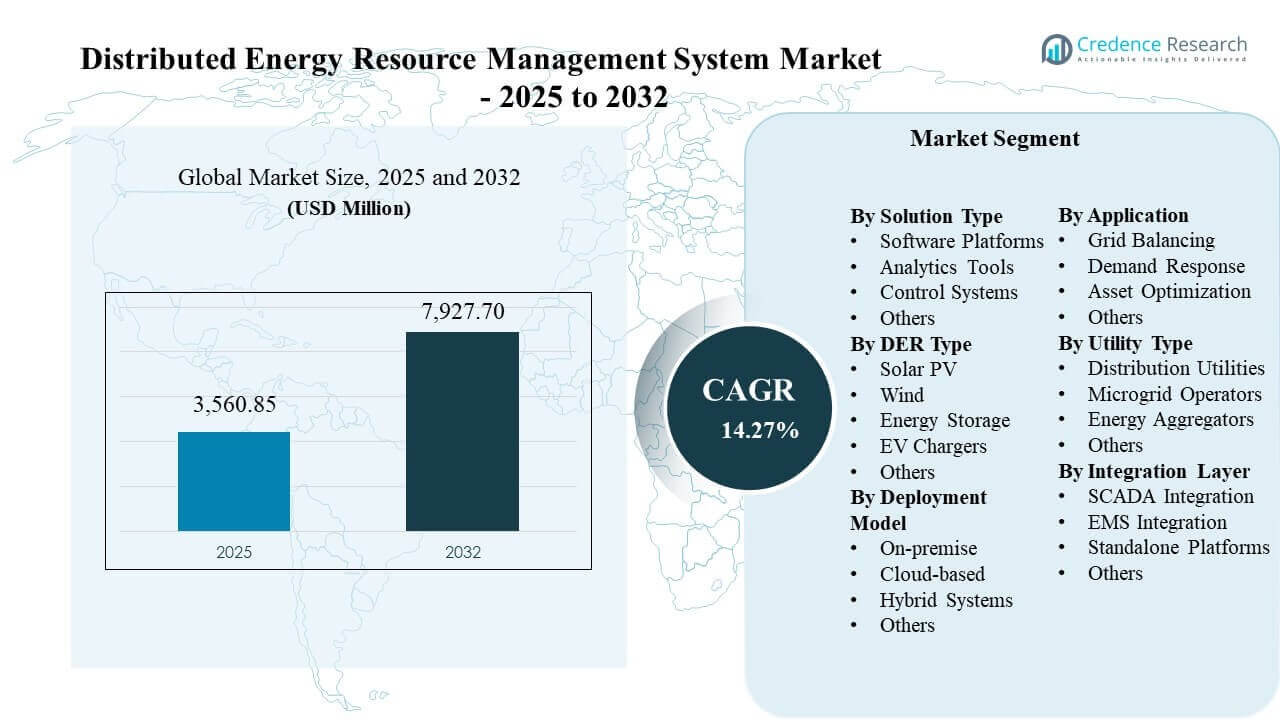
The Distributed Energy Resource Management System Market size was estimated at USD 3,560.85 million in 2025 and is expected to reach USD 7,927.70 million by 2032, growing at a CAGR of 14.27% from 2025 to 2032. Growth is primarily supported by rising distributed solar, storage, and electrified loads that increase distribution-grid constraints and require orchestration software to maintain reliability and power quality. Utility modernization programs and expanding flexibility programs also accelerate procurement as operators seek scalable visibility, forecasting, and dispatch across grid-edge assets.
| REPORT ATTRIBUTE | DETAILS |
|---|---|
| Historical Period | 2020-2024 |
| Base Year | 2025 |
| Forecast Period | 2026-2032 |
| Distributed Energy Resource Management System Market Size 2025 | USD 3,560.85 million |
| Distributed Energy Resource Management System Market, CAGR | 14.27% |
| Distributed Energy Resource Management System Market Size 2032 | USD 7,927.70 million |
Key Market Trends & Insights
- North America led regional revenue in 2025 with a 36.4% share, reflecting stronger DER penetration and earlier DER orchestration investments.
- Software Platforms accounted for the largest share of 56.3% in 2025, reflecting preference for configurable platforms over point solutions.
- Solar PV represented 36.1% share in 2025 among DER types, reinforcing the need for forecasting and constraint management on distribution feeders.
- On-premise deployment held 48.2% share in 2025, supported by utility control-room requirements and security considerations.
Segment Analysis
The Distributed Energy Resource Management System Market is increasingly shaped by platform-led deployments that unify DER onboarding, telemetry, forecasting, and dispatch under one operational layer. Utilities and aggregators prioritize architectures that reduce operational fragmentation and enable feeder-level constraint management as DER volumes rise. Buyer preference also tilts toward solutions that integrate with utility operations environments, aligning DER visibility and control with outage, voltage, and congestion workflows.
Demand for orchestration expands beyond event-based programs toward continuous flexibility, where distributed solar, storage, and EV charging loads require more frequent optimization. Deployment decisions often reflect a balance between utility cyber and compliance requirements and the need to scale functionality through faster update cycles. As electrification and renewable penetration rise, procurement focus shifts toward systems that improve hosting capacity, reduce curtailment, and support measurable grid services.
By Solution Type Insights
Software Platforms accounted for the largest share of 56.3% in 2025. Software Platforms lead because utilities need configurable orchestration across diverse DER portfolios without rebuilding operational workflows for each program. Software Platforms also improve scalability through unified onboarding, forecasting, and dispatch that can extend across multiple feeders and service territories. Integration readiness and interoperability requirements further favor platform architectures that connect with existing grid operations environments and flexibility ecosystems.
By DER Type Insights
Solar PV accounted for the largest share of 36.1% in 2025. Solar PV leads because high penetration creates visibility and voltage-management needs at the distribution edge, particularly during peak generation periods. Solar PV variability increases the value of forecasting and coordinated dispatch, which strengthens requirements for feeder-aware orchestration. Interconnection growth and behind-the-meter adoption also push utilities toward standardized onboarding and constraint-management capabilities that align with solar-heavy portfolios.
By Deployment Model Insights
On-premise accounted for the largest share of 48.2% in 2025. On-premise deployment leads because distribution operators often prioritize operational control, cybersecurity, and regulatory compliance for grid-critical dispatch functions. On-premise architectures also align with legacy OT environments and data governance policies that remain common across utilities. Many buyers adopt a staged approach, starting with on-premise control and expanding hybrid patterns over time as analytics and user-facing layers mature.
By Application Insights
Grid balancing, demand response, and asset optimization use cases increasingly overlap as DER portfolios grow and distribution constraints become more dynamic across time-of-day and seasonal conditions. Grid balancing demand rises with congestion management needs linked to electrification and variable renewable output. Demand response expands from event-driven programs toward continuous flexibility and virtual power plant-style dispatch. Asset optimization strengthens as utilities seek higher hosting capacity and reduced curtailment without immediate, capex-heavy network upgrades.
By Utility Type Insights
Distribution utilities remain central buyers because distribution utilities carry responsibility for feeder reliability, interconnection operations, and constraint management as DER penetration rises. Microgrid operators expand orchestration needs to optimize local generation, storage, and load during resilience events and islanded operation. Energy aggregators scale portfolios across customer sites and require dispatch coordination, measurement, verification, and settlement enablement. Coordination between aggregators and distribution operators increases integration needs and strengthens demand for operational alignment.
By Integration Layer Insights
SCADA integration, EMS integration, and standalone platforms are selected based on the maturity of utility operations environments and the desired level of closed-loop control. SCADA integration supports real-time telemetry and operator workflows where DER dispatch must align with distribution operations. EMS integration strengthens visibility and coordination where broader system operations require aggregated flexibility and forecasting. Standalone platforms often appear in early-stage deployments but typically evolve toward deeper operational integration as DER volume and reliability expectations increase.
Distributed Energy Resource Management System Market Drivers
Accelerating DER penetration on distribution grids
Rising adoption of distributed solar, battery storage, and electrified loads increases operational complexity on distribution networks. Utilities require orchestration to maintain voltage limits, manage reverse power flow, and reduce feeder congestion. DER dispatch and visibility also support faster interconnection processing by improving hosting-capacity evaluation and constraint handling. The Distributed Energy Resource Management System Market benefits as operators prioritize software layers that reduce curtailment and improve reliability under higher variability.
- For instance, PPL Electric reported that its DER Management Pilot increased estimated hosting capacity by 98 MW, and the utility interconnected 4,225 new DERs totaling 44.5 MW in 2023 while the pilot program was in place.
Grid modernization and digital operations investment
Distribution operators increasingly invest in modern grid operations platforms to improve situational awareness and decision-making. DER orchestration becomes a core requirement as utilities seek unified workflows across interconnection, forecasting, dispatch, and compliance reporting. Integration with operational environments supports tighter alignment between DER behavior and outage, voltage, and congestion workflows. The Distributed Energy Resource Management System Market expands as utilities standardize platforms to scale programs across service territories.
Growth of flexibility programs and aggregator ecosystems
Utilities and regulators expand flexibility programs to manage peaks and improve reliability without immediate network reinforcement. Aggregators also scale virtual power plant portfolios that require secure dispatch, measurement, and verification capabilities. DER orchestration supports performance tracking, settlement alignment, and participation in grid-service mechanisms. The Distributed Energy Resource Management System Market grows as buyers adopt systems that coordinate distributed portfolios across time, location, and program rules.
- For instance, Green Mountain Power said its battery-based virtual power plant had 30 MW of deployed capacity and planned to expand to 55 MW, while its earlier Tesla aggregation model was designed to include up to 2,000 residential and commercial systems.
Need to improve hosting capacity and defer capex
Distribution networks face rising pressure to connect DERs while limiting costly infrastructure upgrades. Orchestration helps optimize existing assets by controlling export limits, coordinating storage charging, and shifting flexible loads. Improved constraint management reduces thermal overload risk and stabilizes voltage profiles, supporting higher DER hosting capacity. The Distributed Energy Resource Management System Market gains momentum as utilities pursue operational solutions that defer capex and improve utilization of existing infrastructure.
Distributed Energy Resource Management System Market Challenges
Interoperability remains a major challenge because DER portfolios include many device types, communication standards, and vendor ecosystems. Integration with utility operations environments often requires careful data modeling, cybersecurity alignment, and change management. Long utility procurement cycles and evolving regulatory requirements can delay deployments and expansion. Program fragmentation across demand response, flexibility, and distribution operations can also create organizational complexity that slows platform standardization.
- For instance, NREL partnered with Smarter Grid Solutions to implement a DERMS environment that connected OpenADR messaging, ADMS interfaces, real and virtual Level 2 chargers, DER aggregators, and a 30 kW PV/battery inverter, illustrating the level of multi-device and multi-interface interoperability utilities must coordinate before broader rollout.
Cybersecurity and data governance requirements increase deployment effort, especially where control functions affect grid reliability. Utilities must manage access controls, auditability, and resilience in environments that blend IT and OT domains. Workforce constraints can limit implementation speed because integration, testing, and operational training require specialized skills. Benefits measurement can also be challenging when value spans multiple objectives such as reliability, curtailment reduction, and deferred infrastructure investment.
Distributed Energy Resource Management System Market Trends and Opportunities
Hybrid architectures expand as utilities seek to keep mission-critical control closer to operations while moving analytics and user-facing capabilities toward more scalable environments. Platform roadmaps increasingly emphasize forecasting, constraint management, and program orchestration under a single operational model. The Distributed Energy Resource Management System Market benefits as buyers prioritize architectures that support phased deployment and multi-program expansion without redesigning operational workflows.
Virtual power plant growth creates opportunities for coordinated dispatch and verification across residential, commercial, and industrial portfolios. Increasing EV charging loads elevate the value of localized orchestration that can reduce peak stress and support grid-service participation. Utility–aggregator coordination also drives demand for standardized interfaces and shared visibility. The Distributed Energy Resource Management System Market advances as flexibility ecosystems mature and require scalable orchestration across feeders and customer sites.
- For instance, sonnen stated that the next phase of its sonnenVPP would add 5,000 households equipped with an EV and sonnenCharger, creating up to 80 MW of grid-support capacity for TenneT, whose frequency containment reserve requirement is 170 MW, highlighting how EV-integrated VPP orchestration is moving toward verified, utility-relevant scale.
Regional Insights
North America
North America accounted for the largest share of 36.4% in 2025. Strong DER penetration, earlier investment in grid modernization, and mature flexibility programs support faster platform adoption. Utility operating models also prioritize reliability and compliance, which increases demand for feeder-aware visibility and dispatch. Vendor competition is strong due to large-scale deployments and expanding aggregator ecosystems.
Europe
Europe held a 27.6% share in 2025. Policy-driven decarbonization and distributed generation expansion increase the need for orchestration to manage congestion and power quality. Distribution operators pursue digital operations improvements to connect DERs while limiting network reinforcement costs. Market demand also rises as flexibility mechanisms develop across multiple countries and grid operators prioritize standardization.
Asia Pacific
Asia Pacific represented 23.8% share in 2025. Accelerating renewable buildouts, electrification trends, and distribution modernization programs increase platform demand across high-growth power systems. Utilities and energy service providers emphasize scalability and program expansion as DER portfolios grow across urban and industrial regions. The region also shows rising interest in orchestration that can support both utility-led and aggregator-led flexibility models.
Latin America
Latin America accounted for 7.1% share in 2025. Distributed solar expansion and commercial energy management use cases support growing interest in orchestration, especially where peak management is a priority. Adoption remains uneven due to varying utility digital maturity and regulatory structures. Growth improves where modernization programs and flexibility initiatives strengthen procurement pathways.
Middle East & Africa
Middle East and Africa held a 5.1% share in 2025. Demand grows with grid modernization efforts and early DER integration initiatives, particularly in markets scaling distributed solar and storage. Adoption is still developing due to differences in DER density, operational readiness, and market structures. Opportunities increase where resilience programs and modernization funding support platform deployment.
Competitive Landscape
Competition in the Distributed Energy Resource Management System Market is defined by integration depth with distribution operations environments, platform scalability, cybersecurity posture, and interoperability across DER ecosystems. Vendors differentiate through feeder-aware constraint management, forecasting quality, and workflow alignment for onboarding, dispatch, and compliance reporting. Suite-based positioning is common, where DER orchestration aligns with broader grid operations portfolios. Partnerships with aggregators, device ecosystems, and utilities also influence deployment scale and expansion speed.
Schneider Electric focuses on utility software platforms that support operational decision-making and grid modernization initiatives. Schneider Electric positioning aligns with unifying operational workflows, improving visibility, and enabling data-driven dispatch across distribution environments. Schneider Electric also emphasizes ecosystem interoperability to support multi-vendor DER portfolios and program growth. This approach supports utilities seeking standardization and operational alignment as DER penetration increases.
The industry research and growth report includes detailed analyses of the competitive landscape of the market and information about key companies, including:
- Schneider Electric
- Siemens
- ABB
- General Electric
- Oracle
- IBM
- AutoGrid
- Opus One Solutions
- Enel X
- Hitachi Energy
Qualitative and quantitative analysis of companies has been conducted to help clients understand the wider business environment as well as the strengths and weaknesses of key industry players. Data is qualitatively analyzed to categorize companies as pure play, category-focused, industry-focused, and diversified; it is quantitatively analyzed to categorize companies as dominant, leading, strong, tentative, and weak.
Recent Developments
- In March 2025, Oracle announced new enhancements to its Oracle Utilities Network Management System, adding stronger distributed energy resource orchestration, better forecasting, and improved grid reliability features for utilities.
- In March 2025, Mitsubishi Electric Power Products’ subsidiary Smarter Grid Solutions and Clean Power Research completed the integration of the Strata Grid DERMS solution with the PowerClerk workflow automation platform, a partnership aimed at streamlining DER registration and enabling real-time control of front-of-the-meter and behind-the-meter assets.
- In August 2024, Budderfly announced the acquisition of Sunverge Energy’s grid-edge DERMS platform, expanding its ability to aggregate distributed energy resources and build virtual power plants for commercial customers and utilities.
Report Scope
| Report Attribute | Details |
| Market size value in 2025 | USD 3,560.85 million |
| Revenue forecast in 2032 | USD 7,927.70 million |
| Growth rate (CAGR) | 14.27% (2025–2032) |
| Base year | 2025 |
| Forecast period | 2026-2032 |
| Quantitative units | USD million |
| Segments covered | By Solution Type, By DER Type, By Deployment Model, By Application, By Utility Type, By Integration Layer |
| Regional scope | North America, Europe, Asia Pacific, Latin America, Middle East & Africa |
| Key companies profiled | Schneider Electric; Siemens; ABB; General Electric; Oracle; IBM; AutoGrid; Opus One Solutions; Enel X; Hitachi Energy |
| No. of Pages | 334 |
Segmentation
By Solution Type
- Software Platforms
- Analytics Tools
- Control Systems
- Others
By DER Type
- Solar PV
- Wind
- Energy Storage
- EV Chargers
- Others
By Deployment Model
- On-premise
- Cloud-based
- Hybrid Systems
- Others
By Application
- Grid Balancing
- Demand Response
- Asset Optimization
- Others
By Utility Type
- Distribution Utilities
- Microgrid Operators
- Energy Aggregators
- Others
By Integration Layer
- SCADA Integration
- EMS Integration
- Standalone Platforms
- Others
By Region
- North America
- U.S.
- Canada
- Mexico
- Europe
- Germany
- France
- U.K.
- Italy
- Spain
- Rest of Europe
- Asia Pacific
- China
- Japan
- India
- South Korea
- South-east Asia
- Rest of Asia Pacific
- Latin America
- Brazil
- Argentina
- Rest of Latin America
- Middle East & Africa
- GCC Countries
- South Africa
- Rest of the Middle East and Africa

Request a Free Sample
Fill in your details and we'll send you a free sample report.
- Sample data tables & charts
- Research methodology
Market Dynamics
Accelerating DER Penetration on Distribution Grids
The rapid increase in distributed solar, battery storage, and electrified loads is driving utilities to adopt DER management systems to maintain voltage limits, manage reverse power flow, and reduce feeder congestion, supporting grid reliability as variability rises.
Grid Modernization and Digital Operations Investment
Utilities are investing in modern grid operations platforms to unify workflows for interconnection, forecasting, dispatch, and compliance, making DER orchestration a core requirement and expanding the market for scalable, integrated management systems.
Growth of Flexibility Programs and Aggregator Ecosystems
Expansion of utility and regulatory flexibility programs, along with the scaling of virtual power plant portfolios by aggregators, is increasing demand for DER management systems that enable secure dispatch, measurement, verification, and participation in grid-service markets.
Need to Improve Hosting Capacity and Defer Capex
Utilities face pressure to connect more DERs without costly infrastructure upgrades, so orchestration solutions that optimize existing assets, manage constraints, and defer capital expenditures are increasingly prioritized, boosting market adoption.
Rising Cybersecurity and Compliance Requirements
As DER control functions become more critical to grid reliability, utilities require management systems that meet stringent cybersecurity and data governance standards, driving demand for robust, compliant DERMS solutions.
Need a Custom Version of This Report?
Tailor the scope, geography, or segments to your exact requirements.
- Custom geography or segment scope
- Direct access to our analyst team
Frequently Asked Questions
What is the market size of the Distributed Energy Resource Management System Market in 2025 and 2032?
What is the CAGR for the Distributed Energy Resource Management System Market during 2025–2032?
What is the largest segment in the Distributed Energy Resource Management System Market?
What factors are driving growth in the Distributed Energy Resource Management System Market?
Which companies are leading in the Distributed Energy Resource Management System Market?
Which region leads the Distributed Energy Resource Management System Market?
Table of Content
Chapter 1 Market Segmentation
- 1.1 Segmentation Framework
- 1.1.1 Product and Service Classification
- 1.1.2 Application and End-Use Classification
- 1.1.3 Technology and Solution Classification
- 1.1.4 Customer and Distribution Channel Classification
- 1.1.5 Geographic Segmentation
- 1.1.6 Market Segment Definitions and Boundaries
- 1.2 By DER Type
- 1.2.1 Solar PV
- 1.2.2 Wind
- 1.2.3 Energy Storage
- 1.2.4 EV Chargers
- 1.2.5 Others
- 1.3 By Application
- 1.3.1 Grid Balancing
- 1.3.2 Demand Response
- 1.3.3 Asset Optimization
- 1.3.4 Others
- 1.4 By Solution Type
- 1.4.1 Software Platforms
- 1.4.2 Analytics Tools
- 1.4.3 Control Systems
- 1.4.4 Others
- 1.5 By Deployment Model
- 1.5.1 On-premise
- 1.5.2 Cloud-based
- 1.5.3 Hybrid Systems
- 1.5.4 Others
Chapter 2 Introduction
- 2.1 Report Objectives and Scope
- 2.2 Product Definition and Industry Terminology
- 2.3 Market Inclusions and Exclusions
- 2.4 Research Process
- 2.4.1 Primary Research and Expert Interviews
- 2.4.2 Secondary Research and Source Review
- 2.4.3 Top-Down and Bottom-Up Estimation
- 2.4.4 Data Triangulation and Verification
- 2.5 Market Size Measurement Basis
- 2.5.1 2025: USD 3,560.85 million → 2032: USD 7,927.70 million
- 2.6 Historical and Forecast Reference Periods
- 2.6.1 Base Year: 2025
- 2.6.2 Forecast Period: 2025-2032
- 2.7 Research Assumptions and Limitations
Chapter 3 Executive Summary
- 3.1 Market Snapshot and Key Findings
- 3.2 Base-Year Market Size, 2025
- 3.3 Forecast Market Size, 2032
- 3.4 Revenue and Volume Growth Outlook
- 3.5 Key Demand and Supply Indicators
- 3.6 Leading Market Segments
- 3.7 Fastest-Growing Market Opportunities
- 3.8 Regional Performance Highlights
- 3.9 Technology and Industry Transformation
- 3.10 Competitive Landscape Summary
- 3.11 Analyst View and Strategic Implications
Chapter 4 Global Distributed Energy Resource Management Market Trends and Developments
- 4.1 Historical Industry Development
- 4.2 Recent Market Trends and Developments
- 4.3 Demand and Customer Behavior Trends
- 4.4 Technology and Product Innovation
- 4.5 Artificial Intelligence, Automation and Digitalization
- 4.6 Local Manufacturing and Supply Chain Realignment
- 4.7 Industry Partnerships, Mergers and Acquisitions
- 4.8 Sustainability and Circular Economy Developments
- 4.9 Government and Private Sector Investment Trends
- 4.10 Emerging Business Models and Commercialization
- 4.11 Industry Developments and Announcements
Chapter 5 Global Distributed Energy Resource Management Market Production, Supply and Demand Analysis
- 5.1 Demand Trend and Consumption Analysis
- 5.2 Demand Forecast, 2025-2032
- 5.3 Production and Output Trend
- 5.4 Production and Output Forecast, 2025-2032
- 5.5 Installed Capacity and Capacity Utilization
- 5.6 Company-Wise Production Plants and Statistics
- 5.6.1 Installed Production Capacity
- 5.6.2 Actual Production
- 5.6.3 Planned Capacity and Expansion Targets
- 5.7 Supply Chain Structure and Procurement Trends
- 5.8 Supply-Demand Gap and Bottlenecks
- 5.9 Import Dependence and Sourcing Structure
- 5.10 Contract Manufacturing and Outsourcing
- 5.11 Regional Supply and Demand Concentration
Chapter 6 Global Distributed Energy Resource Management Market Pricing Analysis
- 6.1 Pricing Structure and Measurement
- 6.2 Historical Pricing Trends
- 6.3 Pricing Outlook, 2025-2032
- 6.4 Average Selling Price and Unit Economics
- 6.5 Pricing by Product and Market Segment
- 6.6 Geographic Pricing Differences
- 6.7 Key Input, Energy, Labor and Logistics Costs
- 6.8 Contract Pricing and Purchasing Models
- 6.9 Pricing Sensitivity and Competitive Positioning
- 6.10 Price, Margin and Profitability Implications
Chapter 7 Global Distributed Energy Resource Management Market Dynamics
- 7.1 Market Growth Drivers
- 7.1.1 Demand-Side Drivers
- 7.1.2 Technology and Innovation Drivers
- 7.1.3 Infrastructure and Investment Drivers
- 7.1.4 Regulatory and Policy Drivers
- 7.2 Market Restraints
- 7.2.1 Cost and Affordability Constraints
- 7.2.2 Technology and Adoption Barriers
- 7.2.3 Supply Chain and Operational Constraints
- 7.3 Market Challenges
- 7.3.1 Competitive Pressure and Margin Erosion
- 7.3.2 Skills, Infrastructure and Implementation Gaps
- 7.4 Emerging Market Opportunities
- 7.5 Market Dynamics Impact and Time-Horizon Assessment
Chapter 8 Global Distributed Energy Resource Management Value Chain Analysis
- 8.1 Industry Value Chain Overview
- 8.2 Upstream Suppliers and Critical Inputs
- 8.3 Technology and Component Providers
- 8.4 Manufacturing or Service Delivery
- 8.5 Distribution, Channel Partners and Integrators
- 8.6 Downstream Applications and End Users
- 8.7 Value Addition and Profit Pools
- 8.8 Vertical Integration and Outsourcing
- 8.9 Supplier Concentration and Risk
- 8.10 Supply Chain Localization and Resilience
Chapter 9 Global Distributed Energy Resource Management Market Regulations and Policies
- 9.1 Relevant Laws, Standards and Compliance Frameworks
- 9.2 Product, Service, Safety and Quality Requirements
- 9.3 Government Policies, Incentives and Subsidies
- 9.4 Imports, Exports and Trade Barriers
- 9.5 Public Procurement and Local Content Requirements
- 9.6 Environmental and Sustainability Compliance
- 9.7 Upcoming Policy Changes and Market Implications
Chapter 10 Global Distributed Energy Resource Management Market Hotspots and Opportunities
- 10.1 Market Opportunity Mapping and Growth Hotspots
- 10.2 High-Growth Applications and Customer Groups
- 10.3 Underserved Markets and White-Space Opportunities
- 10.4 Emerging Technology and Product Opportunities
- 10.5 New Capacity and Investment Hotspots
- 10.6 Market Entry and Expansion Opportunities
- 10.7 Distribution and Partnership Opportunities
- 10.8 Near-Term and Long-Term Commercial Potential
- 10.9 Opportunity Attractiveness and Execution Risks
Chapter 11 Global Distributed Energy Resource Management Market Outlook, 2025-2032
- 11.1 Market Size and Analysis
- 11.1.1 Revenue (Market Measurement: 2025: USD 3,560.85 million → 2032: USD 7,927.70 million)
- 11.1.2 Market Volume and Quantity Sold
- 11.1.3 Historical Market Size
- 11.1.4 Base-Year Market Size, 2025
- 11.2 Market Forecast, 2025-2032
- 11.2.1 Revenue Forecast to 2032
- 11.2.2 Volume Forecast to 2032
- 11.2.3 CAGR and Year-on-Year Growth
- 11.2.4 Incremental Revenue Opportunity
- 11.3 Forecast Assumptions and Scenario Analysis
- 11.3.1 Base-Case Forecast
- 11.3.2 Optimistic and Conservative Scenarios
- 11.3.3 Technology, Pricing and Policy Sensitivities
- 11.4 Market Attractiveness and Growth Outlook
Chapter 12 Global Distributed Energy Resource Management Market Segmentation and Outlook
- 12.1 Segmentation Summary and Market Shares, 2025
- 12.2 Largest and Fastest-Growing Segments
- 12.3 By DER Type - Market Size and Forecast, 2025-2032
- 12.3.1 Segment Definition and Scope
- 12.3.2 Historical Market Size
- 12.3.3 Revenue Forecast, 2025-2032
- 12.3.4 Volume Forecast, 2025-2032
- 12.3.5 Base-Year Market Share, 2025
- 12.3.6 Segment CAGR and Growth Drivers
- 12.3.7 Subsegment Market Size and Forecast
- 12.3.7.1 Solar PV
- 12.3.7.2 Wind
- 12.3.7.3 Energy Storage
- 12.3.7.4 EV Chargers
- 12.3.7.5 Others
- 12.3.8 Subsegment Pricing and Adoption Trends
- 12.3.9 Leading Suppliers and Competition
- 12.3.10 Regional Demand and Opportunities
- 12.4 By Application - Market Size and Forecast, 2025-2032
- 12.4.1 Segment Definition and Scope
- 12.4.2 Historical Market Size
- 12.4.3 Revenue Forecast, 2025-2032
- 12.4.4 Volume Forecast, 2025-2032
- 12.4.5 Base-Year Market Share, 2025
- 12.4.6 Segment CAGR and Growth Drivers
- 12.4.7 Subsegment Market Size and Forecast
- 12.4.7.1 Grid Balancing
- 12.4.7.2 Demand Response
- 12.4.7.3 Asset Optimization
- 12.4.7.4 Others
- 12.4.8 Subsegment Pricing and Adoption Trends
- 12.4.9 Leading Suppliers and Competition
- 12.4.10 Regional Demand and Opportunities
- 12.5 By Solution Type - Market Size and Forecast, 2025-2032
- 12.5.1 Segment Definition and Scope
- 12.5.2 Historical Market Size
- 12.5.3 Revenue Forecast, 2025-2032
- 12.5.4 Volume Forecast, 2025-2032
- 12.5.5 Base-Year Market Share, 2025
- 12.5.6 Segment CAGR and Growth Drivers
- 12.5.7 Subsegment Market Size and Forecast
- 12.5.7.1 Software Platforms
- 12.5.7.2 Analytics Tools
- 12.5.7.3 Control Systems
- 12.5.7.4 Others
- 12.5.8 Subsegment Pricing and Adoption Trends
- 12.5.9 Leading Suppliers and Competition
- 12.5.10 Regional Demand and Opportunities
- 12.6 By Deployment Model - Market Size and Forecast, 2025-2032
- 12.6.1 Segment Definition and Scope
- 12.6.2 Historical Market Size
- 12.6.3 Revenue Forecast, 2025-2032
- 12.6.4 Volume Forecast, 2025-2032
- 12.6.5 Base-Year Market Share, 2025
- 12.6.6 Segment CAGR and Growth Drivers
- 12.6.7 Subsegment Market Size and Forecast
- 12.6.7.1 On-premise
- 12.6.7.2 Cloud-based
- 12.6.7.3 Hybrid Systems
- 12.6.7.4 Others
- 12.6.8 Subsegment Pricing and Adoption Trends
- 12.6.9 Leading Suppliers and Competition
- 12.6.10 Regional Demand and Opportunities
- 12.7 Segment Growth Comparison
- 12.8 Segment Attractiveness and Priority Matrix
Chapter 13 Global Distributed Energy Resource Management End-Use and Application Market Outlook
- 13.1 End-Use Industry and Customer Demand Structure
- 13.2 Leading Applications and Customer Groups
- 13.3 End-Use Market Size, Share and Forecast
- 13.4 Major End-Use Industry Deep Dives
- 13.4.1 Customer Requirements and Use Cases
- 13.4.2 Demand and Replacement Cycles
- 13.4.3 Technical and Regulatory Considerations
- 13.4.4 Purchasing and Procurement Models
- 13.4.5 Leading Vendors and Distribution Channels
- 13.4.6 Forecast and Commercial Opportunities
- 13.5 Emerging Applications and Cross-Segment Demand
- 13.6 End-Use Industry Investment Priorities
Chapter 14 Global Distributed Energy Resource Management Geographic Market Outlook, 2025-2032
- 14.1 Regional Market Size and Share, 2025
- 14.2 Regional Market Forecast, 2025-2032
- 14.3 Regional Pricing, Production and Demand Differences
- 14.4 North America
- 14.4.1 United States
- 14.4.2 Canada
- 14.4.3 Mexico
- 14.5 Europe
- 14.5.1 Germany
- 14.5.2 France
- 14.5.3 Italy
- 14.5.4 United Kingdom
- 14.5.5 Spain
- 14.5.6 Poland
- 14.5.7 Russia
- 14.5.8 Netherlands
- 14.5.9 Belgium
- 14.5.10 Sweden
- 14.5.11 Denmark
- 14.5.12 Norway
- 14.5.13 Rest of Europe
- 14.6 Asia Pacific
- 14.6.1 China
- 14.6.2 India
- 14.6.3 Japan
- 14.6.4 South Korea
- 14.6.5 Thailand
- 14.6.6 Indonesia
- 14.6.7 Vietnam
- 14.6.8 Malaysia
- 14.6.9 Australia
- 14.6.10 Rest of Asia Pacific
- 14.7 Latin America
- 14.7.1 Brazil
- 14.7.2 Argentina
- 14.7.3 Colombia
- 14.7.4 Chile
- 14.7.5 Rest of Latin America
- 14.8 Middle East
- 14.8.1 Saudi Arabia
- 14.8.2 United Arab Emirates
- 14.8.3 Turkey
- 14.8.4 Israel
- 14.8.5 Iran
- 14.8.6 Rest of the Middle East
- 14.9 Africa
- 14.9.1 South Africa
- 14.9.2 Egypt
- 14.9.3 Nigeria
- 14.9.4 Morocco
- 14.9.5 Rest of Africa
- 14.10 Regional Investment, Policy and Supply Chain Differences
- 14.11 Regional Competitive Landscape
- 14.12 Geographic Growth Hotspots
Chapter 15 Global Distributed Energy Resource Management Technology, Innovation and Sustainability Outlook
- 15.1 Technology Landscape and Maturity
- 15.2 Product, Process and Service Innovation
- 15.3 AI, Automation and Digital Tools in the Industry
- 15.4 Technology Adoption and Performance Benchmarking
- 15.5 Innovation Pipeline and R&D Investment
- 15.6 Patent and Intellectual Property Trends
- 15.7 Energy Efficiency and Resource Management
- 15.8 Sustainability, Recycling and Circularity
- 15.9 Technology Roadmap, 2025-2032
- 15.10 Risks of Obsolescence and Technology Substitution
Chapter 16 Global Distributed Energy Resource Management Market Key Strategic Imperatives
- 16.1 Growth and Market Entry Priorities
- 16.2 High-Return Products and Segments
- 16.3 Pricing, Profitability and Cost Optimization
- 16.4 Technology Investment and Product Differentiation
- 16.5 Supply Chain Localization and Resilience
- 16.6 Distribution and Customer Acquisition
- 16.7 Partnership, Acquisition and Capacity Strategy
- 16.8 Regional Expansion Priorities
- 16.9 Short-, Medium- and Long-Term Actions
Chapter 17 Competition Outlook
- 17.1 Industry Competition Characteristics
- 17.2 Market Structure and Concentration
- 17.3 Market Share and Competitive Positioning, 2025
- 17.4 Company-Wise Revenue and Product Benchmarking
- 17.5 Production and Service Capacity Benchmarking
- 17.6 Technology, Pricing and Differentiation
- 17.7 Regional Footprint and Distribution Strength
- 17.8 Mergers, Acquisitions and Strategic Alliances
- 17.9 New Entrants and Competitive Threats
- 17.10 Porter's Five Forces and Industry Attractiveness
- 17.11 Competitive Outlook, 2025-2032
Chapter 18 Company Profiles
- 18.1 Company Coverage and Selection Criteria
- 18.2 Schneider Electric
- 18.2.1 Business Description
- 18.2.2 Company Ownership and Geographic Presence
- 18.2.3 Product and Service Portfolio
- 18.2.4 Manufacturing and Operating Footprint
- 18.2.5 Production Capacity and Expansion Plans
- 18.2.6 Financial Performance and Investment
- 18.2.7 Market Share and Competitive Position
- 18.2.8 Technology and Innovation Capabilities
- 18.2.9 Strategic Alliances or Partnerships
- 18.2.10 Recent Developments
- 18.2.11 Growth Strategy and Outlook
- 18.3 Siemens
- 18.4 ABB
- 18.5 General Electric
- 18.6 Oracle
- 18.7 IBM
- 18.8 AutoGrid
- 18.9 Opus One Solutions
- 18.10 Enel X
- 18.11 Hitachi Energy
- 18.12 Other Relevant Market Participants
Note: Every listed company is profiled on the structure shown under the first company. The company list is preliminary and may change based on research findings, market developments, data availability and client requirements.
Chapter 19 Disclaimer
- 19.1 Research and Forecast Disclaimer
- 19.2 Data Source and Estimation Limitations
Note: The depth of individual sections depends on data availability for this market. Volume, capacity, trade and other unit-based metrics are included where applicable.