1. Preface
1.1. Report Description
1.1.1. Purpose of the Report
1.1.2. Target Audience
1.1.3. USP and Key Offerings
1.2. Research Scope
1.3. Market Introduction
2. Executive Summary
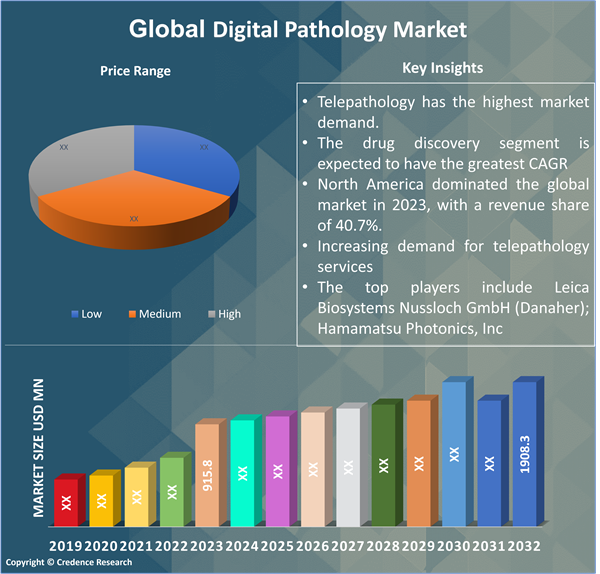
2.1. Market Snapshot: Global Digital Pathology Market
2.1.1. Global Digital Pathology Market , By Product Type:
2.1.2. Global Digital Pathology Market , By Technology
2.1.3. Global Digital Pathology Market , By Application
2.1.4. Global Digital Pathology Market , By End-User
2.1.5. Global Digital Pathology Market , By Slide Scanners
2.1.6. Global Digital Pathology Market , By Usage
2.1.7. Global Digital Pathology Market , By Integration
2.1.8. Global Digital Pathology Market , By Image Type
2.1.9. Global Digital Pathology Market , By Delivery Mode
2.1.10. Global Digital Pathology Market , By Workflow
2.1.11. Global Digital Pathology Market , By Region
2.2. Insights from Primary Respondents
3. Market Dynamics & Factors Analysis
3.1. Introduction
3.1.1. Global Digital Pathology Market Value, 2017-2032, (US$ Mn)
3.1.2. Y-o-Y Growth Trend Analysis
3.2. Market Dynamics
3.2.1. Digital Pathology Market Drivers
3.2.2. Digital Pathology Market Restraints
3.2.3. Digital Pathology Market Opportunities
3.2.4. Major Digital Pathology Market Challenges
3.3. Growth and Development Patterns
3.4. Investment Feasibility Analysis
3.5. Market Opportunity Analysis
3.5.1. Product Type:
3.5.2. Technology
3.5.3. Application
3.5.4. End-User
3.5.5. Slide Scanners
3.5.6. Usage
3.5.7.Integration
3.5.8. Image Type
3.5.9. Delivery Mode
3.5.10. Workflow
3.5.11. Geography
4. Market Competitive Landscape Analysis
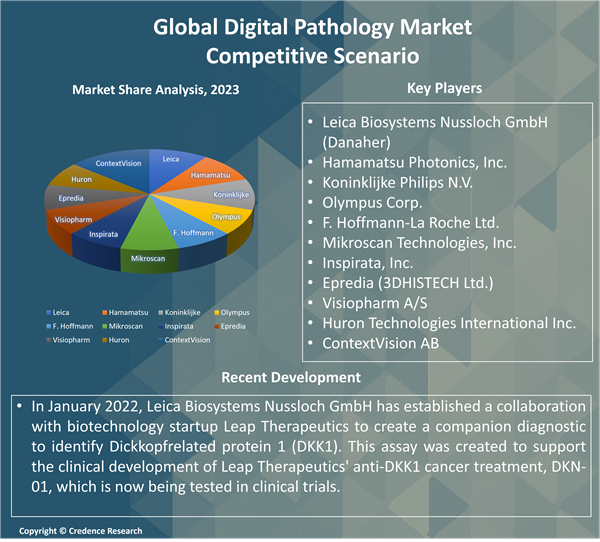
4.1. Company Market Share Analysis, 2023
4.1.1. Global Digital Pathology Market : Company Market Share, Value 2023
4.1.2. Global Digital Pathology Market : Top 6 Company Market Share, Value 2023
4.1.3. Global Digital Pathology Market : Top 3 Company Market Share, Value 2023
4.2. Global Digital Pathology Market : Company Revenue Share Analysis, 2023
4.3. Company Assessment Metrics, 2023
4.3.1. Stars
4.3.2. Emerging Leaders
4.3.3. Pervasive Players
4.3.4. Participants
4.4. Startups/ SMEs Assessment Metrics, 2023
4.4.1. Progressive Companies
4.4.2. Responsive Companies
4.4.3. Dynamic Companies
4.4.4. Starting Blocks
4.5. Strategic Development
4.5.1. Acquisition and Mergers
4.5.2. New Type Launch
4.5.3. Regional Expansion
4.5.4. Partnerships
4.6. Key Player Type Matrix
4.7. Potential for New Players in the Global Digital Pathology Market
5. Premium Insights
5.1. STAR (Situation, Task, Action, Results) Analysis
5.2. Porter’s Five Forces Analysis
5.2.1. Threat of New Entrants
5.2.2. Bargaining Power of Buyers/Consumers
5.2.3. Bargaining Power of Suppliers
5.2.4. Threat of Substitute Types
5.2.5. Intensity of Competitive Rivalry
5.3. PESTEL Analysis
5.3.1. Political Factors
5.3.2. Economic Factors
5.3.3. Social Factors
5.3.4. Technological Factors
5.3.5. Environmental Factors
5.3.6. Legal Factors
5.4. Key Market Trends
5.4.1. Demand Side Trends
5.4.2. Supply Side Trends
5.5. Value Chain Analysis
5.6. Application Analysis
5.6.1. Teleconsultation in the global market
5.6.2. Patent Analysis
5.6.3. Emerging technologies and their potential disruption to the market
5.7. Consumer Behaviour Analysis
5.7.1. Consumer Preferences and Expectations
5.7.2. Factors Influencing Consumer Buying Decisions
5.7.2.1. North America
5.7.2.2. Europe
5.7.2.3. Asia Pacific
5.7.2.4. Latin America
5.7.2.5. Middle East and Africa
5.7.3. Consumer Pain Points
5.8. Analysis and Recommendations
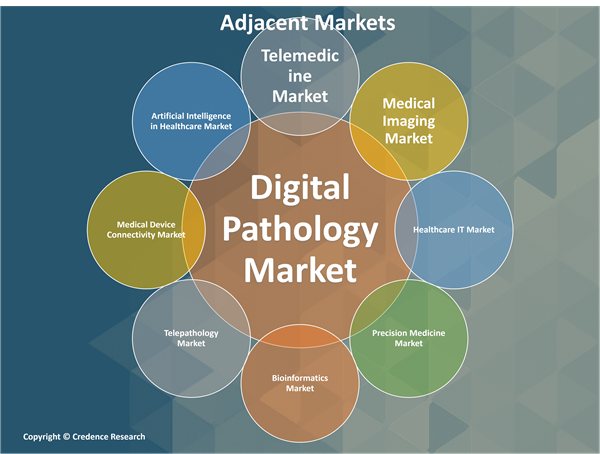
5.9. Adjacent Market Analysis
6. Market Positioning of Key Players, 2023
6.1. Company market share of key players, 2023
6.2. Competitive Benchmarking
6.3. Market Positioning of Key Vendors
6.4. Geographical Presence Analysis
6.5. Major Strategies Adopted by Key Players
6.5.1. Key Strategies Analysis
6.5.2. Mergers and Acquisitions
6.5.3. Partnerships
6.5.4. Type Launch
6.5.5. Geographical Expansion
6.5.6. Autoimmune Diseases
7. Impact Analysis of COVID 19 and Russia – Ukraine War on Digital Pathology Market
7.1. Ukraine-Russia War Impact
7.1.1. Uncertainty and Economic Instability
7.1.2. Supply chain disruptions
7.1.3. Regional market shifts
7.1.4. Shift in government priorities
7.2. COVID-19 Impact Analysis
7.2.1. Supply Chain Disruptions
7.2.2. Demand Fluctuations
7.2.3. Shift in Type Mix
7.2.4. Reduced Teleconsultation Activity
7.2.5. Regional Impact Analysis
7.2.5.1. North America
7.2.5.2. Europe
7.2.5.3. Asia Pacific
7.2.5.4. Latin America
7.2.5.5. Middle East and Africa
8. Global Digital Pathology Market , By Product Type:
8.1. Global Digital Pathology Market Overview, By Product Type:
8.1.1. Global Digital Pathology Market Revenue Share, By Product Type:, 2023 Vs 2032 (in %)
8.2. Whole Slide Imaging (WSI) Systems
8.2.1. Global Digital Pathology Market , By WHOLE SLIDE IMAGING (WSI) SYSTEMS, By Region, 2017-2032 (US$ Mn)
8.2.2. Market Dynamics for WHOLE SLIDE IMAGING (WSI) SYSTEMS
8.2.2.1. Drivers
8.2.2.2. Restraints
8.2.2.3. Opportunities
8.2.2.4. Trends
8.3. Image Analysis-Informatics
8.3.1. Global Digital Pathology Market , By Image Analysis-Informatics, By Region, 2017-2032 (US$ Mn)
8.3.2. Market Dynamics for Image Analysis-Informatics
8.3.2.1. Drivers
8.3.2.2. Restraints
8.3.2.3. Opportunities
8.3.2.4. Trends
8.4. Storage and Communication Systems
8.4.1. Global Digital Pathology Market , By Storage and Communication Systems, By Region, 2017-2032 (US$ Mn)
8.4.2. Market Dynamics for Storage and Communication Systems
8.4.2.1. Drivers
8.4.2.2. Restraints
8.4.2.3. Opportunities
8.4.2.4. Trends
8.5. Digital Pathology Services
8.5.1. Global Digital Pathology Market , By Digital Pathology Services, By Region, 2017-2032 (US$ Mn)
8.5.2. Market Dynamics for Digital Pathology Services
8.5.2.1. Drivers
8.5.2.2. Restraints
8.5.2.3. Opportunities
8.5.2.4. Trends
9. Global Digital Pathology Market , By Technology
9.1. Global Digital Pathology Market Overview, By Technology
9.1.1. Global Digital Pathology Market Revenue Share, By Technology, 2023 Vs 2032 (in %)
9.2. Virtual Microscopy
9.2.1. Global Digital Pathology Market , By Virtual Microscopy, By Region, 2017-2032 (US$ Mn)
9.2.2. Market Dynamics for Virtual Microscopy
9.2.2.1. Drivers
9.2.2.2. Restraints
9.2.2.3. Opportunities
9.2.2.4. Trends
9.3. Telepathology
9.3.1. Global Digital Pathology Market , By Telepathology, By Region, 2017-2032 (US$ Mn)
9.3.2. Market Dynamics for Telepathology
9.3.2.1. Drivers
9.3.2.2. Restraints
9.3.2.3. Opportunities
9.3.2.4. Trends
9.4. Robotic Light Microscopy
9.4.1. Global Digital Pathology Market , By Robotic Light Microscopy, By Region, 2017-2032 (US$ Mn)
9.4.2. Market Dynamics for Robotic Light Microscopy
9.4.2.1. Drivers
9.4.2.2. Restraints
9.4.2.3. Opportunities
9.4.2.4. Trends
9.5. Others
9.5.1. Global Digital Pathology Market , By Others, By Region, 2017-2032 (US$ Mn)
9.5.2. Market Dynamics for Others
9.5.2.1. Drivers
9.5.2.2. Restraints
9.5.2.3. Opportunities
9.5.2.4. Trends
10. Global Digital Pathology Market , By Application
10.1. Global Digital Pathology Market Overview, By Application
10.1.1. Global Digital Pathology Market Revenue Share, By Application, 2023 Vs 2032 (in %)
10.2. Disease Diagnosis
10.2.1. Global Digital Pathology Market , By Disease Diagnosis, By Region, 2017-2032 (US$ Mn)
10.2.2. Market Dynamics for Disease Diagnosis
10.2.2.1. Drivers
10.2.2.2. Restraints
10.2.2.3. Opportunities
10.2.2.4. Trends
10.3. Teleconsultation
10.3.1. Global Digital Pathology Market , By Teleconsultation, By Region, 2017-2032 (US$ Mn)
10.3.2. Market Dynamics for Teleconsultation
10.3.2.1. Drivers
10.3.2.2. Restraints
10.3.2.3. Opportunities
10.3.2.4. Trends
10.4. Drug Discovery and Development
10.4.1. Global Digital Pathology Market , By Drug Discovery and Development, By Region, 2017-2032 (US$ Mn)
10.4.2. Market Dynamics for Drug Discovery and Development
10.4.2.1. Drivers
10.4.2.2. Restraints
10.4.2.3. Opportunities
10.4.2.4. Trends
10.5. Education and Training
10.5.1. Global Digital Pathology Market , By Education and Training, By Region, 2017-2032 (US$ Mn)
10.5.2. Market Dynamics for Education and Training
10.5.2.1. Drivers
10.5.2.2. Restraints
10.5.2.3. Opportunities
10.5.2.4. Trends
10.6. Others
10.6.1. Global Digital Pathology Market , By Others, By Region, 2017-2032 (US$ Mn)
10.6.2. Market Dynamics for Others
10.6.2.1. Drivers
10.6.2.2. Restraints
10.6.2.3. Opportunities
10.6.2.4. Trends
11. Global Digital Pathology Market , By End-User
11.1. Global Digital Pathology Market Overview, by End-User
11.1.1. Global Digital Pathology Market Revenue Share, By End-User, 2023 Vs 2032 (in %)
11.2. Hospitals and Clinics
11.2.1. Global Digital Pathology Market , By Hospitals and Clinics, By Region, 2017-2032 (US$ Mn)
11.2.2. Market Dynamics for Hospitals and Clinics
11.2.2.1. Drivers
11.2.2.2. Restraints
11.2.2.3. Opportunities
11.2.2.4. Trends
11.3. Diagnostic Laboratories
11.3.1. Global Digital Pathology Market , By Diagnostic Laboratories, By Region, 2017-2032 (US$ Mn)
11.3.2. Market Dynamics for Diagnostic Laboratories
11.3.2.1. Drivers
11.3.2.2. Restraints
11.3.2.3. Opportunities
11.3.2.4. Trends
11.4. Pharmaceutical and Biotechnology Companies
11.4.1. Global Digital Pathology Market , By Pharmaceutical and Biotechnology Companies, By Region, 2017-2032 (US$ Mn)
11.4.2. Market Dynamics for Pharmaceutical and Biotechnology Companies
11.4.2.1. Drivers
11.4.2.2. Restraints
11.4.2.3. Opportunities
11.4.2.4. Trends
11.5. Academic and Research Institutes
11.5.1. Global Digital Pathology Market , By Academic and Research Institutes, By Region, 2017-2032 (US$ Mn)
11.5.2. Market Dynamics for Academic and Research Institutes
11.5.2.1. Drivers
11.5.2.2. Restraints
11.5.2.3. Opportunities
11.5.2.4. Trends
12. Global Digital Pathology Market , By Slide Scanners
12.1. Global Digital Pathology Market Overview, By Slide Scanners
12.1.1. Global Digital Pathology Market Revenue Share, By Slide Scanners, 2023 Vs 2032 (in %)
12.2. Confocal Microscopes
12.2.1. Global Digital Pathology Market , By Confocal Microscopes, By Region, 2017-2032 (US$ Mn)
12.2.2. Market Dynamics for Confocal Microscopes
12.2.2.1. Drivers
12.2.2.2. Restraints
12.2.2.3. Opportunities
12.2.2.4. Trends
12.3. Fluorescence Microscopes
12.3.1. Global Digital Pathology Market , By Fluorescence Microscopes, By Region, 2017-2032 (US$ Mn)
12.3.2. Market Dynamics for Fluorescence Microscopes
12.3.2.1. Drivers
12.3.2.2. Restraints
12.3.2.3. Opportunities
12.3.2.4. Trends
12.4. Brightfield Microscopes
12.4.1. Global Digital Pathology Market , By Brightfield Microscopes, By Region, 2017-2032 (US$ Mn)
12.4.2. Market Dynamics for Brightfield Microscopes
12.4.2.1. Drivers
12.4.2.2. Restraints
12.4.2.3. Opportunities
12.4.2.4. Trends
12.5. Others
12.5.1. Global Digital Pathology Market , By FoOthers, By Region, 2017-2032 (US$ Mn)
12.5.2. Market Dynamics for Others
12.5.2.1. Drivers
12.5.2.2. Restraints
12.5.2.3. Opportunities
12.5.2.4. Trends
13. Global Digital Pathology Market , By Usage
13.1. Global Digital Pathology Market Overview, By Usage
13.1.1. Global Digital Pathology Market Revenue Share, By Usage, 2023 Vs 2032 (in %)
13.2. Human Pathology
13.2.1. Global Digital Pathology Market , By Human Pathology, By Region, 2017-2032 (US$ Mn)
13.2.2. Market Dynamics for Human Pathology
13.2.2.1. Drivers
13.2.2.2. Restraints
13.2.2.3. Opportunities
13.2.2.4. Trends
13.3. Veterinary Pathology
13.3.1. Global Digital Pathology Market , By Veterinary Pathology, By Region, 2017-2032 (US$ Mn)
13.3.2. Market Dynamics for Veterinary Pathology
13.3.2.1. Drivers
13.3.2.2. Restraints
13.3.2.3. Opportunities
13.3.2.4. Trends
14. Global Digital Pathology Market , By Integration
14.1. Global Digital Pathology Market Overview, By Integration
14.1.1. Global Digital Pathology Market Revenue Share, By Integration, 2023 Vs 2032 (in %)
14.2. Integrated Systems
14.2.1. Global Digital Pathology Market , By Integrated Systems, By Region, 2017-2032 (US$ Mn)
14.2.2. Market Dynamics for Integrated Systems
14.2.2.1. Drivers
14.2.2.2. Restraints
14.2.2.3. Opportunities
14.2.2.4. Trends
14.3. Standalone Systems
14.3.1. Global Digital Pathology Market , By Standalone Systems, By Region, 2017-2032 (US$ Mn)
14.3.2. Market Dynamics for Standalone Systems
14.3.2.1. Drivers
14.3.2.2. Restraints
14.3.2.3. Opportunities
14.3.2.4. Trends
15. Global Digital Pathology Market , By Image Type
15.1. Global Digital Pathology Market Overview, By Image Type
15.1.1. Global Digital Pathology Market Revenue Share, By Image Type, 2023 Vs 2032 (in %)
15.2. 2D Imaging
15.2.1. Global Digital Pathology Market , By 2D Imaging, By Region, 2017-2032 (US$ Mn)
15.2.2. Market Dynamics for 2D Imaging
15.2.2.1. Drivers
15.2.2.2. Restraints
15.2.2.3. Opportunities
15.2.2.4. Trends
15.3. 3D Imaging
15.3.1. Global Digital Pathology Market , By 3D Imaging, By Region, 2017-2032 (US$ Mn)
15.3.2. Market Dynamics for 3D Imaging
15.3.2.1. Drivers
15.3.2.2. Restraints
15.3.2.3. Opportunities
15.3.2.4. Trends
16. Global Digital Pathology Market , By Delivery Mode
16.1. Global Digital Pathology Market Overview, By Delivery Mode
16.1.1. Global Digital Pathology Market Revenue Share, By Delivery Mode, 2023 Vs 2032 (in %)
16.2. On-Premises Solutions
16.2.1. Global Digital Pathology Market , By On-Premises Solutions, By Region, 2017-2032 (US$ Mn)
16.2.2. Market Dynamics for On-Premises Solutions
16.2.2.1. Drivers
16.2.2.2. Restraints
16.2.2.3. Opportunities
16.2.2.4. Trends
16.3. Cloud-Based Solutions
16.3.1. Global Digital Pathology Market , By Cloud-Based Solutions, By Region, 2017-2032 (US$ Mn)
16.3.2. Market Dynamics for Cloud-Based Solutions
16.3.2.1. Drivers
16.3.2.2. Restraints
16.3.2.3. Opportunities
16.3.2.4. Trends
17. Global Digital Pathology Market , By Workflow
17.1. Global Digital Pathology Market Overview, By Workflow
17.1.1. Global Digital Pathology Market Revenue Share, By Workflow, 2023 Vs 2032 (in %)
17.2. Digital Pathology Information Systems
17.2.1. Global Digital Pathology Market , By Digital Pathology Information Systems, By Region, 2017-2032 (US$ Mn)
17.2.2. Market Dynamics for Digital Pathology Information Systems
17.2.2.1. Drivers
17.2.2.2. Restraints
17.2.2.3. Opportunities
17.2.2.4. Trends
17.3. Laboratory Information Management Systems (LIMS)
17.3.1. Global Digital Pathology Market , By Laboratory Information Management Systems (LIMS), By Region, 2017-2032 (US$ Mn)
17.3.2. Market Dynamics for Laboratory Information Management Systems (LIMS)
17.3.2.1. Drivers
17.3.2.2. Restraints
17.3.2.3. Opportunities
17.3.2.4. Trends
17.4. Picture Archiving and Communication Systems (PACS)
17.4.1. Global Digital Pathology Market , By Picture Archiving and Communication Systems (PACS), By Region, 2017-2032 (US$ Mn)
17.4.2. Market Dynamics for Picture Archiving and Communication Systems (PACS)
17.4.2.1. Drivers
17.4.2.2. Restraints
17.4.2.3. Opportunities
17.4.2.4. Trends
17.5. Others
17.5.1. Global Digital Pathology Market , By Others, By Region, 2017-2032 (US$ Mn)
17.5.2. Market Dynamics for Others
17.5.2.1. Drivers
17.5.2.2. Restraints
17.5.2.3. Opportunities
17.5.2.4. Trends
18. Global Digital Pathology Market , By Region
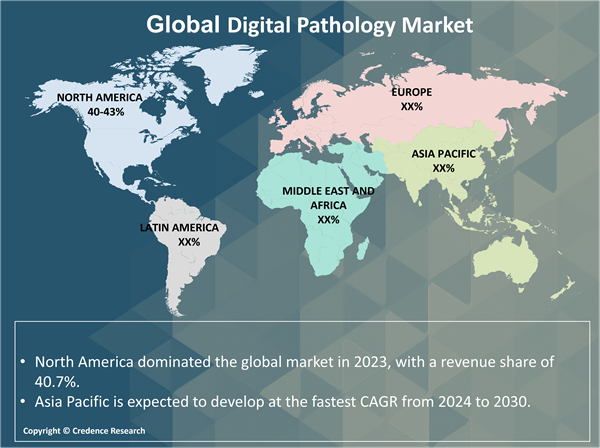
18.1. Global Digital Pathology Market Overview, by Region
18.1.1. Global Digital Pathology Market, By Region, 2023 vs 2032 (in%)
18.2. Product Type:
18.2.1. Global Digital Pathology Market , By Product Type:, 2017-2032 (US$ Mn)
18.3. Technology
18.3.1. Global Digital Pathology Market , By Technology, 2017-2032 (US$ Mn)
18.4. Application
18.4.1. Global Digital Pathology Market , By Application, 2017-2032 (US$ Mn)
18.5. End-User
18.5.1. Global Digital Pathology Market , By End-User, 2017-2032 (US$ Mn)
18.6. Slide Scanners
18.6.1. Global Digital Pathology Market , By Slide Scanners, 2017-2032 (US$ Mn)
18.7. Usage
18.7.1. Global Digital Pathology Market , By Usage, 2017-2032 (US$ Mn)
18.8. Integration
18.8.1. Global Digital Pathology Market , By Integration, 2017-2032 (US$ Mn)
18.9. Image Type
18.9.1. Global Digital Pathology Market , By Image Type, 2017-2032 (US$ Mn)
18.10. Delivery Mode
18.10.1. Global Digital Pathology Market , By Delivery Mode, 2017-2032 (US$ Mn)
18.11. Workflow
18.11.1. Global Digital Pathology Market , By Workflow, 2017-2032 (US$ Mn)
19. North America Digital Pathology Market Analysis
19.1. Overview
19.1.1. Market Dynamics for North America
19.1.1.1. Drivers
19.1.1.2. Restraints
19.1.1.3. Opportunities
19.1.1.4. Trends
19.2. North America Digital Pathology Market , By Product Type:, 2017-2032(US$ Mn)
19.2.1. Overview
19.2.2. SRC Analysis
19.3. North America Digital Pathology Market , By Technology, 2017-2032(US$ Mn)
19.3.1. Overview
19.3.2. SRC Analysis
19.4. North America Digital Pathology Market , By Application, 2017-2032(US$ Mn)
19.4.1. Overview
19.4.2. SRC Analysis
19.5. North America Digital Pathology Market , By End-User, 2017-2032(US$ Mn)
19.5.1. Overview
19.5.2. SRC Analysis
19.6. North America Digital Pathology Market , By Slide Scanners, 2017-2032(US$ Mn)
19.6.1. Overview
19.6.2. SRC Analysis
19.7. North America Digital Pathology Market , By Usage, 2017-2032(US$ Mn)
19.7.1. Overview
19.7.2. SRC Analysis
19.8. North America Digital Pathology Market , By Integration, 2017-2032(US$ Mn)
19.8.1. Overview
19.8.2. SRC Analysis
19.9. North America Digital Pathology Market , By Image Type, 2017-2032(US$ Mn)
19.9.1. Overview
19.9.2. SRC Analysis
19.10. North America Digital Pathology Market , By Delivery Mode, 2017-2032(US$ Mn)
19.10.1. Overview
19.10.2. SRC Analysis
19.11. North America Digital Pathology Market , By Workflow, 2017-2032(US$ Mn)
19.11.1. Overview
19.11.2. SRC Analysis
19.12. North America Digital Pathology Market , by Country, 2017-2032(US$ Mn)
19.12.1. North America Digital Pathology Market, by Country, 2023 Vs 2032 (in%)
19.12.2. U.S.
19.12.3. Canada
19.12.4. Mexico
20. Europe Digital Pathology Market Analysis
20.1. Overview
20.1.1. Market Dynamics for North America
20.1.1.1. Drivers
20.1.1.2. Restraints
20.1.1.3. Opportunities
20.1.1.4. Trends
20.2. Europe Digital Pathology Market , By Product Type:, 2017-2032(US$ Mn)
20.2.1. Overview
20.2.2. SRC Analysis
20.3. Europe Digital Pathology Market , By Technology, 2017-2032(US$ Mn)
20.3.1. Overview
20.3.2. SRC Analysis
20.4. Europe Digital Pathology Market , By Application, 2017-2032(US$ Mn)
20.4.1. Overview
20.4.2. SRC Analysis
20.5. Europe Digital Pathology Market , By End-User, 2017-2032(US$ Mn)
20.5.1. Overview
20.5.2. SRC Analysis
20.6. Europe Digital Pathology Market , By Slide Scanners, 2017-2032(US$ Mn)
20.6.1. Overview
20.6.2. SRC Analysis
20.7. Europe Digital Pathology Market , By Usage, 2017-2032(US$ Mn)
20.7.1. Overview
20.7.2. SRC Analysis
20.8. Europe Digital Pathology Market , By Integration, 2017-2032(US$ Mn)
20.8.1. Overview
20.8.2. SRC Analysis
20.9. Europe Digital Pathology Market , By Image Type, 2017-2032(US$ Mn)
20.9.1. Overview
20.9.2. SRC Analysis
20.10. Europe Digital Pathology Market , By Delivery Mode, 2017-2032(US$ Mn)
20.10.1. Overview
20.10.2. SRC Analysis
20.11. Europe Digital Pathology Market , By Workflow, 2017-2032(US$ Mn)
20.11.1. Overview
20.11.2. SRC Analysis
20.12. Europe Digital Pathology Market , by Country, 2017-2032 (US$ Mn)
20.12.1. Europe Digital Pathology Market , by Country, 2023 Vs 2032 (in%)
20.12.2. UK
20.12.3. France
20.12.4. Germany
20.12.5. Italy
20.12.6. Spain
20.12.7. Benelux
20.12.8. Russia
20.12.9. Rest of Europe
21. Asia Pacific Digital Pathology Market Analysis
21.1. Overview
21.1.1. Market Dynamics for North America
21.1.1.1. Drivers
21.1.1.2. Restraints
21.1.1.3. Opportunities
21.1.1.4. Trends
21.2. Asia Pacific Digital Pathology Market , By Product Type:, 2017-2032(US$ Mn)
21.2.1. Overview
21.2.2. SRC Analysis
21.3. Asia Pacific Digital Pathology Market , By Technology, 2017-2032(US$ Mn)
21.3.1. Overview
21.3.2. SRC Analysis
21.4. Asia Pacific Digital Pathology Market , By Application, 2017-2032(US$ Mn)
21.4.1. Overview
21.4.2. SRC Analysis
21.5. Asia Pacific Digital Pathology Market , By End-User, 2017-2032(US$ Mn)
21.5.1. Overview
21.5.2. SRC Analysis
21.6. Asia Pacific Digital Pathology Market , By Slide Scanners, 2017-2032(US$ Mn)
21.6.1. Overview
21.6.2. SRC Analysis
21.7. Asia Pacific Digital Pathology Market , By Usage, 2017-2032(US$ Mn)
21.7.1. Overview
21.7.2. SRC Analysis
21.8. Asia Pacific Digital Pathology Market , By Integration, 2017-2032(US$ Mn)
21.8.1. Overview
21.8.2. SRC Analysis
21.9. Asia Pacific Digital Pathology Market , By Image Type, 2017-2032(US$ Mn)
21.9.1. Overview
21.9.2. SRC Analysis
21.10. Asia Pacific Digital Pathology Market , By Delivery Mode, 2017-2032(US$ Mn)
21.10.1. Overview
21.10.2. SRC Analysis
21.11. Asia Pacific Digital Pathology Market , By Workflow, 2017-2032(US$ Mn)
21.11.1. Overview
21.11.2. SRC Analysis
21.12. Asia Pacific Digital Pathology Market , by Country, 2017-2032 (US$ Mn)
21.12.1. Asia Pacific Digital Pathology Market , by Country, 2023 Vs 2032 (in%)
21.12.2. China
21.12.3. Japan
21.12.4. India
21.12.5. South Korea
21.12.6. South East Asia
21.12.7. Rest of Asia Pacific
22. Latin America Digital Pathology Market Analysis
22.1. Overview
22.1.1. Market Dynamics for North America
22.1.1.1. Drivers
22.1.1.2. Restraints
22.1.1.3. Opportunities
22.1.1.4. Trends
22.2. Latin America Digital Pathology Market , By Product Type:, 2017-2032(US$ Mn)
22.2.1. Overview
22.2.2. SRC Analysis
22.3. Latin America Digital Pathology Market , By Technology, 2017-2032(US$ Mn)
22.3.1. Overview
22.3.2. SRC Analysis
22.4. Latin America Digital Pathology Market , By Application, 2017-2032(US$ Mn)
22.4.1. Overview
22.4.2. SRC Analysis
22.5. Latin America Digital Pathology Market , By End-User, 2017-2032(US$ Mn)
22.5.1. Overview
22.5.2. SRC Analysis
22.6. Latin America Digital Pathology Market , By Slide Scanners, 2017-2032(US$ Mn)
22.6.1. Overview
22.6.2. SRC Analysis
22.7. Latin America Digital Pathology Market , By Usage, 2017-2032(US$ Mn)
22.7.1. Overview
22.7.2. SRC Analysis
22.8. Latin America Digital Pathology Market , By Integration, 2017-2032(US$ Mn)
22.8.1. Overview
22.8.2. SRC Analysis
22.9. Latin America Digital Pathology Market , By Image Type, 2017-2032(US$ Mn)
22.9.1. Overview
22.9.2. SRC Analysis
22.10. Latin America Digital Pathology Market , By Delivery Mode, 2017-2032(US$ Mn)
22.10.1. Overview
22.10.2. SRC Analysis
22.11. Latin America Digital Pathology Market , By Workflow, 2017-2032(US$ Mn)
22.11.1. Overview
22.11.2. SRC Analysis
22.12. Latin America Digital Pathology Market , by Country, 2017-2032 (US$ Mn)
22.12.1. Latin America Digital Pathology Market , by Country, 2023 Vs 2032 (in%)
22.12.2. Brazil
22.12.3. Argentina
22.12.4. Rest of Latin America
23. Middle East Digital Pathology Market Analysis
23.1. Overview
23.1.1. Market Dynamics for North America
23.1.1.1. Drivers
23.1.1.2. Restraints
23.1.1.3. Opportunities
23.1.1.4. Trends
23.2. Middle East Digital Pathology Market , By Product Type:, 2017-2032(US$ Mn)
23.2.1. Overview
23.2.2. SRC Analysis
23.3. Middle East Digital Pathology Market , By Technology, 2017-2032(US$ Mn)
23.3.1. Overview
23.3.2. SRC Analysis
23.4. Middle East Digital Pathology Market , By Application, 2017-2032(US$ Mn)
23.4.1. Overview
23.4.2. SRC Analysis
23.5. Middle East Digital Pathology Market , By End-User, 2017-2032(US$ Mn)
23.5.1. Overview
23.5.2. SRC Analysis
23.6. Middle East Digital Pathology Market , By Slide Scanners, 2017-2032(US$ Mn)
23.6.1. Overview
23.6.2. SRC Analysis
23.7. Middle East Digital Pathology Market , By Usage, 2017-2032(US$ Mn)
23.7.1. Overview
23.7.2. SRC Analysis
23.8. Middle East Digital Pathology Market , By Integration, 2017-2032(US$ Mn)
23.8.1. Overview
23.8.2. SRC Analysis
23.9. Middle East Digital Pathology Market , By Image Type, 2017-2032(US$ Mn)
23.9.1. Overview
23.9.2. SRC Analysis
23.10. Middle East Digital Pathology Market , By Delivery Mode, 2017-2032(US$ Mn)
23.10.1. Overview
23.10.2. SRC Analysis
23.11. Middle East Digital Pathology Market , By Workflow, 2017-2032(US$ Mn)
23.11.1. Overview
23.11.2. SRC Analysis
23.12. Middle East Digital Pathology Market , by Country, 2017-2032 (US$ Mn)
23.12.1. Middle East Digital Pathology Market , by Country, 2023 Vs 2032 (in%)
23.12.2. UAE
23.12.3. Saudi Arabia
23.12.4. Rest of Middle East
24. Africa Digital Pathology Market Analysis
24.1. Overview
24.1.1. Market Dynamics for North America
24.1.1.1. Drivers
24.1.1.2. Restraints
24.1.1.3. Opportunities
24.1.1.4. Trends
24.2. Africa Digital Pathology Market , By Product Type:, 2017-2032(US$ Mn)
24.2.1. Overview
24.2.2. SRC Analysis
24.3. Africa Digital Pathology Market , By Technology, 2017-2032(US$ Mn)
24.3.1. Overview
24.3.2. SRC Analysis
24.4. Africa Digital Pathology Market , By Application, 2017-2032(US$ Mn)
24.4.1. Overview
24.4.2. SRC Analysis
24.5. Africa Digital Pathology Market , By End-User, 2017-2032(US$ Mn)
24.5.1. Overview
24.5.2. SRC Analysis
24.6. Africa Digital Pathology Market , By Slide Scanners, 2017-2032(US$ Mn)
24.6.1. Overview
24.6.2. SRC Analysis
24.7. Africa Digital Pathology Market , By Usage, 2017-2032(US$ Mn)
24.7.1. Overview
24.7.2. SRC Analysis
24.8. Africa Digital Pathology Market , By Integration, 2017-2032(US$ Mn)
24.8.1. Overview
24.8.2. SRC Analysis
24.9. Africa Digital Pathology Market , By Image Type, 2017-2032(US$ Mn)
24.9.1. Overview
24.9.2. SRC Analysis
24.10. Africa Digital Pathology Market , By Delivery Mode, 2017-2032(US$ Mn)
24.10.1. Overview
24.10.2. SRC Analysis
24.11. Africa Digital Pathology Market , By Workflow, 2017-2032(US$ Mn)
24.11.1. Overview
24.11.2. SRC Analysis
24.12. Africa Digital Pathology Market , by Country, 2017-2032 (US$ Mn)
24.12.1. Middle East Digital Pathology Market , by Country, 2023 Vs 2032 (in%)
24.12.2. South Africa
24.12.3. Egypt
24.12.4. Rest of Africa
25. Company Profiles
25.1. Leica Biosystems Nussloch GmbH (Danaher)
25.1.1. Company Overview
25.1.2. Types/Services Portfolio
25.1.3. Geographical Presence
25.1.4. SWOT Analysis
25.1.5. Financial Summary
25.1.5.1. Market Revenue and Net Profit (2019-2023)
25.1.5.2. Business Segment Revenue Analysis
25.1.5.3. Geographical Revenue Analysis
25.2. Hamamatsu Photonics, Inc.
25.3. Koninklijke Philips N.V.
25.4. Olympus Corp.
25.5. F. Hoffmann-La Roche Ltd.
25.6. Mikroscan Technologies, Inc.
25.7. Inspirata, Inc.
25.8. Epredia (3DHISTECH Ltd.)
25.9. Visiopharm A/S
25.10. Huron Technologies International Inc.
25.11. ContextVision AB
26. Research Methodology
26.1. Research Methodology
26.2. Disease Diagnosis – Secondary Research
26.3. Disease DiagnosisI – Data Modelling
26.3.1. Company Share Analysis Model
26.3.2. Revenue Based Modelling
26.4. Disease DiagnosisII – Primary Research
26.5. Research Limitations
26.5.1. Assumptions
List of Figures
FIG. 1 Global Digital Pathology Market : Research Methodology
FIG. 2 Market Size Estimation – Top Down & Bottom up Approach
FIG. 3 Global Digital Pathology Market Segmentation
FIG. 4 Global Digital Pathology Market , By Product Type:, 2023 (US$ Mn)
FIG. 5 Global Digital Pathology Market , By Technology, 2023 (US$ Mn)
FIG. 6 Global Digital Pathology Market , By Application, 2023 (US$ Mn)
FIG. 7 Global Digital Pathology Market , by End-User, 2023 (US$ Mn)
FIG. 8 Global Digital Pathology Market , By Slide Scanners, 2023 (US$ Mn)
FIG. 9 Global Digital Pathology Market , By Usage, 2023 (US$ Mn)
FIG. 10 Global Digital Pathology Market , By Integration, 2023 (US$ Mn)
FIG. 11 Global Digital Pathology Market , by Image Type, 2023 (US$ Mn)
FIG. 12 Global Digital Pathology Market , By Delivery Mode, 2023 (US$ Mn)
FIG. 13 Global Digital Pathology Market , by Workflow, 2023 (US$ Mn)
FIG. 14 Global Digital Pathology Market , by Geography, 2023 (US$ Mn)
FIG. 15 Attractive Investment Proposition, By Product Type:, 2023
FIG. 16 Attractive Investment Proposition, By Technology, 2023
FIG. 17 Attractive Investment Proposition, By Application, 2023
FIG. 18 Attractive Investment Proposition, By End-User, 2023
FIG. 19 Attractive Investment Proposition, By Slide Scanners, 2023
FIG. 20 Attractive Investment Proposition, By Usage, 2023
FIG. 21 Attractive Investment Proposition, By Integration, 2023
FIG. 22 Attractive Investment Proposition, By Image Type, 2023
FIG. 23 Attractive Investment Proposition, By Delivery Mode, 2023
FIG. 24 Attractive Investment Proposition, By Workflow, 2023
FIG. 25 Attractive Investment Proposition, by Geography, 2023
FIG. 26 Global Market Share Analysis of Key Digital Pathology Market Manufacturers, 2023
FIG. 27 Global Market Positioning of Key Digital Pathology Market Manufacturers, 2023
FIG. 28 Global Digital Pathology Market Value Contribution, By Product Type:, 2023 & 2032 (Value %)
FIG. 29 Global Digital Pathology Market , by WHOLE SLIDE IMAGING (WSI) SYSTEMS, Value, 2017-2032 (US$ Mn)
FIG. 30 Global Digital Pathology Market , by Image Analysis-Informatics, Value, 2017-2032 (US$ Mn)
FIG. 31 Global Digital Pathology Market , by Storage and Communication Systems, Value, 2017-2032 (US$ Mn)
FIG. 32 Global Digital Pathology Market , by Digital Pathology Services, Value, 2017-2032 (US$ Mn)
FIG. 33 Global Digital Pathology Market Value Contribution, By Technology, 2023 & 2032 (Value %)
FIG. 34 Global Digital Pathology Market , by Virtual Microscopy, Value, 2017-2032 (US$ Mn)
FIG. 35 Global Digital Pathology Market , by Telepathology, Value, 2017-2032 (US$ Mn)
FIG. 36 Global Digital Pathology Market , by Robotic Light Microscopy, Value, 2017-2032 (US$ Mn)
FIG. 37 Global Digital Pathology Market , by Others, Value, 2017-2032 (US$ Mn)
FIG. 38 Global Digital Pathology Market Value Contribution, By Application, 2023 & 2032 (Value %)
FIG. 39 Global Digital Pathology Market , by Disease Diagnosis, Value, 2017-2032 (US$ Mn)
FIG. 40 Global Digital Pathology Market , by Teleconsultation, Value, 2017-2032 (US$ Mn)
FIG. 41 Global Digital Pathology Market , by Drug Discovery and Development, Value, 2017-2032 (US$ Mn)
FIG. 42 Global Digital Pathology Market , by Education and Training, Value, 2017-2032 (US$ Mn)
FIG. 43 Global Digital Pathology Market , by Others, Value, 2017-2032 (US$ Mn)
FIG. 44 Global Digital Pathology Market Value Contribution, By End-User, 2023 & 2032 (Value %)
FIG. 45 Global Digital Pathology Market , by Hospitals and Clinics, Value, 2017-2032 (US$ Mn)
FIG. 46 Global Digital Pathology Market , by Diagnostic Laboratories, Value, 2017-2032 (US$ Mn)
FIG. 47 Global Digital Pathology Market , by Pharmaceutical and Biotechnology Companies, Value, 2017-2032 (US$ Mn)
FIG. 48 Global Digital Pathology Market , by Academic and Research Institutes, Value, 2017-2032 (US$ Mn)
FIG. 49 Global Digital Pathology Market Value Contribution, By Slide Scanners, 2023 & 2032 (Value %)
FIG. 50 Global Digital Pathology Market , by Confocal Microscopes, Value, 2017-2032 (US$ Mn)
FIG. 51 Global Digital Pathology Market , by Fluorescence Microscopes, Value, 2017-2032 (US$ Mn)
FIG. 52 Global Digital Pathology Market , by Brightfield Microscopes, Value, 2017-2032 (US$ Mn)
FIG. 53 Global Digital Pathology Market , by Others, Value, 2017-2032 (US$ Mn)
FIG. 54 Global Digital Pathology Market Value Contribution, By Usage, 2023 & 2032 (Value %)
FIG. 55 Global Digital Pathology Market , by Human Pathology, Value, 2017-2032 (US$ Mn)
FIG. 56 Global Digital Pathology Market , by Veterinary Pathology, Value, 2017-2032 (US$ Mn)
FIG. 57 Global Digital Pathology Market Value Contribution, By Integration, 2023 & 2032 (Value %)
FIG. 58 Global Digital Pathology Market , by Integrated Systems, Value, 2017-2032 (US$ Mn)
FIG. 59 Global Digital Pathology Market , by Standalone Systems, Value, 2017-2032 (US$ Mn)
FIG. 60 Global Digital Pathology Market , by Positive Charged Slides, Value, 2017-2032 (US$ Mn)
FIG. 61 Global Digital Pathology Market , by Negative Charged Slides, Value, 2017-2032 (US$ Mn)
FIG. 62 Global Digital Pathology Market , by Others, Value, 2017-2032 (US$ Mn)
FIG. 63 Global Digital Pathology Market Value Contribution, By Image Type, 2023 & 2032 (Value %)
FIG. 64 Global Digital Pathology Market , by 2D Imaging, Value, 2017-2032 (US$ Mn)
FIG. 65 Global Digital Pathology Market , by 3D Imaging, Value, 2017-2032 (US$ Mn)
FIG. 66 Global Digital Pathology Market , by Large Digital Pathology Market, Value, 2017-2032 (US$ Mn)
FIG. 67 Global Digital Pathology Market Value Contribution, By Delivery Mode, 2023 & 2032 (Value %)
FIG. 68 Global Digital Pathology Market , by On-Premises Solutions, Value, 2017-2032 (US$ Mn)
FIG. 69 Global Digital Pathology Market , by Cloud-Based Solutions, Value, 2017-2032 (US$ Mn)
FIG. 70 Global Digital Pathology Market Value Contribution, By Workflow, 2023 & 2032 (Value %)
FIG. 71 Global Digital Pathology Market , by Digital Pathology Information Systems, Value, 2017-2032 (US$ Mn)
FIG. 72 Global Digital Pathology Market , by Laboratory Information Management Systems (LIMS), Value, 2017-2032 (US$ Mn)
FIG. 73 Global Digital Pathology Market , by Picture Archiving and Communication Systems (PACS), Value, 2017-2032 (US$ Mn)
FIG. 74 Global Digital Pathology Market , by Others, Value, 2017-2032 (US$ Mn)
FIG. 75 North America Digital Pathology Market , 2017-2032 (US$ Mn)
FIG. 76 U.S. Digital Pathology Market , 2017-2032 (US$ Mn)
FIG. 77 Canada Digital Pathology Market , 2017-2032 (US$ Mn)
FIG. 78 MexicoDigital Pathology Market , 2017-2032 (US$ Mn)
FIG. 79 Europe Digital Pathology Market , 2017-2032 (US$ Mn)
FIG. 80 Germany Digital Pathology Market , 2017-2032 (US$ Mn)
FIG. 81 France Digital Pathology Market , 2017-2032 (US$ Mn)
FIG. 82 U.K. Digital Pathology Market , 2017-2032 (US$ Mn)
FIG. 83 Italy Digital Pathology Market , 2017-2032 (US$ Mn)
FIG. 84 Spain Digital Pathology Market , 2017-2032 (US$ Mn)
FIG. 85 BeneluxDigital Pathology Market , 2017-2032 (US$ Mn)
FIG. 86 RussiaDigital Pathology Market , 2017-2032 (US$ Mn)
FIG. 87 Rest of Europe Digital Pathology Market , 2017-2032 (US$ Mn)
FIG. 88 Asia Pacific Digital Pathology Market , 2017-2032 (US$ Mn)
FIG. 89 China Digital Pathology Market , 2017-2032 (US$ Mn)
FIG. 90 Japan Digital Pathology Market , 2017-2032 (US$ Mn)
FIG. 91 India Digital Pathology Market , 2017-2032 (US$ Mn)
FIG. 92 South Korea Digital Pathology Market , 2017-2032 (US$ Mn)
FIG. 93 South-East Asia Digital Pathology Market , 2017-2032 (US$ Mn)
FIG. 94 Rest of Asia Pacific Digital Pathology Market , 2017-2032 (US$ Mn)
FIG. 95 Latin America Digital Pathology Market , 2017-2032 (US$ Mn)
FIG. 96 Brazil Digital Pathology Market , 2017-2032 (US$ Mn)
FIG. 97 ArgentinaDigital Pathology Market , 2017-2032 (US$ Mn)
FIG. 98 Rest of Latin America Digital Pathology Market , 2017-2032 (US$ Mn)
FIG. 99 Middle East Digital Pathology Market , 2017-2032 (US$ Mn)
FIG. 100 UAEDigital Pathology Market , 2017-2032 (US$ Mn)
FIG. 101 Saudi ArabiaDigital Pathology Market , 2017-2032 (US$ Mn)
FIG. 102 Rest of Middle East Digital Pathology Market , 2017-2032 (US$ Mn)
FIG. 103 AfricaDigital Pathology Market , 2017-2032 (US$ Mn)
FIG. 104 South Africa Digital Pathology Market , 2017-2032 (US$ Mn)
FIG. 105 EgyptDigital Pathology Market , 2017-2032 (US$ Mn)
FIG. 106 Rest of Africa Digital Pathology Market , 2017-2032 (US$ Mn)
List of Tables
TABLE 1 Market Snapshot: Global Digital Pathology Market
TABLE 2 Global Digital Pathology Market : Drivers Impact Analysis
TABLE 3 Global Digital Pathology Market : Market Restraints Impact Analysis
TABLE 4 Global Digital Pathology Market , by Competitive Benchmarking, 2023
TABLE 5 Global Digital Pathology Market , by Geographical Presence Analysis, 2023
TABLE 6 Global Digital Pathology Market , by Key Strategies Analysis, 2023
TABLE 7 Global Digital Pathology Market , by Whole Slide Imaging (WSI) Systems, By Region, 2017-2023 (US$ Mn)
TABLE 8 Global Digital Pathology Market , by Whole Slide Imaging (WSI) Systems, By Region, 2023-2032 (US$ Mn)
TABLE 9 Global Digital Pathology Market , by Image Analysis-Informatics, By Region, 2017-2023 (US$ Mn)
TABLE 10 Global Digital Pathology Market , by Image Analysis-Informatics, By Region, 2023-2032 (US$ Mn)
TABLE 11 Global Digital Pathology Market , by Storage and Communication Systems, By Region, 2017-2023 (US$ Mn)
TABLE 12 Global Digital Pathology Market , by Storage and Communication Systems, By Region, 2023-2032 (US$ Mn)
TABLE 13 Global Digital Pathology Market , by Digital Pathology Services, By Region, 2017-2023 (US$ Mn)
TABLE 14 Global Digital Pathology Market , by Digital Pathology Services, By Region, 2023-2032 (US$ Mn)
TABLE 15 Global Digital Pathology Market , by Virtual Microscopy, By Region, 2017-2023 (US$ Mn)
TABLE 16 Global Digital Pathology Market , by Virtual Microscopy, By Region, 2023-2032 (US$ Mn)
TABLE 17 Global Digital Pathology Market , by Telepathology, By Region, 2017-2023 (US$ Mn)
TABLE 18 Global Digital Pathology Market , by Telepathology, By Region, 2023-2032 (US$ Mn)
TABLE 19 Global Digital Pathology Market , by Robotic Light Microscopy, By Region, 2017-2023 (US$ Mn)
TABLE 20 Global Digital Pathology Market , by Robotic Light Microscopy, By Region, 2023-2032 (US$ Mn)
TABLE 21 Global Digital Pathology Market , by Others, By Region, 2017-2023 (US$ Mn)
TABLE 22 Global Digital Pathology Market , by Others, By Region, 2023-2032 (US$ Mn)
TABLE 23 Global Digital Pathology Market , by Disease Diagnosis, By Region, 2017-2023 (US$ Mn)
TABLE 24 Global Digital Pathology Market , by Disease Diagnosis, By Region, 2023-2032 (US$ Mn)
TABLE 25 Global Digital Pathology Market , by Teleconsultation, By Region, 2017-2023 (US$ Mn)
TABLE 26 Global Digital Pathology Market , by Teleconsultation, By Region, 2023-2032 (US$ Mn)
TABLE 27 Global Digital Pathology Market , by Drug Discovery and Development, By Region, 2017-2023 (US$ Mn)
TABLE 28 Global Digital Pathology Market , by Drug Discovery and Development, By Region, 2023-2032 (US$ Mn)
TABLE 29 Global Digital Pathology Market , by Education and Training, By Region, 2017-2023 (US$ Mn)
TABLE 30 Global Digital Pathology Market , by Education and Training, By Region, 2023-2032 (US$ Mn)
TABLE 31 Global Digital Pathology Market , by Others, By Region, 2017-2023 (US$ Mn)
TABLE 32 Global Digital Pathology Market , by Others, By Region, 2023-2032 (US$ Mn)
TABLE 33 Global Digital Pathology Market , by Hospitals and Clinics, By Region, 2017-2023 (US$ Mn)
TABLE 34 Global Digital Pathology Market , by Hospitals and Clinics, By Region, 2023-2032 (US$ Mn)
TABLE 35 Global Digital Pathology Market , by Diagnostic Laboratories, By Region, 2017-2023 (US$ Mn)
TABLE 36 Global Digital Pathology Market , by Diagnostic Laboratories, By Region, 2023-2032 (US$ Mn)
TABLE 37 Global Digital Pathology Market , by Pharmaceutical and Biotechnology Companies, By Region, 2017-2023 (US$ Mn)
TABLE 38 Global Digital Pathology Market , by Pharmaceutical and Biotechnology Companies, By Region, 2023-2032 (US$ Mn)
TABLE 39 Global Digital Pathology Market , by Academic and Research Institutes, By Region, 2017-2023 (US$ Mn)
TABLE 40 Global Digital Pathology Market , by Academic and Research Institutes, By Region, 2023-2032 (US$ Mn)
TABLE 41 Global Digital Pathology Market , by Confocal Microscopes, By Region, 2017-2023 (US$ Mn)
TABLE 42 Global Digital Pathology Market , by Confocal Microscopes, By Region, 2023-2032 (US$ Mn)
TABLE 43 Global Digital Pathology Market , by Fluorescence Microscopes, By Region, 2017-2023 (US$ Mn)
TABLE 44 Global Digital Pathology Market , by Fluorescence Microscopes, By Region, 2023-2032 (US$ Mn)
TABLE 45 Global Digital Pathology Market , by Brightfield Microscopes, By Region, 2017-2023 (US$ Mn)
TABLE 46 Global Digital Pathology Market , by Brightfield Microscopes, By Region, 2023-2032 (US$ Mn)
TABLE 47 Global Digital Pathology Market , by Others, By Region, 2017-2023 (US$ Mn)
TABLE 48 Global Digital Pathology Market , by Others, By Region, 2023-2032 (US$ Mn)
TABLE 49 Global Digital Pathology Market , by Human Pathology, By Region, 2017-2023 (US$ Mn)
TABLE 50 Global Digital Pathology Market , by Human Pathology, By Region, 2023-2032 (US$ Mn)
TABLE 51 Global Digital Pathology Market , by Veterinary Pathology, By Region, 2017-2023 (US$ Mn)
TABLE 52 Global Digital Pathology Market , by Veterinary Pathology, By Region, 2023-2032 (US$ Mn)
TABLE 53 Global Digital Pathology Market , by Integrated Systems, By Region, 2017-2023 (US$ Mn)
TABLE 54 Global Digital Pathology Market , by Integrated Systems, By Region, 2023-2032 (US$ Mn)
TABLE 55 Global Digital Pathology Market , by Standalone Systems, By Region, 2017-2023 (US$ Mn)
TABLE 56 Global Digital Pathology Market , by Standalone Systems, By Region, 2023-2032 (US$ Mn)
TABLE 57 Global Digital Pathology Market , by Positive Charged Slides, By Region, 2017-2023 (US$ Mn)
TABLE 58 Global Digital Pathology Market , by Positive Charged Slides, By Region, 2023-2032 (US$ Mn)
TABLE 59 Global Digital Pathology Market , by Negative Charged Slides, By Region, 2017-2023 (US$ Mn)
TABLE 60 Global Digital Pathology Market , by Negative Charged Slides, By Region, 2023-2032 (US$ Mn)
TABLE 61 Global Digital Pathology Market , by 2D Imaging, By Region, 2017-2023 (US$ Mn)
TABLE 62 Global Digital Pathology Market , by 2D Imaging, By Region, 2023-2032 (US$ Mn)
TABLE 63 Global Digital Pathology Market , by 3D Imaging, By Region, 2017-2023 (US$ Mn)
TABLE 64 Global Digital Pathology Market , by 3D Imaging, By Region, 2023-2032 (US$ Mn)
TABLE 65 Global Digital Pathology Market , by On-Premises Solutions, By Region, 2017-2023 (US$ Mn)
TABLE 66 Global Digital Pathology Market , by On-Premises Solutions, By Region, 2023-2032 (US$ Mn)
TABLE 67 Global Digital Pathology Market , by Cloud-Based Solutions, By Region, 2017-2023 (US$ Mn)
TABLE 68 Global Digital Pathology Market , by Cloud-Based Solutions, By Region, 2023-2032 (US$ Mn)
TABLE 69 Global Digital Pathology Market , by Digital Pathology Information Systems, By Region, 2017-2023 (US$ Mn)
TABLE 70 Global Digital Pathology Market , by Digital Pathology Information Systems, By Region, 2023-2032 (US$ Mn)
TABLE 71 Global Digital Pathology Market , by Laboratory Information Management Systems (LIMS), By Region, 2017-2023 (US$ Mn)
TABLE 72 Global Digital Pathology Market , by Laboratory Information Management Systems (LIMS), By Region, 2023-2032 (US$ Mn)
TABLE 73 Global Digital Pathology Market , by Picture Archiving and Communication Systems (PACS), By Region, 2017-2023 (US$ Mn)
TABLE 74 Global Digital Pathology Market , by Picture Archiving and Communication Systems (PACS), By Region, 2023-2032 (US$ Mn)
TABLE 75 Global Digital Pathology Market , by Others), By Region, 2017-2023 (US$ Mn)
TABLE 76 Global Digital Pathology Market , by Others), By Region, 2023-2032 (US$ Mn)
TABLE 77 Global Digital Pathology Market , By Product Type:, 2017-2023 (US$ Mn)
TABLE 78 Global Digital Pathology Market , By Product Type:, 2023-2032 (US$ Mn)
TABLE 79 Global Digital Pathology Market , By Technology, 2017-2023 (US$ Mn)
TABLE 80 Global Digital Pathology Market , By Technology, 2023-2032 (US$ Mn)
TABLE 81 Global Digital Pathology Market , By Application, 2017-2023 (US$ Mn)
TABLE 82 Global Digital Pathology Market , By Application, 2023-2032 (US$ Mn)
TABLE 83 Global Digital Pathology Market , By End-User, By Region, 2017-2023 (US$ Mn)
TABLE 84 Global Digital Pathology Market , By End-User, By Region, 2023-2032 (US$ Mn)
TABLE 85 Global Digital Pathology Market , By Slide Scanners, 2017-2023 (US$ Mn)
TABLE 86 Global Digital Pathology Market , By Slide Scanners, By Region, 2023-2032 (US$ Mn)
TABLE 87 Global Digital Pathology Market , By Usage, 2017-2023 (US$ Mn)
TABLE 88 Global Digital Pathology Market , By Usage, 2023-2032 (US$ Mn)
TABLE 89 Global Digital Pathology Market , By Integration, 2017-2023 (US$ Mn)
TABLE 90 Global Digital Pathology Market , By Integration, 2023-2032 (US$ Mn)
TABLE 91 Global Digital Pathology Market , By Image Type, By Region, 2017-2023 (US$ Mn)
TABLE 92 Global Digital Pathology Market , By Image Type, By Region, 2023-2032 (US$ Mn)
TABLE 93 Global Digital Pathology Market , By Delivery Mode, 2017-2023 (US$ Mn)
TABLE 94 Global Digital Pathology Market , By Delivery Mode, 2023-2032 (US$ Mn)
TABLE 95 Global Digital Pathology Market , By Workflow, By Region, 2017-2023 (US$ Mn)
TABLE 96 Global Digital Pathology Market , By Workflow, By Region, 2023-2032 (US$ Mn)
TABLE 97 Global Digital Pathology Market , by Region, 2017-2023 (US$ Mn)
TABLE 98 Global Digital Pathology Market , by Region, 2023-2032 (US$ Mn)
TABLE 99 North America Digital Pathology Market , By Product Type:, 2017-2023 (US$ Mn)
TABLE 100 North America Digital Pathology Market , By Product Type:, 2023-2032 (US$ Mn)
TABLE 101 North America Digital Pathology Market , By Technology, 2017-2023 (US$ Mn)
TABLE 102 North America Digital Pathology Market , By Technology, 2023-2032 (US$ Mn)
TABLE 103 North America Digital Pathology Market , By Application, 2017-2023 (US$ Mn)
TABLE 104 North America Digital Pathology Market , By Application, 2023-2032 (US$ Mn)
TABLE 105 North AmericaDigital Pathology Market , By End-User, By Region, 2017-2023 (US$ Mn)
TABLE 106 North AmericaDigital Pathology Market , By End-User, By Region, 2023-2032 (US$ Mn)
TABLE 107 North AmericaDigital Pathology Market , By Slide Scanners, 2017-2023 (US$ Mn)
TABLE 108 North AmericaDigital Pathology Market , By Slide Scanners, 2023-2032 (US$ Mn)
TABLE 109 North America Digital Pathology Market , By Usage, 2017-2023 (US$ Mn)
TABLE 110 North America Digital Pathology Market , By Usage, 2023-2032 (US$ Mn)
TABLE 111 North America Digital Pathology Market , By Integration, 2017-2023 (US$ Mn)
TABLE 112 North America Digital Pathology Market , By Integration, 2023-2032 (US$ Mn)
TABLE 113 North AmericaDigital Pathology Market , By Image Type, By Region, 2017-2023 (US$ Mn)
TABLE 114 North AmericaDigital Pathology Market , By Image Type, By Region, 2023-2032 (US$ Mn)
TABLE 115 North AmericaDigital Pathology Market , By Delivery Mode, 2017-2023 (US$ Mn)
TABLE 116 North AmericaDigital Pathology Market , By Delivery Mode, 2023-2032 (US$ Mn)
TABLE 117 North AmericaDigital Pathology Market , By Workflow, By Region, 2017-2023 (US$ Mn)
TABLE 118 North AmericaDigital Pathology Market , By Workflow, By Region, 2023-2032 (US$ Mn)
TABLE 119 North America Digital Pathology Market , by Country, 2017-2023 (US$ Mn)
TABLE 120 North America Digital Pathology Market , by Country, 2023-2032 (US$ Mn)
TABLE 121 United States Digital Pathology Market , By Product Type:, 2017-2023 (US$ Mn)
TABLE 122 United States Digital Pathology Market , By Product Type:, 2023-2032 (US$ Mn)
TABLE 123 United States Digital Pathology Market , By Technology, 2017-2023 (US$ Mn)
TABLE 124 United States Digital Pathology Market , By Technology, 2023-2032 (US$ Mn)
TABLE 125 United States Digital Pathology Market , By Application, 2017-2023 (US$ Mn)
TABLE 126 United States Digital Pathology Market , By Application, 2023-2032 (US$ Mn)
TABLE 127 United StatesDigital Pathology Market , By End-User, By Region, 2017-2023 (US$ Mn)
TABLE 128 United StatesDigital Pathology Market , By End-User, By Region, 2023-2032 (US$ Mn)
TABLE 129 United StatesDigital Pathology Market , By Slide Scanners, 2017-2023 (US$ Mn)
TABLE 130 United StatesDigital Pathology Market , By Slide Scanners, 2023-2032 (US$ Mn)
TABLE 131 United States Digital Pathology Market , By Usage, 2017-2023 (US$ Mn)
TABLE 132 United States Digital Pathology Market , By Usage, 2023-2032 (US$ Mn)
TABLE 133 United States Digital Pathology Market , By Integration, 2017-2023 (US$ Mn)
TABLE 134 United States Digital Pathology Market , By Integration, 2023-2032 (US$ Mn)
TABLE 135 United States Digital Pathology Market , By Image Type, By Region, 2017-2023 (US$ Mn)
TABLE 136 United States Digital Pathology Market , By Image Type, By Region, 2023-2032 (US$ Mn)
TABLE 137 United States Digital Pathology Market , By Delivery Mode, 2017-2023 (US$ Mn)
TABLE 138 United States Digital Pathology Market , By Delivery Mode, 2023-2032 (US$ Mn)
TABLE 139 United States Digital Pathology Market , By Workflow, By Region, 2017-2023 (US$ Mn)
TABLE 140 United States Digital Pathology Market , By Workflow, By Region, 2023-2032 (US$ Mn)
TABLE 141 Canada Digital Pathology Market , By Product Type:, 2017-2023 (US$ Mn)
TABLE 142 Canada Digital Pathology Market , By Product Type:, 2023-2032 (US$ Mn)
TABLE 143 Canada Digital Pathology Market , By Technology, 2017-2023 (US$ Mn)
TABLE 144 Canada Digital Pathology Market , By Technology, 2023-2032 (US$ Mn)
TABLE 145 Canada Digital Pathology Market , By Application, 2017-2023 (US$ Mn)
TABLE 146 Canada Digital Pathology Market , By Application, 2023-2032 (US$ Mn)
TABLE 147 CanadaDigital Pathology Market , By End-User, By Region, 2017-2023 (US$ Mn)
TABLE 148 CanadaDigital Pathology Market , By End-User, By Region, 2023-2032 (US$ Mn)
TABLE 149 CanadaDigital Pathology Market , By Slide Scanners, 2017-2023 (US$ Mn)
TABLE 150 Canada Digital Pathology Market , By Slide Scanners, 2023-2032 (US$ Mn)
TABLE 151 Canada Digital Pathology Market , By Usage, 2017-2023 (US$ Mn)
TABLE 152 Canada Digital Pathology Market , By Usage, 2023-2032 (US$ Mn)
TABLE 153 Canada Digital Pathology Market , By Integration, 2017-2023 (US$ Mn)
TABLE 154 Canada Digital Pathology Market , By Integration, 2023-2032 (US$ Mn)
TABLE 155 Canada Digital Pathology Market , By Image Type, By Region, 2017-2023 (US$ Mn)
TABLE 156 Canada Digital Pathology Market , By Image Type, By Region, 2023-2032 (US$ Mn)
TABLE 157 Canada Digital Pathology Market , By Delivery Mode, 2017-2023 (US$ Mn)
TABLE 158 Canada Digital Pathology Market , By Delivery Mode, 2023-2032 (US$ Mn)
TABLE 159 Canada Digital Pathology Market , By Workflow, By Region, 2017-2023 (US$ Mn)
TABLE 160 Canada Digital Pathology Market , By Workflow, By Region, 2023-2032 (US$ Mn)
TABLE 161 Mexico Digital Pathology Market , By Product Type:, 2017-2023 (US$ Mn)
TABLE 162 Mexico Digital Pathology Market , By Product Type:, 2023-2032 (US$ Mn)
TABLE 163 Mexico Digital Pathology Market , By Technology, 2017-2023 (US$ Mn)
TABLE 164 Mexico Digital Pathology Market , By Technology, 2023-2032 (US$ Mn)
TABLE 165 Mexico Digital Pathology Market , By Application, 2017-2023 (US$ Mn)
TABLE 166 Mexico Digital Pathology Market , By Application, 2023-2032 (US$ Mn)
TABLE 167 MexicoDigital Pathology Market , By End-User, By Region, 2017-2023 (US$ Mn)
TABLE 168 MexicoDigital Pathology Market , By End-User, By Region, 2023-2032 (US$ Mn)
TABLE 169 MexicoDigital Pathology Market , By Slide Scanners, 2017-2023 (US$ Mn)
TABLE 170 Mexico Digital Pathology Market , By Slide Scanners, 2023-2032 (US$ Mn)
TABLE 171 Mexico Digital Pathology Market , By Usage, 2017-2023 (US$ Mn)
TABLE 172 Mexico Digital Pathology Market , By Usage, 2023-2032 (US$ Mn)
TABLE 173 Mexico Digital Pathology Market , By Integration, 2017-2023 (US$ Mn)
TABLE 174 Mexico Digital Pathology Market , By Integration, 2023-2032 (US$ Mn)
TABLE 175 Mexico Digital Pathology Market , By Image Type, By Region, 2017-2023 (US$ Mn)
TABLE 176 Mexico Digital Pathology Market , By Image Type, By Region, 2023-2032 (US$ Mn)
TABLE 177 Mexico Digital Pathology Market , By Delivery Mode, 2017-2023 (US$ Mn)
TABLE 178 Mexico Digital Pathology Market , By Delivery Mode, 2023-2032 (US$ Mn)
TABLE 179 Mexico Digital Pathology Market , By Workflow, By Region, 2017-2023 (US$ Mn)
TABLE 180 Mexico Digital Pathology Market , By Workflow, By Region, 2023-2032 (US$ Mn)
TABLE 181 Europe Digital Pathology Market , By Product Type:, 2017-2023 (US$ Mn)
TABLE 182 Europe Digital Pathology Market , By Product Type:, 2023-2032 (US$ Mn)
TABLE 183 Europe Digital Pathology Market , By Technology, 2017-2023 (US$ Mn)
TABLE 184 Europe Digital Pathology Market , By Technology, 2023-2032 (US$ Mn)
TABLE 185 Europe Digital Pathology Market , By Application, 2017-2023 (US$ Mn)
TABLE 186 Europe Digital Pathology Market , By Application, 2023-2032 (US$ Mn)
TABLE 187 EuropeDigital Pathology Market , By End-User, By Region, 2017-2023 (US$ Mn)
TABLE 188 EuropeDigital Pathology Market , By End-User, By Region, 2023-2032 (US$ Mn)
TABLE 189 EuropeDigital Pathology Market , By Slide Scanners, 2017-2023 (US$ Mn)
TABLE 190 EuropeDigital Pathology Market , By Slide Scanners, 2023-2032 (US$ Mn)
TABLE 191 Europe Digital Pathology Market , By Usage, 2017-2023 (US$ Mn)
TABLE 192 Europe Digital Pathology Market , By Usage, 2023-2032 (US$ Mn)
TABLE 193 Europe Digital Pathology Market , By Integration, 2017-2023 (US$ Mn)
TABLE 194 Europe Digital Pathology Market , By Integration, 2023-2032 (US$ Mn)
TABLE 195 Europe Digital Pathology Market , By Image Type, By Region, 2017-2023 (US$ Mn)
TABLE 196 Europe Digital Pathology Market , By Image Type, By Region, 2023-2032 (US$ Mn)
TABLE 197 Europe Digital Pathology Market , By Delivery Mode, 2017-2023 (US$ Mn)
TABLE 198 Europe Digital Pathology Market , By Delivery Mode, 2023-2032 (US$ Mn)
TABLE 199 Europe Digital Pathology Market , By Workflow, By Region, 2017-2023 (US$ Mn)
TABLE 200 Europe Digital Pathology Market , By Workflow, By Region, 2023-2032 (US$ Mn)
TABLE 201 Europe Digital Pathology Market , by Country, 2017-2023 (US$ Mn)
TABLE 202 Europe Digital Pathology Market , by Country, 2023-2032 (US$ Mn)
TABLE 203 Germany Digital Pathology Market , By Product Type:, 2017-2023 (US$ Mn)
TABLE 204 Germany Digital Pathology Market , By Product Type:, 2023-2032 (US$ Mn)
TABLE 205 Germany Digital Pathology Market , By Technology, 2017-2023 (US$ Mn)
TABLE 206 Germany Digital Pathology Market , By Technology, 2023-2032 (US$ Mn)
TABLE 207 Germany Digital Pathology Market , By Application, 2017-2023 (US$ Mn)
TABLE 208 Germany Digital Pathology Market , By Application, 2023-2032 (US$ Mn)
TABLE 209 GermanyDigital Pathology Market , By End-User, By Region, 2017-2023 (US$ Mn)
TABLE 210 GermanyDigital Pathology Market , By End-User, By Region, 2023-2032 (US$ Mn)
TABLE 211 GermanyDigital Pathology Market , By Slide Scanners, 2017-2023 (US$ Mn)
TABLE 212 Germany Digital Pathology Market , By Slide Scanners, 2023-2032 (US$ Mn)
TABLE 213 Germany Digital Pathology Market , By Usage, 2017-2023 (US$ Mn)
TABLE 214 Germany Digital Pathology Market , By Usage, 2023-2032 (US$ Mn)
TABLE 215 Germany Digital Pathology Market , By Integration, 2017-2023 (US$ Mn)
TABLE 216 Germany Digital Pathology Market , By Integration, 2023-2032 (US$ Mn)
TABLE 217 Germany Digital Pathology Market , By Image Type, By Region, 2017-2023 (US$ Mn)
TABLE 218 Germany Digital Pathology Market , By Image Type, By Region, 2023-2032 (US$ Mn)
TABLE 219 Germany Digital Pathology Market , By Delivery Mode, 2017-2023 (US$ Mn)
TABLE 220 Germany Digital Pathology Market , By Delivery Mode, 2023-2032 (US$ Mn)
TABLE 221 Germany Digital Pathology Market , By Workflow, By Region, 2017-2023 (US$ Mn)
TABLE 222 Germany Digital Pathology Market , By Workflow, By Region, 2023-2032 (US$ Mn)
TABLE 223 France Digital Pathology Market , By Product Type:, 2017-2023 (US$ Mn)
TABLE 224 France Digital Pathology Market , By Product Type:, 2023-2032 (US$ Mn)
TABLE 225 France Digital Pathology Market , By Technology, 2017-2023 (US$ Mn)
TABLE 226 France Digital Pathology Market , By Technology, 2023-2032 (US$ Mn)
TABLE 227 France Digital Pathology Market , By Application, 2017-2023 (US$ Mn)
TABLE 228 France Digital Pathology Market , By Application, 2023-2032 (US$ Mn)
TABLE 229 FranceDigital Pathology Market , By End-User, By Region, 2017-2023 (US$ Mn)
TABLE 230 FranceDigital Pathology Market , By End-User, By Region, 2023-2032 (US$ Mn)
TABLE 231 FranceDigital Pathology Market , By Slide Scanners, 2017-2023 (US$ Mn)
TABLE 232 France Digital Pathology Market , By Slide Scanners, 2023-2032 (US$ Mn)
TABLE 233 France Digital Pathology Market , By Usage, 2017-2023 (US$ Mn)
TABLE 234 France Digital Pathology Market , By Usage, 2023-2032 (US$ Mn)
TABLE 235 France Digital Pathology Market , By Integration, 2017-2023 (US$ Mn)
TABLE 236 France Digital Pathology Market , By Integration, 2023-2032 (US$ Mn)
TABLE 237 France Digital Pathology Market , By Image Type, By Region, 2017-2023 (US$ Mn)
TABLE 238 France Digital Pathology Market , By Image Type, By Region, 2023-2032 (US$ Mn)
TABLE 239 France Digital Pathology Market , By Delivery Mode, 2017-2023 (US$ Mn)
TABLE 240 France Digital Pathology Market , By Delivery Mode, 2023-2032 (US$ Mn)
TABLE 241 France Digital Pathology Market , By Workflow, By Region, 2017-2023 (US$ Mn)
TABLE 242 France Digital Pathology Market , By Workflow, By Region, 2023-2032 (US$ Mn)
TABLE 243 United Kingdom Digital Pathology Market , By Product Type:, 2017-2023 (US$ Mn)
TABLE 244 United Kingdom Digital Pathology Market , By Product Type:, 2023-2032 (US$ Mn)
TABLE 245 United Kingdom Digital Pathology Market , By Technology, 2017-2023 (US$ Mn)
TABLE 246 United Kingdom Digital Pathology Market , By Technology, 2023-2032 (US$ Mn)
TABLE 247 United Kingdom Digital Pathology Market , By Application, 2017-2023 (US$ Mn)
TABLE 248 United Kingdom Digital Pathology Market , By Application, 2023-2032 (US$ Mn)
TABLE 249 United KingdomDigital Pathology Market , By End-User, By Region, 2017-2023 (US$ Mn)
TABLE 250 United KingdomDigital Pathology Market , By End-User, By Region, 2023-2032 (US$ Mn)
TABLE 251 United KingdomDigital Pathology Market , By Slide Scanners, 2017-2023 (US$ Mn)
TABLE 252 United Kingdom Digital Pathology Market , By Slide Scanners, 2023-2032 (US$ Mn)
TABLE 253 United Kingdom Digital Pathology Market , By Usage, 2017-2023 (US$ Mn)
TABLE 254 United Kingdom Digital Pathology Market , By Usage, 2023-2032 (US$ Mn)
TABLE 255 United Kingdom Digital Pathology Market , By Integration, 2017-2023 (US$ Mn)
TABLE 256 United Kingdom Digital Pathology Market , By Integration, 2023-2032 (US$ Mn)
TABLE 257 United Kingdom Digital Pathology Market , By Image Type, By Region, 2017-2023 (US$ Mn)
TABLE 258 United Kingdom Digital Pathology Market , By Image Type, By Region, 2023-2032 (US$ Mn)
TABLE 259 United Kingdom Digital Pathology Market , By Delivery Mode, 2017-2023 (US$ Mn)
TABLE 260 United Kingdom Digital Pathology Market , By Delivery Mode, 2023-2032 (US$ Mn)
TABLE 261 United Kingdom Digital Pathology Market , By Workflow, By Region, 2017-2023 (US$ Mn)
TABLE 262 United Kingdom Digital Pathology Market , By Workflow, By Region, 2023-2032 (US$ Mn)
TABLE 263 Italy Digital Pathology Market , By Product Type:, 2017-2023 (US$ Mn)
TABLE 264 Italy Digital Pathology Market , By Product Type:, 2023-2032 (US$ Mn)
TABLE 265 Italy Digital Pathology Market , By Technology, 2017-2023 (US$ Mn)
TABLE 266 Italy Digital Pathology Market , By Technology, 2023-2032 (US$ Mn)
TABLE 267 Italy Digital Pathology Market , By Application, 2017-2023 (US$ Mn)
TABLE 268 Italy Digital Pathology Market , By Application, 2023-2032 (US$ Mn)
TABLE 269 ItalyDigital Pathology Market , By End-User, By Region, 2017-2023 (US$ Mn)
TABLE 270 ItalyDigital Pathology Market , By End-User, By Region, 2023-2032 (US$ Mn)
TABLE 271 ItalyDigital Pathology Market , By Slide Scanners, 2017-2023 (US$ Mn)
TABLE 272 Italy Digital Pathology Market , By Slide Scanners, 2023-2032 (US$ Mn)
TABLE 273 Italy Digital Pathology Market , By Usage, 2017-2023 (US$ Mn)
TABLE 274 Italy Digital Pathology Market , By Usage, 2023-2032 (US$ Mn)
TABLE 275 Italy Digital Pathology Market , By Integration, 2017-2023 (US$ Mn)
TABLE 276 Italy Digital Pathology Market , By Integration, 2023-2032 (US$ Mn)
TABLE 277 Italy Digital Pathology Market , By Image Type, By Region, 2017-2023 (US$ Mn)
TABLE 278 Italy Digital Pathology Market , By Image Type, By Region, 2023-2032 (US$ Mn)
TABLE 279 Italy Digital Pathology Market , By Delivery Mode, 2017-2023 (US$ Mn)
TABLE 280 Italy Digital Pathology Market , By Delivery Mode, 2023-2032 (US$ Mn)
TABLE 281 Italy Digital Pathology Market , By Workflow, By Region, 2017-2023 (US$ Mn)
TABLE 282 Italy Digital Pathology Market , By Workflow, By Region, 2023-2032 (US$ Mn)
TABLE 283 Spain Digital Pathology Market , By Product Type:, 2017-2023 (US$ Mn)
TABLE 284 Spain Digital Pathology Market , By Product Type:, 2023-2032 (US$ Mn)
TABLE 285 Spain Digital Pathology Market , By Technology, 2017-2023 (US$ Mn)
TABLE 286 Spain Digital Pathology Market , By Technology, 2023-2032 (US$ Mn)
TABLE 287 Spain Digital Pathology Market , By Application, 2017-2023 (US$ Mn)
TABLE 288 Spain Digital Pathology Market , By Application, 2023-2032 (US$ Mn)
TABLE 289 SpainDigital Pathology Market , By End-User, By Region, 2017-2023 (US$ Mn)
TABLE 290 SpainDigital Pathology Market , By End-User, By Region, 2023-2032 (US$ Mn)
TABLE 291 SpainDigital Pathology Market , By Slide Scanners, 2017-2023 (US$ Mn)
TABLE 292 Spain Digital Pathology Market , By Slide Scanners, 2023-2032 (US$ Mn)
TABLE 293 Spain Digital Pathology Market , By Usage, 2017-2023 (US$ Mn)
TABLE 294 Spain Digital Pathology Market , By Clinical Spain Services, 2023-2032 (US$ Mn)
TABLE 295 Spain Digital Pathology Market , By Integration, 2017-2023 (US$ Mn)
TABLE 296 Spain Digital Pathology Market , By Integration, 2023-2032 (US$ Mn)
TABLE 297 Spain Digital Pathology Market , By Image Type, By Region, 2017-2023 (US$ Mn)
TABLE 298 Spain Digital Pathology Market , By Image Type, By Region, 2023-2032 (US$ Mn)
TABLE 299 Spain Digital Pathology Market , By Delivery Mode, 2017-2023 (US$ Mn)
TABLE 300 Spain Digital Pathology Market , By Delivery Mode, 2023-2032 (US$ Mn)
TABLE 301 Spain Digital Pathology Market , By Workflow, By Region, 2017-2023 (US$ Mn)
TABLE 302 Spain Digital Pathology Market , By Workflow, By Region, 2023-2032 (US$ Mn)
TABLE 303 BeneluxDigital Pathology Market , By Product Type:, 2017-2023 (US$ Mn)
TABLE 304 BeneluxDigital Pathology Market , By Product Type:, 2023-2032 (US$ Mn)
TABLE 305 BeneluxDigital Pathology Market , By Technology, 2017-2023 (US$ Mn)
TABLE 306 BeneluxDigital Pathology Market , By Technology, 2023-2032 (US$ Mn)
TABLE 307 BeneluxDigital Pathology Market , By Application, 2017-2023 (US$ Mn)
TABLE 308 BeneluxDigital Pathology Market , By Application, 2023-2032 (US$ Mn)
TABLE 309 BeneluxDigital Pathology Market , By End-User, By Region, 2017-2023 (US$ Mn)
TABLE 310 BeneluxDigital Pathology Market , By End-User, By Region, 2023-2032 (US$ Mn)
TABLE 311 BeneluxDigital Pathology Market , By Slide Scanners, 2017-2023 (US$ Mn)
TABLE 312 Benelux Digital Pathology Market , By Slide Scanners, 2023-2032 (US$ Mn)
TABLE 313 Benelux Digital Pathology Market , By Usage, 2017-2023 (US$ Mn)
TABLE 314 Benelux Digital Pathology Market , By Clinical Spain Services, 2023-2032 (US$ Mn)
TABLE 315 Benelux Digital Pathology Market , By Integration, 2017-2023 (US$ Mn)
TABLE 316 Benelux Digital Pathology Market , By Integration, 2023-2032 (US$ Mn)
TABLE 317 Benelux Digital Pathology Market , By Image Type, By Region, 2017-2023 (US$ Mn)
TABLE 318 Benelux Digital Pathology Market , By Image Type, By Region, 2023-2032 (US$ Mn)
TABLE 319 Benelux Digital Pathology Market , By Delivery Mode, 2017-2023 (US$ Mn)
TABLE 320 Benelux Digital Pathology Market , By Delivery Mode, 2023-2032 (US$ Mn)
TABLE 321 Benelux Digital Pathology Market , By Workflow, By Region, 2017-2023 (US$ Mn)
TABLE 322 Benelux Digital Pathology Market , By Workflow, By Region, 2023-2032 (US$ Mn)
TABLE 323 RussiaDigital Pathology Market , By Product Type:, 2017-2023 (US$ Mn)
TABLE 324 RussiaDigital Pathology Market , By Product Type:, 2023-2032 (US$ Mn)
TABLE 325 RussiaDigital Pathology Market , By Technology, 2017-2023 (US$ Mn)
TABLE 326 RussiaDigital Pathology Market , By Technology, 2023-2032 (US$ Mn)
TABLE 327 RussiaDigital Pathology Market , By Application, 2017-2023 (US$ Mn)
TABLE 328 RussiaDigital Pathology Market , By Application, 2023-2032 (US$ Mn)
TABLE 329 RussiaDigital Pathology Market , By End-User, By Region, 2017-2023 (US$ Mn)
TABLE 330 RussiaDigital Pathology Market , By End-User, By Region, 2023-2032 (US$ Mn)
TABLE 331 RussiaDigital Pathology Market , By Slide Scanners, 2017-2023 (US$ Mn)
TABLE 332 Russia Digital Pathology Market , By Slide Scanners, 2023-2032 (US$ Mn)
TABLE 333 Russia Digital Pathology Market , By Usage, 2017-2023 (US$ Mn)
TABLE 334 Russia Digital Pathology Market , By Clinical Spain Services, 2023-2032 (US$ Mn)
TABLE 335 Russia Digital Pathology Market , By Integration, 2017-2023 (US$ Mn)
TABLE 336 Russia Digital Pathology Market , By Integration, 2023-2032 (US$ Mn)
TABLE 337 Russia Digital Pathology Market , By Image Type, By Region, 2017-2023 (US$ Mn)
TABLE 338 Russia Digital Pathology Market , By Image Type, By Region, 2023-2032 (US$ Mn)
TABLE 339 Russia Digital Pathology Market , By Delivery Mode, 2017-2023 (US$ Mn)
TABLE 340 Russia Digital Pathology Market , By Delivery Mode, 2023-2032 (US$ Mn)
TABLE 341 Russia Digital Pathology Market , By Workflow, By Region, 2017-2023 (US$ Mn)
TABLE 342 Russia Digital Pathology Market , By Workflow, By Region, 2023-2032 (US$ Mn)
TABLE 343 Rest of Europe Digital Pathology Market , By Product Type:, 2017-2023 (US$ Mn)
TABLE 344 Rest of Europe Digital Pathology Market , By Product Type:, 2023-2032 (US$ Mn)
TABLE 345 Rest of Europe Digital Pathology Market , By Technology, 2017-2023 (US$ Mn)
TABLE 346 Rest of Europe Digital Pathology Market , By Technology, 2023-2032 (US$ Mn)
TABLE 347 Rest of Europe Digital Pathology Market , By Application, 2017-2023 (US$ Mn)
TABLE 348 Rest of Europe Digital Pathology Market , By Application, 2023-2032 (US$ Mn)
TABLE 349 Rest of EuropeDigital Pathology Market , By End-User, By Region, 2017-2023 (US$ Mn)
TABLE 350 Rest of EuropeDigital Pathology Market , By End-User, By Region, 2023-2032 (US$ Mn)
TABLE 351 Rest of EuropeDigital Pathology Market , By Slide Scanners, 2017-2023 (US$ Mn)
TABLE 352 Rest of Europe Digital Pathology Market , By Slide Scanners, 2023-2032 (US$ Mn)
TABLE 353 Rest of Europe Digital Pathology Market , By Usage, 2017-2023 (US$ Mn)
TABLE 354 Rest of Europe Digital Pathology Market , By Clinical Spain Services, 2023-2032 (US$ Mn)
TABLE 355 Rest of Europe Digital Pathology Market , By Integration, 2017-2023 (US$ Mn)
TABLE 356 Rest of Europe Digital Pathology Market , By Integration, 2023-2032 (US$ Mn)
TABLE 357 Rest of Europe Digital Pathology Market , By Image Type, By Region, 2017-2023 (US$ Mn)
TABLE 358 Rest of Europe Digital Pathology Market , By Image Type, By Region, 2023-2032 (US$ Mn)
TABLE 359 Rest of Europe Digital Pathology Market , By Delivery Mode, 2017-2023 (US$ Mn)
TABLE 360 Rest of Europe Digital Pathology Market , By Delivery Mode, 2023-2032 (US$ Mn)
TABLE 361 Rest of Europe Digital Pathology Market , By Workflow, By Region, 2017-2023 (US$ Mn)
TABLE 362 Rest of Europe Digital Pathology Market , By Workflow, By Region, 2023-2032 (US$ Mn)
TABLE 363 Asia Pacific Digital Pathology Market , By Product Type:, 2017-2023 (US$ Mn)
TABLE 364 Asia Pacific Digital Pathology Market , By Product Type:, 2023-2032 (US$ Mn)
TABLE 365 Asia Pacific Digital Pathology Market , By Technology, 2017-2023 (US$ Mn)
TABLE 366 Asia Pacific Digital Pathology Market , By Technology, 2023-2032 (US$ Mn)
TABLE 367 Asia Pacific Digital Pathology Market , By Application, 2017-2023 (US$ Mn)
TABLE 368 Asia Pacific Digital Pathology Market , By Application, 2023-2032 (US$ Mn)
TABLE 369 Asia PacificDigital Pathology Market , By End-User, By Region, 2017-2023 (US$ Mn)
TABLE 370 Asia PacificDigital Pathology Market , By End-User, By Region, 2023-2032 (US$ Mn)
TABLE 371 Asia PacificDigital Pathology Market , By Slide Scanners, 2017-2023 (US$ Mn)
TABLE 372 Asia Pacific Digital Pathology Market , By Slide Scanners, 2023-2032 (US$ Mn)
TABLE 373 Asia Pacific Digital Pathology Market , By Usage, 2017-2023 (US$ Mn)
TABLE 374 Asia Pacific Digital Pathology Market , By Clinical Spain Services, 2023-2032 (US$ Mn)
TABLE 375 Asia Pacific Digital Pathology Market , By Integration, 2017-2023 (US$ Mn)
TABLE 376 Asia Pacific Digital Pathology Market , By Integration, 2023-2032 (US$ Mn)
TABLE 377 Asia Pacific Digital Pathology Market , By Image Type, By Region, 2017-2023 (US$ Mn)
TABLE 378 Asia Pacific Digital Pathology Market , By Image Type, By Region, 2023-2032 (US$ Mn)
TABLE 379 Asia Pacific Digital Pathology Market , By Delivery Mode, 2017-2023 (US$ Mn)
TABLE 380 Asia Pacific Digital Pathology Market , By Delivery Mode, 2023-2032 (US$ Mn)
TABLE 381 Asia Pacific Digital Pathology Market , By Workflow, By Region, 2017-2023 (US$ Mn)
TABLE 382 Asia Pacific Digital Pathology Market , By Workflow, By Region, 2023-2032 (US$ Mn)
TABLE 383 China Digital Pathology Market , By Product Type:, 2017-2023 (US$ Mn)
TABLE 384 China Digital Pathology Market , By Product Type:, 2023-2032 (US$ Mn)
TABLE 385 China Digital Pathology Market , By Technology, 2017-2023 (US$ Mn)
TABLE 386 China Digital Pathology Market , By Technology, 2023-2032 (US$ Mn)
TABLE 387 China Digital Pathology Market , By Application, 2017-2023 (US$ Mn)
TABLE 388 China Digital Pathology Market , By Application, 2023-2032 (US$ Mn)
TABLE 389 ChinaDigital Pathology Market , By End-User, By Region, 2017-2023 (US$ Mn)
TABLE 390 ChinaDigital Pathology Market , By End-User, By Region, 2023-2032 (US$ Mn)
TABLE 391 ChinaDigital Pathology Market , By Slide Scanners, 2017-2023 (US$ Mn)
TABLE 392 China Digital Pathology Market , By Slide Scanners, 2023-2032 (US$ Mn)
TABLE 393 China Digital Pathology Market , By Usage, 2017-2023 (US$ Mn)
TABLE 394 China Digital Pathology Market , By Clinical Spain Services, 2023-2032 (US$ Mn)
TABLE 395 China Digital Pathology Market , By Integration, 2017-2023 (US$ Mn)
TABLE 396 China Digital Pathology Market , By Integration, 2023-2032 (US$ Mn)
TABLE 397 China Digital Pathology Market , By Image Type, By Region, 2017-2023 (US$ Mn)
TABLE 398 China Digital Pathology Market , By Image Type, By Region, 2023-2032 (US$ Mn)
TABLE 399 China Digital Pathology Market , By Delivery Mode, 2017-2023 (US$ Mn)
TABLE 400 China Digital Pathology Market , By Delivery Mode, 2023-2032 (US$ Mn)
TABLE 401 China Digital Pathology Market , By Workflow, By Region, 2017-2023 (US$ Mn)
TABLE 402 China Digital Pathology Market , By Workflow, By Region, 2023-2032 (US$ Mn)
TABLE 403 Japan Digital Pathology Market , By Product Type:, 2017-2023 (US$ Mn)
TABLE 404 Japan Digital Pathology Market , By Product Type:, 2023-2032 (US$ Mn)
TABLE 405 Japan Digital Pathology Market , By Technology, 2017-2023 (US$ Mn)
TABLE 406 Japan Digital Pathology Market , By Technology, 2023-2032 (US$ Mn)
TABLE 407 Japan Digital Pathology Market , By Application, 2017-2023 (US$ Mn)
TABLE 408 Japan Digital Pathology Market , By Application, 2023-2032 (US$ Mn)
TABLE 409 JapanDigital Pathology Market , By End-User, By Region, 2017-2023 (US$ Mn)
TABLE 410 JapanDigital Pathology Market , By End-User, By Region, 2023-2032 (US$ Mn)
TABLE 411 JapanDigital Pathology Market , By Slide Scanners, 2017-2023 (US$ Mn)
TABLE 412 Japan Digital Pathology Market , By Slide Scanners, 2023-2032 (US$ Mn)
TABLE 413 Japan Digital Pathology Market , By Usage, 2017-2023 (US$ Mn)
TABLE 414 Japan Digital Pathology Market , By Clinical Spain Services, 2023-2032 (US$ Mn)
TABLE 415 Japan Digital Pathology Market , By Integration, 2017-2023 (US$ Mn)
TABLE 416 Japan Digital Pathology Market , By Integration, 2023-2032 (US$ Mn)
TABLE 417 Japan Digital Pathology Market , By Image Type, By Region, 2017-2023 (US$ Mn)
TABLE 418 Japan Digital Pathology Market , By Image Type, By Region, 2023-2032 (US$ Mn)
TABLE 419 Japan Digital Pathology Market , By Delivery Mode, 2017-2023 (US$ Mn)
TABLE 420 Japan Digital Pathology Market , By Delivery Mode, 2023-2032 (US$ Mn)
TABLE 421 Japan Digital Pathology Market , By Workflow, By Region, 2017-2023 (US$ Mn)
TABLE 422 Japan Digital Pathology Market , By Workflow, By Region, 2023-2032 (US$ Mn)
TABLE 423 India Digital Pathology Market , By Product Type:, 2017-2023 (US$ Mn)
TABLE 424 India Digital Pathology Market , By Product Type:, 2023-2032 (US$ Mn)
TABLE 425 India Digital Pathology Market , By Technology, 2017-2023 (US$ Mn)
TABLE 426 India Digital Pathology Market , By Technology, 2023-2032 (US$ Mn)
TABLE 427 India Digital Pathology Market , By Application, 2017-2023 (US$ Mn)
TABLE 428 India Digital Pathology Market , By Application, 2023-2032 (US$ Mn)
TABLE 429 IndiaDigital Pathology Market , By End-User, By Region, 2017-2023 (US$ Mn)
TABLE 430 IndiaDigital Pathology Market , By End-User, By Region, 2023-2032 (US$ Mn)
TABLE 431 IndiaDigital Pathology Market , By Slide Scanners, 2017-2023 (US$ Mn)
TABLE 432 India Digital Pathology Market , By Slide Scanners, 2023-2032 (US$ Mn)
TABLE 433 India Digital Pathology Market , By Usage, 2017-2023 (US$ Mn)
TABLE 434 India Digital Pathology Market , By Clinical Spain Services, 2023-2032 (US$ Mn)
TABLE 435 India Digital Pathology Market , By Integration, 2017-2023 (US$ Mn)
TABLE 436 India Digital Pathology Market , By Integration, 2023-2032 (US$ Mn)
TABLE 437 India Digital Pathology Market , By Image Type, By Region, 2017-2023 (US$ Mn)
TABLE 438 India Digital Pathology Market , By Image Type, By Region, 2023-2032 (US$ Mn)
TABLE 439 India Digital Pathology Market , By Delivery Mode, 2017-2023 (US$ Mn)
TABLE 440 India Digital Pathology Market , By Delivery Mode, 2023-2032 (US$ Mn)
TABLE 441 India Digital Pathology Market , By Workflow, By Region, 2017-2023 (US$ Mn)
TABLE 442 India Digital Pathology Market , By Workflow, By Region, 2023-2032 (US$ Mn)
TABLE 443 South Korea Digital Pathology Market , By Product Type:, 2017-2023 (US$ Mn)
TABLE 444 South Korea Digital Pathology Market , By Product Type:, 2023-2032 (US$ Mn)
TABLE 445 South Korea Digital Pathology Market , By Technology, 2017-2023 (US$ Mn)
TABLE 446 South Korea Digital Pathology Market , By Technology, 2023-2032 (US$ Mn)
TABLE 447 South Korea Digital Pathology Market , By Application, 2017-2023 (US$ Mn)
TABLE 448 South Korea Digital Pathology Market , By Application, 2023-2032 (US$ Mn)
TABLE 449 South KoreaDigital Pathology Market , By End-User, By Region, 2017-2023 (US$ Mn)
TABLE 450 South KoreaDigital Pathology Market , By End-User, By Region, 2023-2032 (US$ Mn)
TABLE 451 South KoreaDigital Pathology Market , By Slide Scanners, 2017-2023 (US$ Mn)
TABLE 452 South Korea Digital Pathology Market , By Slide Scanners, 2023-2032 (US$ Mn)
TABLE 453 South Korea Digital Pathology Market , By Usage, 2017-2023 (US$ Mn)
TABLE 454 South Korea Digital Pathology Market , By Clinical Spain Services, 2023-2032 (US$ Mn)
TABLE 455 South Korea Digital Pathology Market , By Integration, 2017-2023 (US$ Mn)
TABLE 456 South Korea Digital Pathology Market , By Integration, 2023-2032 (US$ Mn)
TABLE 457 South Korea Digital Pathology Market , By Image Type, By Region, 2017-2023 (US$ Mn)
TABLE 458 South Korea Digital Pathology Market , By Image Type, By Region, 2023-2032 (US$ Mn)
TABLE 459 South Korea Digital Pathology Market , By Delivery Mode, 2017-2023 (US$ Mn)
TABLE 460 South Korea Digital Pathology Market , By Delivery Mode, 2023-2032 (US$ Mn)
TABLE 461 South Korea Digital Pathology Market , By Workflow, By Region, 2017-2023 (US$ Mn)
TABLE 462 South Korea Digital Pathology Market , By Workflow, By Region, 2023-2032 (US$ Mn)
TABLE 463 South-East Asia Digital Pathology Market , By Product Type:, 2017-2023 (US$ Mn)
TABLE 464 South-East Asia Digital Pathology Market , By Product Type:, 2023-2032 (US$ Mn)
TABLE 465 South-East Asia Digital Pathology Market , By Technology, 2017-2023 (US$ Mn)
TABLE 466 South-East Asia Digital Pathology Market , By Technology, 2023-2032 (US$ Mn)
TABLE 467 South-East Asia Digital Pathology Market , By Application, 2017-2023 (US$ Mn)
TABLE 468 South-East Asia Digital Pathology Market , By Application, 2023-2032 (US$ Mn)
TABLE 469 South-East AsiaDigital Pathology Market , By End-User, By Region, 2017-2023 (US$ Mn)
TABLE 470 South-East AsiaDigital Pathology Market , By End-User, By Region, 2023-2032 (US$ Mn)
TABLE 471 South-East AsiaDigital Pathology Market , By Slide Scanners, 2017-2023 (US$ Mn)
TABLE 472 South-East Asia Digital Pathology Market , By Slide Scanners, 2023-2032 (US$ Mn)
TABLE 473 South-East Asia Digital Pathology Market , By Usage, 2017-2023 (US$ Mn)
TABLE 474 South-East Asia Digital Pathology Market , By Clinical Spain Services, 2023-2032 (US$ Mn)
TABLE 475 South-East Asia Digital Pathology Market , By Integration, 2017-2023 (US$ Mn)
TABLE 476 South-East Asia Digital Pathology Market , By Integration, 2023-2032 (US$ Mn)
TABLE 477 South-East Asia Digital Pathology Market , By Image Type, By Region, 2017-2023 (US$ Mn)
TABLE 478 South-East Asia Digital Pathology Market , By Image Type, By Region, 2023-2032 (US$ Mn)
TABLE 479 South-East Asia Digital Pathology Market , By Delivery Mode, 2017-2023 (US$ Mn)
TABLE 480 South-East Asia Digital Pathology Market , By Delivery Mode, 2023-2032 (US$ Mn)
TABLE 481 South-East Asia Digital Pathology Market , By Workflow, By Region, 2017-2023 (US$ Mn)
TABLE 482 South-East Asia Digital Pathology Market , By Workflow, By Region, 2023-2032 (US$ Mn)
TABLE 483 Rest of Asia Pacific Digital Pathology Market , By Product Type:, 2017-2023 (US$ Mn)
TABLE 484 Rest of Asia Pacific Digital Pathology Market , By Product Type:, 2023-2032 (US$ Mn)
TABLE 485 Rest of Asia Pacific Digital Pathology Market , By Technology, 2017-2023 (US$ Mn)
TABLE 486 Rest of Asia Pacific Digital Pathology Market , By Technology, 2023-2032 (US$ Mn)
TABLE 487 Rest of Asia Pacific Digital Pathology Market , By Application, 2017-2023 (US$ Mn)
TABLE 488 Rest of Asia Pacific Digital Pathology Market , By Application, 2023-2032 (US$ Mn)
TABLE 489 Rest of Asia PacificDigital Pathology Market , By End-User, By Region, 2017-2023 (US$ Mn)
TABLE 490 Rest of Asia PacificDigital Pathology Market , By End-User, By Region, 2023-2032 (US$ Mn)
TABLE 491 Rest of Asia Pacific Digital Pathology Market , By Slide Scanners, 2017-2023 (US$ Mn)
TABLE 492 Rest of Asia PacificDigital Pathology Market , By Slide Scanners, 2023-2032 (US$ Mn)
TABLE 493 Rest of Asia Pacific Digital Pathology Market , By Usage, 2017-2023 (US$ Mn)
TABLE 494 Rest of Asia Pacific Digital Pathology Market , By Clinical Spain Services, 2023-2032 (US$ Mn)
TABLE 495 Rest of Asia Pacific Digital Pathology Market , By Integration, 2017-2023 (US$ Mn)
TABLE 496 Rest of Asia Pacific Digital Pathology Market , By Integration, 2023-2032 (US$ Mn)
TABLE 497 Rest of Asia Pacific Digital Pathology Market , By Image Type, By Region, 2017-2023 (US$ Mn)
TABLE 498 Rest of Asia Pacific Digital Pathology Market , By Image Type, By Region, 2023-2032 (US$ Mn)
TABLE 499 Rest of Asia Pacific Digital Pathology Market , By Delivery Mode, 2017-2023 (US$ Mn)
TABLE 500 Rest of Asia Pacific Digital Pathology Market , By Delivery Mode, 2023-2032 (US$ Mn)
TABLE 501 Rest of Asia Pacific Digital Pathology Market , By Workflow, By Region, 2017-2023 (US$ Mn)
TABLE 502 Rest of Asia Pacific Digital Pathology Market , By Workflow, By Region, 2023-2032 (US$ Mn)
TABLE 503 Latin America Digital Pathology Market , By Product Type:, 2017-2023 (US$ Mn)
TABLE 504 Latin America Digital Pathology Market , By Product Type:, 2023-2032 (US$ Mn)
TABLE 505 Latin America Digital Pathology Market , By Technology, 2017-2023 (US$ Mn)
TABLE 506 Latin America Digital Pathology Market , By Technology, 2023-2032 (US$ Mn)
TABLE 507 Latin America Digital Pathology Market , By Application, 2017-2023 (US$ Mn)
TABLE 508 Latin America Digital Pathology Market , By Application, 2023-2032 (US$ Mn)
TABLE 509 Latin AmericaDigital Pathology Market , By End-User, By Region, 2017-2023 (US$ Mn)
TABLE 510 Latin AmericaDigital Pathology Market , By End-User, By Region, 2023-2032 (US$ Mn)
TABLE 511 Latin AmericaDigital Pathology Market , By Slide Scanners, 2017-2023 (US$ Mn)
TABLE 512 Latin America Digital Pathology Market , By Slide Scanners, 2023-2032 (US$ Mn)
TABLE 513 Latin America Digital Pathology Market , By Usage, 2017-2023 (US$ Mn)
TABLE 514 Latin America Digital Pathology Market , By Clinical Spain Services, 2023-2032 (US$ Mn)
TABLE 515 Latin America Digital Pathology Market , By Integration, 2017-2023 (US$ Mn)
TABLE 516 Latin America Digital Pathology Market , By Integration, 2023-2032 (US$ Mn)
TABLE 517 Latin America Digital Pathology Market , By Image Type, By Region, 2017-2023 (US$ Mn)
TABLE 518 Latin America Digital Pathology Market , By Image Type, By Region, 2023-2032 (US$ Mn)
TABLE 519 Latin America Digital Pathology Market , By Delivery Mode, 2017-2023 (US$ Mn)
TABLE 520 Latin America Digital Pathology Market , By Delivery Mode, 2023-2032 (US$ Mn)
TABLE 521 Latin America Digital Pathology Market , By Workflow, By Region, 2017-2023 (US$ Mn)
TABLE 522 Latin America Digital Pathology Market , By Workflow, By Region, 2023-2032 (US$ Mn)
TABLE 523 Brazil Digital Pathology Market , By Product Type:, 2017-2023 (US$ Mn)
TABLE 524 Brazil Digital Pathology Market , By Product Type:, 2023-2032 (US$ Mn)
TABLE 525 Brazil Digital Pathology Market , By Technology, 2017-2023 (US$ Mn)
TABLE 526 Brazil Digital Pathology Market , By Technology, 2023-2032 (US$ Mn)
TABLE 527 Brazil Digital Pathology Market , By Application, 2017-2023 (US$ Mn)
TABLE 528 Brazil Digital Pathology Market , By Application, 2023-2032 (US$ Mn)
TABLE 529 BrazilDigital Pathology Market , By End-User, By Region, 2017-2023 (US$ Mn)
TABLE 530 BrazilDigital Pathology Market , By End-User, By Region, 2023-2032 (US$ Mn)
TABLE 531 BrazilDigital Pathology Market , By Slide Scanners, 2017-2023 (US$ Mn)
TABLE 532 Brazil Digital Pathology Market , By Slide Scanners, 2023-2032 (US$ Mn)
TABLE 533 Brazil Digital Pathology Market , By Usage, 2017-2023 (US$ Mn)
TABLE 534 Brazil Digital Pathology Market , By Clinical Spain Services, 2023-2032 (US$ Mn)
TABLE 535 Brazil Digital Pathology Market , By Integration, 2017-2023 (US$ Mn)
TABLE 536 Brazil Digital Pathology Market , By Integration, 2023-2032 (US$ Mn)
TABLE 537 Brazil Digital Pathology Market , By Image Type, By Region, 2017-2023 (US$ Mn)
TABLE 538 Brazil Digital Pathology Market , By Image Type, By Region, 2023-2032 (US$ Mn)
TABLE 539 Brazil Digital Pathology Market , By Delivery Mode, 2017-2023 (US$ Mn)
TABLE 540 Brazil Digital Pathology Market , By Delivery Mode, 2023-2032 (US$ Mn)
TABLE 541 Brazil Digital Pathology Market , By Workflow, By Region, 2017-2023 (US$ Mn)
TABLE 542 Brazil Digital Pathology Market , By Workflow, By Region, 2023-2032 (US$ Mn)
TABLE 543 Argentina Digital Pathology Market , By Product Type:, 2017-2023 (US$ Mn)
TABLE 544 Argentina Digital Pathology Market , By Product Type:, 2023-2032 (US$ Mn)
TABLE 545 Argentina Digital Pathology Market , By Technology, 2017-2023 (US$ Mn)
TABLE 546 Argentina Digital Pathology Market , By Technology, 2023-2032 (US$ Mn)
TABLE 547 Argentina Digital Pathology Market , By Application, 2017-2023 (US$ Mn)
TABLE 548 Argentina Digital Pathology Market , By Application, 2023-2032 (US$ Mn)
TABLE 549 ArgentinaDigital Pathology Market , By End-User, By Region, 2017-2023 (US$ Mn)
TABLE 550 ArgentinaDigital Pathology Market , By End-User, By Region, 2023-2032 (US$ Mn)
TABLE 551 ArgentinaDigital Pathology Market , By Slide Scanners, 2017-2023 (US$ Mn)
TABLE 552 Argentina Digital Pathology Market , By Slide Scanners, 2023-2032 (US$ Mn)
TABLE 553 Argentina Digital Pathology Market , By Usage, 2017-2023 (US$ Mn)
TABLE 554 Argentina Digital Pathology Market , By Clinical Spain Services, 2023-2032 (US$ Mn)
TABLE 555 Argentina Digital Pathology Market , By Integration, 2017-2023 (US$ Mn)
TABLE 556 Argentina Digital Pathology Market , By Integration, 2023-2032 (US$ Mn)
TABLE 557 Argentina Digital Pathology Market , By Image Type, By Region, 2017-2023 (US$ Mn)
TABLE 558 Argentina Digital Pathology Market , By Image Type, By Region, 2023-2032 (US$ Mn)
TABLE 559 Argentina Digital Pathology Market , By Delivery Mode, 2017-2023 (US$ Mn)
TABLE 560 Argentina Digital Pathology Market , By Delivery Mode, 2023-2032 (US$ Mn)
TABLE 561 Argentina Digital Pathology Market , By Workflow, By Region, 2017-2023 (US$ Mn)
TABLE 562 Argentina Digital Pathology Market , By Workflow, By Region, 2023-2032 (US$ Mn)
TABLE 563 Rest of Latin America Digital Pathology Market , By Product Type:, 2017-2023 (US$ Mn)
TABLE 564 Rest of Latin America Digital Pathology Market , By Product Type:, 2023-2032 (US$ Mn)
TABLE 565 Rest of Latin America Digital Pathology Market , By Technology, 2017-2023 (US$ Mn)
TABLE 566 Rest of Latin America Digital Pathology Market , By Technology, 2023-2032 (US$ Mn)
TABLE 567 Rest of Latin America Digital Pathology Market , By Application, 2017-2023 (US$ Mn)
TABLE 568 Rest of Latin America Digital Pathology Market , By Application, 2023-2032 (US$ Mn)
TABLE 569 Rest of Latin AmericaDigital Pathology Market , By End-User, By Region, 2017-2023 (US$ Mn)
TABLE 570 Rest of Latin AmericaDigital Pathology Market , By End-User, By Region, 2023-2032 (US$ Mn)
TABLE 571 Rest of Latin AmericaDigital Pathology Market , By Slide Scanners, 2017-2023 (US$ Mn)
TABLE 572 Rest of Latin America Digital Pathology Market , By Slide Scanners, 2023-2032 (US$ Mn)
TABLE 573 Rest of Latin America Digital Pathology Market , By Usage, 2017-2023 (US$ Mn)
TABLE 574 Rest of Latin America Digital Pathology Market , By Clinical Spain Services, 2023-2032 (US$ Mn)
TABLE 575 Rest of Latin America Digital Pathology Market , By Integration, 2017-2023 (US$ Mn)
TABLE 576 Rest of Latin America Digital Pathology Market , By Integration, 2023-2032 (US$ Mn)
TABLE 577 Rest of Latin America Digital Pathology Market , By Image Type, By Region, 2017-2023 (US$ Mn)
TABLE 578 Rest of Latin America Digital Pathology Market , By Image Type, By Region, 2023-2032 (US$ Mn)
TABLE 579 Rest of Latin America Digital Pathology Market , By Delivery Mode, 2017-2023 (US$ Mn)
TABLE 580 Rest of Latin America Digital Pathology Market , By Delivery Mode, 2023-2032 (US$ Mn)
TABLE 581 Rest of Latin America Digital Pathology Market , By Workflow, By Region, 2017-2023 (US$ Mn)
TABLE 582 Rest of Latin America Digital Pathology Market , By Workflow, By Region, 2023-2032 (US$ Mn)
TABLE 583 Middle EastDigital Pathology Market , By Product Type:, 2017-2023 (US$ Mn)
TABLE 584 Middle EastDigital Pathology Market , By Product Type:, 2023-2032 (US$ Mn)
TABLE 585 Middle EastDigital Pathology Market , By Technology, 2017-2023 (US$ Mn)
TABLE 586 Middle EastDigital Pathology Market , By Technology, 2023-2032 (US$ Mn)
TABLE 587 Middle EastDigital Pathology Market , By Application, 2017-2023 (US$ Mn)
TABLE 588 Middle EastDigital Pathology Market , By Application, 2023-2032 (US$ Mn)
TABLE 589 Middle EastDigital Pathology Market , By End-User, By Region, 2017-2023 (US$ Mn)
TABLE 590 Middle EastDigital Pathology Market , By End-User, By Region, 2023-2032 (US$ Mn)
TABLE 591 Middle EastDigital Pathology Market , By Slide Scanners, 2017-2023 (US$ Mn)
TABLE 592 Middle East Digital Pathology Market , By Slide Scanners, 2023-2032 (US$ Mn)
TABLE 593 Middle East Digital Pathology Market , By Usage, 2017-2023 (US$ Mn)
TABLE 594 Middle East Digital Pathology Market , By Clinical Spain Services, 2023-2032 (US$ Mn)
TABLE 595 Middle East Digital Pathology Market , By Integration, 2017-2023 (US$ Mn)
TABLE 596 Middle East Digital Pathology Market , By Integration, 2023-2032 (US$ Mn)
TABLE 597 Middle East Digital Pathology Market , By Image Type, By Region, 2017-2023 (US$ Mn)
TABLE 598 Middle East Digital Pathology Market , By Image Type, By Region, 2023-2032 (US$ Mn)
TABLE 599 Middle East Digital Pathology Market , By Delivery Mode, 2017-2023 (US$ Mn)
TABLE 600 Middle East Digital Pathology Market , By Delivery Mode, 2023-2032 (US$ Mn)
TABLE 601 Middle East Digital Pathology Market , By Workflow, By Region, 2017-2023 (US$ Mn)
TABLE 602 Middle East Digital Pathology Market , By Workflow, By Region, 2023-2032 (US$ Mn)
TABLE 603 UAEDigital Pathology Market , By Product Type:, 2017-2023 (US$ Mn)
TABLE 604 UAEDigital Pathology Market , By Product Type:, 2023-2032 (US$ Mn)
TABLE 605 UAEDigital Pathology Market , By Technology, 2017-2023 (US$ Mn)
TABLE 606 UAEDigital Pathology Market , By Technology, 2023-2032 (US$ Mn)
TABLE 607 UAEDigital Pathology Market , By Application, 2017-2023 (US$ Mn)
TABLE 608 UAEDigital Pathology Market , By Application, 2023-2032 (US$ Mn)
TABLE 609 UAEDigital Pathology Market , By End-User, By Region, 2017-2023 (US$ Mn)
TABLE 610 UAEDigital Pathology Market , By End-User, By Region, 2023-2032 (US$ Mn)
TABLE 611 UAEDigital Pathology Market , By Slide Scanners, 2017-2023 (US$ Mn)
TABLE 612 UAE Digital Pathology Market , By Slide Scanners, 2023-2032 (US$ Mn)
TABLE 613 UAE Digital Pathology Market , By Usage, 2017-2023 (US$ Mn)
TABLE 614 UAE Digital Pathology Market , By Clinical Spain Services, 2023-2032 (US$ Mn)
TABLE 615 UAE Digital Pathology Market , By Integration, 2017-2023 (US$ Mn)
TABLE 616 UAE Digital Pathology Market , By Integration, 2023-2032 (US$ Mn)
TABLE 617 UAE Digital Pathology Market , By Image Type, By Region, 2017-2023 (US$ Mn)
TABLE 618 UAE Digital Pathology Market , By Image Type, By Region, 2023-2032 (US$ Mn)
TABLE 619 UAE Digital Pathology Market , By Delivery Mode, 2017-2023 (US$ Mn)
TABLE 620 UAE Digital Pathology Market , By Delivery Mode, 2023-2032 (US$ Mn)
TABLE 621 UAE Digital Pathology Market , By Workflow, By Region, 2017-2023 (US$ Mn)
TABLE 622 UAE Digital Pathology Market , By Workflow, By Region, 2023-2032 (US$ Mn)
TABLE 623 Saudi ArabiaDigital Pathology Market , By Product Type:, 2017-2023 (US$ Mn)
TABLE 624 Saudi ArabiaDigital Pathology Market , By Product Type:, 2023-2032 (US$ Mn)
TABLE 625 Saudi ArabiaDigital Pathology Market , By Technology, 2017-2023 (US$ Mn)
TABLE 626 Saudi ArabiaDigital Pathology Market , By Technology, 2023-2032 (US$ Mn)
TABLE 627 Saudi ArabiaDigital Pathology Market , By Application, 2017-2023 (US$ Mn)
TABLE 628 Saudi ArabiaDigital Pathology Market , By Application, 2023-2032 (US$ Mn)
TABLE 629 Saudi ArabiaDigital Pathology Market , By End-User, By Region, 2017-2023 (US$ Mn)
TABLE 630 Saudi ArabiaDigital Pathology Market , By End-User, By Region, 2023-2032 (US$ Mn)
TABLE 631 Saudi ArabiaDigital Pathology Market , By Slide Scanners, 2017-2023 (US$ Mn)
TABLE 632 Saudi Arabia Digital Pathology Market , By Slide Scanners, 2023-2032 (US$ Mn)
TABLE 633 Saudi Arabia Digital Pathology Market , By Usage, 2017-2023 (US$ Mn)
TABLE 634 Saudi Arabia Digital Pathology Market , By Clinical Spain Services, 2023-2032 (US$ Mn)
TABLE 635 Saudi Arabia Digital Pathology Market , By Integration, 2017-2023 (US$ Mn)
TABLE 636 Saudi Arabia Digital Pathology Market , By Integration, 2023-2032 (US$ Mn)
TABLE 637 Saudi Arabia Digital Pathology Market , By Image Type, By Region, 2017-2023 (US$ Mn)
TABLE 638 Saudi Arabia Digital Pathology Market , By Image Type, By Region, 2023-2032 (US$ Mn)
TABLE 639 Saudi Arabia Digital Pathology Market , By Delivery Mode, 2017-2023 (US$ Mn)
TABLE 640 Saudi Arabia Digital Pathology Market , By Delivery Mode, 2023-2032 (US$ Mn)
TABLE 641 Saudi Arabia Digital Pathology Market , By Workflow, By Region, 2017-2023 (US$ Mn)
TABLE 642 Saudi Arabia Digital Pathology Market , By Workflow, By Region, 2023-2032 (US$ Mn)
TABLE 643 Rest of Middle EastDigital Pathology Market , By Product Type:, 2017-2023 (US$ Mn)
TABLE 644 Rest of Middle EastDigital Pathology Market , By Product Type:, 2023-2032 (US$ Mn)
TABLE 645 Rest of Middle EastDigital Pathology Market , By Technology, 2017-2023 (US$ Mn)
TABLE 646 Rest of Middle EastDigital Pathology Market , By Technology, 2023-2032 (US$ Mn)
TABLE 647 Rest of Middle EastDigital Pathology Market , By Application, 2017-2023 (US$ Mn)
TABLE 648 Rest of Middle EastDigital Pathology Market , By Application, 2023-2032 (US$ Mn)
TABLE 649 Rest of Middle EastDigital Pathology Market , By End-User, By Region, 2017-2023 (US$ Mn)
TABLE 650 Rest of Middle EastDigital Pathology Market , By End-User, By Region, 2023-2032 (US$ Mn)
TABLE 651 Rest of Middle EastDigital Pathology Market , By Slide Scanners, 2017-2023 (US$ Mn)
TABLE 652 Rest of Middle East Digital Pathology Market , By Slide Scanners, 2023-2032 (US$ Mn)
TABLE 653 Rest of Middle East Digital Pathology Market , By Usage, 2017-2023 (US$ Mn)
TABLE 654 Rest of Middle East Digital Pathology Market , By Clinical Spain Services, 2023-2032 (US$ Mn)
TABLE 655 Rest of Middle East Digital Pathology Market , By Integration, 2017-2023 (US$ Mn)
TABLE 656 Rest of Middle East Digital Pathology Market , By Integration, 2023-2032 (US$ Mn)
TABLE 657 Rest of Middle East Digital Pathology Market , By Image Type, By Region, 2017-2023 (US$ Mn)
TABLE 658 Rest of Middle East Digital Pathology Market , By Image Type, By Region, 2023-2032 (US$ Mn)
TABLE 659 Rest of Middle East Digital Pathology Market , By Delivery Mode, 2017-2023 (US$ Mn)
TABLE 660 Rest of Middle East Digital Pathology Market , By Delivery Mode, 2023-2032 (US$ Mn)
TABLE 661 Rest of Middle East Digital Pathology Market , By Workflow, By Region, 2017-2023 (US$ Mn)
TABLE 662 Rest of Middle East Digital Pathology Market , By Workflow, By Region, 2023-2032 (US$ Mn)
TABLE 663 Africa Digital Pathology Market , By Product Type:, 2017-2023 (US$ Mn)
TABLE 664 AfricaDigital Pathology Market , By Product Type:, 2023-2032 (US$ Mn)
TABLE 665 AfricaDigital Pathology Market , By Technology, 2017-2023 (US$ Mn)
TABLE 666 AfricaDigital Pathology Market , By Technology, 2023-2032 (US$ Mn)
TABLE 667 AfricaDigital Pathology Market , By Application, 2017-2023 (US$ Mn)
TABLE 668 AfricaDigital Pathology Market , By Application, 2023-2032 (US$ Mn)
TABLE 669 AfricaDigital Pathology Market , By End-User, By Region, 2017-2023 (US$ Mn)
TABLE 670 AfricaDigital Pathology Market , By End-User, By Region, 2023-2032 (US$ Mn)
TABLE 671 AfricaDigital Pathology Market , By Slide Scanners, 2017-2023 (US$ Mn)
TABLE 672 Africa Digital Pathology Market , By Slide Scanners, 2023-2032 (US$ Mn)
TABLE 673 Africa Digital Pathology Market , By Usage, 2017-2023 (US$ Mn)
TABLE 674 Africa Digital Pathology Market , By Clinical Spain Services, 2023-2032 (US$ Mn)
TABLE 675 Africa Digital Pathology Market , By Integration, 2017-2023 (US$ Mn)
TABLE 676 Africa Digital Pathology Market , By Integration, 2023-2032 (US$ Mn)
TABLE 677 Africa Digital Pathology Market , By Image Type, By Region, 2017-2023 (US$ Mn)
TABLE 678 Africa Digital Pathology Market , By Image Type, By Region, 2023-2032 (US$ Mn)
TABLE 679 Africa Digital Pathology Market , By Delivery Mode, 2017-2023 (US$ Mn)
TABLE 680 Africa Digital Pathology Market , By Delivery Mode, 2023-2032 (US$ Mn)
TABLE 681 Africa Digital Pathology Market , By Workflow, By Region, 2017-2023 (US$ Mn)
TABLE 682 Africa Digital Pathology Market , By Workflow, By Region, 2023-2032 (US$ Mn)
TABLE 683 South Africa Digital Pathology Market , By Product Type:, 2017-2023 (US$ Mn)
TABLE 684 South AfricaDigital Pathology Market , By Product Type:, 2023-2032 (US$ Mn)
TABLE 685 South AfricaDigital Pathology Market , By Technology, 2017-2023 (US$ Mn)
TABLE 686 South AfricaDigital Pathology Market , By Technology, 2023-2032 (US$ Mn)
TABLE 687 South AfricaDigital Pathology Market , By Application, 2017-2023 (US$ Mn)
TABLE 688 South AfricaDigital Pathology Market , By Application, 2023-2032 (US$ Mn)
TABLE 689 South AfricaDigital Pathology Market , By End-User, By Region, 2017-2023 (US$ Mn)
TABLE 690 South AfricaDigital Pathology Market , By End-User, By Region, 2023-2032 (US$ Mn)
TABLE 691 South AfricaDigital Pathology Market , By Slide Scanners, 2017-2023 (US$ Mn)
TABLE 692 South Africa Digital Pathology Market , By Slide Scanners, 2023-2032 (US$ Mn)
TABLE 693 South Africa Digital Pathology Market , By Usage, 2017-2023 (US$ Mn)
TABLE 694 South Africa Digital Pathology Market , By Clinical Spain Services, 2023-2032 (US$ Mn)
TABLE 695 South Africa Digital Pathology Market , By Integration, 2017-2023 (US$ Mn)
TABLE 696 South Africa Digital Pathology Market , By Integration, 2023-2032 (US$ Mn)
TABLE 697 South Africa Digital Pathology Market , By Image Type, By Region, 2017-2023 (US$ Mn)
TABLE 698 South Africa Digital Pathology Market , By Image Type, By Region, 2023-2032 (US$ Mn)
TABLE 699 South Africa Digital Pathology Market , By Delivery Mode, 2017-2023 (US$ Mn)
TABLE 700 South Africa Digital Pathology Market , By Delivery Mode, 2023-2032 (US$ Mn)
TABLE 701 South Africa Digital Pathology Market , By Workflow, By Region, 2017-2023 (US$ Mn)
TABLE 702 South Africa Digital Pathology Market , By Workflow, By Region, 2023-2032 (US$ Mn)
TABLE 703 EgyptDigital Pathology Market , By Product Type:, 2017-2023 (US$ Mn)
TABLE 704 EgyptDigital Pathology Market , By Product Type:, 2023-2032 (US$ Mn)
TABLE 705 EgyptDigital Pathology Market , By Technology, 2017-2023 (US$ Mn)
TABLE 706 EgyptDigital Pathology Market , By Technology, 2023-2032 (US$ Mn)
TABLE 707 EgyptDigital Pathology Market , By Application, 2017-2023 (US$ Mn)
TABLE 708 EgyptDigital Pathology Market , By Application, 2023-2032 (US$ Mn)
TABLE 709 EgyptDigital Pathology Market , By End-User, By Region, 2017-2023 (US$ Mn)
TABLE 710 EgyptDigital Pathology Market , By End-User, By Region, 2023-2032 (US$ Mn)
TABLE 711 EgyptDigital Pathology Market , By Slide Scanners, 2017-2023 (US$ Mn)
TABLE 712 Egypt Digital Pathology Market , By Slide Scanners, 2023-2032 (US$ Mn)
TABLE 713 Egypt Digital Pathology Market , By Usage, 2017-2023 (US$ Mn)
TABLE 714 Egypt Digital Pathology Market , By Clinical Spain Services, 2023-2032 (US$ Mn)
TABLE 715 Egypt Digital Pathology Market , By Integration, 2017-2023 (US$ Mn)
TABLE 716 Egypt Digital Pathology Market , By Integration, 2023-2032 (US$ Mn)
TABLE 717 Egypt Digital Pathology Market , By Image Type, By Region, 2017-2023 (US$ Mn)
TABLE 718 Egypt Digital Pathology Market , By Image Type, By Region, 2023-2032 (US$ Mn)
TABLE 719 Egypt Digital Pathology Market , By Delivery Mode, 2017-2023 (US$ Mn)
TABLE 720 Egypt Digital Pathology Market , By Delivery Mode, 2023-2032 (US$ Mn)
TABLE 721 Egypt Digital Pathology Market , By Workflow, By Region, 2017-2023 (US$ Mn)
TABLE 722 Egypt Digital Pathology Market , By Workflow, By Region, 2023-2032 (US$ Mn)
TABLE 723 Rest of AfricaDigital Pathology Market , By Product Type:, 2017-2023 (US$ Mn)
TABLE 724 Rest of AfricaDigital Pathology Market , By Product Type:, 2023-2032 (US$ Mn)
TABLE 725 Rest of AfricaDigital Pathology Market , By Technology, 2017-2023 (US$ Mn)
TABLE 726 Rest of AfricaDigital Pathology Market , By Technology, 2023-2032 (US$ Mn)
TABLE 727 Rest of AfricaDigital Pathology Market , By Application, 2017-2023 (US$ Mn)
TABLE 728 Rest of AfricaDigital Pathology Market , By Application, 2023-2032 (US$ Mn)
TABLE 729 Rest of AfricaDigital Pathology Market , By End-User, By Region, 2017-2023 (US$ Mn)
TABLE 730 Rest of AfricaDigital Pathology Market , By End-User, By Region, 2023-2032 (US$ Mn)
TABLE 731 Rest of AfricaDigital Pathology Market , By Slide Scanners, 2017-2023 (US$ Mn)
TABLE 732 Rest of Africa Digital Pathology Market , By Slide Scanners, 2023-2032 (US$ Mn)
TABLE 733 Rest of Africa Digital Pathology Market , By Usage, 2017-2023 (US$ Mn)
TABLE 734 Rest of Africa Digital Pathology Market , By Clinical Spain Services, 2023-2032 (US$ Mn)
TABLE 735 Rest of Africa Digital Pathology Market , By Integration, 2017-2023 (US$ Mn)
TABLE 736 Rest of Africa Digital Pathology Market , By Integration, 2023-2032 (US$ Mn)
TABLE 737 Rest of Africa Digital Pathology Market , By Image Type, By Region, 2017-2023 (US$ Mn)
TABLE 738 Rest of Africa Digital Pathology Market , By Image Type, By Region, 2023-2032 (US$ Mn)
TABLE 739 Rest of Africa Digital Pathology Market , By Delivery Mode, 2017-2023 (US$ Mn)
TABLE 740 Rest of Africa Digital Pathology Market , By Delivery Mode, 2023-2032 (US$ Mn)
TABLE 741 Rest of Africa Digital Pathology Market , By Workflow, By Region, 2017-2023 (US$ Mn)
TABLE 742 Rest of Africa Digital Pathology Market , By Workflow, By Region, 2023-2032 (US$ Mn)