
Medicare items and national genomics reshape lab demand
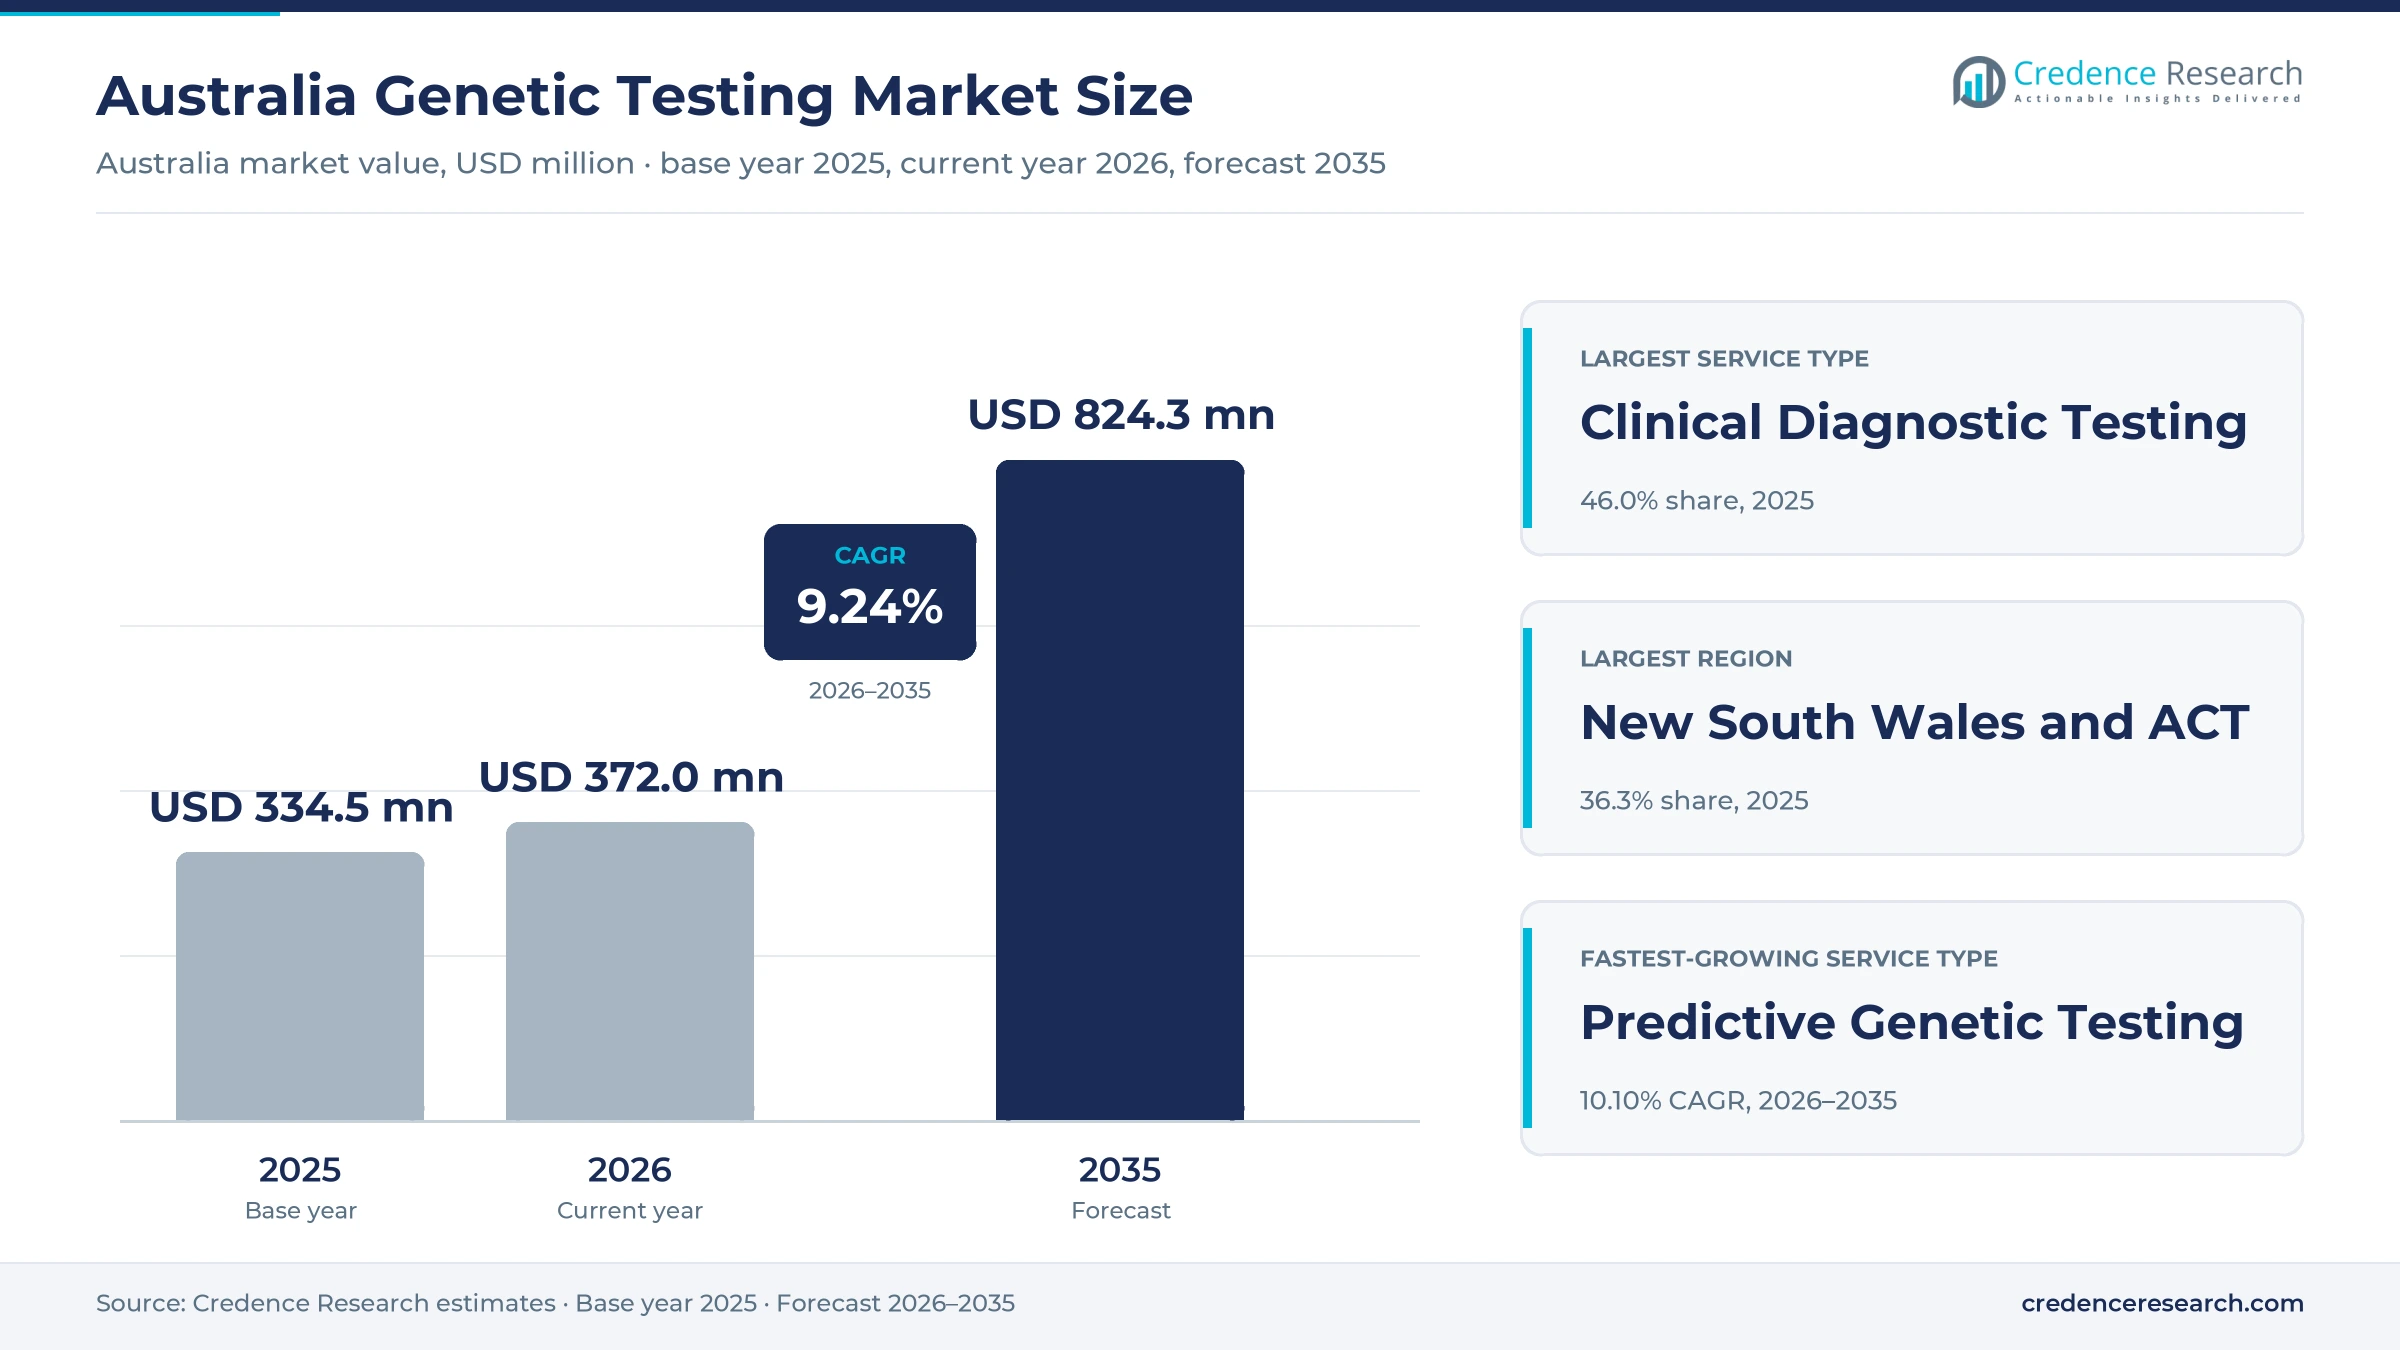
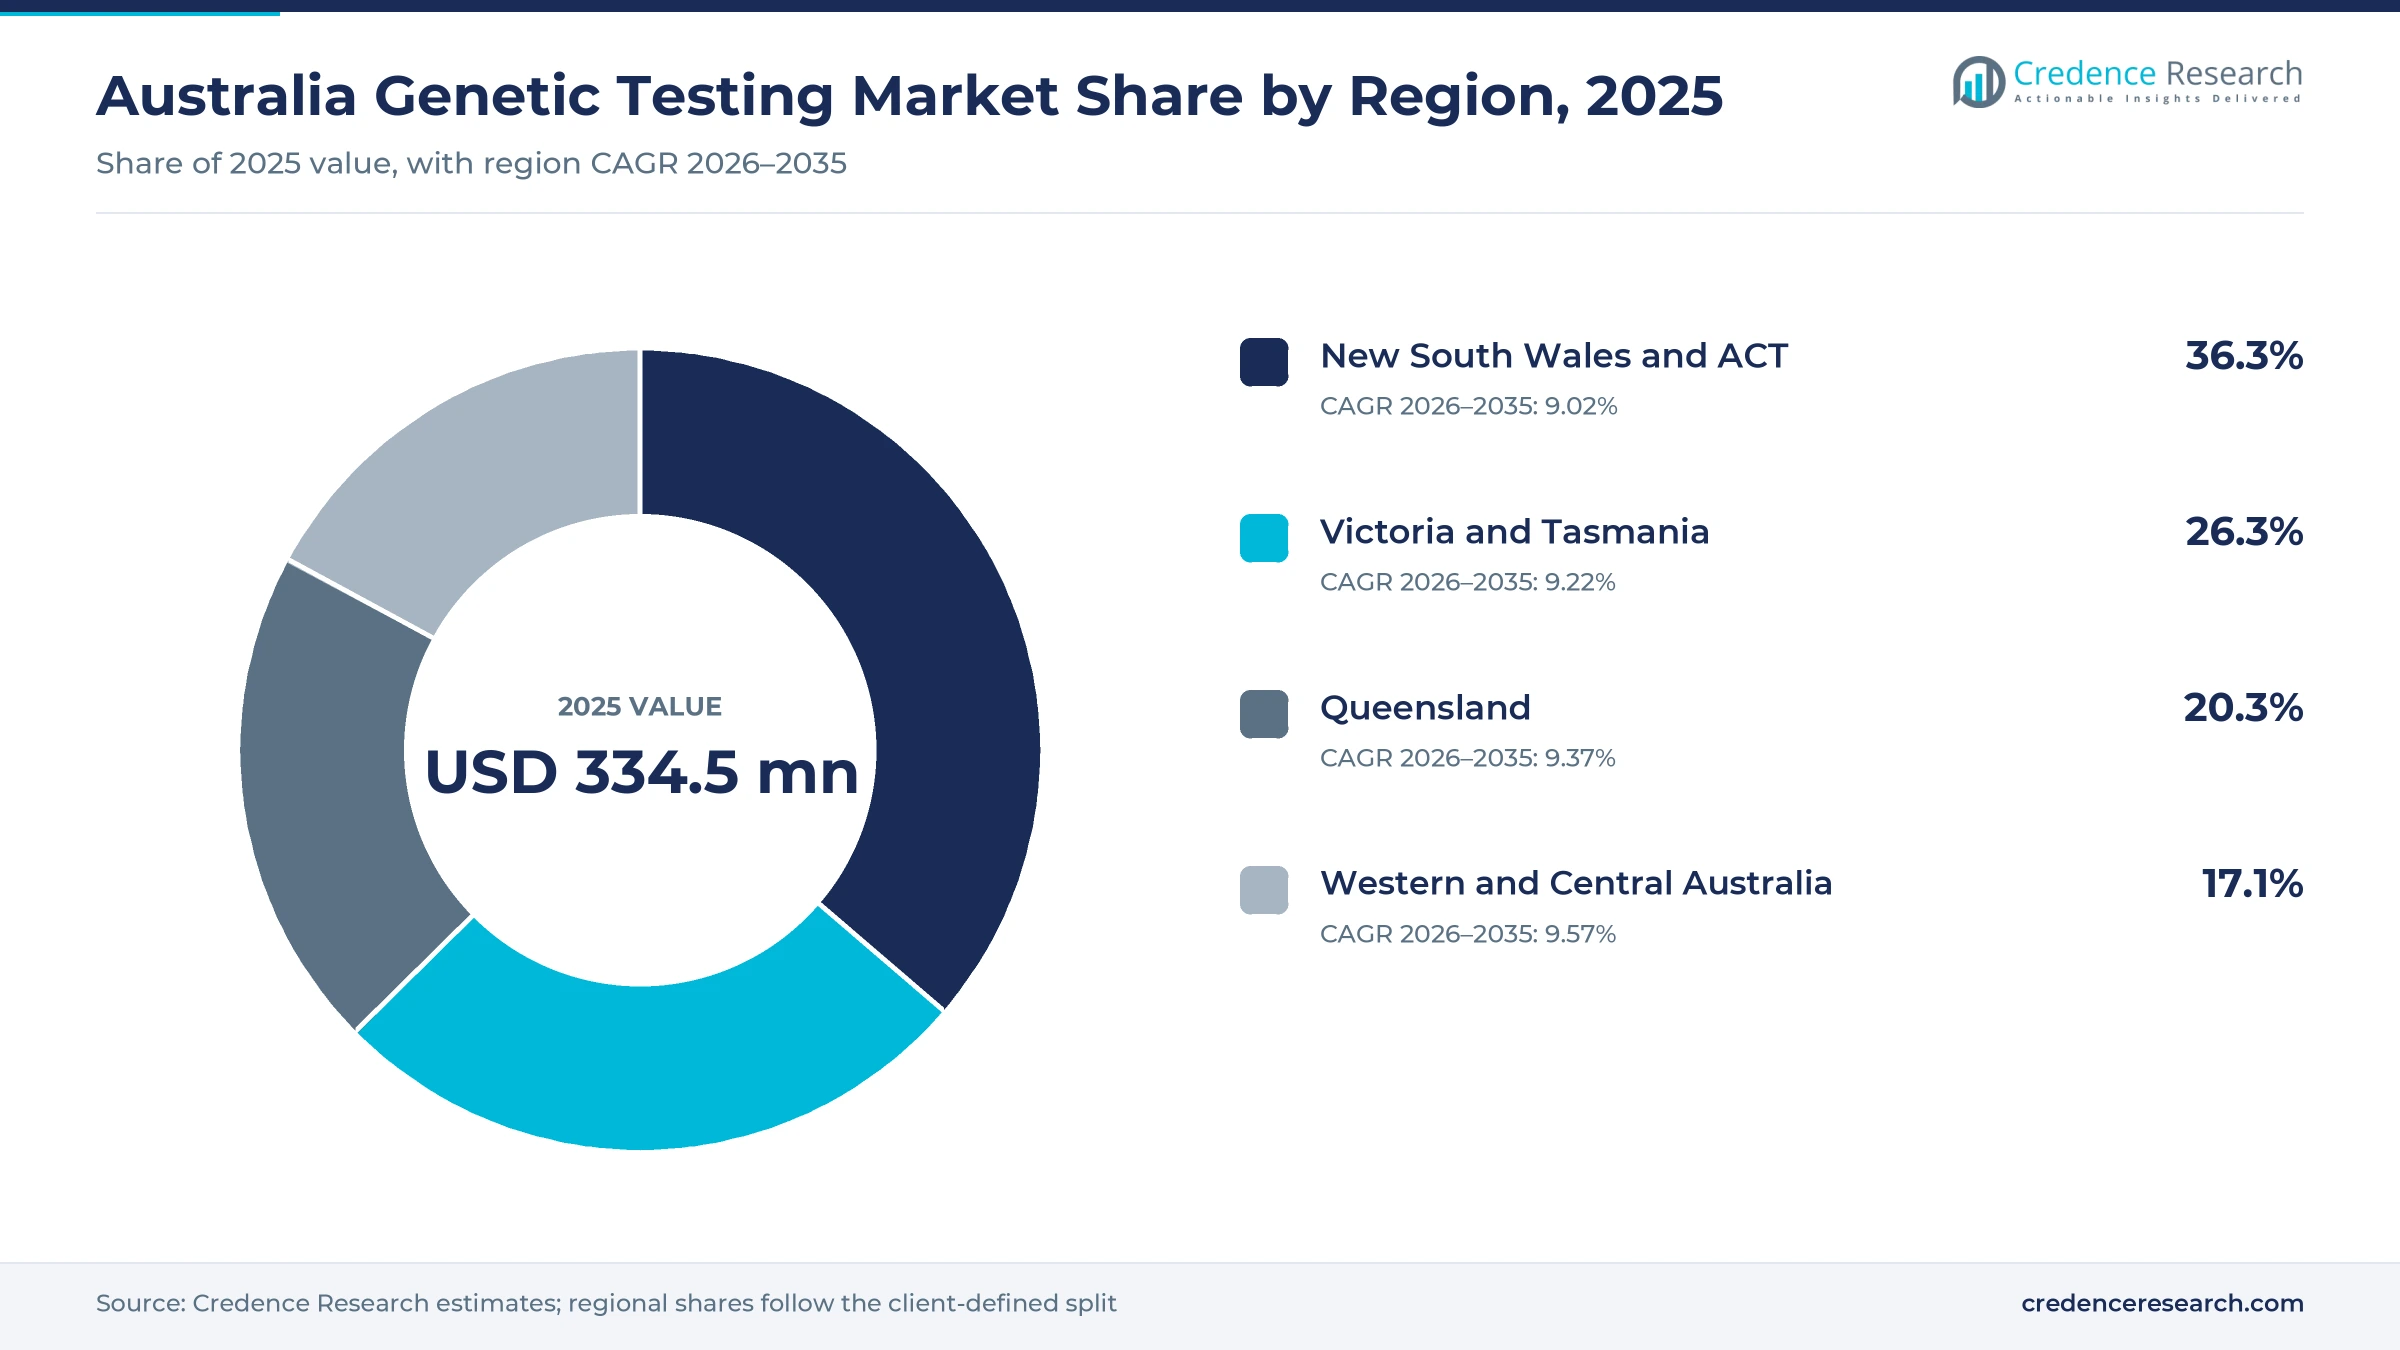
The Australia genetic testing market was valued at USD 334.5 million in 2025 and is projected to increase from USD 372.0 million in 2026 to USD 824.3 million by 2035, registering a CAGR of 9.24% during 2026–2035. Demand comes from hospital and specialist requests for cancer profiling and rare-disease diagnosis, from couples who screen for inherited conditions before or during pregnancy, and from fertility clinics that test embryos. New South Wales and ACT held the largest regional share, 36.3% in 2025, because Sydney hosts the largest public and private laboratory networks. Western and Central Australia is the fastest-growing region at 9.57% a year, as population growth in Western Australia leads the country. In turn, Genomics Australia began national coordination on July 1, 2025, and Parliament passed a ban on the use of adverse predictive results in life insurance on April 1, 2026.
Which DNA and chromosome tests does the estimate cover?
The estimate measures the value of clinical diagnostic, reproductive, predictive and identity tests performed by public and private laboratories in Australia. It counts tests funded by Medicare and state health systems, tests paid privately by patients and consumers, and tests bought under contracts by hospitals, courts and legal services.
The estimate excludes research sequencing that is not reported to patients, sequencing instruments and reagents sold on their own, and tests sent overseas by consumers without an Australian laboratory. The value chain runs from requesting doctors and genetic counselors through collection centers to accredited laboratories that sequence, analyze and report results.
Australia Genetic Testing Market Insights
- The Australia genetic testing market was valued at USD 334.5 million in 2025 and is projected to reach USD 824.3 million by 2035, registering a CAGR of 9.24% during 2026–2035.
- New South Wales and ACT held a 36.3% share of 2025 value, because the zone had more than 9.1 million residents in March 2026.
- Clinical diagnostic testing led with a 46.0% share of 2025 value, because hospital and specialist requests for cancer and rare-disease tests dominate lab work.
- Medicare carrier screening for cystic fibrosis, spinal muscular atrophy and fragile X syndrome began on Nov. 1, 2023.
- Predictive genetic testing grows fastest at 10.10% a year during 2026–2035, as new life insurance protections remove a key barrier to testing.
Clinical tests lead while predictive tests grow fastest
Why do clinical diagnostic tests lead laboratory value?
Based on service type, the market is categorized into clinical diagnostic testing, reproductive genetic testing, predictive genetic testing and identity genetic testing. Clinical Diagnostic Testing led with a 46.0% share of 2025 value, because hospitals and specialists order tumor profiling and rare-disease panels every day. Predictive Genetic Testing grows fastest at 10.10% a year, as people no longer fear that results will raise life insurance premiums.
How do cancer and inherited conditions split demand?
Based on application, the market is categorized into cancer management, inherited condition assessment, reproductive health and ancestry and identity. Cancer Management led with a 38.0% share of 2025 value, because tumor tests guide drug choice for lung, breast, bowel and blood cancers. Cancer Management also grows fastest at 9.56% a year, as more cancer drugs need a matching biomarker test before they are funded.
Why do Medicare-funded patients account for most tests?
Based on customer type, the market is categorized into Medicare-funded patients, state-funded patients, self-pay patients and institutional contract buyers. Medicare-Funded Patients led with a 41.0% share of 2025 value, because federal items now cover carrier screening, tumor tests and many inherited conditions. Medicare-Funded Patients also grow fastest at 9.60% a year, as new items are added after expert review.
Why is next-generation sequencing taking a larger share?
Based on technology, the market is categorized into NGS sequencing, PCR testing, cytogenetic testing and targeted and biochemical assays. NGS Sequencing led with a 39.0% share of 2025 value, because one run can read many genes, exomes or whole genomes. NGS Sequencing also grows fastest at 10.18% a year, as laboratories replace single-gene tests with broad panels.
| Segment Group | Leading Sub-segment | Share, 2025 | Fastest-growing Sub-segment | CAGR, 2026–2035 |
|---|---|---|---|---|
| By Service Type | Clinical Diagnostic Testing | 46.0% | Predictive Genetic Testing | 10.10% |
| By Application | Cancer Management | 38.0% | Cancer Management | 9.56% |
| By Customer Type | Medicare-Funded Patients | 41.0% | Medicare-Funded Patients | 9.60% |
| By Technology | NGS Sequencing | 39.0% | NGS Sequencing | 10.18% |
Request a Free Sample
Fill in your details and we'll send you a free sample report.
- Sample data tables & charts
- Research methodology
Rebates, cancer profiling and mission funds lift volumes
How does Medicare reimbursement expansion lift test volumes?
Medicare reimbursement expansion lifts test volumes, because federal items now pay for tests that patients once funded themselves. Reproductive carrier screening for cystic fibrosis, spinal muscular atrophy and fragile X syndrome joined the schedule on Nov. 1, 2023, under items 73451 and 73452. About 1 in 20 people carry at least one of these conditions, and about 1 in 160 couples are at risk of having an affected child, according to Australian Clinical Labs. The company offers the test on a bulk-billed basis when patients meet the criteria. Medicare also amended lung cancer items from Nov. 1, 2025, so patients can access testing at any diagnostic stage. As a result, Medicare-funded patients hold 41.0% of 2025 value.
Why do precision oncology needs raise testing demand?
Precision oncology needs raise testing demand, because more cancer drugs are funded only when a tumor carries a matching gene change. Around 170,000 cancer cases were expected to be diagnosed in Australia by the end of 2025, an increase of around 93% over 25 years, according to Cancer Council Australia. Worldwide, there were an estimated 20 million new cancer cases in 2022, according to the World Health Organization. From Nov. 1, 2025, lung cancer items also allow single-gene testing by fluorescence in situ hybridization where laboratories do not yet have sequencing technology. In turn, cancer management grows fastest at 9.56% a year, supported by companion diagnostics linked to funded drugs.
How do mission funding and national coordination support labs?
Mission funding and national coordination support laboratories, because they move genomic tests from research into routine care. The Genomics Health Futures Mission provides AUD 500.1 million for genomic medicine research through the Medical Research Future Fund. Genomics Australia was established on July 1, 2025, to lead national coordination and speed the move from research to clinical service. The federal government is also investing AUD 107.3 million from 2022-23 to 2027-28 to expand newborn bloodspot screening, according to the Department of Health. Health ministers agreed to add sickle cell disease and X-linked adrenoleukodystrophy as target conditions. As a result, state-funded patients keep a large share, while newborn programs add new volume.
How does fertility treatment growth add embryo test volume?
Fertility treatment growth adds embryo test volume, because more couples ask clinics to screen embryos before transfer. Nearly 10,000 preimplantation genetic testing cycles were recorded in Australia and New Zealand in 2023, up 14% in a year, according to UNSW Sydney. More than 109,000 IVF cycles were performed in the two countries that year, up 3.6% from 2022. IVF babies also made up 1 in 16 births in Australia, which shows how central assisted reproduction has become. Half of embryo transfers after genetic testing led to a clinical pregnancy. In turn, reproductive genetic testing remains the second-largest service type, while embryo screening supports demand for sequencing capacity.
Insurance protections, sequencing and lab ties shape demand
How is the shift to legal protection changing predictive tests?
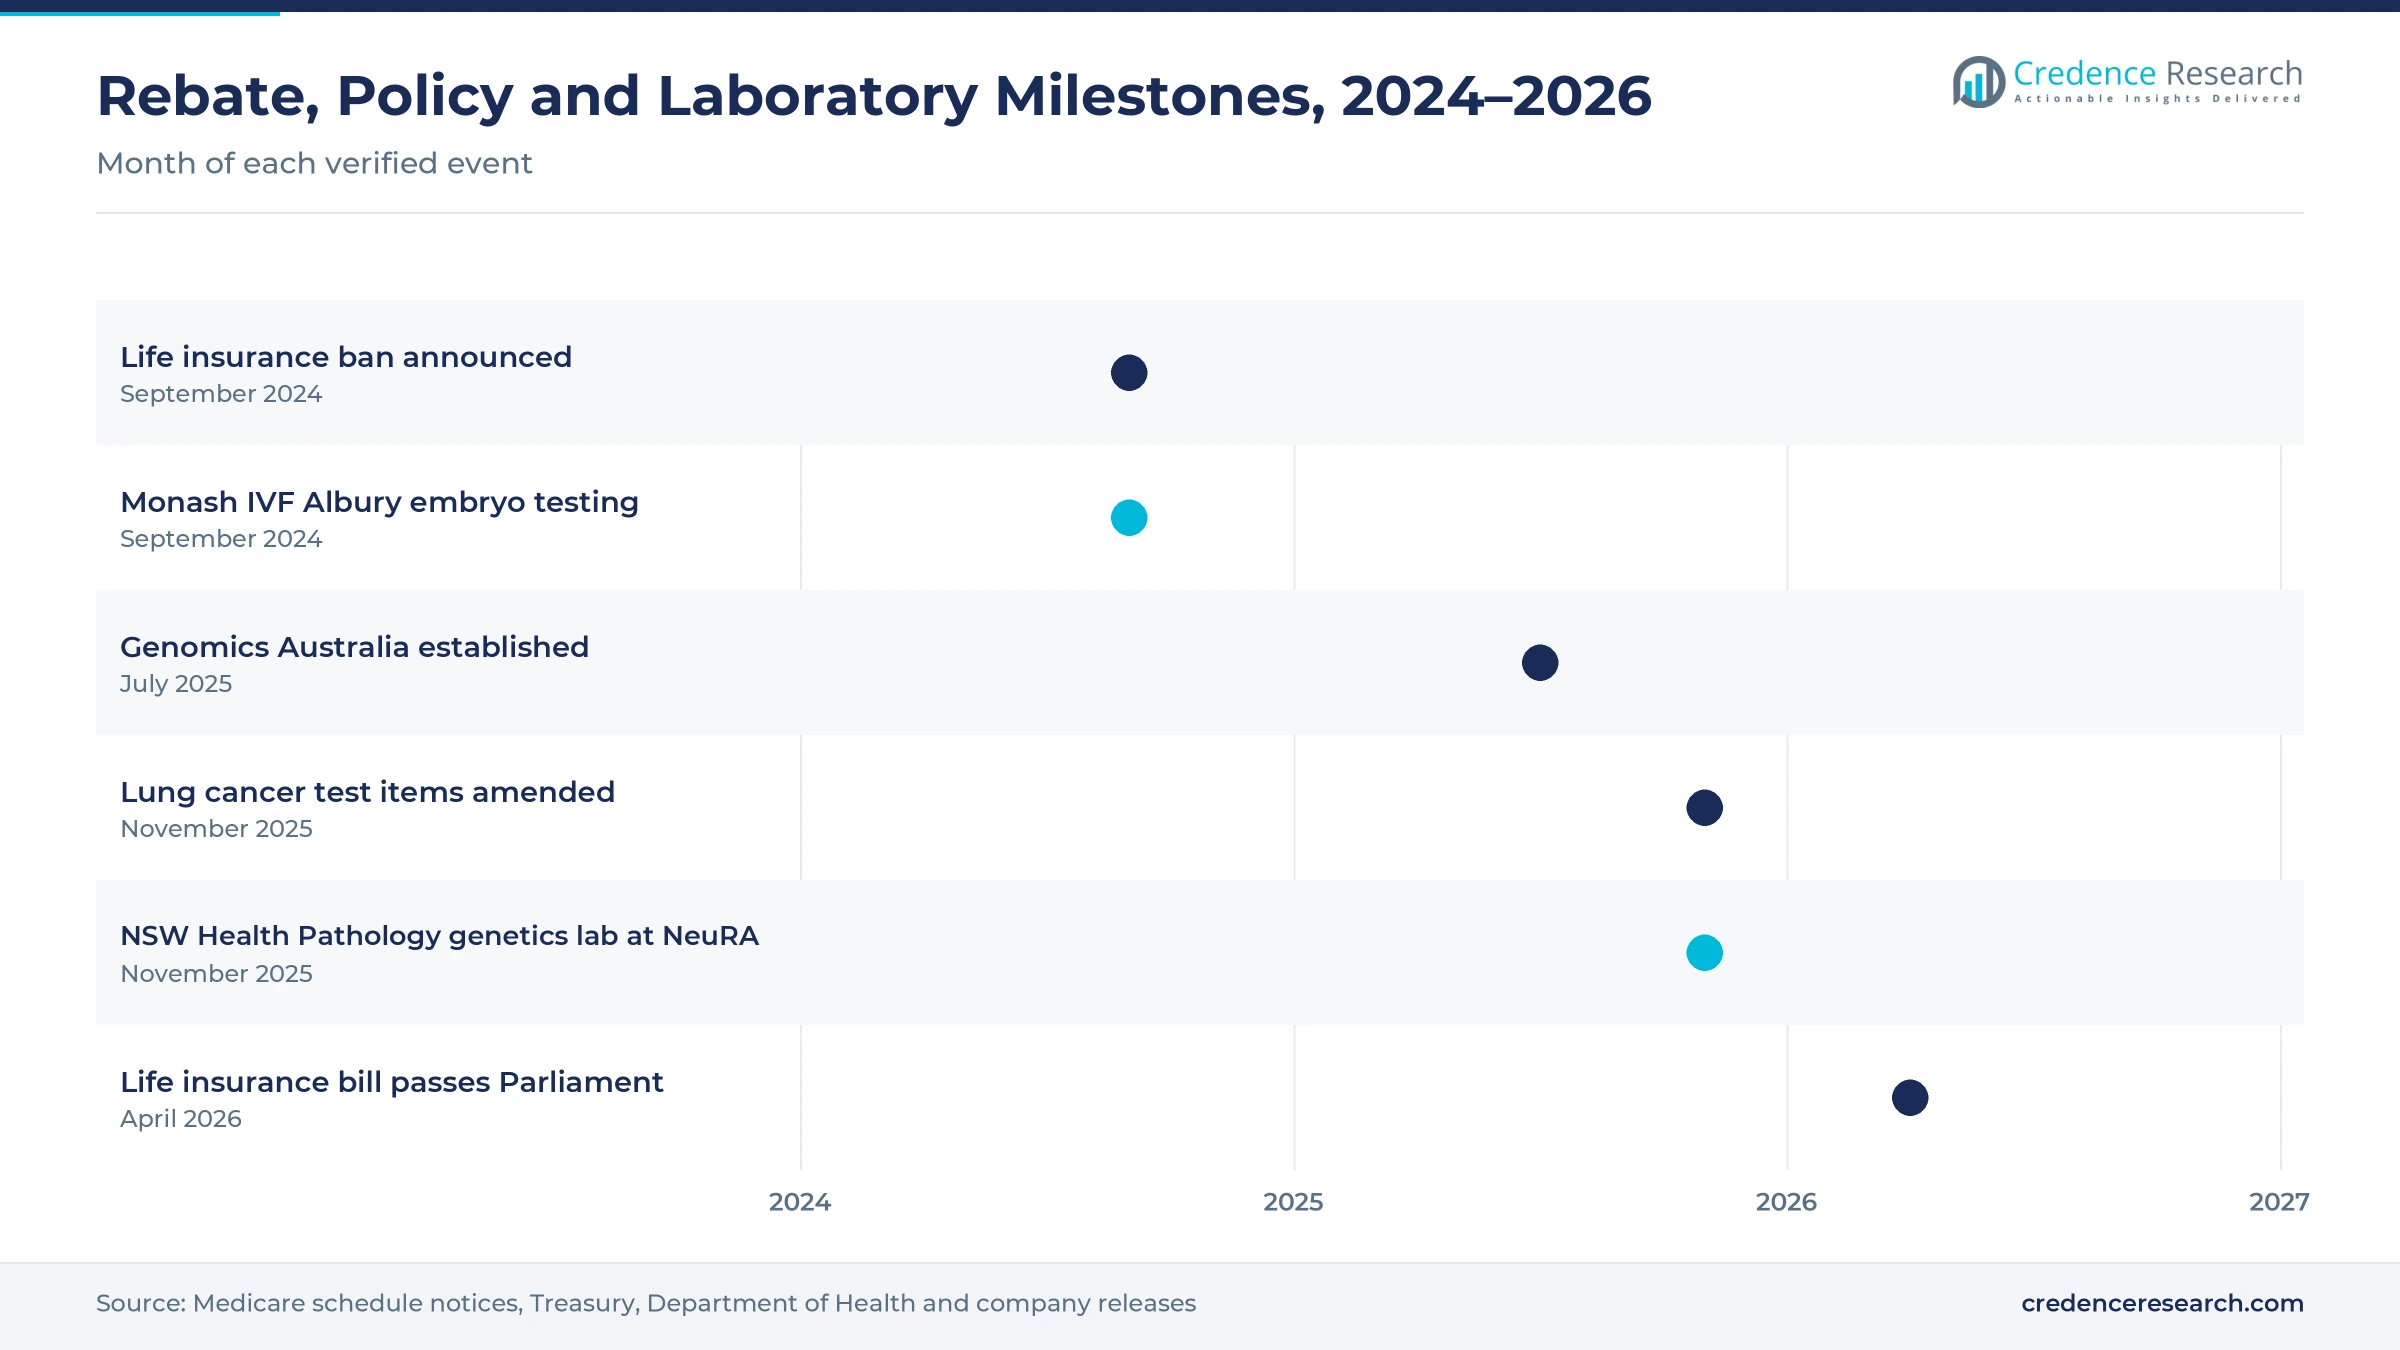
The shift to legal protection is changing predictive tests, because people no longer risk higher premiums when they learn their inherited cancer or heart risks. The federal government announced a total ban on the use of adverse predictive results in life insurance on Sept. 11, 2024, according to the Treasury. More than 1,000 submissions were received in consultation, and 97% supported a total ban. The bill was introduced on Nov. 26, 2025, and passed Parliament on April 1, 2026, with a review every five years. As a result, predictive genetic testing grows fastest at 10.10% a year, as clinicians can recommend cascade testing to relatives with fewer concerns.
Why is the rise of broad sequencing notable for laboratories?
The rise of broad sequencing is notable, because laboratories are replacing single-gene tests with panels, exomes and genomes. Lung cancer items amended from Nov. 1, 2025, still allow single-gene methods only where laboratories lack sequencing, which shows how far the shift has gone. PathWest offers tests from targeted single genes to genome-wide analyses, and it runs germline, somatic, predictive and prenatal work from one department. The PreGen study had sequenced more than 100 genome trios by December 2025, while about one third of families in its exome phase received an answer. In turn, next-generation sequencing grows fastest at 10.18% a year.
Can public and research lab partnerships open new capacity?
Public and research laboratory partnerships can open new capacity, because they share equipment, staff and training. NSW Health Pathology set up a genetics laboratory inside Neuroscience Research Australia in Randwick, as reported on Nov. 16, 2025. The partnership supports the Medical Research Future Fund Prenatal Genomic Testing Program and trains specialist registrars. PathWest also serves public and private patients across Western Australia, accepts requests from other states and overseas, and is accredited under ISO 15189. Western Australia grew its population by 2.1% to 3,096,200 residents in the year to March 2026, the fastest rate of any state. As a result, public laboratories that partner with research institutes can add tests faster than they could alone.
Is there room to widen regional reproductive screening?
Regional reproductive screening has room to grow, because many couples outside capital cities still travel for tests. Monash IVF opened a preimplantation genetic testing service at its Albury laboratory on Sept. 4, 2024, after patients had to travel to Sydney or Melbourne. Patients in New South Wales can claim a AUD 2,000 treatment rebate and AUD 250 for pre-IVF testing. About 90% of carriers of cystic fibrosis, spinal muscular atrophy or fragile X syndrome have no family history, which supports screening every couple. In turn, providers that combine local collection, bulk-billed carrier panels and telehealth counseling can reach couples in regional towns.
Counselor gaps, private fees and data rules test labs
How do genetic counselor shortages slow test uptake?
Genetic counselor shortages slow test uptake, because many complex tests need counseling before and after results. Counseling capacity has not kept pace with the growing number of tests ordered each year. As a result, patients with suspected inherited conditions may wait months for a test. Laboratories respond with mainstreaming, which lets oncologists and obstetricians order tests directly, and with telehealth counseling that reaches regional patients without long trips to capital-city clinics.
Why do private fees limit some test volumes?
Private fees limit some test volumes, because many predictive, expanded carrier and identity tests sit outside Medicare. Patients who do not meet item criteria often pay a private fee, and male fragile X carrier testing is not Medicare-billable. In turn, lower-income families may skip testing that could guide care for relatives. Laboratories respond with clear pricing, payment plans and bulk billing where criteria are met, while patient groups press for new items.
How do data and privacy rules add cost?
Data and privacy rules add cost, because genetic results are sensitive health records that also reveal information about relatives. Laboratories must store raw sequence files for years and control who can see them. As a result, IT, security and storage costs rise with every genome sequenced. Providers respond with secure local data centers, strict consent forms and clear policies on research use, which reassure patients and requesting doctors.
Why does uneven state funding create access gaps?
Uneven state funding creates access gaps, because each state runs its own public genetics and pathology services. Test menus, waiting times and eligibility rules differ between New South Wales, Victoria, Queensland and the smaller states. In turn, patients in some areas wait longer for the same test. National coordination through Genomics Australia aims to align standards and test lists, which should reduce gaps between states over time.
New South Wales and ACT lead as western states grow fastest
| Region | Value, 2025 (USD million) | Share, 2025 | CAGR, 2026–2035 |
|---|---|---|---|
| New South Wales and ACT | 121.4 | 36.3% | 9.02% |
| Victoria and Tasmania | 88.0 | 26.3% | 9.22% |
| Queensland | 67.9 | 20.3% | 9.37% |
| Western and Central Australia | 57.2 | 17.1% | 9.57% |
Why do New South Wales and ACT hold the top share?
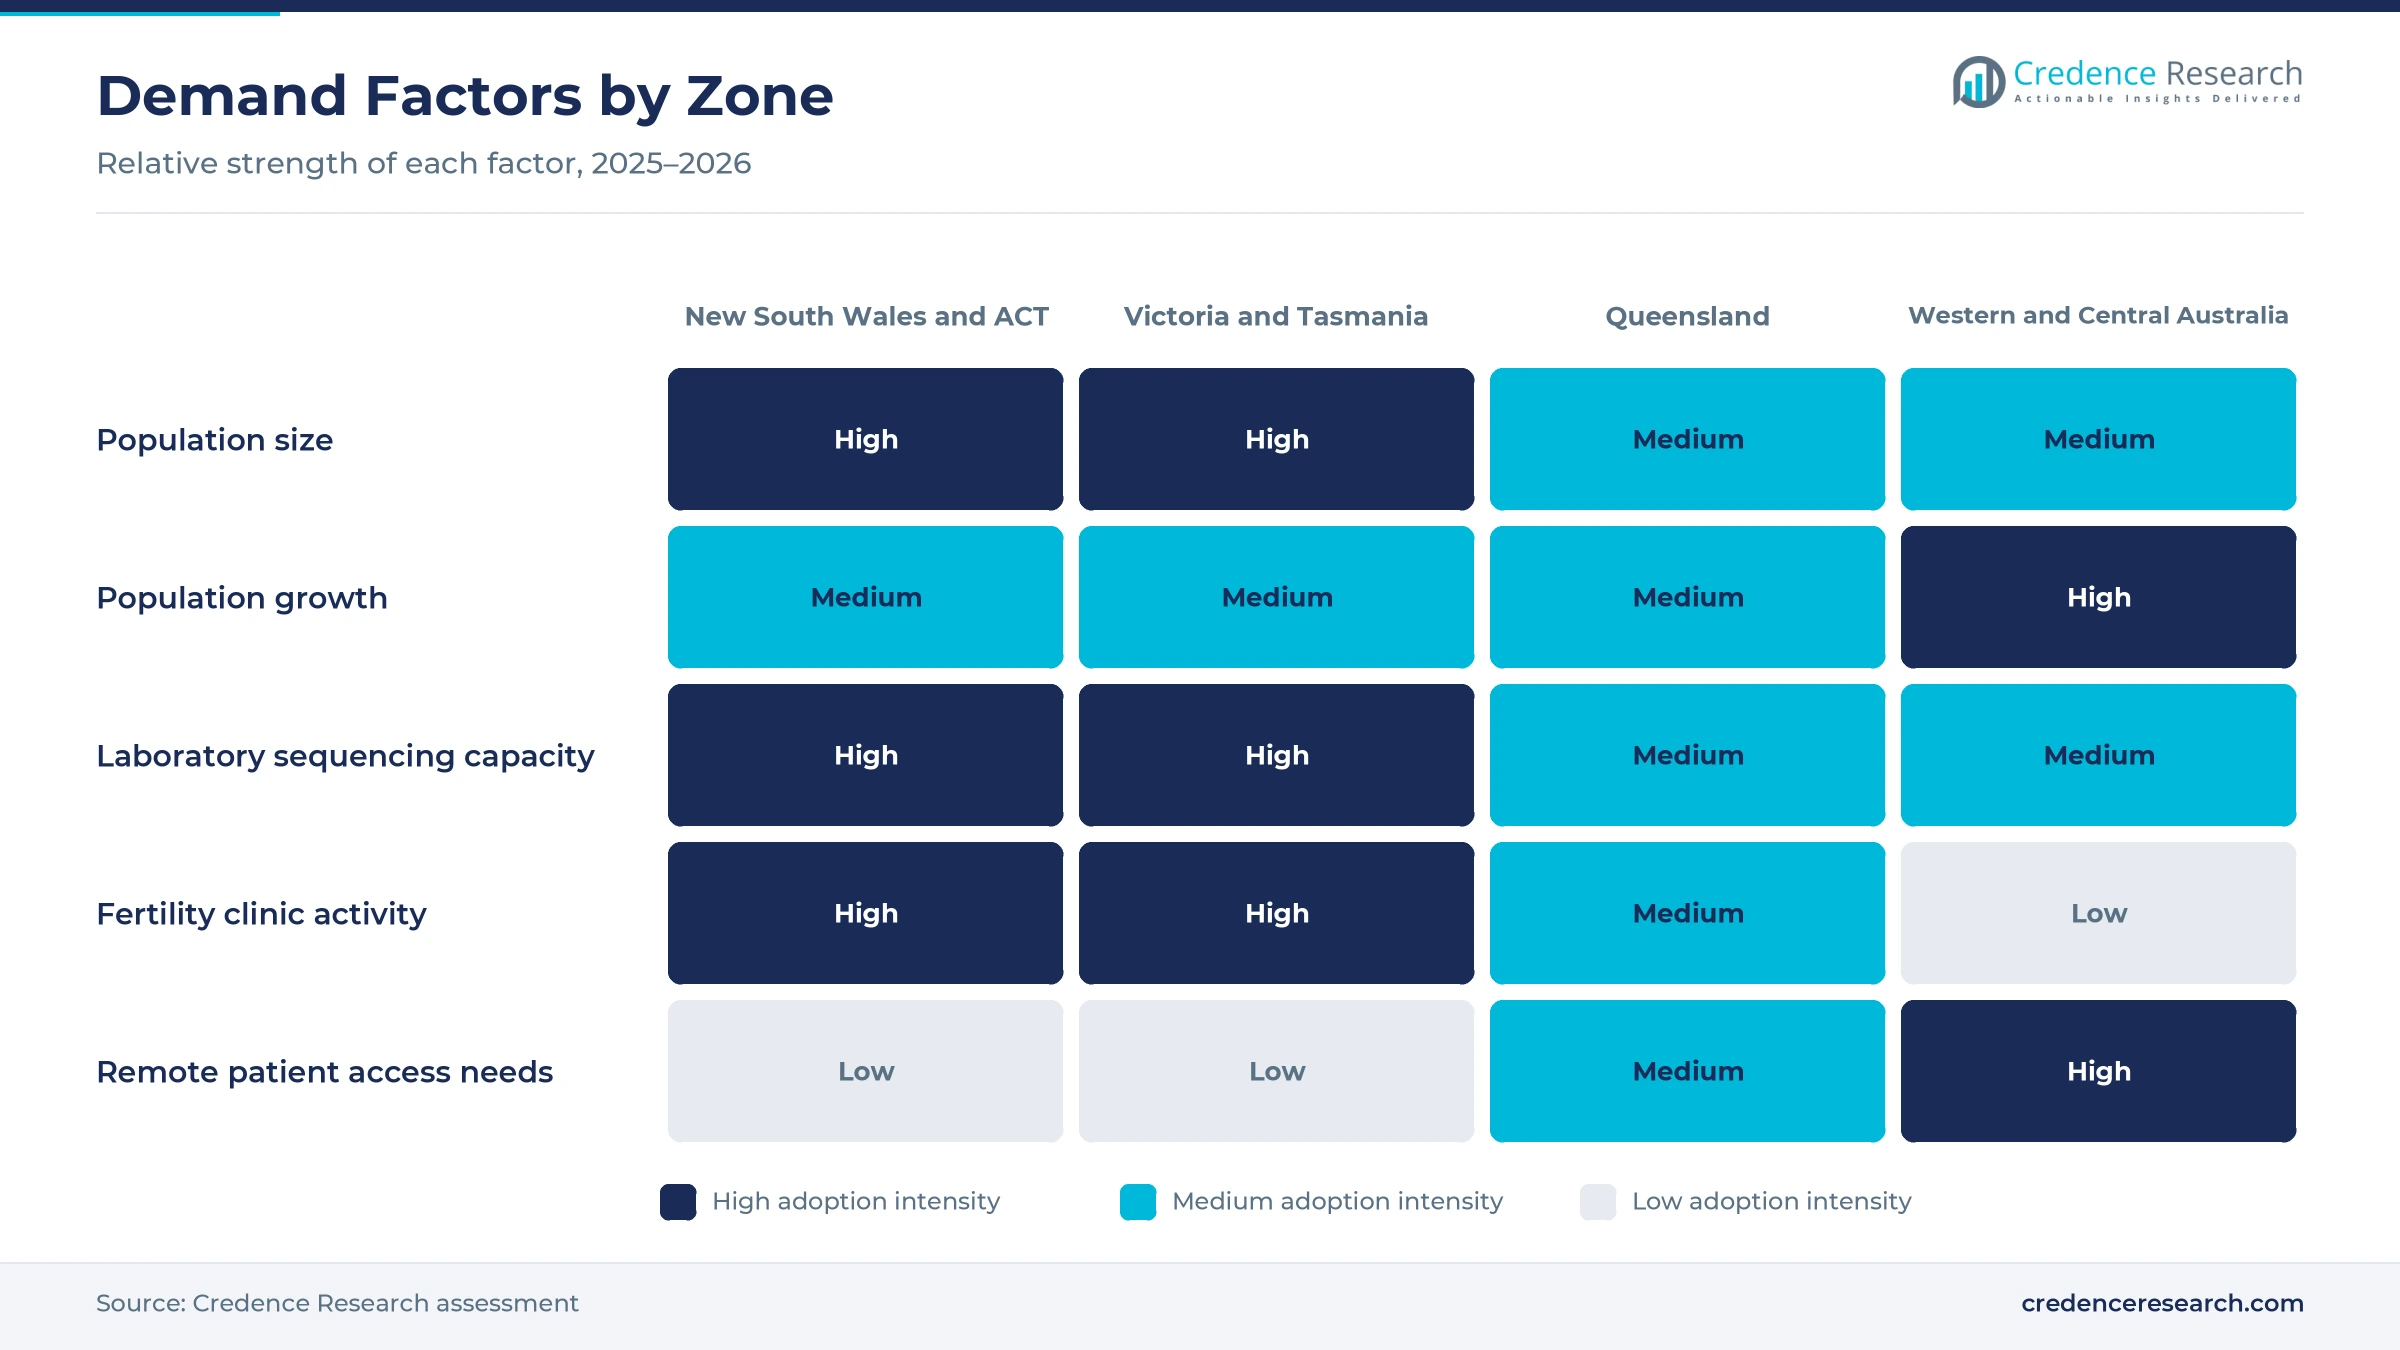
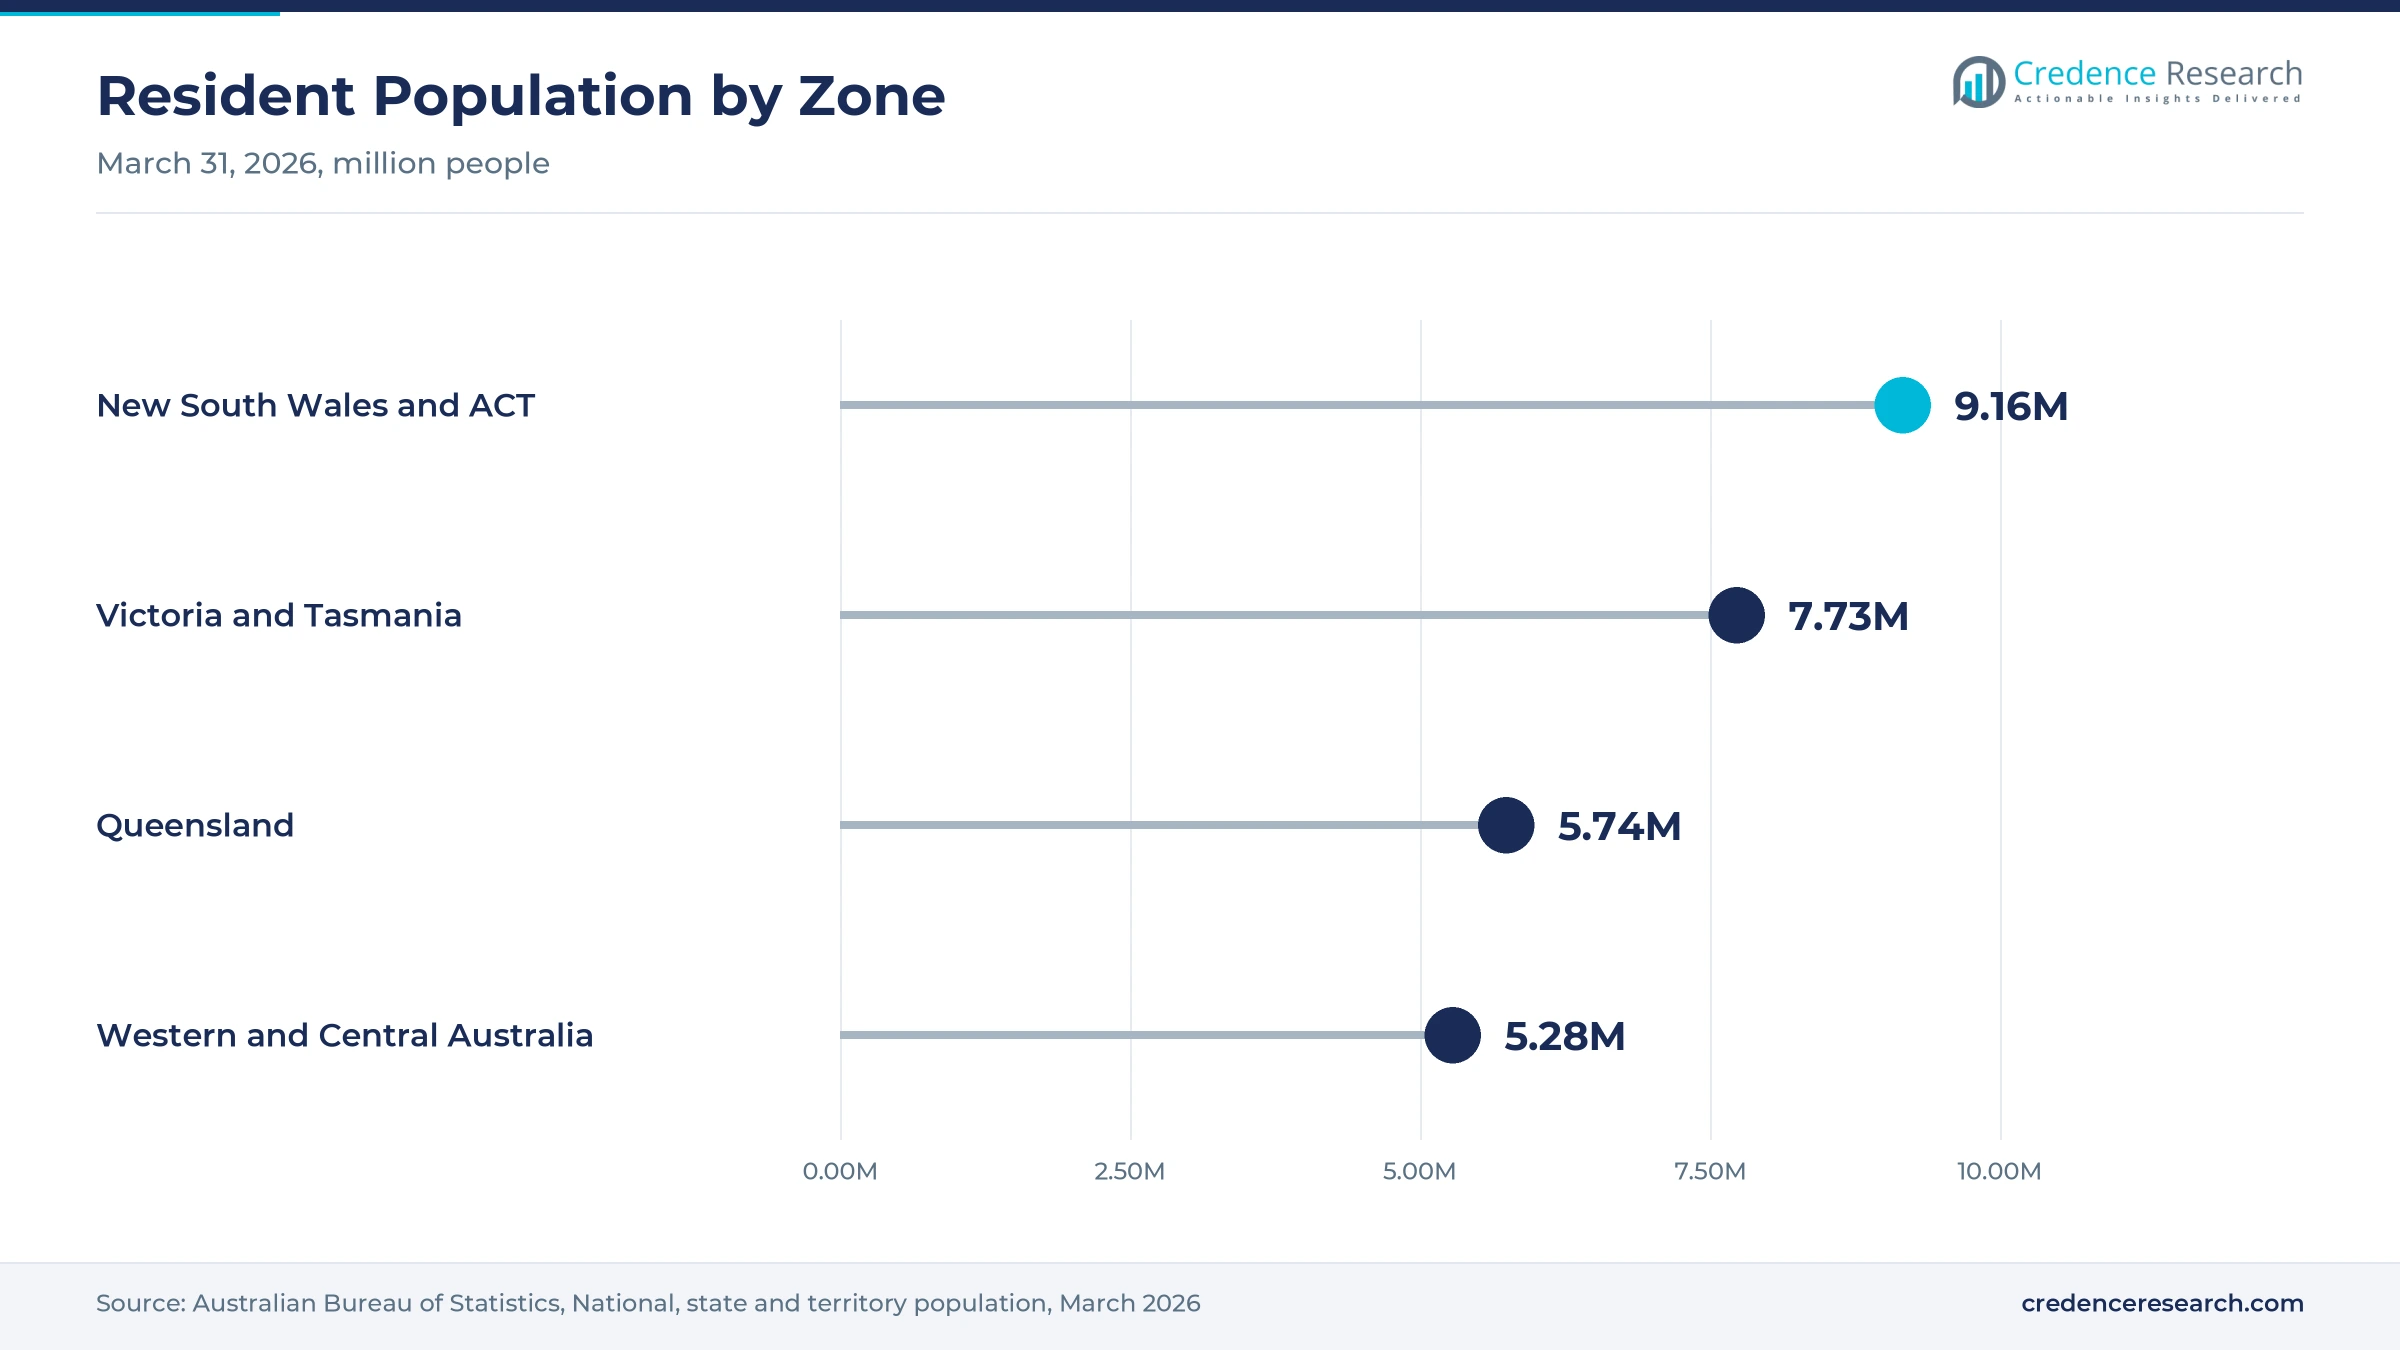
New South Wales and ACT held a 36.3% share of 2025 value and grow at 9.02% a year, because the zone is home to more than 9.1 million people. New South Wales counted 8,670,100 residents in March 2026, while the Australian Capital Territory counted 489,700. NSW Health Pathology also runs genetics laboratories in Randwick and other Sydney hospitals. As a result, the zone leads in cancer, reproductive and rare-disease testing.
How do Victoria and Tasmania support demand?
Victoria and Tasmania held a 26.3% share of 2025 value and grow at 9.22% a year, because Melbourne hosts major hospital, research and fertility networks. Victoria counted 7,154,200 residents in March 2026 and grew by 1.6% in a year, while Tasmania counted 580,700. In turn, the zone remains the second-largest market for clinical and reproductive tests, supported by children's hospital genetics services and large fertility clinic networks in Melbourne.
What drives demand in Queensland?
Queensland held a 20.3% share of 2025 value and grows at 9.37% a year, because population growth in the south-east keeps adding patients. The state counted 5,739,500 residents in March 2026, up 1.6% in a year. As a result, private pathology groups and fertility clinics in Brisbane and the Gold Coast add collection centers and testing capacity. Regional centers along the coast also add demand for carrier screening and cancer tests that are collected locally and analyzed in Brisbane.
Why is Western and Central Australia growing fastest?
Western and Central Australia held a 17.1% share of 2025 value and grows fastest at 9.57% a year, because Western Australia has the fastest population growth. Western Australia grew by 2.1% to 3,096,200 residents in the year to March 2026, while South Australia counted 1,916,800. In turn, PathWest serves public and private patients across the state, including remote towns.
Rebate changes, lab launches and new law, 2024–2026
| Development | Status and market relevance |
|---|---|
| In September 2024, the federal government announced a total ban on the use of adverse predictive genetic results in life insurance. | More than 1,000 submissions, with 97% support for a total ban |
| In September 2024, Monash IVF opened a preimplantation genetic testing service at its Albury laboratory. | Patients no longer need to travel to Sydney or Melbourne |
| In July 2025, Genomics Australia was established to lead national coordination of health genomics. | Speeds the move from research to clinical services |
| In November 2025, Medicare amended lung cancer testing items so patients can access testing at any diagnostic stage. | Allows single-gene methods where laboratories lack sequencing |
| In April 2026, Parliament passed the bill that bans life insurers from using adverse predictive genetic results. | Includes a statutory review every five years |
Sequencing, PCR and cytogenetics split the lab workload
- Next-generation sequencing reads many genes, exomes or whole genomes in a single run, which supports cancer panels, rare-disease diagnosis and broad carrier screening.
- PCR testing detects known variants quickly and at low cost, which suits targeted carrier tests, identity work and confirmation of sequencing results.
- Cytogenetic testing examines chromosomes for large changes, which remains important for prenatal diagnosis, blood cancers and developmental delay.
- Karyomapping compares embryo DNA with parental samples, which lets fertility laboratories select embryos free of a known inherited condition.
Need a Custom Version of This Report?
Tailor the scope, geography, or segments to your exact requirements.
- Custom geography or segment scope
- Direct access to our analyst team
Public labs, private pathology and IVF groups compete
Competition is split between state public pathology services, private pathology groups and fertility clinic laboratories. NSW Health Pathology, PathWest and SA Pathology run statewide genetics services for public hospitals. Australian Clinical Labs offers bulk-billed carrier screening under Medicare items for eligible patients. Monash IVF Group runs its own genetics laboratory for embryo testing and opened an Albury service in September 2024. Private pathology groups compete on collection networks, turnaround time, test menus and bulk billing. Because Medicare items set fees for most clinical tests, laboratories win volume through doctor relationships, accreditation and reporting quality rather than price alone. Fertility groups such as Virtus Health and Monash IVF Group also compete for embryo testing, while public services handle most complex rare-disease cases referred by hospital specialists.
Which laboratories lead DNA testing in Australia?
| Company | Type | Role in the market |
|---|---|---|
| NSW Health Pathology | State public pathology | Set up a genetics laboratory at Neuroscience Research Australia |
| PathWest | State public pathology | Runs germline, somatic, predictive and prenatal tests across Western Australia |
| Australian Clinical Labs | Private pathology group | Offers bulk-billed carrier screening under Medicare items 73451 and 73452 |
| Monash IVF Group | Fertility clinic group | Opened a preimplantation testing service in Albury in September 2024 |
Credence Research view on national DNA diagnostics
Credence Research's view is that Australian demand for genetic testing will grow strongly because Medicare items, national coordination and legal protections are widening access at the same time. Clinical diagnostic tests remain the largest value pool, while predictive tests add the fastest growth after the life insurance ban. Broad sequencing will keep replacing single-gene methods in hospital and private laboratories. Laboratories that combine accredited sequencing, genetic counseling and bulk billing should gain share, while counselor shortages remain the main brake on growth.
How the national DNA diagnostics estimate was built
The report uses 2025 as the base year on a calendar basis, and market values come from the Credence Research model. That model combines Medicare item notices, federal and state program funding, national population statistics, assisted reproduction registry data and laboratory and company announcements. Segment splits and zone growth rates are Credence Research estimates, while zone shares follow the client-defined split. Sources used are official statistics, government publications, university reports and company releases, and no interviews or surveys were used.
Sequencing and predictive tests carry growth to 2035
Genetic testing value is expected to reach USD 824.3 million by 2035, a 9.24% CAGR during 2026–2035, as sequencing replaces older methods and more tests gain Medicare funding. Growth should stay strongest through 2030 while predictive tests expand after the insurance ban and cancer drug approvals add biomarker tests. After that, routine genome sequencing in hospitals will carry more of the value. Faster growth in the genetic counseling workforce would lift volumes, while slow item reviews would delay new tests.
Frequently Asked Questions
How big is the Australia genetic testing market?
Which service type leads Australian laboratory value?
Which region leads the Australian market?
Which carrier screening tests does Medicare fund?
How did the life insurance rules change?
Which technology is growing fastest?
Who are the leading companies in the Australian market?
What are the main challenges for laboratories?
Table of Content
Chapter 1 Market Segmentation
- 1.1 Segmentation Framework
- 1.1.1 Product and Service Classification
- 1.1.2 Application and End-Use Classification
- 1.1.3 Technology and Solution Classification
- 1.1.4 Customer and Distribution Channel Classification
- 1.1.5 Geographic Segmentation
- 1.1.6 Market Segment Definitions and Boundaries
- 1.2 By Service Type
- 1.2.1 Clinical Diagnostic Testing
- 1.2.2 Reproductive Genetic Testing
- 1.2.3 Predictive Genetic Testing
- 1.2.4 Identity Genetic Testing
- 1.3 By Application
- 1.3.1 Cancer Management
- 1.3.2 Inherited Condition Assessment
- 1.3.3 Reproductive Health
- 1.3.4 Ancestry and Identity
- 1.4 By Customer Type
- 1.4.1 Medicare-Funded Patients
- 1.4.2 State-Funded Patients
- 1.4.3 Self-Pay Patients
- 1.4.4 Institutional Contract Buyers
- 1.5 By Technology
- 1.5.1 NGS Sequencing
- 1.5.2 PCR Testing
- 1.5.3 Cytogenetic Testing
- 1.5.4 Targeted and Biochemical Assays
Chapter 2 Introduction
- 2.1 Report Objectives and Scope
- 2.2 Product Definition and Industry Terminology
- 2.3 Market Inclusions and Exclusions
- 2.4 Research Process
- 2.4.1 Primary Research and Expert Interviews
- 2.4.2 Secondary Research and Source Review
- 2.4.3 Top-Down and Bottom-Up Estimation
- 2.4.4 Data Triangulation and Verification
- 2.5 Market Size Measurement Basis
- 2.5.1 2025: USD 334.5 million → 2035: USD 824.3 million
- 2.6 Historical and Forecast Reference Periods
- 2.6.1 Historical Period: 2018-2025
- 2.6.2 Base Year: 2025
- 2.6.3 Forecast Period: 2025-2035
- 2.7 Research Assumptions and Limitations
Chapter 3 Executive Summary
- 3.1 Market Snapshot and Key Findings
- 3.2 Base-Year Market Size, 2025
- 3.3 Forecast Market Size, 2035
- 3.4 Revenue and Volume Growth Outlook
- 3.5 Key Demand and Supply Indicators
- 3.6 Leading Market Segments
- 3.7 Fastest-Growing Market Opportunities
- 3.8 Regional Performance Highlights
- 3.9 Technology and Industry Transformation
- 3.10 Competitive Landscape Summary
- 3.11 Analyst View and Strategic Implications
Chapter 4 Australia Genetic Testing Market Trends and Developments
- 4.1 Historical Industry Development, 2018-2025
- 4.2 Recent Market Trends and Developments
- 4.3 Demand and Customer Behavior Trends
- 4.4 Technology and Product Innovation
- 4.5 Artificial Intelligence, Automation and Digitalization
- 4.6 Local Manufacturing and Supply Chain Realignment
- 4.7 Industry Partnerships, Mergers and Acquisitions
- 4.8 Sustainability and Circular Economy Developments
- 4.9 Government and Private Sector Investment Trends
- 4.10 Emerging Business Models and Commercialization
- 4.11 Industry Developments and Announcements
Chapter 5 Australia Genetic Testing Market Production, Supply and Demand Analysis
- 5.1 Demand Trend and Consumption Analysis, 2018-2025
- 5.2 Demand Forecast, 2025-2035
- 5.3 Production and Output Trend, 2018-2025
- 5.4 Production and Output Forecast, 2025-2035
- 5.5 Installed Capacity and Capacity Utilization
- 5.6 Company-Wise Production Plants and Statistics
- 5.6.1 Installed Production Capacity
- 5.6.2 Actual Production
- 5.6.3 Planned Capacity and Expansion Targets
- 5.7 Supply Chain Structure and Procurement Trends
- 5.8 Supply-Demand Gap and Bottlenecks
- 5.9 Import Dependence and Sourcing Structure
- 5.10 Contract Manufacturing and Outsourcing
- 5.11 Regional Supply and Demand Concentration
Chapter 6 Australia Genetic Testing Market Pricing Analysis
- 6.1 Pricing Structure and Measurement
- 6.2 Historical Pricing Trends, 2018-2025
- 6.3 Pricing Outlook, 2025-2035
- 6.4 Average Selling Price and Unit Economics
- 6.5 Pricing by Product and Market Segment
- 6.6 Geographic Pricing Differences
- 6.7 Key Input, Energy, Labor and Logistics Costs
- 6.8 Contract Pricing and Purchasing Models
- 6.9 Pricing Sensitivity and Competitive Positioning
- 6.10 Price, Margin and Profitability Implications
Chapter 7 Australia Genetic Testing Market Dynamics
- 7.1 Market Growth Drivers
- 7.1.1 Demand-Side Drivers
- 7.1.2 Technology and Innovation Drivers
- 7.1.3 Infrastructure and Investment Drivers
- 7.1.4 Regulatory and Policy Drivers
- 7.2 Market Restraints
- 7.2.1 Cost and Affordability Constraints
- 7.2.2 Technology and Adoption Barriers
- 7.2.3 Supply Chain and Operational Constraints
- 7.3 Market Challenges
- 7.3.1 Competitive Pressure and Margin Erosion
- 7.3.2 Skills, Infrastructure and Implementation Gaps
- 7.4 Emerging Market Opportunities
- 7.5 Market Dynamics Impact and Time-Horizon Assessment
Chapter 8 Australia Genetic Testing Value Chain Analysis
- 8.1 Industry Value Chain Overview
- 8.2 Upstream Suppliers and Critical Inputs
- 8.3 Technology and Component Providers
- 8.4 Manufacturing or Service Delivery
- 8.5 Distribution, Channel Partners and Integrators
- 8.6 Downstream Applications and End Users
- 8.7 Value Addition and Profit Pools
- 8.8 Vertical Integration and Outsourcing
- 8.9 Supplier Concentration and Risk
- 8.10 Supply Chain Localization and Resilience
Chapter 9 Australia Genetic Testing Market Regulations and Policies
- 9.1 Relevant Laws, Standards and Compliance Frameworks
- 9.2 Product, Service, Safety and Quality Requirements
- 9.3 Government Policies, Incentives and Subsidies
- 9.4 Imports, Exports and Trade Barriers
- 9.5 Public Procurement and Local Content Requirements
- 9.6 Environmental and Sustainability Compliance
- 9.7 Upcoming Policy Changes and Market Implications
Chapter 10 Australia Genetic Testing Market Hotspots and Opportunities
- 10.1 Market Opportunity Mapping and Growth Hotspots
- 10.2 High-Growth Applications and Customer Groups
- 10.3 Underserved Markets and White-Space Opportunities
- 10.4 Emerging Technology and Product Opportunities
- 10.5 New Capacity and Investment Hotspots
- 10.6 Market Entry and Expansion Opportunities
- 10.7 Distribution and Partnership Opportunities
- 10.8 Near-Term and Long-Term Commercial Potential
- 10.9 Opportunity Attractiveness and Execution Risks
Chapter 11 Australia Genetic Testing Market Outlook, 2025-2035
- 11.1 Market Size and Analysis
- 11.1.1 Revenue (Market Measurement: 2025: USD 334.5 million → 2035: USD 824.3 million)
- 11.1.2 Market Volume and Quantity Sold
- 11.1.3 Historical Market Size, 2018-2025
- 11.1.4 Base-Year Market Size, 2025
- 11.2 Market Forecast, 2025-2035
- 11.2.1 Revenue Forecast to 2035
- 11.2.2 Volume Forecast to 2035
- 11.2.3 CAGR and Year-on-Year Growth
- 11.2.4 Incremental Revenue Opportunity
- 11.3 Forecast Assumptions and Scenario Analysis
- 11.3.1 Base-Case Forecast
- 11.3.2 Optimistic and Conservative Scenarios
- 11.3.3 Technology, Pricing and Policy Sensitivities
- 11.4 Market Attractiveness and Growth Outlook
Chapter 12 Australia Genetic Testing Market Segmentation and Outlook
- 12.1 Segmentation Summary and Market Shares, 2025
- 12.2 Largest and Fastest-Growing Segments
- 12.3 By Service Type - Market Size and Forecast, 2025-2035
- 12.3.1 Segment Definition and Scope
- 12.3.2 Historical Market Size, 2018-2025
- 12.3.3 Revenue Forecast, 2025-2035
- 12.3.4 Volume Forecast, 2025-2035
- 12.3.5 Base-Year Market Share, 2025
- 12.3.6 Segment CAGR and Growth Drivers
- 12.3.7 Subsegment Market Size and Forecast
- 12.3.7.1 Clinical Diagnostic Testing
- 12.3.7.2 Reproductive Genetic Testing
- 12.3.7.3 Predictive Genetic Testing
- 12.3.7.4 Identity Genetic Testing
- 12.3.8 Subsegment Pricing and Adoption Trends
- 12.3.9 Leading Suppliers and Competition
- 12.3.10 Regional Demand and Opportunities
- 12.4 By Application - Market Size and Forecast, 2025-2035
- 12.4.1 Segment Definition and Scope
- 12.4.2 Historical Market Size, 2018-2025
- 12.4.3 Revenue Forecast, 2025-2035
- 12.4.4 Volume Forecast, 2025-2035
- 12.4.5 Base-Year Market Share, 2025
- 12.4.6 Segment CAGR and Growth Drivers
- 12.4.7 Subsegment Market Size and Forecast
- 12.4.7.1 Cancer Management
- 12.4.7.2 Inherited Condition Assessment
- 12.4.7.3 Reproductive Health
- 12.4.7.4 Ancestry and Identity
- 12.4.8 Subsegment Pricing and Adoption Trends
- 12.4.9 Leading Suppliers and Competition
- 12.4.10 Regional Demand and Opportunities
- 12.5 By Customer Type - Market Size and Forecast, 2025-2035
- 12.5.1 Segment Definition and Scope
- 12.5.2 Historical Market Size, 2018-2025
- 12.5.3 Revenue Forecast, 2025-2035
- 12.5.4 Volume Forecast, 2025-2035
- 12.5.5 Base-Year Market Share, 2025
- 12.5.6 Segment CAGR and Growth Drivers
- 12.5.7 Subsegment Market Size and Forecast
- 12.5.7.1 Medicare-Funded Patients
- 12.5.7.2 State-Funded Patients
- 12.5.7.3 Self-Pay Patients
- 12.5.7.4 Institutional Contract Buyers
- 12.5.8 Subsegment Pricing and Adoption Trends
- 12.5.9 Leading Suppliers and Competition
- 12.5.10 Regional Demand and Opportunities
- 12.6 By Technology - Market Size and Forecast, 2025-2035
- 12.6.1 Segment Definition and Scope
- 12.6.2 Historical Market Size, 2018-2025
- 12.6.3 Revenue Forecast, 2025-2035
- 12.6.4 Volume Forecast, 2025-2035
- 12.6.5 Base-Year Market Share, 2025
- 12.6.6 Segment CAGR and Growth Drivers
- 12.6.7 Subsegment Market Size and Forecast
- 12.6.7.1 NGS Sequencing
- 12.6.7.2 PCR Testing
- 12.6.7.3 Cytogenetic Testing
- 12.6.7.4 Targeted and Biochemical Assays
- 12.6.8 Subsegment Pricing and Adoption Trends
- 12.6.9 Leading Suppliers and Competition
- 12.6.10 Regional Demand and Opportunities
- 12.7 Segment Growth Comparison
- 12.8 Segment Attractiveness and Priority Matrix
Chapter 13 Australia Genetic Testing End-Use and Application Market Outlook
- 13.1 End-Use Industry and Customer Demand Structure
- 13.2 Leading Applications and Customer Groups
- 13.3 End-Use Market Size, Share and Forecast
- 13.4 Major End-Use Industry Deep Dives
- 13.4.1 Customer Requirements and Use Cases
- 13.4.2 Demand and Replacement Cycles
- 13.4.3 Technical and Regulatory Considerations
- 13.4.4 Purchasing and Procurement Models
- 13.4.5 Leading Vendors and Distribution Channels
- 13.4.6 Forecast and Commercial Opportunities
- 13.5 Emerging Applications and Cross-Segment Demand
- 13.6 End-Use Industry Investment Priorities
Chapter 14 Australia Genetic Testing Geographic Market Outlook, 2025-2035
- 14.1 Domestic Market Distribution and Demand Clusters
- 14.2 State- or Province-Wise Market Size and Forecast, 2025-2035
- 14.3 City and Metropolitan Market Outlook
- 14.4 Industrial, Manufacturing and Commercial Clusters
- 14.5 Geographic Concentration of Key End Users
- 14.6 Local Pricing and Purchasing Differences
- 14.7 Domestic Production Facilities and Capacity Map
- 14.8 Local Infrastructure and Project Pipeline
- 14.9 State-Level Policy and Incentive Differences
- 14.10 Subnational Investment Hotspots and Opportunities
- 14.11 Distribution and Logistics Networks
- 14.12 Domestic Competitive Footprint
Chapter 15 Australia Genetic Testing Technology, Innovation and Sustainability Outlook
- 15.1 Technology Landscape and Maturity
- 15.2 Product, Process and Service Innovation
- 15.3 AI, Automation and Digital Tools in the Industry
- 15.4 Technology Adoption and Performance Benchmarking
- 15.5 Innovation Pipeline and R&D Investment
- 15.6 Patent and Intellectual Property Trends
- 15.7 Energy Efficiency and Resource Management
- 15.8 Sustainability, Recycling and Circularity
- 15.9 Technology Roadmap, 2025-2035
- 15.10 Risks of Obsolescence and Technology Substitution
Chapter 16 Australia Genetic Testing Market Key Strategic Imperatives
- 16.1 Growth and Market Entry Priorities
- 16.2 High-Return Products and Segments
- 16.3 Pricing, Profitability and Cost Optimization
- 16.4 Technology Investment and Product Differentiation
- 16.5 Supply Chain Localization and Resilience
- 16.6 Distribution and Customer Acquisition
- 16.7 Partnership, Acquisition and Capacity Strategy
- 16.8 Regional Expansion Priorities
- 16.9 Short-, Medium- and Long-Term Actions
Chapter 17 Competition Outlook
- 17.1 Industry Competition Characteristics
- 17.2 Market Structure and Concentration
- 17.3 Market Share and Competitive Positioning, 2025
- 17.4 Company-Wise Revenue and Product Benchmarking
- 17.5 Production and Service Capacity Benchmarking
- 17.6 Technology, Pricing and Differentiation
- 17.7 Regional Footprint and Distribution Strength
- 17.8 Mergers, Acquisitions and Strategic Alliances
- 17.9 New Entrants and Competitive Threats
- 17.10 Porter's Five Forces and Industry Attractiveness
- 17.11 Competitive Outlook, 2025-2035
Chapter 18 Company Profiles
- 18.1 Company Coverage and Selection Criteria
- 18.2 Sonic Healthcare
- 18.2.1 Business Description
- 18.2.2 Company Ownership and Geographic Presence
- 18.2.3 Product and Service Portfolio
- 18.2.4 Manufacturing and Operating Footprint
- 18.2.5 Production Capacity and Expansion Plans
- 18.2.6 Financial Performance and Investment
- 18.2.7 Market Share and Competitive Position
- 18.2.8 Technology and Innovation Capabilities
- 18.2.9 Strategic Alliances or Partnerships
- 18.2.10 Recent Developments
- 18.2.11 Growth Strategy and Outlook
- 18.3 Healius
- 18.4 Victorian Clinical Genetics Services
- 18.5 Australian Clinical Labs
- 18.6 Genomics For Life
- 18.7 Virtus Health
- 18.8 Monash IVF Group
- 18.9 NSW Health Pathology
- 18.10 PathWest
- 18.11 SA Pathology
- 18.12 Other Relevant Market Participants
Note: Every listed company is profiled on the structure shown under the first company. The company list is preliminary and may change based on research findings, market developments, data availability and client requirements.
Chapter 19 Disclaimer
- 19.1 Research and Forecast Disclaimer
- 19.2 Data Source and Estimation Limitations
Note: The depth of individual sections depends on data availability for this market. Volume, capacity, trade and other unit-based metrics are included where applicable.

