
Market Overview
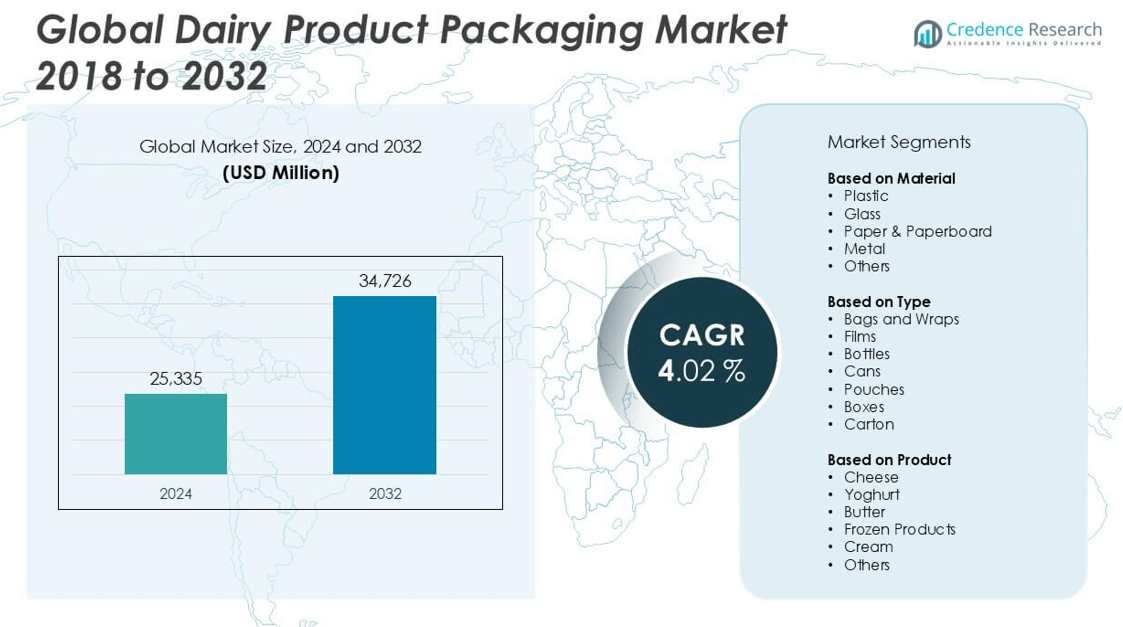
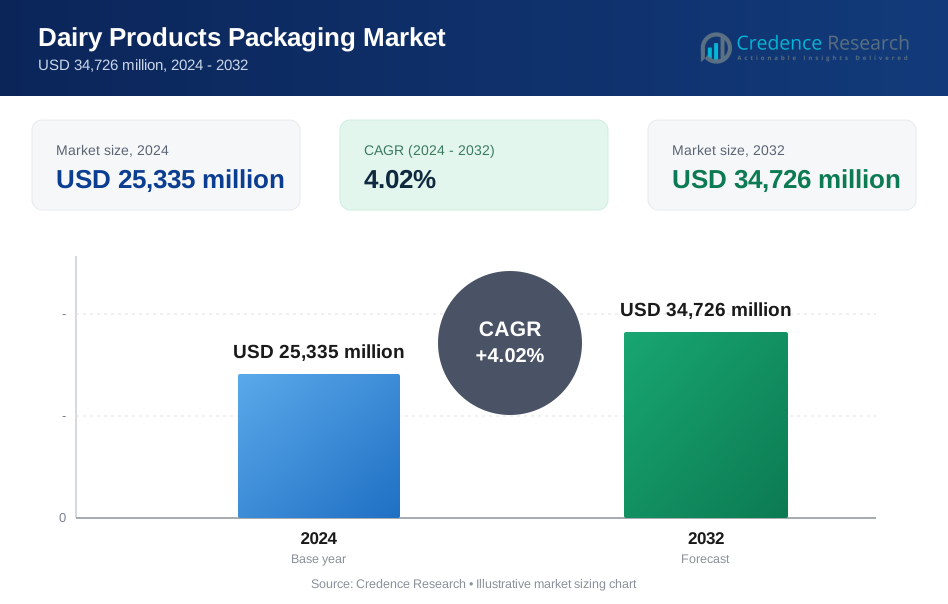
The Dairy Product Packaging market size was valued at USD 25,335 million in 2024 and is anticipated to reach USD 34,726 million by 2032, at a CAGR of 4.02% during the forecast period.
| REPORT ATTRIBUTE | DETAILS |
|---|---|
| Historical Period | 2020-2023 |
| Base Year | 2024 |
| Forecast Period | 2025-2032 |
| Dairy Product Packaging Market Size 2024 | USD 25,335 million |
| Dairy Product Packaging Market, CAGR | 4.02% |
| Dairy Product Packaging Market Size 2032 | USD 34,726 million |
The dairy product packaging market is dominated by key players such as Tetra Pak, Huhtamaki Group, Bemis Company Inc., Sealed Air Corporation, WestRock Company, Airlite Plastics, Ahlstrom, Nampak Ltd., and ELOPAK. These companies lead through innovation in sustainable materials, advanced packaging technologies, and strong global distribution. Tetra Pak and Huhtamaki hold prominent positions due to their extensive product portfolios and emphasis on eco-friendly packaging. Regionally, Asia Pacific emerged as the leading market in 2024, accounting for approximately 32% of the global share, driven by rising dairy consumption, urbanization, and growing investment in cold chain infrastructure.
Market Insights
- The Dairy Product Packaging market was valued at USD 25,335 million in 2024 and is expected to reach USD 34,726 million by 2032, growing at a CAGR of 4.02% during the forecast period.
- Rising global dairy consumption, expansion of cold chain logistics, and increasing demand for convenient and safe packaging solutions are driving market growth.
- Sustainable packaging, single-serve formats, and smart packaging technologies are emerging trends, with plastic remaining the dominant material segment due to cost efficiency and barrier properties.
- The market is moderately competitive with key players including Tetra Pak, Huhtamaki Group, Sealed Air Corporation, Bemis Company Inc., and WestRock Company focusing on innovation, sustainability, and global expansion.
- Regional analysis shows Asia Pacific leading with 32% market share, followed by North America at 27% and Europe at 25%, while high raw material costs and performance limitations of eco-friendly materials act as key restraints.
Market Segmentation Analysis:
By Material
Plastic dominated the Dairy Product Packaging market by material in 2024, accounting for the largest market share due to its durability, lightweight nature, and cost-effectiveness. Plastic packaging, including HDPE and PET, is widely used for milk, yogurt, and cream products because it ensures product safety and extends shelf life. Additionally, its compatibility with various packaging technologies like thermoforming and blow molding supports large-scale production. Paper & paperboard is also gaining momentum due to rising consumer preference for sustainable packaging. However, plastic remains preferred owing to its functionality, low production costs, and excellent barrier properties.
- For instance, Amcor produces over 1,000 different dairy plastic packaging SKUs globally, and in 2022, it converted more than 80% of its dairy packaging lines to fully recyclable PET and HDPE, enabling clients like Danone to scale their sustainable dairy lines across Europe.
By Type:
Among the various packaging types, bottles held the dominant share in 2024, primarily driven by their extensive usage in packaging milk, yogurt drinks, and liquid cream. Bottles offer superior protection against contamination and are easy to handle and transport, making them a popular choice for both manufacturers and consumers. Pouches and cartons are also gaining traction, especially for single-serve and ready-to-drink dairy products, due to convenience and sustainability benefits. Nevertheless, bottles remain preferred in liquid dairy packaging due to their reusability, convenience in storage, and compatibility with existing filling and sealing lines.
- For instance, Tetra Pak reported that its Tetra Prisma® Aseptic 330ml pack for liquid dairy beverages reached over 3.5 billion units sold globally by the end of 2023, emphasizing the growing demand for portioned and resealable bottle-type solutions in dairy.
By Product:
Cheese emerged as the leading product segment in 2024, capturing the highest market share within dairy product packaging. The demand for specialty and processed cheese has increased significantly, especially in North America and Europe, driving the need for advanced packaging formats like vacuum-sealed pouches, films, and wraps to maintain product quality and extend shelf life. Yogurt and butter also represent substantial shares, driven by the popularity of single-serve and flavored variants. However, cheese leads due to its high export volume, longer shelf life requirements, and the necessity for packaging solutions that preserve freshness and prevent spoilage.
Market Overview
Rising Global Dairy Consumption
The increasing global consumption of dairy products is a primary driver of the dairy product packaging market. Growing demand for milk, cheese, yogurt, and butter—especially in emerging economies such as India, China, and Brazil—has fueled the need for safe and efficient packaging solutions. Urbanization, rising disposable incomes, and health awareness among consumers are contributing to this surge. Additionally, dietary shifts toward protein-rich foods and the expansion of dairy-based convenience products have amplified the demand for durable and hygienic packaging that preserves product freshness and enhances shelf appeal.
- For instance, Parag Milk Foods in India expanded its dairy production capacity to 1.2 million liters per day in 2023, leading to a 20% increase in its requirement for multi-layer plastic and paperboard packaging formats across its product range.
Expansion of Cold Chain Infrastructure
The rapid development of cold chain logistics and refrigerated storage facilities has significantly boosted the dairy packaging market. Improved supply chain capabilities enable the safe transportation of temperature-sensitive dairy products over longer distances without compromising quality. This infrastructure expansion is particularly important in supporting exports and extending product reach to remote markets. As a result, the need for specialized packaging materials that can withstand varying temperatures and prevent contamination has grown, thereby encouraging innovation in insulated and tamper-proof packaging solutions across the dairy industry.
- For instance, Sealed Air Corporation developed the Cryovac® Barrier Bag 860, used by over 120 dairy processors in 18 countries, specifically engineered to protect soft cheese and butter under fluctuating cold chain temperatures without compromising product integrity.
Growing Preference for Sustainable Packaging
Rising environmental concerns and regulatory pressure are accelerating the demand for sustainable dairy packaging solutions. Consumers are increasingly prioritizing eco-friendly packaging made from recyclable, biodegradable, or compostable materials. In response, manufacturers are investing in paper-based cartons, bio-based plastics, and reduced-plastic formats to minimize their environmental footprint. Additionally, companies are aligning their branding with sustainability goals to appeal to environmentally conscious buyers. This shift is prompting packaging firms to innovate in material science and circular packaging models, fostering long-term growth in the sustainable segment of the dairy product packaging market.
Key Trends & Opportunities
Innovation in Smart and Functional Packaging
Technological advancements are driving the adoption of smart packaging in the dairy industry, offering added value through freshness indicators, temperature monitoring, and tamper-evident features. These intelligent packaging formats not only enhance product safety and transparency but also help build consumer trust. Functional packaging innovations, such as resealable packs and portion-controlled containers, are further enhancing convenience and extending shelf life. As demand for high-quality, traceable dairy products grows, the integration of digital tools such as QR codes and RFID tags presents significant opportunities for packaging manufacturers to differentiate their offerings.
- For instance, SIG developed a smart connected pack for dairy that incorporates serialized QR codes, enabling traceability for over 150 million packs of dairy products across Europe and Asia by the end of 2023.
Rising Demand for On-the-Go and Portion-Controlled Packs
With busy lifestyles and increased consumption of dairy-based snacks and beverages, there is a growing preference for single-serve and on-the-go dairy packaging. Products such as yogurt cups, drinkable yogurt bottles, and cheese sticks are gaining popularity among health-conscious and convenience-seeking consumers. This trend opens new avenues for customized, compact, and easy-to-use packaging formats that prioritize portability and hygiene. Packaging companies can capitalize on this shift by developing designs that enhance user experience while ensuring product integrity, thereby tapping into new consumer segments and increasing brand loyalty.
- For instance, Huhtamaki produced over 2.3 billion portion-controlled dairy packs globally in 2023, including yogurt tubs and drinkable dairy shots, with automated high-speed filling capabilities exceeding 500 units per minute per line.
Key Challenges
Fluctuating Raw Material Prices
The volatility in raw material prices, particularly plastic resins, paperboard, and aluminum, poses a significant challenge to packaging manufacturers. Sudden increases in input costs can erode profit margins and disrupt supply chains. This instability also makes it difficult for companies to plan long-term procurement strategies or maintain consistent pricing. Although many companies are investing in alternative and sustainable materials, these options often come with higher upfront costs. Balancing affordability with quality and environmental impact remains a pressing challenge for stakeholders in the dairy product packaging market.
Stringent Regulatory Standards and Compliance
Compliance with diverse and evolving food safety regulations across regions adds complexity to the dairy packaging landscape. Packaging materials must meet strict standards regarding chemical migration, labeling, and recyclability. Navigating global regulatory frameworks, such as the U.S. FDA, EU EFSA, and others, often requires significant investment in testing, certification, and reformulation. Non-compliance can lead to product recalls and reputational damage. Consequently, manufacturers must remain agile and well-informed to ensure that their packaging solutions adhere to both domestic and international safety and sustainability requirements.
Sustainability vs. Performance Trade-offs
While there is a strong push for environmentally friendly packaging, achieving a balance between sustainability and performance remains difficult. Many eco-friendly materials do not yet match the barrier properties, durability, and cost-efficiency of conventional plastic. In the dairy sector, where product freshness and shelf life are critical, compromising on performance can lead to increased food waste. This challenge is driving demand for innovative material solutions, but technological limitations and high development costs continue to hinder rapid adoption, creating a gap between consumer expectations and market capabilities.
Regional Analysis
North America
North America held a significant share of the dairy product packaging market in 2024, accounting for approximately 27% of the global revenue. The region benefits from high dairy consumption, established cold chain infrastructure, and strong demand for innovative packaging formats such as resealable and single-serve containers. The United States leads the regional market, driven by the growing popularity of functional and organic dairy products. Additionally, stringent food safety regulations and rising environmental awareness have encouraged the adoption of recyclable and biodegradable packaging materials. Market growth is further supported by advanced retail distribution networks and expanding e-commerce channels.
Europe
Europe captured around 25% of the global dairy product packaging market share in 2024, fueled by robust dairy production and a strong culture of cheese and yogurt consumption. Countries like Germany, France, and the Netherlands are major contributors due to their extensive dairy exports and adherence to high packaging standards. The region’s regulatory emphasis on sustainability has accelerated the shift toward eco-friendly materials, particularly paper-based and compostable packaging. Technological innovation and consumer preference for premium dairy products continue to support demand for high-performance, tamper-evident, and portion-controlled packaging solutions across both retail and foodservice channels.
Asia Pacific
Asia Pacific dominated the global dairy product packaging market in 2024 with a leading market share of approximately 32%, driven by population growth, rising dairy consumption, and expanding urbanization. China and India are key growth centers, supported by increasing health awareness and government initiatives to boost milk production and packaging standards. The region is witnessing strong demand for flexible packaging, especially pouches and cartons, for cost-effective and convenient dairy distribution. Rapid development of cold chain logistics, coupled with the rise in modern retail formats, continues to enhance the market outlook for dairy packaging across diverse product categories.
Latin America
Latin America accounted for around 8% of the global dairy product packaging market in 2024. The region is experiencing steady growth, supported by rising dairy consumption in Brazil, Argentina, and Mexico. Increasing urbanization and changing dietary habits have spurred demand for packaged dairy goods, especially flavored milk, cheese, and yogurt. While cost sensitivity remains a factor, the adoption of flexible packaging solutions such as pouches and films is gaining momentum. The market also benefits from growing awareness around food hygiene and the influence of global packaging trends, prompting local producers to upgrade packaging technologies and materials.
Middle East & Africa
The Middle East & Africa region held a modest share of about 8% in the global dairy product packaging market in 2024. Growth is driven by expanding dairy production in countries like Saudi Arabia and South Africa, alongside rising imports of packaged dairy products. Increased consumer demand for processed and convenience dairy items is supporting the use of modern packaging formats such as bottles and cartons. However, challenges such as limited cold chain infrastructure and higher packaging costs persist. Nonetheless, growing investments in retail modernization and food safety initiatives are expected to gradually strengthen regional market performance.
Market Segmentations:
By Material
- Plastic
- Glass
- Paper & Paperboard
- Metal
- Others
By Type
- Bags and Wraps
- Films
- Bottles
- Cans
- Pouches
- Boxes
- Carton
By Product
- Cheese
- Yoghurt
- Butter
- Frozen Products
- Cream
- Others
By Geography
- North America
- U.S.
- Canada
- Mexico
- Europe
- Germany
- France
- U.K.
- Italy
- Spain
- Rest of Europe
- Asia Pacific
- China
- Japan
- India
- South Korea
- South-east Asia
- Rest of Asia Pacific
- Latin America
- Brazil
- Argentina
- Rest of Latin America
- Middle East & Africa
- GCC Countries
- South Africa
- Rest of the Middle East and Africa
Competitive Landscape
The competitive landscape of the dairy product packaging market is characterized by the presence of well-established global players alongside regional manufacturers striving for market share through innovation, sustainability, and strategic expansion. Companies such as Tetra Pak, Huhtamaki Group, Bemis Company Inc., and Sealed Air Corporation dominate the market with extensive product portfolios, advanced packaging technologies, and strong distribution networks. These players focus on developing eco-friendly, functional, and cost-effective packaging solutions to address rising consumer demand and regulatory pressures. Strategic collaborations, acquisitions, and investments in R&D are key approaches adopted to enhance market positioning. For instance, advancements in recyclable materials and smart packaging have become central to competitive strategies. Meanwhile, regional firms like Nampak Ltd. and Airlite Plastics are expanding their presence through localization, customization, and improved supply chain efficiency. The market is moderately fragmented, with competition intensifying as companies seek to differentiate themselves by offering tailored solutions that ensure product safety, shelf appeal, and environmental compliance.
Key Player Analysis
- Tetra Pak
- Huhtamaki Group
- Bemis Company Inc.
- Sealed Air Corporation
- WestRock Company
- Airlite Plastics
- Ahlstrom
- Nampak Ltd.
- ELOPAK
Recent Developments
- In October 2024, Aavin, a Chennai (India) based micro-industry firm has put forth an alternative of a paper pouch coated with a sustainable chemical solution. This option is aimed at reduction the single use plastic utilized for Aavin’s products. This sustainable solution was found viable by the Tamil Nadu Pollution Control Board.
- In February 2024, Yaza, launched their traditional mediterranean dairy product, Labneh, in a Greiner’s K3 cardboard-plastic cup in U.S. This offers a solution that is usable for the product and packaging material can be recycled.
- In January 2024, Chobani Australia announced that they have reduced the plastic content in their packaging of Gippsland Dairy yogurt products. This aligns with the company’s commitment to Australian Packaging Covenant Organization to minimize or reduce usage of problematic plastics.
- In September 2023, Heartisan Foods, a manufacturer and most extensive online U.S. speciality and flavoured cheese seller, acquired North Country Packaging.
- In November 2023, Mondi and Skånemejerier collaborated on PP-based mono-material cheese packaging, while Sidel created a PET bottle for liquid dairy products. Eco-Products expanded its line of fibre-based packaging to include two sets of lids in the interim.
Market Concentration & Characteristics
The Dairy Product Packaging market displays a moderate to high level of concentration, with several established players maintaining strong control through extensive product portfolios, global distribution networks, and ongoing investments in sustainable solutions. It is characterized by high product differentiation, rapid technological advancement, and evolving consumer preferences. Companies compete primarily on packaging innovation, material performance, and regulatory compliance. Sustainability and convenience are central to product development, pushing manufacturers to shift toward recyclable, biodegradable, and lightweight materials. The market also reflects a balance between cost efficiency and functionality, especially in developing regions where affordability remains crucial. Consumer demand for hygienic, resealable, and single-serve options influences packaging formats across product types. Regulatory standards for food safety and environmental impact shape material choices and production practices. It benefits from strong demand in both developed and emerging economies, with Asia Pacific accounting for the largest share due to rising dairy consumption, population growth, and expanding retail infrastructure.
Report Coverage
The research report offers an in-depth analysis based on Material, Type, Product and Geography. It details leading market players, providing an overview of their business, product offerings, investments, revenue streams, and key applications. Additionally, the report includes insights into the competitive environment, SWOT analysis, current market trends, as well as the primary drivers and constraints. Furthermore, it discusses various factors that have driven market expansion in recent years. The report also explores market dynamics, regulatory scenarios, and technological advancements that are shaping the industry. It assesses the impact of external factors and global economic changes on market growth. Lastly, it provides strategic recommendations for new entrants and established companies to navigate the complexities of the market.
Future Outlook
- The dairy product packaging market is expected to grow steadily, driven by rising global dairy consumption and urbanization.
- Demand for sustainable and eco-friendly packaging materials will increase due to consumer awareness and regulatory pressures.
- Flexible packaging formats such as pouches and films will gain popularity for their cost-effectiveness and convenience.
- Smart and functional packaging technologies will be adopted to enhance product safety, traceability, and shelf life.
- Asia Pacific will continue to lead the market, supported by population growth and expanding cold chain infrastructure.
- The market will see increased investment in recyclable and biodegradable packaging innovations.
- Single-serve and on-the-go packaging formats will expand in response to changing lifestyles and food habits.
- E-commerce growth will push demand for durable and tamper-evident dairy packaging solutions.
- Manufacturers will focus on lightweight packaging to reduce logistics costs and environmental impact.
- Strategic partnerships and acquisitions will shape the competitive landscape and expand product portfolios.
Request a Free Sample
Fill in your details and we'll send you a free sample report.
- Sample data tables & charts
- Research methodology
Need a Custom Version of This Report?
Tailor the scope, geography, or segments to your exact requirements.
- Custom geography or segment scope
- Direct access to our analyst team
Frequently Asked Questions
What is the current size of the Dairy Products Packaging Market?
What factors are driving the growth of the Dairy Products Packaging Market?
What are some challenges faced by the Dairy Products Packaging Market?
Who are the major players in the Dairy Products Packaging Market?
Table of Content
Chapter 1. Report Introduction
- 1.1 Report Description & Purpose
- 1.1.1 Report Title & Market Definition
- 1.1.2 Unique Selling Propositions (USP) & Key Differentiators
- 1.1.3 Value Proposition for Stakeholders
- 1.2 Research Objectives
- 1.2.1 Market Sizing Objectives (Volume & Revenue)
- 1.2.2 Segmentation Objectives
- 1.2.3 Competitive Intelligence Objectives
- 1.2.4 Forecast & Scenario Objectives
- 1.3 Report Scope
- 1.3.1 Dairy Products Packaging Scope – Types & Subtypes Covered
- 1.3.2 Geographic Scope – Regions & Countries Covered
- 1.3.3 Historical Period, Base Year & Forecast Period (2024; forecast to 2032)
- 1.3.4 Inclusions & Exclusions
- 1.4 HS Code & Classification Framework
- 1.5 Currency, Units & Pricing Basis
- 1.6 Target Stakeholders
- 1.7 Limitations & Assumptions
Chapter 2. Executive Summary
- 2.1 Global Dairy Products Packaging Market Snapshot
- 2.1.1 Market Size – Historical (2024) & Forecast (2024-2032) (2024: USD 25,335 million → 2032: USD 34,726 million)
- 2.1.2 Volume & Revenue – Global Totals
- 2.1.3 Key Market Highlights – Top Five Facts
- 2.2 Dairy Products Packaging Market Segmentation Snapshot
- 2.2.1 Market Split by Region – 2024 vs. 2032
- 2.3 Competitive Snapshot
- 2.3.1 Top 10 Players by Revenue Share – 2024
- 2.3.2 Top 10 Players by Volume Share – 2024
- 2.3.3 Recent Strategic Developments (18-Month Summary)
- 2.4 Key Investment Highlights & Strategic Conclusions
Chapter 3. Dairy Products Packaging Market Dynamics & Industry Analysis
- 3.1 Market Overview & Context
- 3.1.1 Dairy Products Packaging Market Position in the Broader Automotive Value Chain
- 3.1.2 OEM vs. Replacement Market Dynamics
- 3.1.3 Market Maturity & Development Stage by Region
- 3.2 Dairy Products Packaging Market Drivers
- 3.3 Dairy Products Packaging Market Restraints & Challenges
- 3.4 Dairy Products Packaging Market Opportunities
- 3.5 Porter's Five Forces Analysis
- 3.5.1 Threat of New Entrants
- 3.5.2 Bargaining Power of Suppliers
- 3.5.3 Bargaining Power of Buyers
- 3.5.4 Threat of Substitutes
- 3.5.5 Competitive Rivalry – Intensity Assessment
- 3.6 Dairy Products Packaging Value Chain Analysis
- 3.6.1 Upstream – Raw Material/Input Suppliers
- 3.6.1.1 Raw Material/Input 1
- 3.6.1.2 Raw Material/Input 2
- 3.6.1.3 Raw Material/Input 3
- 3.6.2 Midstream – Production/Manufacturing/Service Delivery
- 3.6.2.1 Production/Process Overview
- 3.6.2.2 Key Facility Locations & Capacity by Manufacturer
- 3.6.3 Downstream – Distribution & End Consumer
- 3.6.3.1 Primary Channel – B2B/OEM
- 3.6.3.2 Secondary Channels – Dealer, Retail, Online, Direct
- 3.6.4 Value Chain Profitability Analysis
- 3.6.1 Upstream – Raw Material/Input Suppliers
- 3.7 PESTEL Analysis
- 3.7.1 Political Factors
- 3.7.2 Economic Factors
- 3.7.3 Social Factors
- 3.7.4 Technological Factors
- 3.7.5 Environmental Factors
- 3.7.6 Legal Factors
- 3.8 Dairy Products Packaging Supply Chain Analysis
- 3.8.1 Raw Material/Input Supply Risk Assessment
- 3.8.2 Manufacturing Concentration Risk (Geographic Exposure)
- 3.8.3 Trade Disruption Impact Analysis
- 3.9 Regulatory & Policy Landscape
Note: The regulatory and policy landscape section covers regulations based on their applicability to the market, Dairy Products Packaging category, geography, and scope of the study. Only regulatory frameworks with a material impact on operations, compliance, trade, sustainability, or market access are analyzed in detail.
Chapter 4. Key Investment Pockets & Opportunity Analysis
- 4.1 Dairy Products Packaging Market Attractiveness Analysis
- 4.1.1 By Region – Investment Attractiveness Matrix (Volume × CAGR)
- 4.2 Absolute Revenue Growth Opportunity
- 4.2.1 By Region – Absolute USD Growth Through 2032
- 4.3 Incremental Volume Opportunity
- 4.3.1 By Region – Incremental Volume Through 2032
- 4.3.2 Segment – Incremental Volume
- 4.4 Emerging Submarket Opportunity Deep Dive (Subject to Applicability)
- 4.5 Emerging Market Opportunity Scorecards
- 4.5.1 United States
- 4.5.2 Europe
- 4.5.3 Asia
- 4.5.4 Middle East & Africa
Note: Emerging Market Opportunity Scorecards will be included based on relevance and strategic importance. Regions listed are indicative and may vary depending on data availability and market dynamics.
Chapter 5. Dairy Products Packaging Import-Export Analysis & Trade Flows
- 5.1 Global Trade Overview
- 5.1.1 Global Export Value by Country (2024)
- 5.1.2 Global Export Volume by Country (2024)
- 5.1.3 Global Import Value by Country (2024)
- 5.1.4 Global Import Volume by Country (2024)
- 5.1.5 Net Trade Balance by Country (2024)
- 5.2 Export Analysis – Segment
- 5.2.1 Type 1 (HS Code)
- 5.2.2 Type 2 (HS Code)
- 5.2.3 Type 3 (HS Code)
- 5.2.4 Type 4 (HS Code)
- 5.2.5 Type 5 (HS Code)
- 5.3 Import Analysis – Segment
- 5.3.1 Type 1 (HS Code)
- 5.3.2 Type 2 (HS Code)
- 5.3.3 Type 3 (HS Code)
- 5.3.4 Type 4 (HS Code)
- 5.3.5 Type 5 (HS Code)
- 5.4 Average Unit Trade Prices
- 5.4.1 Average Export Price – Segment & Country
- 5.4.2 Average Import Price – Segment & Source Country
- 5.4.3 Price Trends (2024)
- 5.5 Key Trade Route Analysis
- 5.5.1 Trade Route 1
- 5.5.2 Trade Route 2
- 5.5.3 Trade Route 3
- 5.5.4 Trade Route 4
- 5.5.5 Trade Route 5
- 5.6 Trade Policy Impact Assessment
- 5.6.1 US Anti-Dumping & Section 301 Tariffs
- 5.6.2 EU Customs Union Impact
- 5.6.3 Major Free Trade Agreements
- 5.6.4 USMCA Rules of Origin
Note: Trade policy analysis will be included only where relevant to the Dairy Products Packaging market.
Chapter 6. Competitive Landscape & Company Benchmarking
- 6.1 Dairy Products Packaging Market Concentration & Structure
- 6.1.1 Herfindahl-Hirschman Index (HHI) – vs. 2024
- 6.1.2 Tier 1, Tier 2 & Tier 3 Market Structure
- 6.1.3 Global, Regional & Local Player Dynamics
- 6.2 Dairy Products Packaging Market Share Analysis – 2024
- 6.2.1 Global Revenue Share by Company
- 6.2.2 Global Volume Share by Company
- 6.2.3 Regional Revenue Share
- 6.2.4 Market Share Evolution ( vs. 2024)
- 6.2.5 OEM Segment Share by Company
- 6.2.6 Replacement Segment Share by Company
- 6.3 Production/Delivery Capacity & Facility Analysis
- 6.3.1 Global Installed Capacity
- 6.3.2 Capacity Utilization Rates
- 6.3.3 Production/Output Volume
- 6.3.4 Facility Locations & Capacity Map
- 6.3.5 Planned Capacity Additions
- 6.4 Dairy Products Packaging Competitive Benchmarking Matrix
- 6.4.1 Revenue, Volume, CAGR & Profitability Comparison
- 6.4.2 Channel Revenue Mix
- 6.4.3 Geographic Revenue Exposure
- 6.4.4 R&D Intensity
- 6.4.5 Sustainability Maturity
- 6.5 Strategic Developments in Dairy Products Packaging (Last 24 Months)
- 6.5.1 Mergers, Acquisitions & Divestments
- 6.5.2 New Dairy Products Packaging Launches
- 6.5.3 Facility Expansions
- 6.5.4 Strategic Alliances, Joint Ventures & Partnerships
- 6.5.5 Distribution Expansion & Market Entry
- 6.5.6 Sustainability & ESG Initiatives
- 6.6 Competitive Strategy Mapping
- 6.6.1 Leader, Challenger, Follower & Niche Classification
- 6.6.2 Pricing Strategy Comparison
- 6.6.3 Channel Strategy Matrix
Note: Strategic developments are included based on their materiality and the availability of reliable information.
Chapter 7. Global Dairy Products Packaging Market – By Distribution Channel
- 7.1 Segment Overview
- 7.1.1 Volume & Revenue Split by Channel (2024 & 2032)
- 7.1.2 Channel Mix Evolution (2024-2032)
Chapter 8. Regional Market Analysis – Global Overview
- 8.1 Global Regional Overview
- 8.1.1 Regional Volume Share
- 8.1.2 Regional Revenue Share
- 8.1.3 Regional Volume by Region
- 8.1.4 Regional Revenue by Region
- 8.1.5 Regional Forecast Through 2032
- 8.2 Cross-Regional Segment Analysis
- 8.2.1 By Distribution Channel
- 8.2.2 By Brand/Price Tier
Chapter 9. North America Dairy Products Packaging Market
- 9.1 United States
- 9.2 Canada
- 9.3 Mexico
Chapter 10. Europe Dairy Products Packaging Market
- 10.1 Germany
- 10.2 France
- 10.3 Italy
- 10.4 United Kingdom
- 10.5 Spain
- 10.6 Poland
- 10.7 Russia
- 10.8 Netherlands
- 10.9 Belgium
- 10.10 Sweden
- 10.11 Denmark
- 10.12 Norway
- 10.13 Rest of Europe
Chapter 11. Asia Pacific Dairy Products Packaging Market
- 11.1 China
- 11.2 India
- 11.3 Japan
- 11.4 South Korea
- 11.5 Thailand
- 11.6 Indonesia
- 11.7 Vietnam
- 11.8 Malaysia
- 11.9 Australia
- 11.10 Rest of Asia Pacific
Chapter 12. Latin America Dairy Products Packaging Market
- 12.1 Brazil
- 12.2 Argentina
- 12.3 Colombia
- 12.4 Chile
- 12.5 Rest of Latin America
Chapter 13. Middle East Dairy Products Packaging Market
- 13.1 Saudi Arabia
- 13.2 United Arab Emirates
- 13.3 Turkey
- 13.4 Israel
- 13.5 Iran
- 13.6 Rest of the Middle East
Chapter 14. Africa Dairy Products Packaging Market
- 14.1 South Africa
- 14.2 Egypt
- 14.3 Nigeria
- 14.4 Morocco
- 14.5 Rest of Africa
Chapter 15. Dairy Products Packaging Company Profiles
- 15.1 [Company 01]
- 15.1.1 Company Overview
- 15.1.2 Key Management Personnel
- 15.1.3 Products & Services Portfolio
- 15.1.4 Financial Performance
- 15.1.5 Key Market Focus & Geographic Presence
- 15.1.6 Recent Developments & Strategic Initiatives
Note: The company profile list is preliminary and may change based on research findings, market developments, data availability, and client requirements.
Chapter 16. Appendices
- Appendix A – List of Abbreviations & Acronyms
- Appendix B – Industry Classification Code Reference – Full Series
- Appendix C – Production & Capacity Data Tables
- Appendix D – End-Use & Demand Base Tables
- Appendix E – Consumption & Replacement Rate Assumptions
- Appendix F – ASP Reference Tables
- Appendix G – Manufacturing & Facility Database
- Appendix H – Import-Export Data Tables
- Appendix I – Regulatory Summary Tables
- Appendix J – Primary Research Participant List (Anonymized)
- Appendix K – Primary Research Questionnaire Framework
- Appendix L – Data Sources & Bibliography
- Appendix M – Market Size Divergence & Source Comparison
Chapter 17. Research Methodology
- 17.1 Research Framework & Philosophy
- 17.2 Secondary Research – Sources, Hierarchy & Data Extraction
- 17.3 Data Modeling – Bottom-Up & Top-Down Market Sizing
- 17.4 Primary Research – Stakeholder Framework, LOI & Sample Sizes
- 17.5 Forecast Methodology – Regression, Scenario & Sensitivity Analysis
- 17.6 Quality Control – Four-Layer Validation Framework
- 17.7 Limitations & Standard Assumptions
- 17.8 Disclaimer
