
Rental fleets shape how Australia buys boom reach
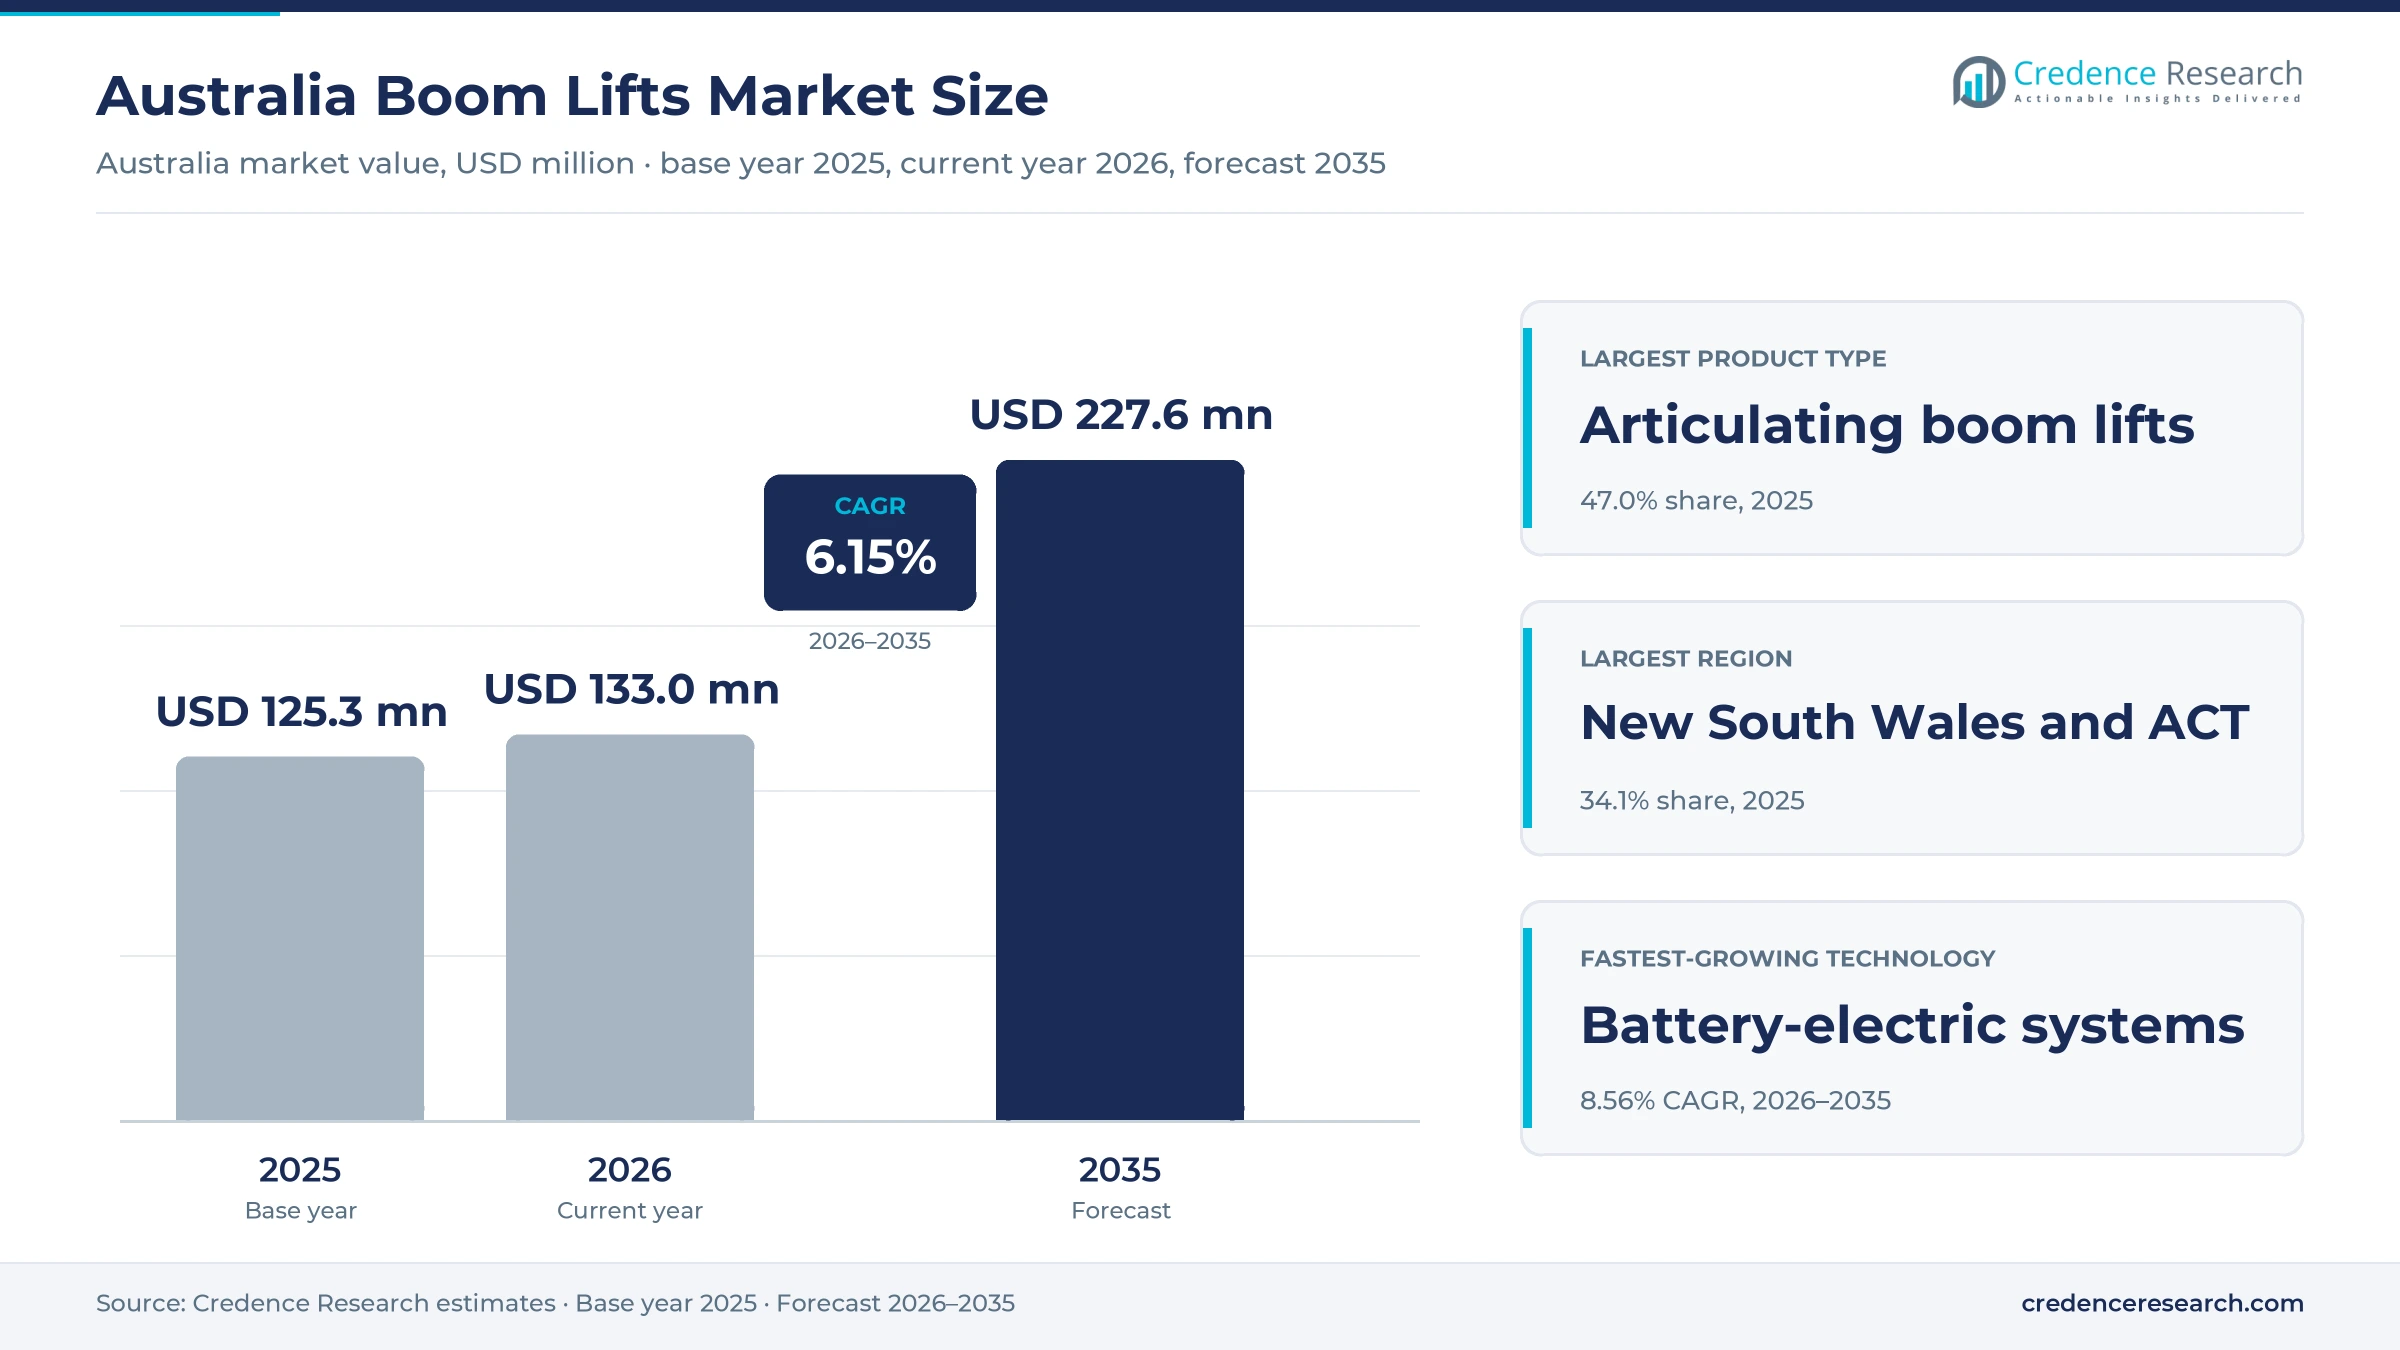
The Australia boom lifts market was valued at USD 125.3 million in 2025 and is projected to increase from USD 133.0 million in 2026 to USD 227.6 million by 2035, registering a CAGR of 6.15% during 2026–2035. Demand comes from transport, energy and housing projects, from mine sites and from recurring plant maintenance, and rental companies place most of the machine orders. New South Wales and ACT held the largest regional share, 34.1% in 2025, because Sydney concentrates major transport and data center construction. Queensland is the fastest-growing region at 6.72% a year as venue works and athlete village planning for the 2032 Games advance. Battery-electric rough terrain machines are the main technology change, since they let one boom work indoors and outdoors on the same project. A model national code published in December 2025 also keeps fleet replacement steady, because it calls for a major inspection after 10 years of service.
What does the Australian boom lift market include and exclude?
The market counts new telescopic, articulating and trailer-mounted boom lifts supplied to rental fleets, enterprises and project contractors, whether sold through national accounts, branches, dealers or digital channels. Most machines reach site through hire, so the rental company is the buyer while the contractor or mine operator chooses the machine for each job.
Scissor lifts, vertical mast lifts, spider lifts, truck-mounted platforms and rental income are excluded from the value shown here. The value chain runs from overseas factories through local subsidiaries and dealers to hire branches, followed by inspection, parts and used-machine resale at the end of fleet life.
Australia Boom Lifts Market Insights
- The market rises from USD 125.3 million in 2025 to USD 227.6 million by 2035 at a 6.15% CAGR, supported by national pipelines, mine maintenance and scheduled fleet replacement.
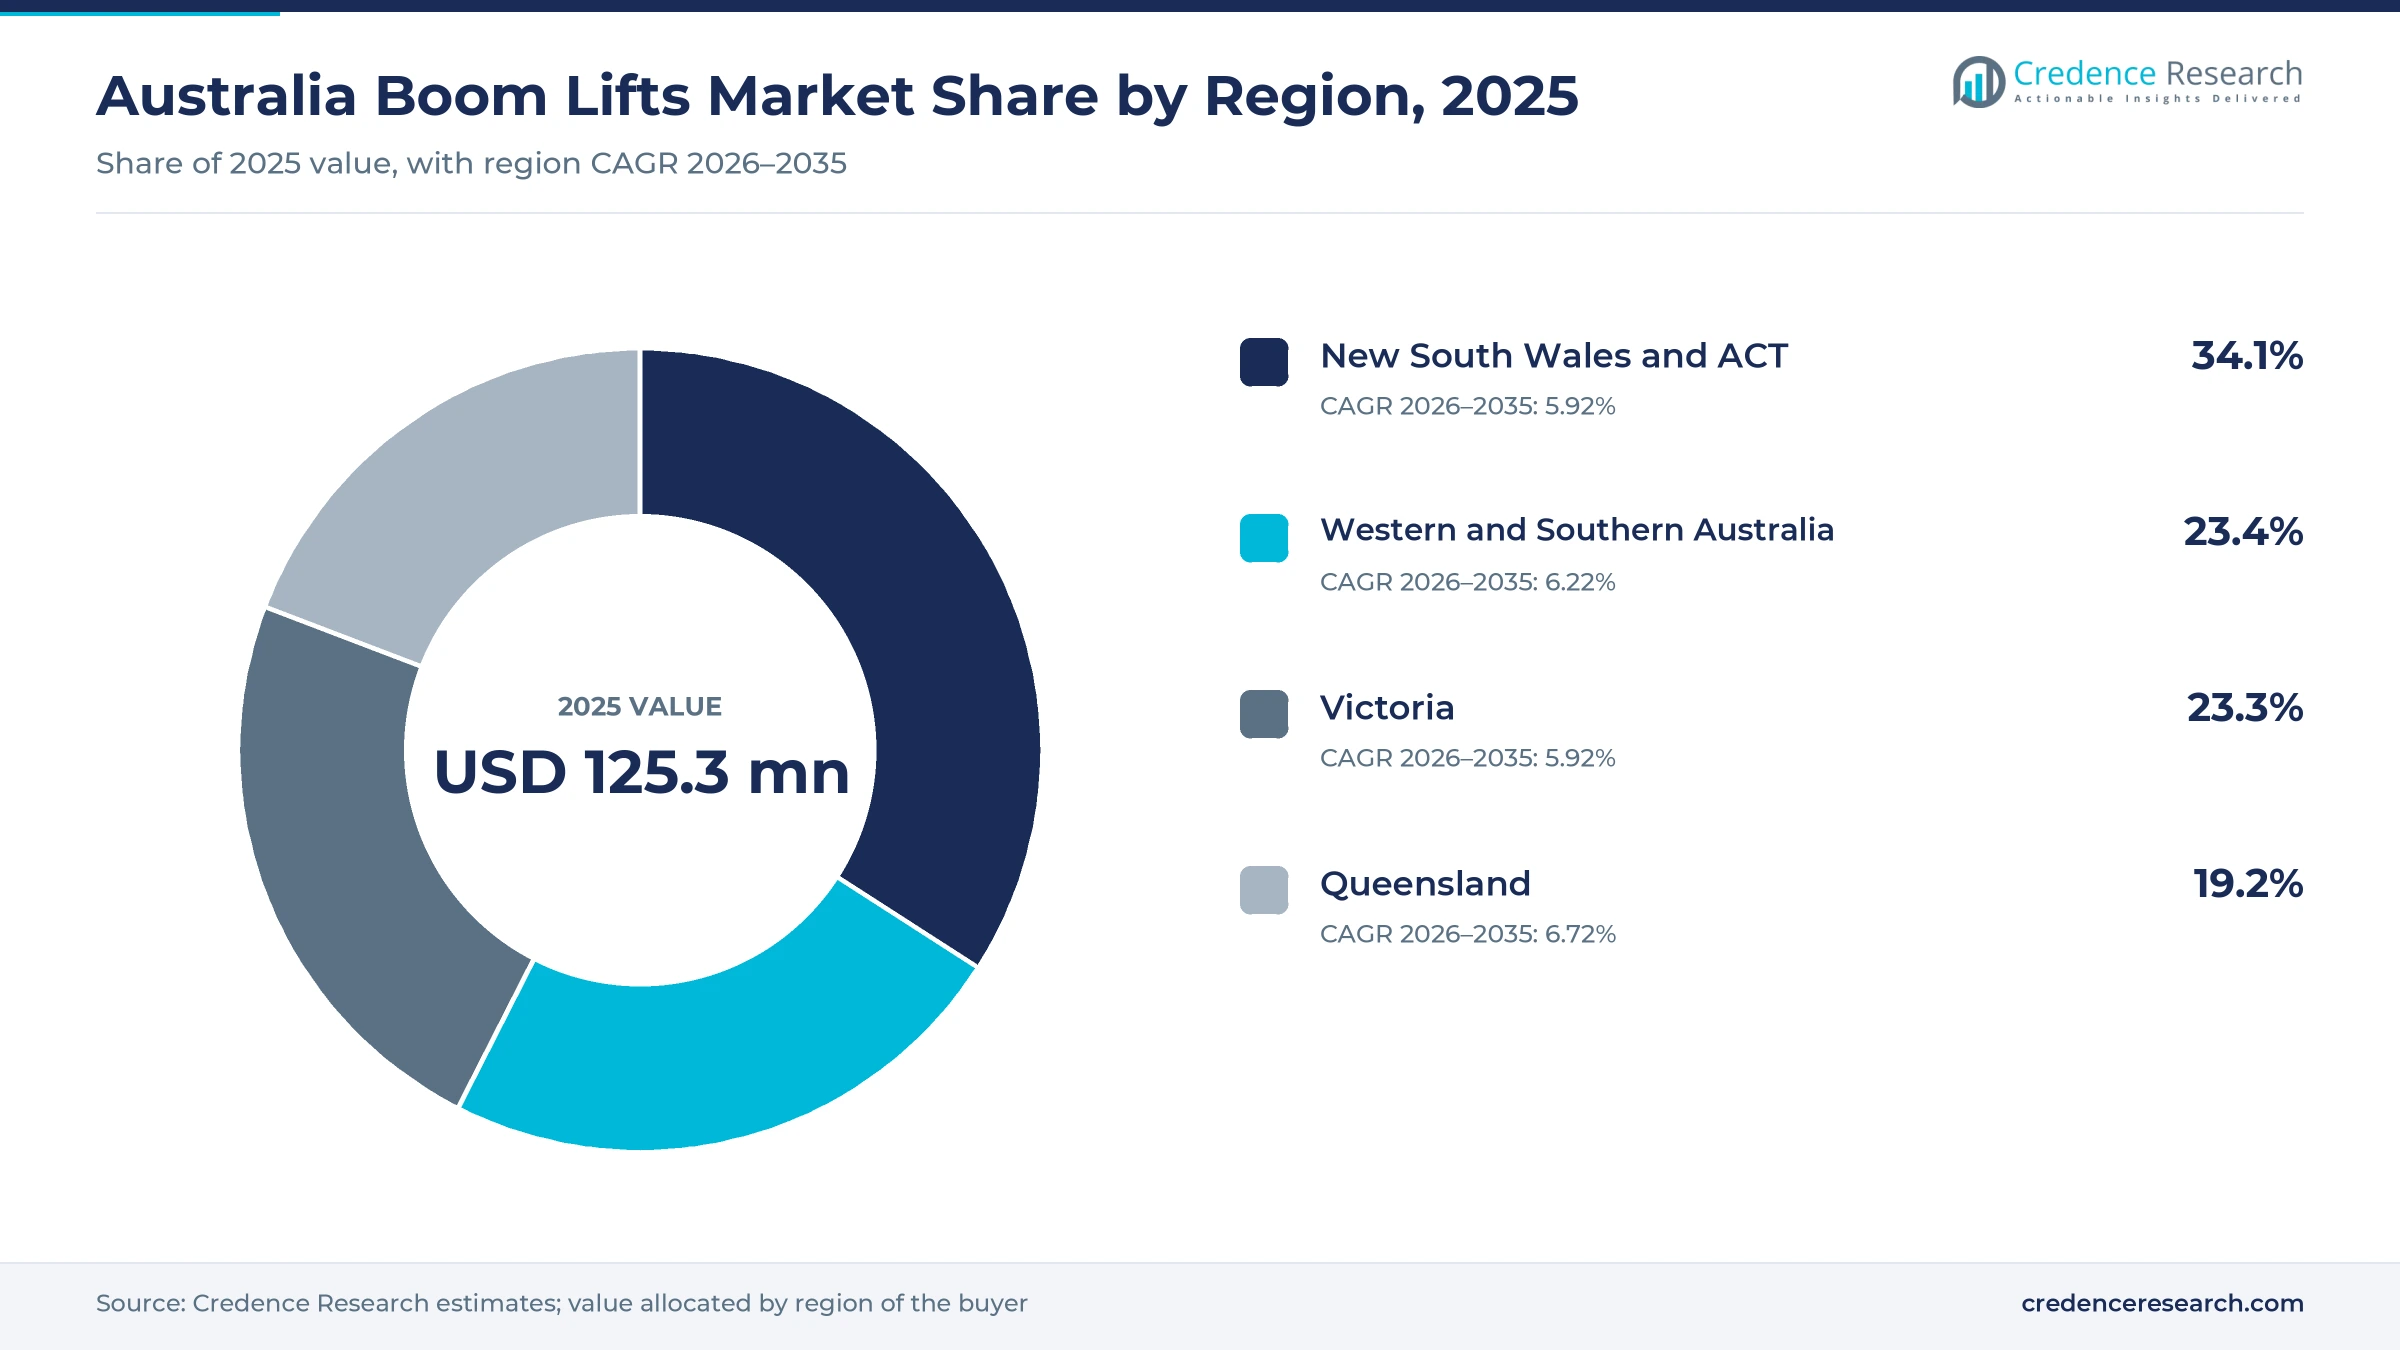
- New South Wales and ACT held 34.1% of 2025 value, the largest regional share, ahead of Western and Southern Australia and Victoria.
- Articulating boom lifts led product demand with 47.0% of 2025 value because they reach over and around structures on congested sites.
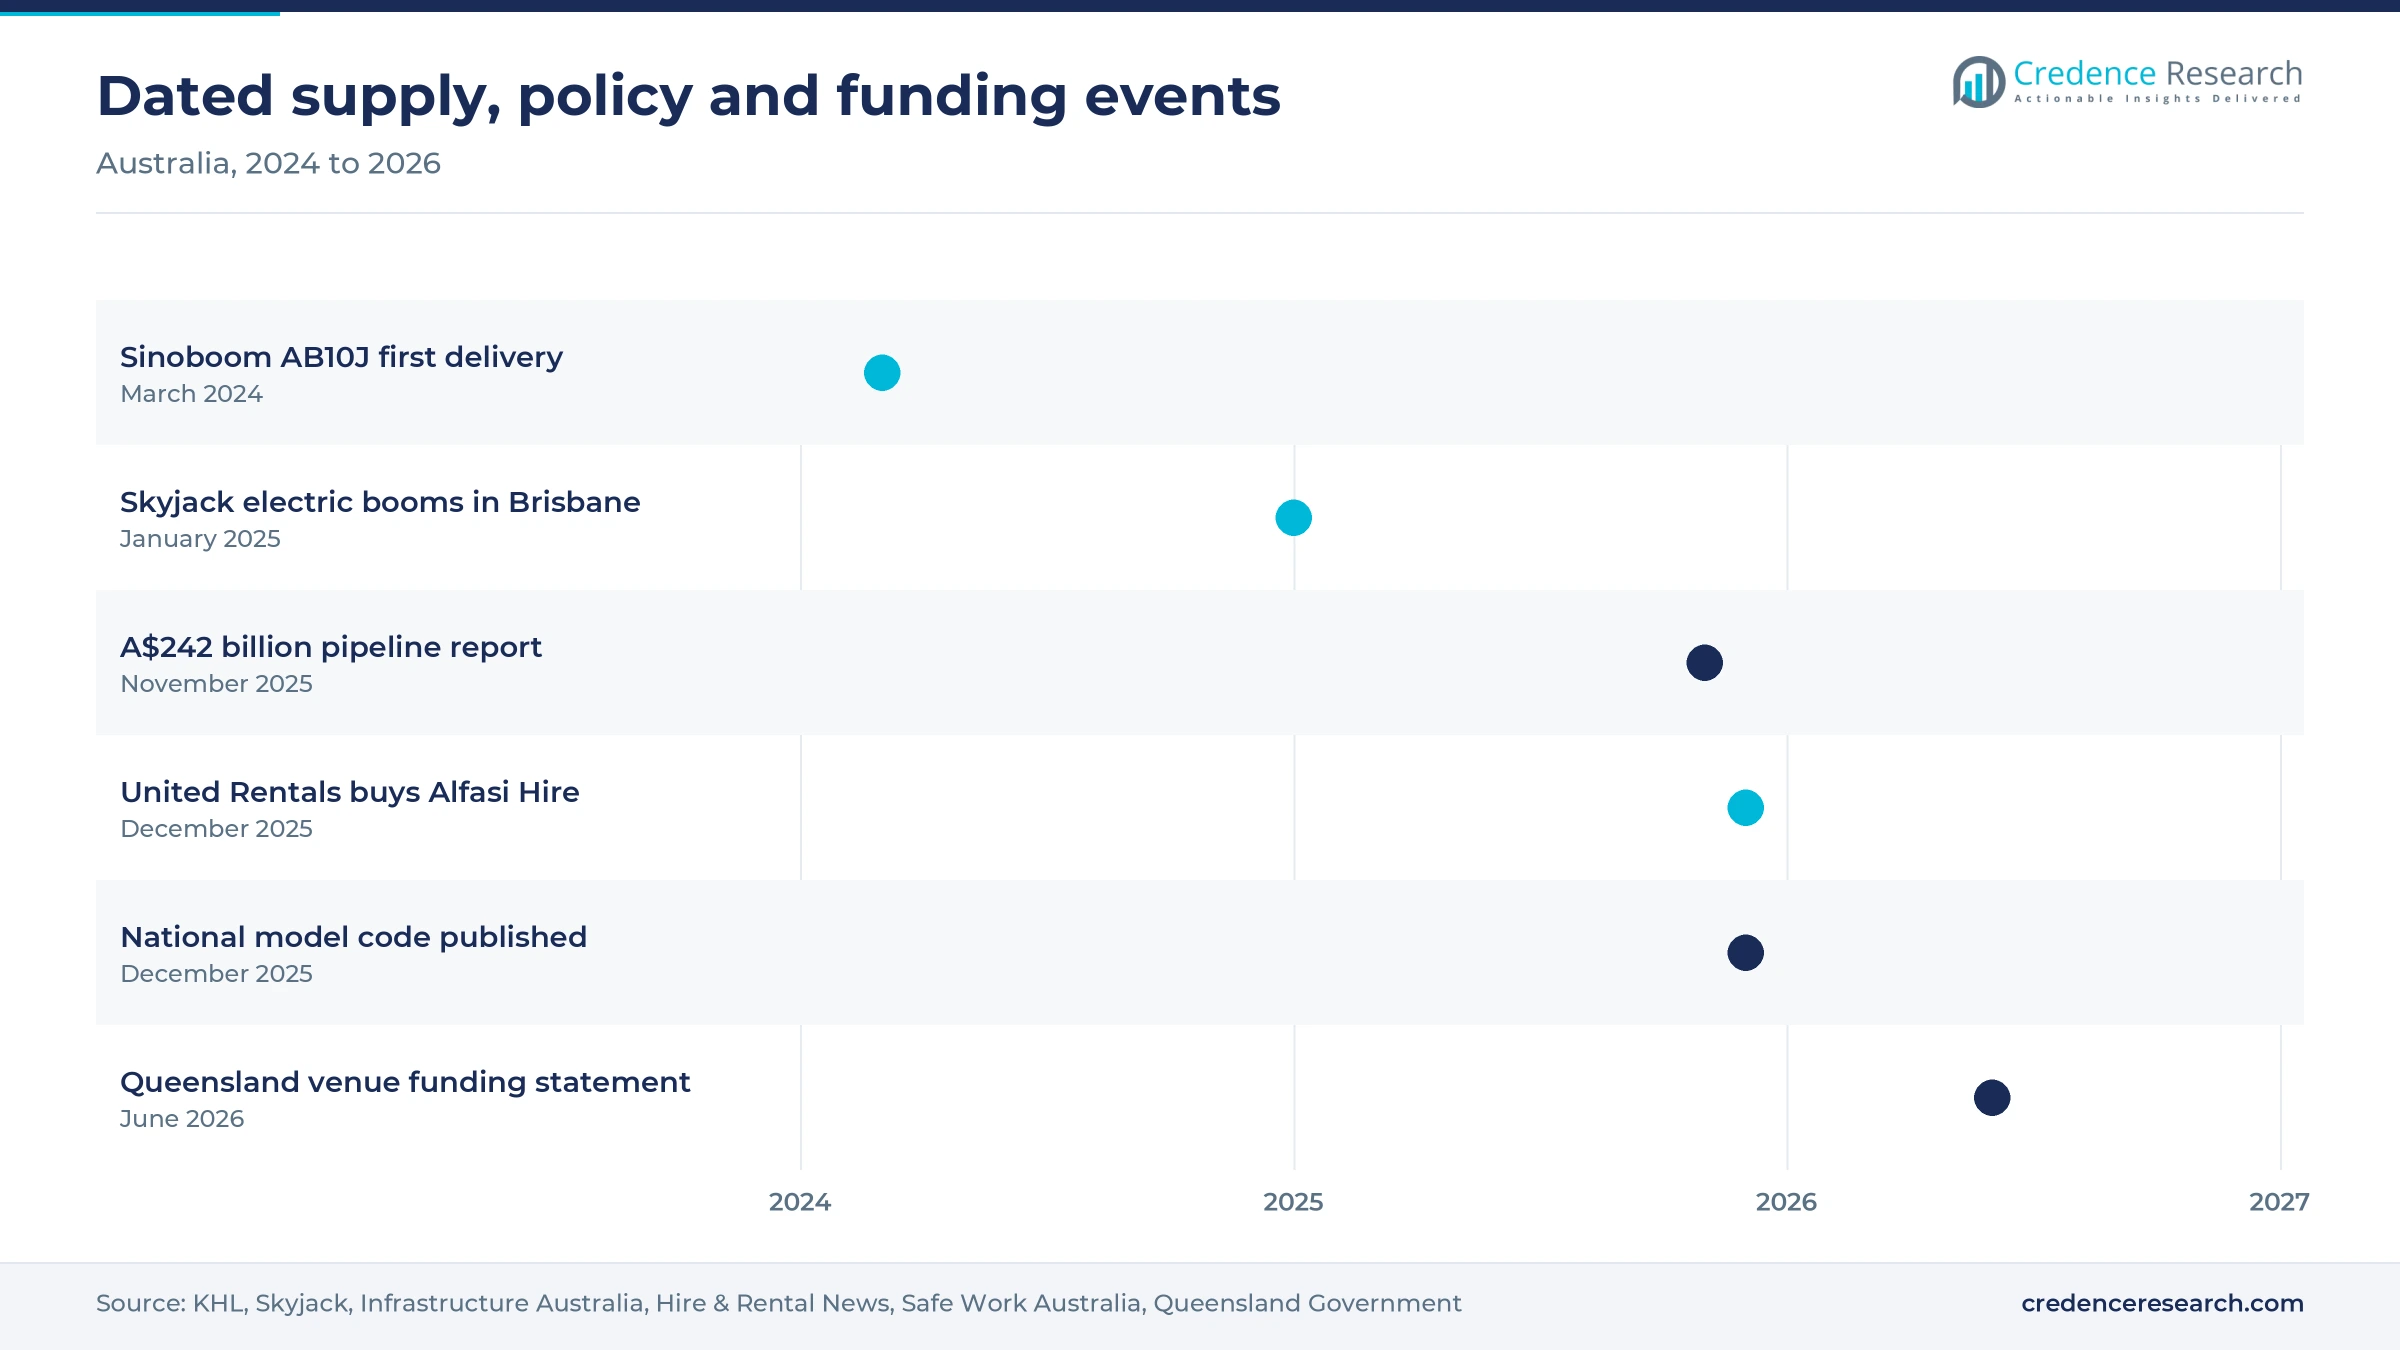
- Skyjack delivered battery-powered rough terrain articulated booms to Height 4 Hire in Brisbane on Jan. 28, 2025, showing electric machines moving onto outdoor work.
- United Rentals bought aerial rental specialist Alfasi Hire in December 2025, adding another global owner to a market where national rental fleets shape purchasing.
Articulating and rental-owned machines hold leading shares
Why do articulating machines lead product demand?
Based on product type, the market is categorized into telescopic boom lifts, articulating boom lifts and trailer-mounted boom lifts. Articulating boom lifts led with 47.0% of 2025 value because compact machines suit dense sites, and Sinoboom Australia brought in its AB10J, under 5 metric tons, in March 2024 for easier truck transport and urban use. Buyers also weigh them against scissor platforms on projects needing outreach. Telescopic boom lifts grow fastest at 6.61% a year as high-reach work expands, shown by the 54.8-meter Genie that Kennards Hire added in Darwin in November 2022. Trailer-mounted units remain a Coates depot staple, according to Access International in February 2024.
Which industries put the most machines to work?
Based on end-use industry, the market is categorized into construction and infrastructure, mining and resources, manufacturing and utilities and facilities services. Construction and infrastructure led with 52.0% of 2025 value because Infrastructure Australia counted an A$242 billion five-year public pipeline in November 2025, including A$129 billion for transport. Mining follows, since the Department of Industry listed 65 committed resource and energy projects worth A$62 billion in its 2025 report. Utilities and facilities services grow fastest at 6.93% a year as utilities work such as energy transmission more than doubles to A$36 billion over five years, according to Infrastructure Australia, adding transmission and substation access tasks.
Why do rental fleets dominate machine purchasing?
Based on customer type, the market is categorized into rental fleet owners, asset-owning enterprises and project contractors. Rental fleet owners led with 63.0% of 2025 value because construction equipment rental lets contractors avoid inspection and storage duties, and Access International reported about 8,000 access units at Coates in February 2024. Rental fleet owners also grow fastest at 6.32% a year as hire groups keep adding capacity, with United Forklift and Access Solutions planning about A$30 million of growth spending over the following 12 months. Project contractors and asset owners buy selectively, mostly for continuous plant work, since iSeekplant lists 45-foot hire near A$400 a day and steady use can justify ownership.
How far has battery power moved into diesel territory?
Based on technology, the market is categorized into diesel-powered systems, battery-electric systems and hybrid systems. Diesel-powered systems led with 66.0% of 2025 value because rough ground still favors engines, and the diesel Sinoboom AB10J landed in Australia in 2024 with 40% gradeability and 4WD. Battery-electric systems grow fastest at 8.56% a year as electric and hybrid construction equipment reaches outdoor sites, shown by Skyjack delivering SJ45 AJE+ and SJ60 AJE+ machines to Height 4 Hire on Jan. 28, 2025. Hybrid units fill smaller niches, including a 12-meter Snorkel towable listed for A$285 a day in Brisbane by OnlyAg.
| Segment Group | Leading Sub-segment | Share, 2025 | Fastest-growing Sub-segment | CAGR, 2026–2035 |
|---|---|---|---|---|
| By Product Type | Articulating boom lifts | 47.0% | Telescopic boom lifts | 6.61% |
| By End-Use Industry | Construction and infrastructure | 52.0% | Utilities and facilities services | 6.93% |
| By Customer Type | Rental fleet owners | 63.0% | Rental fleet owners | 6.32% |
| By Technology | Diesel-powered systems | 66.0% | Battery-electric systems | 8.56% |
Request a Free Sample
Fill in your details and we'll send you a free sample report.
- Sample data tables & charts
- Research methodology
Public pipelines and mine sites keep booms working
Infrastructure work packages keep medium booms on site
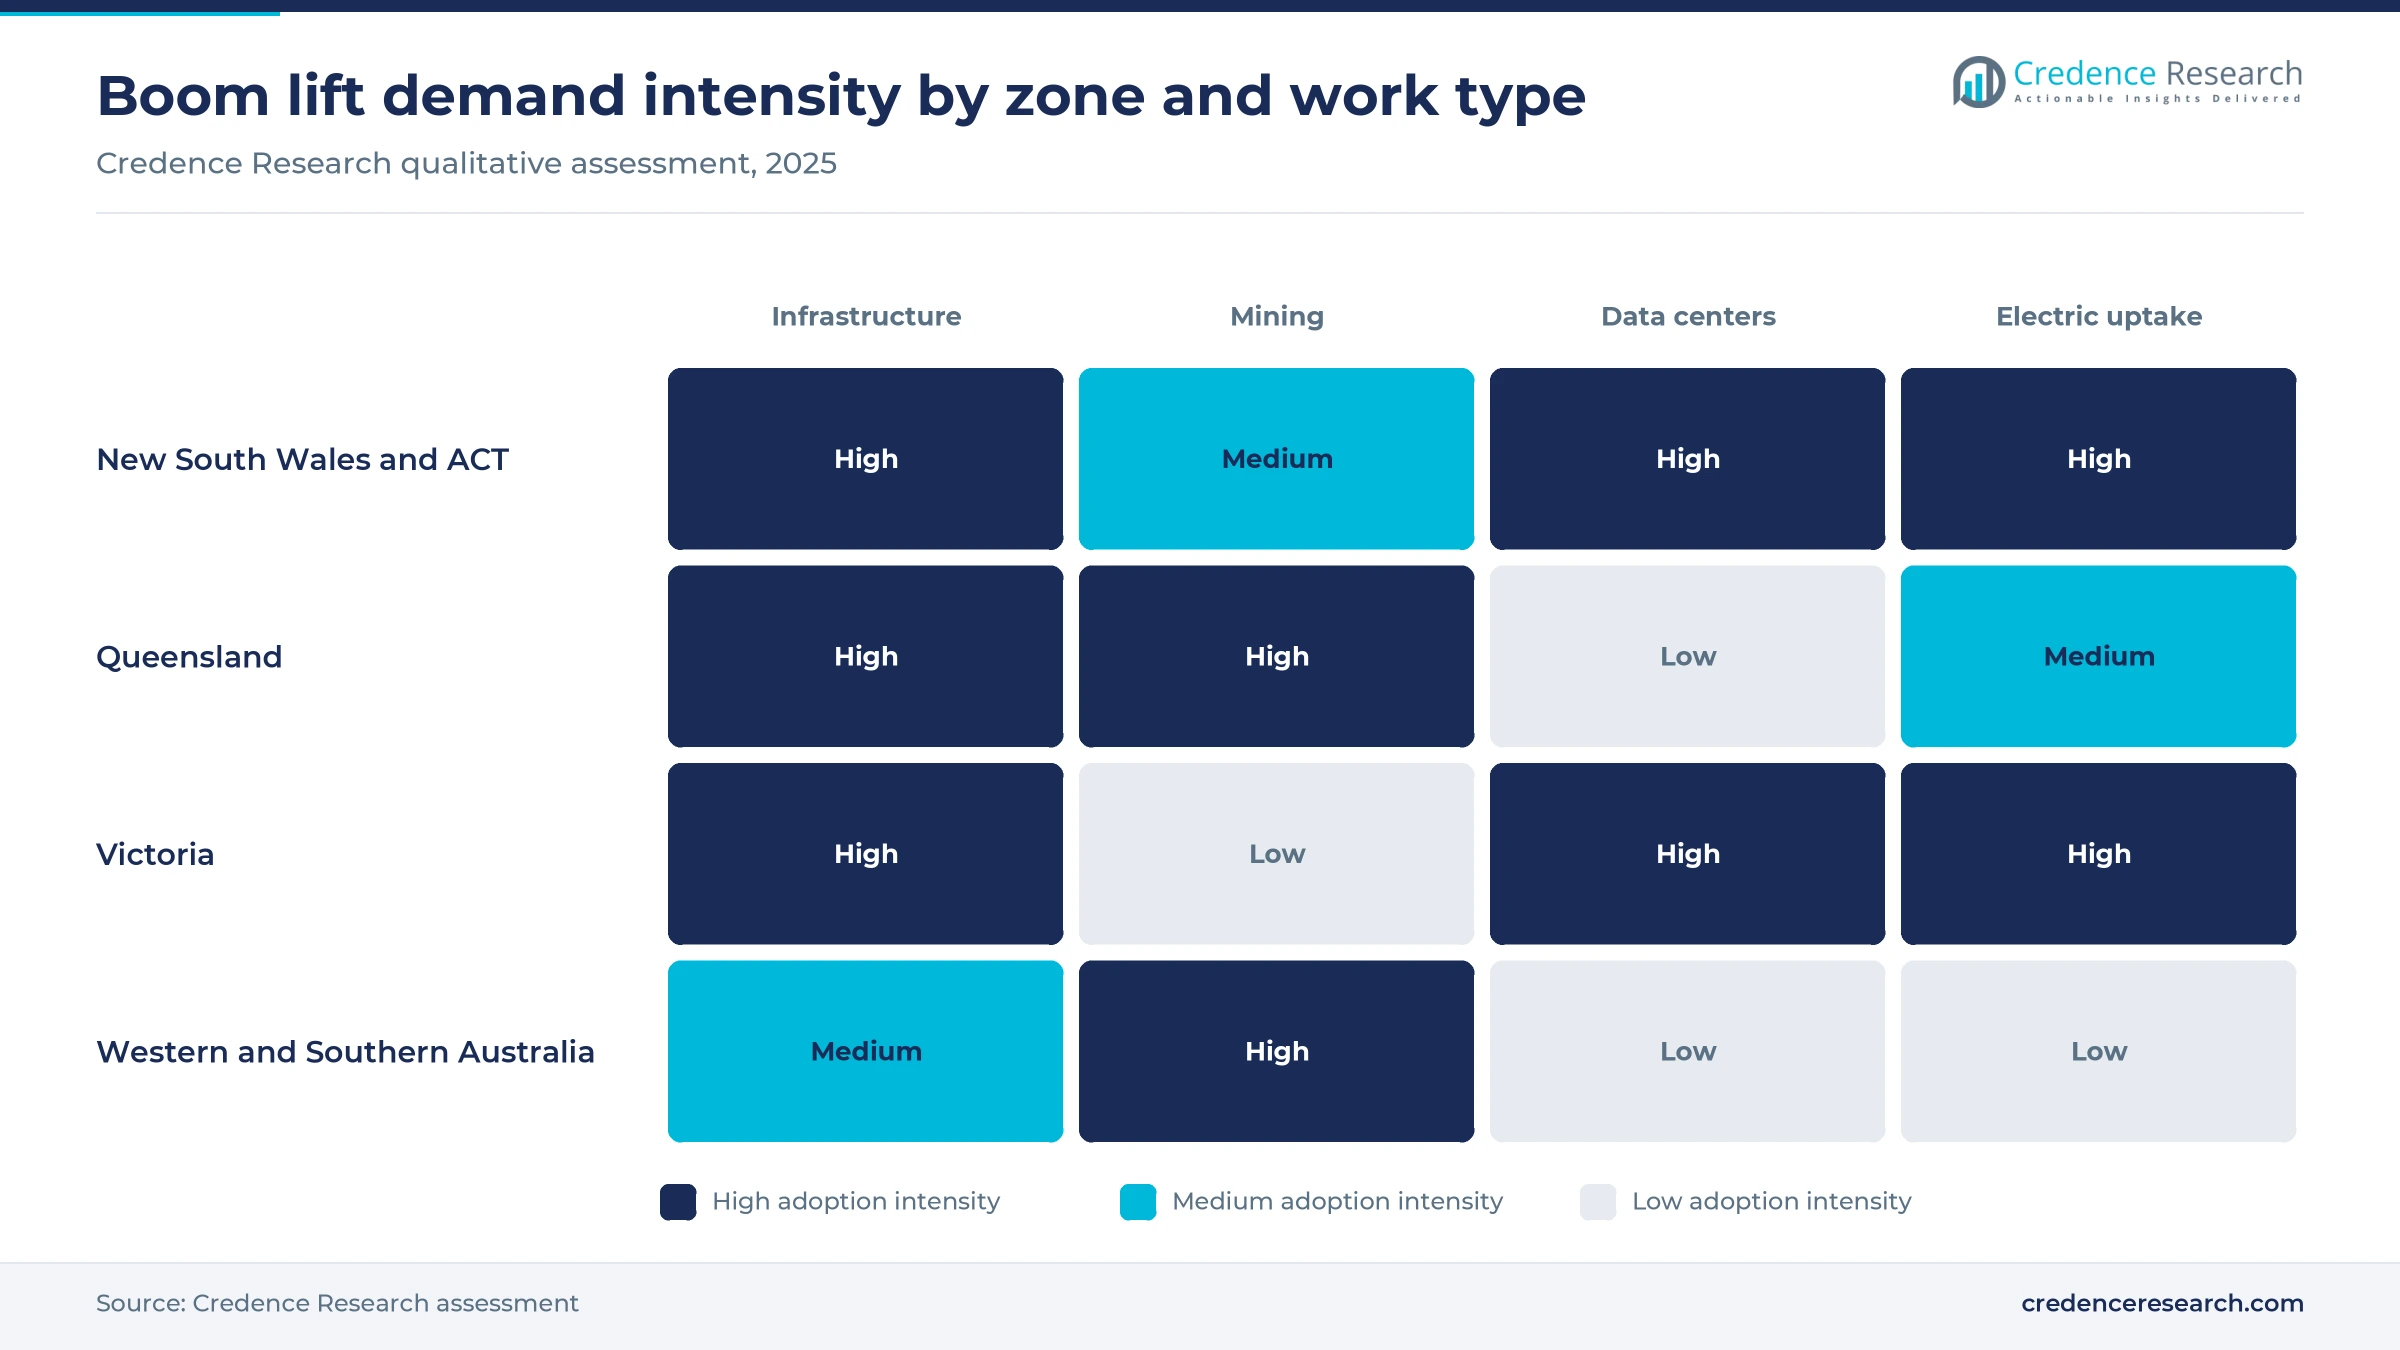
Infrastructure programs lift boom demand because bridges, stations and transmission assets are delivered as long sequences of work at height. Infrastructure Australia reported an A$242 billion five-year pipeline on Nov. 13, 2025, up A$29 billion in a year and the highest since tracking began. Transport accounts for A$129 billion of that total, while building projects, including social housing, reach A$77 billion. Utilities work such as energy transmission is also projected to more than double to A$36 billion. Coates group manager Dan Goodfellow told Access International in February 2024 that large projects may now run to about 2029 rather than 2026, which extends hire periods. As a result, construction and infrastructure held 52.0% of 2025 value.
Recurring industrial access supports demand beyond project cycles
Mines and processing plants need access every year for shutdowns, conveyors and fixed plant, so this demand is less tied to one construction peak. Australian Mining reported that the 2025 federal major projects list recorded 432 projects, with committed projects rising from 62 to 65 and valued at A$62 billion. Coates keeps a dedicated branch at the Roxby Downs mine in South Australia, according to Access International, and top-tier large projects including mining make up about 85% of its business. United Rentals lists Alfasi Hire branches in Karratha and Mackay, along with MDG15 and BMA mine specifications across its access range. These local specifications matter because a standard machine may not be accepted on site. Mining and resources therefore remain the second-largest end use in this market.
Electric equipment is moving into outdoor applications
Battery machines are expanding from indoor work into outdoor and mixed-use jobs, which widens the applications open to electric booms. Skyjack delivered battery-powered SJ45 AJE+ and SJ60 AJE+ machines to Height 4 Hire in Brisbane on Jan. 28, 2025, with working heights of 15.7 and 20.1 meters. Hire & Rental News reported in July 2023 that Coates had received A$20 million of Greener Choices equipment, with another A$30 million awaiting delivery. Its customers hold emission targets for 2030 and 2040, according to Access International. The OECD said on Jan. 21, 2026 that net zero by 2050 requires a strategy for transport emissions, so pressure on site fuel use is likely to persist. Battery-electric systems consequently grow at 8.56% a year across the forecast period.
Inspection rules turn aging fleets into replacement orders
Scheduled inspection rules create replacement demand that does not depend on new project starts. The Safe Work Australia model code of December 2025 says machines should have a major inspection after 10 years of service and every five years thereafter, along with periodic inspections at least annually. Coates applies a hard 10-year fleet limit and sells older units overseas, according to Access International in February 2024. The same article reported that Coates spent more than A$100 million in two years and cut average machine age from about eight years to about six. United Forklift and Access Solutions budgeted about A$15 million for replacement within A$45 million of annual spending. These habits keep orders flowing through softer years and support 63.0% of value for rental owners.
Fleet buying is moving toward scale and new suppliers
Shift toward a third, Chinese supply source
Australian fleet buyers are adding Chinese suppliers to their approved lists, which changes pricing and service expectations. Coates targets one major American, one European and one Chinese supplier, and Dan Goodfellow told Access International in February 2024 that Chinese quality is now equal, though local service support still needs development. Sinoboom runs its own subsidiary in Melbourne, and KHL reported on Sept. 9, 2024, that a further AB10J consignment had left Changsha for it after a first delivery in March. The machine carries a 250-kilogram platform load, and general manager Mitch Ely described the order book as strong. This matters because Hire & Rental News reported in July 2023 that about 90% of Coates equipment comes from overseas. Local parts and technician coverage is becoming the main test for newer brands.
Rise of global owners in Australian access rental
Ownership of Australian access fleets is consolidating, so more purchasing decisions now sit with large groups. Hire & Rental News reported on Dec. 16, 2025, that United Rentals bought Alfasi Hire, a roughly 40-year-old aerial specialist serving construction and mining, after acquiring Shore Hire and Orange Hire in 2024. Alfasi lists more than 2,500 machines across brands including JLG, Genie and Haulotte. Sime Darby agreed on March 2, 2023, to buy Onsite Rental Group for A$635 million, gaining more than 30 branches and over 60,000 assets, according to the same publication. Kennards Hire added Top End Access Hire in Darwin in November 2022, creating its first access-only branch. Larger owners can order in volume, which raises the bar for smaller regional fleets.
Opportunity in data center construction and fit-out
Data center projects offer an opening for electric articulating booms because shells, mechanical plant and cable routes all need clean, quiet access. Master Builders NSW estimated in 2026 that New South Wales carried about A$11 billion of national data center construction in 2025, roughly two-thirds of the total, concentrated in Western Sydney. The same article cites Westpac estimating about A$15 billion of related work underway and a pipeline of A$75 billion to A$155 billion. The Australian Bureau of Statistics reported non-residential building work up 11.5% in the year to the June 2026 quarter. Suppliers holding indoor-rated booms with long outreach near Sydney and Melbourne can target these fit-out packages directly.
Opening for high-reach hire in regional Queensland
Regional Queensland presents an opening for fleets able to place larger booms away from capital-city branches. The Queensland Government said on June 23, 2026, that it holds A$7.1 billion for Games venues to 2031-32, with A$348 million in 2026-27 for athlete village planning across Sunshine Coast, Gold Coast, Brisbane and Rockhampton. The Urban Developer reported in March 2026 a forecast of 6% cost growth for regional Queensland in 2026, the top of the national range, which signals tight contractor capacity. Skyjack noted that Global Hire and Services can support equipment from Bowen to Cape York. A fleet combining service coverage with 20-meter-plus machines could therefore win work before the main Queensland venue packages reach peak activity.
Labor, licensing and import costs limit fleet returns
Technician and operator shortages slow regional service
Skills shortages limit how many machines can be kept working, particularly away from capital cities. Infrastructure Australia estimated in November 2025 that the industry is about 141,000 workers short of its five-year pipeline needs. United Forklift and Access Solutions told Access International in February 2024 that servicing regional Australia is its biggest challenge, pushing it toward contractors. Rental owners feel this through longer downtime and higher service costs. Larger groups respond with hub-and-spoke workshops, though smaller fleets have fewer options.
Licensing and fall risks raise the cost of use
Safety duties add cost and planning time for every hire, particularly on machines above the licensing threshold. The December 2025 national model code requires a high risk work license for a boom of 11 meters or more. SafeWork NSW also reported a March 15, 2023, incident where a worker fell about 11 meters from a boom after a tree struck him. Contractors therefore carry training, rescue planning and supervision costs, while the code also directs duty holders toward secondary guarding assessments and emergency lowering training.
Construction cost pressure and softer engineering work
Cost inflation and uneven engineering activity can delay the packages that keep booms on hire. The Australian Bureau of Statistics reported engineering work done down 6.0% in the June 2026 quarter, and 5.1% lower than a year earlier. The Urban Developer reported in March 2026 a forecast of national building cost growth of 4% to 6% for 2026. Contractors affected by these pressures shorten hire periods or resequence work, so fleet owners rely more on mining and maintenance.
Import dependence exposes fleets to freight and lead times
Heavy reliance on overseas factories leaves buyers exposed to shipping swings and long order cycles. Goodfellow told Access International in February 2024 that container costs rose from about A$4,000 to A$5,000 before Covid to A$15,000 to A$20,000 at peak. Hire & Rental News reported in July 2023 that lead times had stretched by as much as six to 12 months. Smaller fleets feel this most, while larger owners place orders earlier and split purchases across several suppliers.
East coast work leads while Queensland grows fastest
| Region | Value, 2025 (USD million) | Share, 2025 | CAGR, 2026–2035 |
|---|---|---|---|
| New South Wales and ACT | 42.7 | 34.1% | 5.92% |
| Western and Southern Australia | 29.3 | 23.4% | 6.22% |
| Victoria | 29.2 | 23.3% | 5.92% |
| Queensland | 24.1 | 19.2% | 6.72% |
New South Wales and ACT lead on transport and data centers
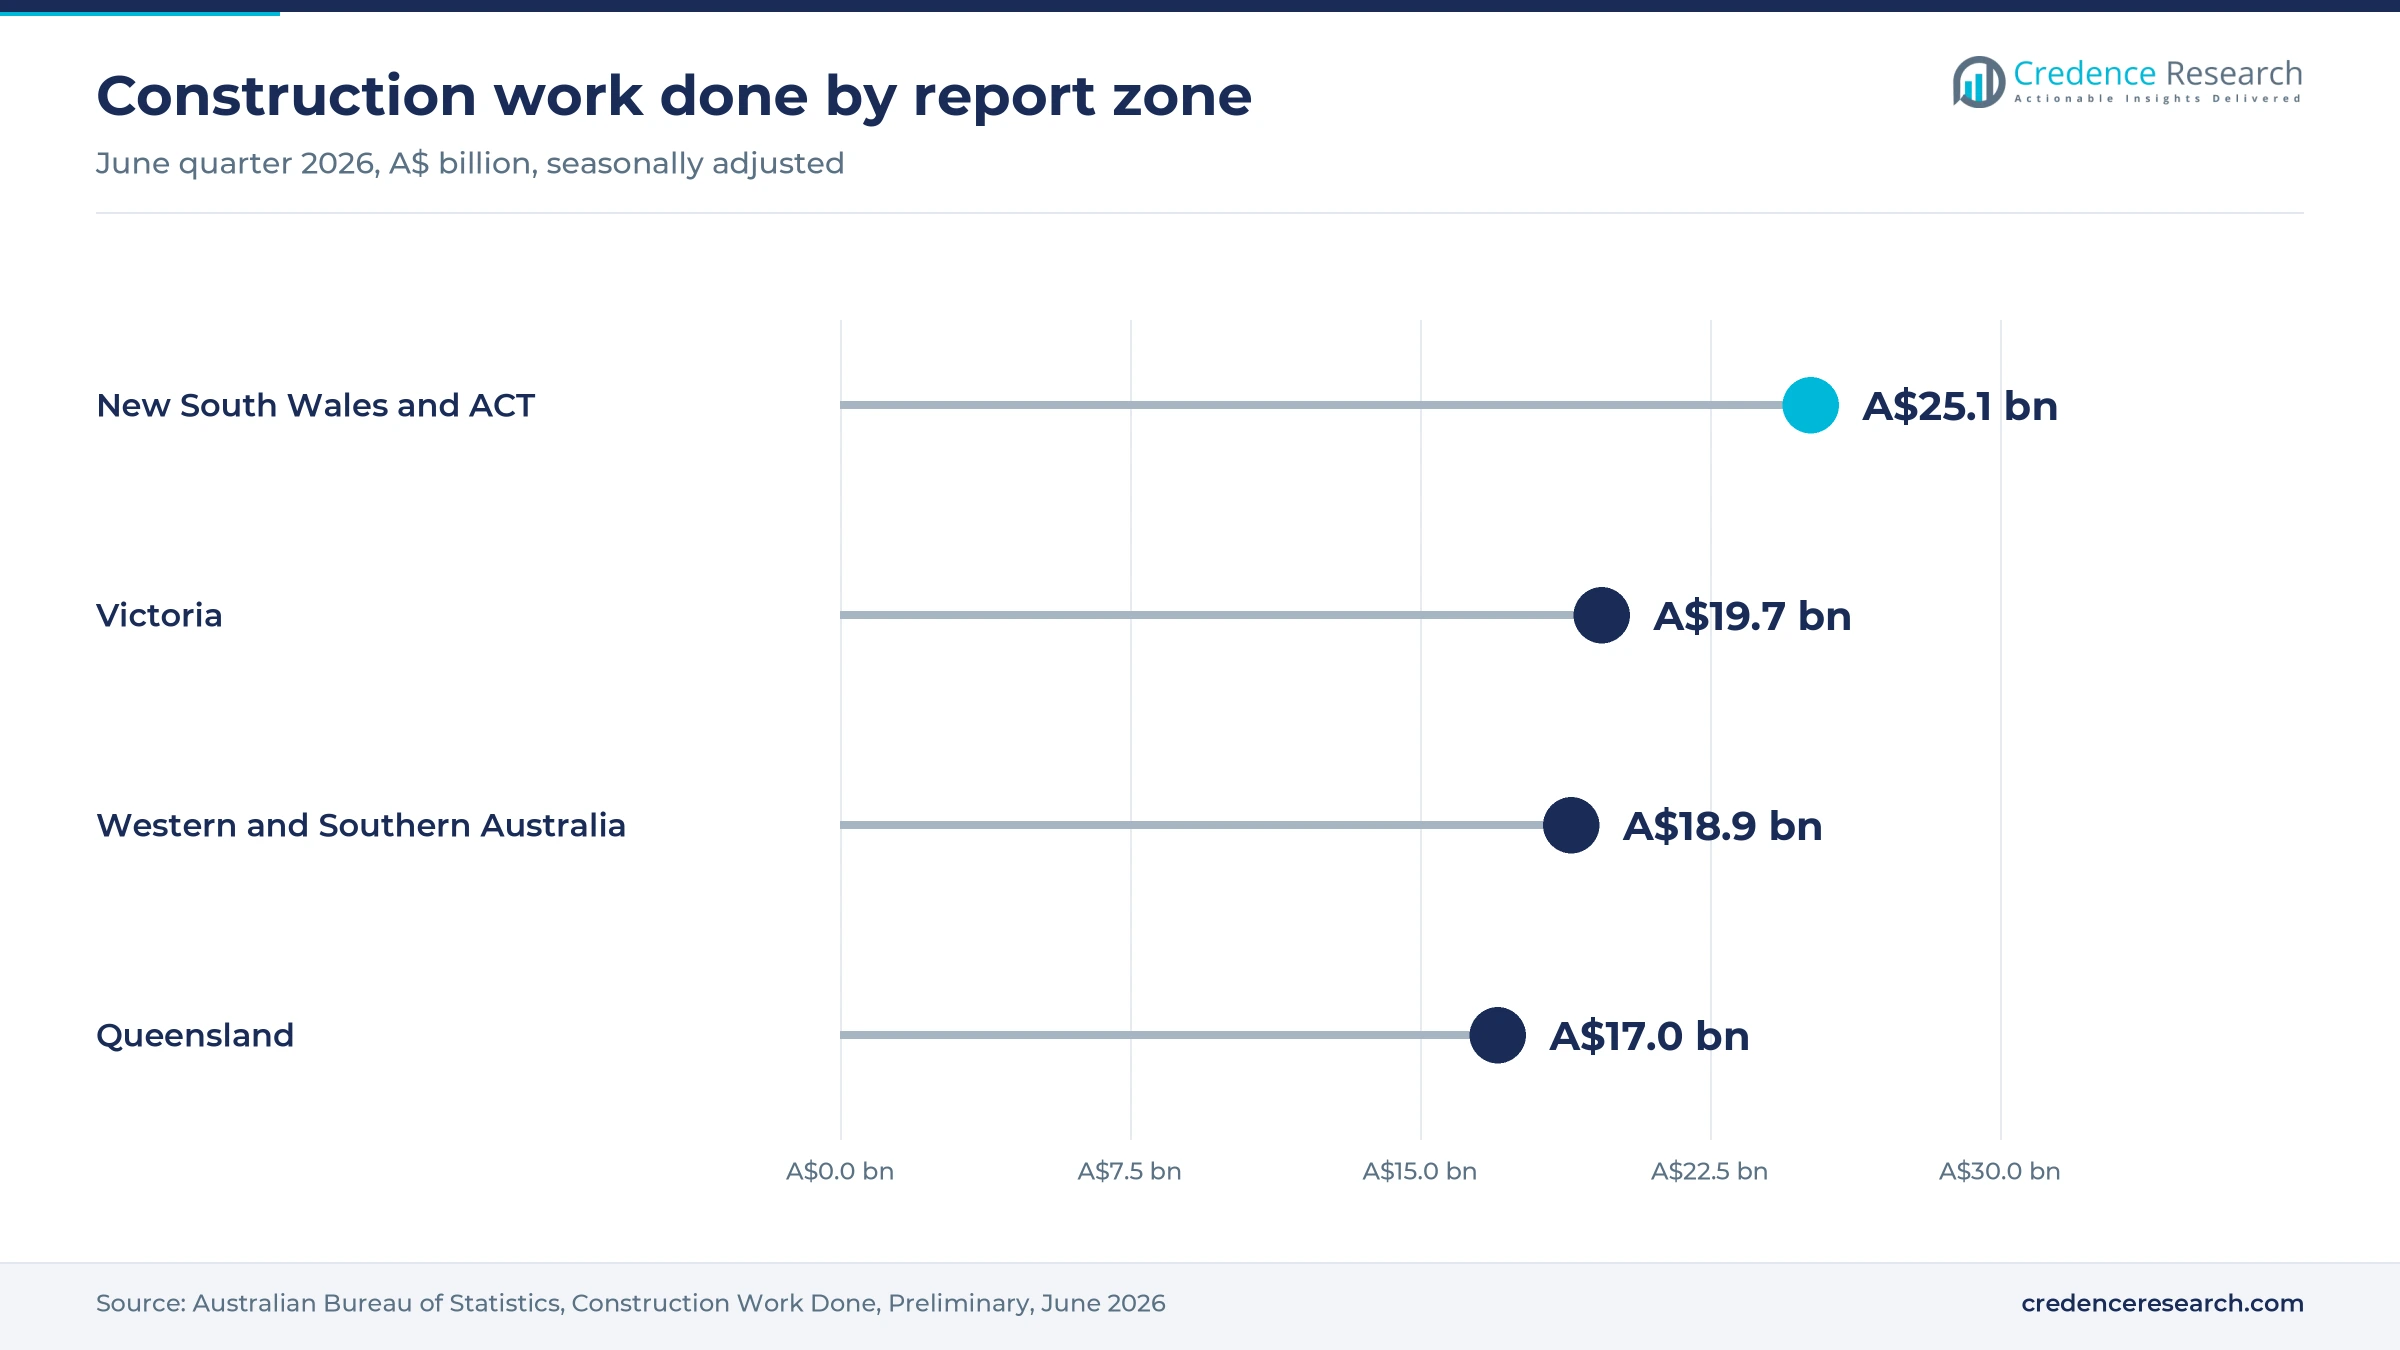
New South Wales and ACT held 34.1% of 2025 value and grow at 5.92% a year. The Australian Bureau of Statistics recorded about A$24.1 billion of construction work done in New South Wales and A$1.0 billion in the ACT in the June 2026 quarter, the largest zone total. Western Sydney adds data center work, with Sydney holding about 65% of national capacity and pipeline, according to Master Builders NSW. Credence Research expects indoor-capable articulating machines to gain share in this zone as a result.
Western and Southern Australia rely on mining sites
Western and Southern Australia held 23.4% of 2025 value and grow at 6.22% a year. The Australian Bureau of Statistics shows about A$13.3 billion of work done in Western Australia and A$5.6 billion in South Australia during the June 2026 quarter, with South Australia up 11.5% over the year. Mine sites shape fleet choices, as Coates serves Roxby Downs through a dedicated branch and Alfasi Hire runs a branch in Karratha. Diesel machines and mine-specification kits therefore remain common across this zone.
Victoria balances building activity and digital infrastructure
Victoria held 23.3% of 2025 value and grows at 5.92% a year. Construction work done reached about A$19.7 billion in the June 2026 quarter, up 5.8% on the previous quarter, according to the Australian Bureau of Statistics. The Urban Developer reported in March 2026 that Victoria and New South Wales were the strongest states for data center demand. Melbourne also hosts the Sinoboom Australia subsidiary, while Alfasi Hire operates in Hallam, which gives buyers there relatively short delivery and service routes.
Queensland grows fastest on Games and regional work
Queensland held 19.2% of 2025 value and grows the fastest at 6.72% a year. The Australian Bureau of Statistics recorded about A$17.0 billion of work done in the June 2026 quarter, up 7.9% over the year. The state government holds A$7.1 billion for Games venues to 2031-32, and The Urban Developer reported in March 2026 that Queensland is expected to lead medium-term activity. Height 4 Hire took Skyjack electric booms in Brisbane in January 2025, showing local fleet owners investing ahead of that program.
Recent fleet, supplier and safety code actions
| Development | Status and market relevance |
|---|---|
| In June 2026, the Queensland Government confirmed an A$7.1 billion provision for Games venues to 2031-32 and A$348 million for athlete village planning in 2026-27. | Budgeted; venue packages add medium-term high-reach demand |
| In December 2025, United Rentals acquired Alfasi Hire, an aerial rental specialist with more than 2,500 machines and branches in five locations. | Completed; expands a global owner in Australian access rental |
| In December 2025, Safe Work Australia published its model code for elevating work platforms, covering annual and major inspections, licensing and rescue planning. | Published; supports scheduled fleet replacement |
| In November 2025, Infrastructure Australia reported an A$242 billion five-year public pipeline and an estimated shortage of about 141,000 workers. | Published; sets the demand and labor backdrop |
| In January 2025, Skyjack delivered SJ45 AJE+ and SJ60 AJE+ battery-powered rough terrain booms to Height 4 Hire in Brisbane. | Delivered; extends electric machines onto outdoor sites |
Battery drive and guarding are changing machine choice
- Battery drive uses axle-based electric traction on Skyjack AJE+ models, which produce no site emissions and carry about 30 minutes of reserve for reaching a charger.
- Hybrid power pairs petrol and electric supply on towable units such as the 12-meter Snorkel MHP13AT, giving trailer fleets a choice between grid charging and engine running.
- Active oscillation helps the Sinoboom AB10J keep wheels loaded on uneven ground, supporting its 40% gradeability and suiting rough sites outside metropolitan centers.
- Secondary guarding protects operators from overhead or adjacent structures under the December 2025 code, though a risk assessment must check any effect on design registration.
Need a Custom Version of This Report?
Tailor the scope, geography, or segments to your exact requirements.
- Custom geography or segment scope
- Direct access to our analyst team
National hire groups buy from global manufacturers
Competition splits between national rental groups and the manufacturers that supply them. Coates is the largest fleet owner, with a fleet value nearing A$2 billion and about 8,000 access units reported in February 2024, and it plans one American, one European and one Chinese supplier. United Forklift and Access Solutions runs about 3,000 aerial platforms, while Kennards Hire reported about 2,000 access units in March 2022 through a wide branch network. Onsite Rental Group focuses on resources, energy and industrial customers under Sime Darby ownership. Among manufacturers, Genie, JLG and Haulotte held large shares according to an October 2020 KHL country report, while Skyjack and Sinoboom have since moved on electric and compact articulating models across the wider mobile elevating work platform category. Service coverage, machine availability and mine specification approval generally decide contracts more often than list price.
Companies profiled and their roles in this market
| Company | Type | Role in the market |
|---|---|---|
| Coates | Rental fleet owner | Largest national rental fleet, about 8,000 access units, with a branch at Roxby Downs |
| Kennards Hire | Rental fleet owner | Family-owned branch network with an access-only branch in Darwin and a 54.8-meter Genie |
| Onsite Rental Group | Rental fleet owner | Sime Darby-owned hire group serving resources, energy and industrial customers |
| United Forklift and Access Solutions | Rental fleet owner | About 3,000 aerial platforms, with growth planned on the East Coast |
| JLG Industries | Manufacturer | Major brand in national fleets and stocked by Alfasi Hire |
| Genie | Manufacturer | Major brand; supplies the SX180 used at the Kennards Darwin branch |
| Haulotte | Manufacturer | Major brand; Haulotte Australia delivered over 400 machines to Coates around 2018, including 20 articulating booms |
| Skyjack | Manufacturer | Delivered AS-certified electric rough terrain booms in Brisbane in January 2025 |
| Sinoboom | Manufacturer | Melbourne subsidiary importing AB10J compact articulating booms since 2024 |
Replacement cycles give demand a firmer floor
Credence Research's view is that the market has a firmer floor than project headlines suggest, because replacement under the 10-year inspection rule creates orders even when engineering work softens. Engineering work fell 6.0% in the June 2026 quarter, yet United Rentals had bought Alfasi Hire only six months earlier, in December 2025. Battery-electric machines carry the most uncertainty, since remote mine sites and rough ground still suit diesel. However, fleet owners that specify one electric articulating range for urban branches can test demand without abandoning engine machines. Service coverage in regional Queensland and Western Australia is likely to separate strong suppliers from weak ones.
How Credence Research built these estimates
The report uses 2025 as the base year and forecasts market value for 2026 to 2035 from the Credence Research model. Segment and regional splits and growth rates are Credence Research estimates, checked against ABS construction work done by state, fleet counts published by rental companies and trade press, and federal project lists. Sources used were government statistics, regulators, company releases and trade publications. No interviews or surveys were conducted in preparing this report.
Battery machines and Queensland work define the next decade
The market is projected to rise from USD 133.0 million in 2026 to USD 227.6 million by 2035 at a 6.15% CAGR. Transport work should remain the largest project source, while energy transmission and Queensland venue packages add new locations for high-reach machines. Battery-electric systems are likely to take a larger part of metropolitan fleets as more rough terrain models gain Australian certification. Replacement demand should also build as machines bought during the post-pandemic restocking approach their 10-year inspection point after 2030, which supports orders late in the forecast.
Frequently Asked Questions
How big is the Australia boom lifts market?
Which product type leads the market?
Which region holds the largest share?
Who buys most boom lifts in Australia?
What is driving demand for boom lifts?
How quickly are battery-electric boom lifts growing?
Do operators need a license to use a boom lift?
What are the main challenges for this market?
Table of Content
Chapter 1 Market Segmentation
- 1.1 Segmentation Framework
- 1.1.1 Product and Service Classification
- 1.1.2 Application and End-Use Classification
- 1.1.3 Technology and Solution Classification
- 1.1.4 Customer and Distribution Channel Classification
- 1.1.5 Geographic Segmentation
- 1.1.6 Market Segment Definitions and Boundaries
- 1.2 By Product Type
- 1.2.1 Articulating boom lifts
- 1.2.2 Telescopic boom lifts
- 1.2.3 Trailer-mounted boom lifts
- 1.3 By End-Use Industry
- 1.3.1 Construction and infrastructure
- 1.3.2 Mining and resources
- 1.3.3 Utilities and facilities services
- 1.3.4 Manufacturing
- 1.4 By Customer Type
- 1.4.1 Rental fleet owners
- 1.4.2 Project contractors
- 1.4.3 Asset-owning enterprises
- 1.5 By Technology
- 1.5.1 Diesel-powered systems
- 1.5.2 Battery-electric systems
- 1.5.3 Hybrid systems
Chapter 2 Introduction
- 2.1 Report Objectives and Scope
- 2.2 Product Definition and Industry Terminology
- 2.3 Market Inclusions and Exclusions
- 2.4 Research Process
- 2.4.1 Primary Research and Expert Interviews
- 2.4.2 Secondary Research and Source Review
- 2.4.3 Top-Down and Bottom-Up Estimation
- 2.4.4 Data Triangulation and Verification
- 2.5 Market Size Measurement Basis
- 2.5.1 2025: USD 125.3 million → 2035: USD 227.6 million
- 2.6 Historical and Forecast Reference Periods
- 2.6.1 Historical Period: 2018-2025
- 2.6.2 Base Year: 2025
- 2.6.3 Forecast Period: 2025-2035
- 2.7 Research Assumptions and Limitations
Chapter 3 Executive Summary
- 3.1 Market Snapshot and Key Findings
- 3.2 Base-Year Market Size, 2025
- 3.3 Forecast Market Size, 2035
- 3.4 Revenue and Volume Growth Outlook
- 3.5 Key Demand and Supply Indicators
- 3.6 Leading Market Segments
- 3.7 Fastest-Growing Market Opportunities
- 3.8 Regional Performance Highlights
- 3.9 Technology and Industry Transformation
- 3.10 Competitive Landscape Summary
- 3.11 Analyst View and Strategic Implications
Chapter 4 Australia Boom Lifts Market Trends and Developments
- 4.1 Historical Industry Development, 2018-2025
- 4.2 Recent Market Trends and Developments
- 4.3 Demand and Customer Behavior Trends
- 4.4 Technology and Product Innovation
- 4.5 Artificial Intelligence, Automation and Digitalization
- 4.6 Local Manufacturing and Supply Chain Realignment
- 4.7 Industry Partnerships, Mergers and Acquisitions
- 4.8 Sustainability and Circular Economy Developments
- 4.9 Government and Private Sector Investment Trends
- 4.10 Emerging Business Models and Commercialization
- 4.11 Industry Developments and Announcements
Chapter 5 Australia Boom Lifts Market Production, Supply and Demand Analysis
- 5.1 Demand Trend and Consumption Analysis, 2018-2025
- 5.2 Demand Forecast, 2025-2035
- 5.3 Production and Output Trend, 2018-2025
- 5.4 Production and Output Forecast, 2025-2035
- 5.5 Installed Capacity and Capacity Utilization
- 5.6 Company-Wise Production Plants and Statistics
- 5.6.1 Installed Production Capacity
- 5.6.2 Actual Production
- 5.6.3 Planned Capacity and Expansion Targets
- 5.7 Supply Chain Structure and Procurement Trends
- 5.8 Supply-Demand Gap and Bottlenecks
- 5.9 Import Dependence and Sourcing Structure
- 5.10 Contract Manufacturing and Outsourcing
- 5.11 Regional Supply and Demand Concentration
Chapter 6 Australia Boom Lifts Market Pricing Analysis
- 6.1 Pricing Structure and Measurement
- 6.2 Historical Pricing Trends, 2018-2025
- 6.3 Pricing Outlook, 2025-2035
- 6.4 Average Selling Price and Unit Economics
- 6.5 Pricing by Product and Market Segment
- 6.6 Geographic Pricing Differences
- 6.7 Key Input, Energy, Labor and Logistics Costs
- 6.8 Contract Pricing and Purchasing Models
- 6.9 Pricing Sensitivity and Competitive Positioning
- 6.10 Price, Margin and Profitability Implications
Chapter 7 Australia Boom Lifts Market Dynamics
- 7.1 Market Growth Drivers
- 7.1.1 Demand-Side Drivers
- 7.1.2 Technology and Innovation Drivers
- 7.1.3 Infrastructure and Investment Drivers
- 7.1.4 Regulatory and Policy Drivers
- 7.2 Market Restraints
- 7.2.1 Cost and Affordability Constraints
- 7.2.2 Technology and Adoption Barriers
- 7.2.3 Supply Chain and Operational Constraints
- 7.3 Market Challenges
- 7.3.1 Competitive Pressure and Margin Erosion
- 7.3.2 Skills, Infrastructure and Implementation Gaps
- 7.4 Emerging Market Opportunities
- 7.5 Market Dynamics Impact and Time-Horizon Assessment
Chapter 8 Australia Boom Lifts Value Chain Analysis
- 8.1 Industry Value Chain Overview
- 8.2 Upstream Suppliers and Critical Inputs
- 8.3 Technology and Component Providers
- 8.4 Manufacturing or Service Delivery
- 8.5 Distribution, Channel Partners and Integrators
- 8.6 Downstream Applications and End Users
- 8.7 Value Addition and Profit Pools
- 8.8 Vertical Integration and Outsourcing
- 8.9 Supplier Concentration and Risk
- 8.10 Supply Chain Localization and Resilience
Chapter 9 Australia Boom Lifts Market Regulations and Policies
- 9.1 Relevant Laws, Standards and Compliance Frameworks
- 9.2 Product, Service, Safety and Quality Requirements
- 9.3 Government Policies, Incentives and Subsidies
- 9.4 Imports, Exports and Trade Barriers
- 9.5 Public Procurement and Local Content Requirements
- 9.6 Environmental and Sustainability Compliance
- 9.7 Upcoming Policy Changes and Market Implications
Chapter 10 Australia Boom Lifts Market Hotspots and Opportunities
- 10.1 Market Opportunity Mapping and Growth Hotspots
- 10.2 High-Growth Applications and Customer Groups
- 10.3 Underserved Markets and White-Space Opportunities
- 10.4 Emerging Technology and Product Opportunities
- 10.5 New Capacity and Investment Hotspots
- 10.6 Market Entry and Expansion Opportunities
- 10.7 Distribution and Partnership Opportunities
- 10.8 Near-Term and Long-Term Commercial Potential
- 10.9 Opportunity Attractiveness and Execution Risks
Chapter 11 Australia Boom Lifts Market Outlook, 2025-2035
- 11.1 Market Size and Analysis
- 11.1.1 Revenue (Market Measurement: 2025: USD 125.3 million → 2035: USD 227.6 million)
- 11.1.2 Market Volume and Quantity Sold
- 11.1.3 Historical Market Size, 2018-2025
- 11.1.4 Base-Year Market Size, 2025
- 11.2 Market Forecast, 2025-2035
- 11.2.1 Revenue Forecast to 2035
- 11.2.2 Volume Forecast to 2035
- 11.2.3 CAGR and Year-on-Year Growth
- 11.2.4 Incremental Revenue Opportunity
- 11.3 Forecast Assumptions and Scenario Analysis
- 11.3.1 Base-Case Forecast
- 11.3.2 Optimistic and Conservative Scenarios
- 11.3.3 Technology, Pricing and Policy Sensitivities
- 11.4 Market Attractiveness and Growth Outlook
Chapter 12 Australia Boom Lifts Market Segmentation and Outlook
- 12.1 Segmentation Summary and Market Shares, 2025
- 12.2 Largest and Fastest-Growing Segments
- 12.3 By Product Type - Market Size and Forecast, 2025-2035
- 12.3.1 Segment Definition and Scope
- 12.3.2 Historical Market Size, 2018-2025
- 12.3.3 Revenue Forecast, 2025-2035
- 12.3.4 Volume Forecast, 2025-2035
- 12.3.5 Base-Year Market Share, 2025
- 12.3.6 Segment CAGR and Growth Drivers
- 12.3.7 Subsegment Market Size and Forecast
- 12.3.7.1 Articulating boom lifts
- 12.3.7.2 Telescopic boom lifts
- 12.3.7.3 Trailer-mounted boom lifts
- 12.3.8 Subsegment Pricing and Adoption Trends
- 12.3.9 Leading Suppliers and Competition
- 12.3.10 Regional Demand and Opportunities
- 12.4 By End-Use Industry - Market Size and Forecast, 2025-2035
- 12.4.1 Segment Definition and Scope
- 12.4.2 Historical Market Size, 2018-2025
- 12.4.3 Revenue Forecast, 2025-2035
- 12.4.4 Volume Forecast, 2025-2035
- 12.4.5 Base-Year Market Share, 2025
- 12.4.6 Segment CAGR and Growth Drivers
- 12.4.7 Subsegment Market Size and Forecast
- 12.4.7.1 Construction and infrastructure
- 12.4.7.2 Mining and resources
- 12.4.7.3 Utilities and facilities services
- 12.4.7.4 Manufacturing
- 12.4.8 Subsegment Pricing and Adoption Trends
- 12.4.9 Leading Suppliers and Competition
- 12.4.10 Regional Demand and Opportunities
- 12.5 By Customer Type - Market Size and Forecast, 2025-2035
- 12.5.1 Segment Definition and Scope
- 12.5.2 Historical Market Size, 2018-2025
- 12.5.3 Revenue Forecast, 2025-2035
- 12.5.4 Volume Forecast, 2025-2035
- 12.5.5 Base-Year Market Share, 2025
- 12.5.6 Segment CAGR and Growth Drivers
- 12.5.7 Subsegment Market Size and Forecast
- 12.5.7.1 Rental fleet owners
- 12.5.7.2 Project contractors
- 12.5.7.3 Asset-owning enterprises
- 12.5.8 Subsegment Pricing and Adoption Trends
- 12.5.9 Leading Suppliers and Competition
- 12.5.10 Regional Demand and Opportunities
- 12.6 By Technology - Market Size and Forecast, 2025-2035
- 12.6.1 Segment Definition and Scope
- 12.6.2 Historical Market Size, 2018-2025
- 12.6.3 Revenue Forecast, 2025-2035
- 12.6.4 Volume Forecast, 2025-2035
- 12.6.5 Base-Year Market Share, 2025
- 12.6.6 Segment CAGR and Growth Drivers
- 12.6.7 Subsegment Market Size and Forecast
- 12.6.7.1 Diesel-powered systems
- 12.6.7.2 Battery-electric systems
- 12.6.7.3 Hybrid systems
- 12.6.8 Subsegment Pricing and Adoption Trends
- 12.6.9 Leading Suppliers and Competition
- 12.6.10 Regional Demand and Opportunities
- 12.7 Segment Growth Comparison
- 12.8 Segment Attractiveness and Priority Matrix
Chapter 13 Australia Boom Lifts End-Use and Application Market Outlook
- 13.1 End-Use Industry and Customer Demand Structure
- 13.2 Leading Applications and Customer Groups
- 13.3 End-Use Market Size, Share and Forecast
- 13.4 Major End-Use Industry Deep Dives
- 13.4.1 Customer Requirements and Use Cases
- 13.4.2 Demand and Replacement Cycles
- 13.4.3 Technical and Regulatory Considerations
- 13.4.4 Purchasing and Procurement Models
- 13.4.5 Leading Vendors and Distribution Channels
- 13.4.6 Forecast and Commercial Opportunities
- 13.5 Emerging Applications and Cross-Segment Demand
- 13.6 End-Use Industry Investment Priorities
Chapter 14 Australia Boom Lifts Geographic Market Outlook, 2025-2035
- 14.1 Domestic Market Distribution and Demand Clusters
- 14.2 State- or Province-Wise Market Size and Forecast, 2025-2035
- 14.3 City and Metropolitan Market Outlook
- 14.4 Industrial, Manufacturing and Commercial Clusters
- 14.5 Geographic Concentration of Key End Users
- 14.6 Local Pricing and Purchasing Differences
- 14.7 Domestic Production Facilities and Capacity Map
- 14.8 Local Infrastructure and Project Pipeline
- 14.9 State-Level Policy and Incentive Differences
- 14.10 Subnational Investment Hotspots and Opportunities
- 14.11 Distribution and Logistics Networks
- 14.12 Domestic Competitive Footprint
Chapter 15 Australia Boom Lifts Technology, Innovation and Sustainability Outlook
- 15.1 Technology Landscape and Maturity
- 15.2 Product, Process and Service Innovation
- 15.3 AI, Automation and Digital Tools in the Industry
- 15.4 Technology Adoption and Performance Benchmarking
- 15.5 Innovation Pipeline and R&D Investment
- 15.6 Patent and Intellectual Property Trends
- 15.7 Energy Efficiency and Resource Management
- 15.8 Sustainability, Recycling and Circularity
- 15.9 Technology Roadmap, 2025-2035
- 15.10 Risks of Obsolescence and Technology Substitution
Chapter 16 Australia Boom Lifts Market Key Strategic Imperatives
- 16.1 Growth and Market Entry Priorities
- 16.2 High-Return Products and Segments
- 16.3 Pricing, Profitability and Cost Optimization
- 16.4 Technology Investment and Product Differentiation
- 16.5 Supply Chain Localization and Resilience
- 16.6 Distribution and Customer Acquisition
- 16.7 Partnership, Acquisition and Capacity Strategy
- 16.8 Regional Expansion Priorities
- 16.9 Short-, Medium- and Long-Term Actions
Chapter 17 Competition Outlook
- 17.1 Industry Competition Characteristics
- 17.2 Market Structure and Concentration
- 17.3 Market Share and Competitive Positioning, 2025
- 17.4 Company-Wise Revenue and Product Benchmarking
- 17.5 Production and Service Capacity Benchmarking
- 17.6 Technology, Pricing and Differentiation
- 17.7 Regional Footprint and Distribution Strength
- 17.8 Mergers, Acquisitions and Strategic Alliances
- 17.9 New Entrants and Competitive Threats
- 17.10 Porter's Five Forces and Industry Attractiveness
- 17.11 Competitive Outlook, 2025-2035
Chapter 18 Company Profiles
- 18.1 Company Coverage and Selection Criteria
- 18.2 Coates
- 18.2.1 Business Description
- 18.2.2 Company Ownership and Geographic Presence
- 18.2.3 Product and Service Portfolio
- 18.2.4 Manufacturing and Operating Footprint
- 18.2.5 Production Capacity and Expansion Plans
- 18.2.6 Financial Performance and Investment
- 18.2.7 Market Share and Competitive Position
- 18.2.8 Technology and Innovation Capabilities
- 18.2.9 Strategic Alliances or Partnerships
- 18.2.10 Recent Developments
- 18.2.11 Growth Strategy and Outlook
- 18.3 Kennards Hire
- 18.4 Onsite Rental Group
- 18.5 United Forklift and Access Solutions
- 18.6 JLG Industries
- 18.7 Genie
- 18.8 Haulotte
- 18.9 Skyjack
- 18.10 Sinoboom
- 18.11 Other Relevant Market Participants
Note: Every listed company is profiled on the structure shown under the first company. The company list is preliminary and may change based on research findings, market developments, data availability and client requirements.
Chapter 19 Disclaimer
- 19.1 Research and Forecast Disclaimer
- 19.2 Data Source and Estimation Limitations
Note: The depth of individual sections depends on data availability for this market. Volume, capacity, trade and other unit-based metrics are included where applicable.

