
Few plants set Australia chlorine compressors demand
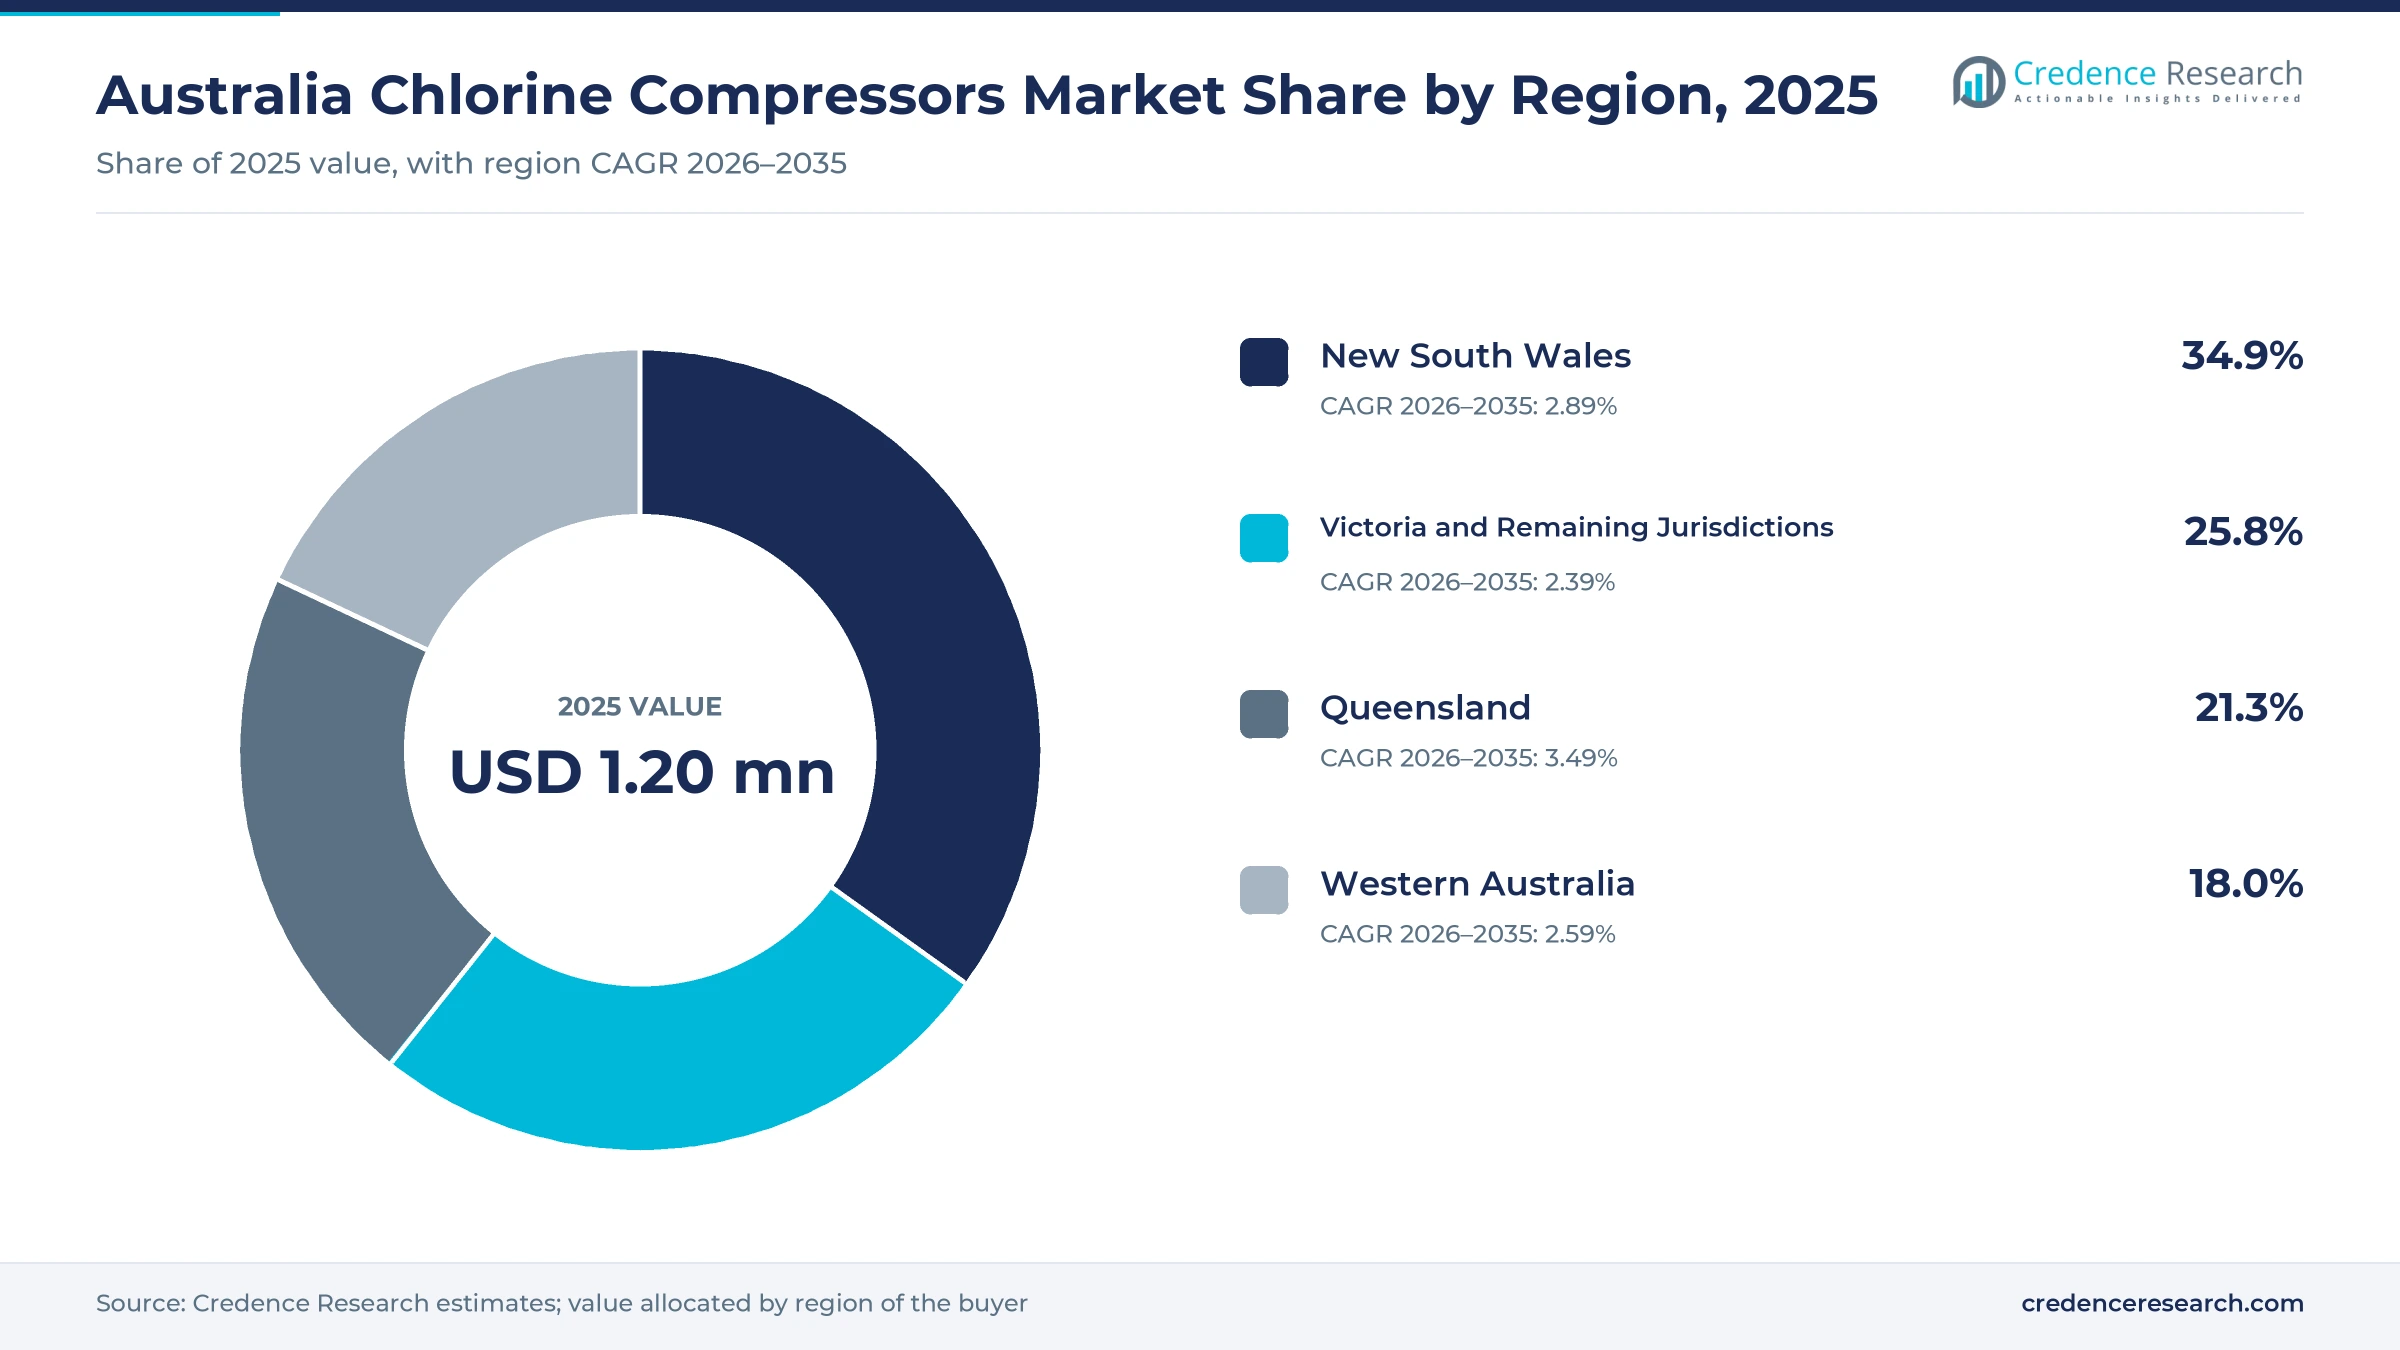
The Australia chlorine compressors market was valued at USD 1.20 million in 2025 and is projected to increase from USD 1.23 million in 2026 to USD 1.58 million by 2035, registering a CAGR of 2.84% during 2026–2035. Spending follows a very small group of chlor-alkali and liquefaction sites rather than broad industrial demand, so one plant decision can move a year of orders. New South Wales held the largest regional share, 34.9% in 2025, because the Botany complex compresses chlorine for acid, hypochlorite and ferric chloride production. Queensland is the fastest-growing region at 3.49% a year, supported by the Lytton drumming decision and the proposed Gladstone plant. The main commercial change is supply security, since drummed chlorine for Australian water authorities currently relies on a single Victorian liquefaction site. Replacement of aging trains and hazardous-service reliability keep service work steady between those project orders.
What does the chlorine compressor market in Australia actually count?
The estimate counts new compressor packages, overhauls, spare parts and service bought for wet or dry chlorine gas at Australian chlor-alkali, liquefaction and recovery duties. Machines are usually bought directly from the manufacturer or through an engineering contractor as part of a larger plant package, so annual orders are irregular.
Air compressors, refrigeration units, hydrogen compressors, vaporizers, chlorinators and chlorine product sales are excluded from the count. Water utilities that only receive drums or cylinders do not buy these machines, so the end-use split follows the chlorine stream that each compressor ultimately serves.
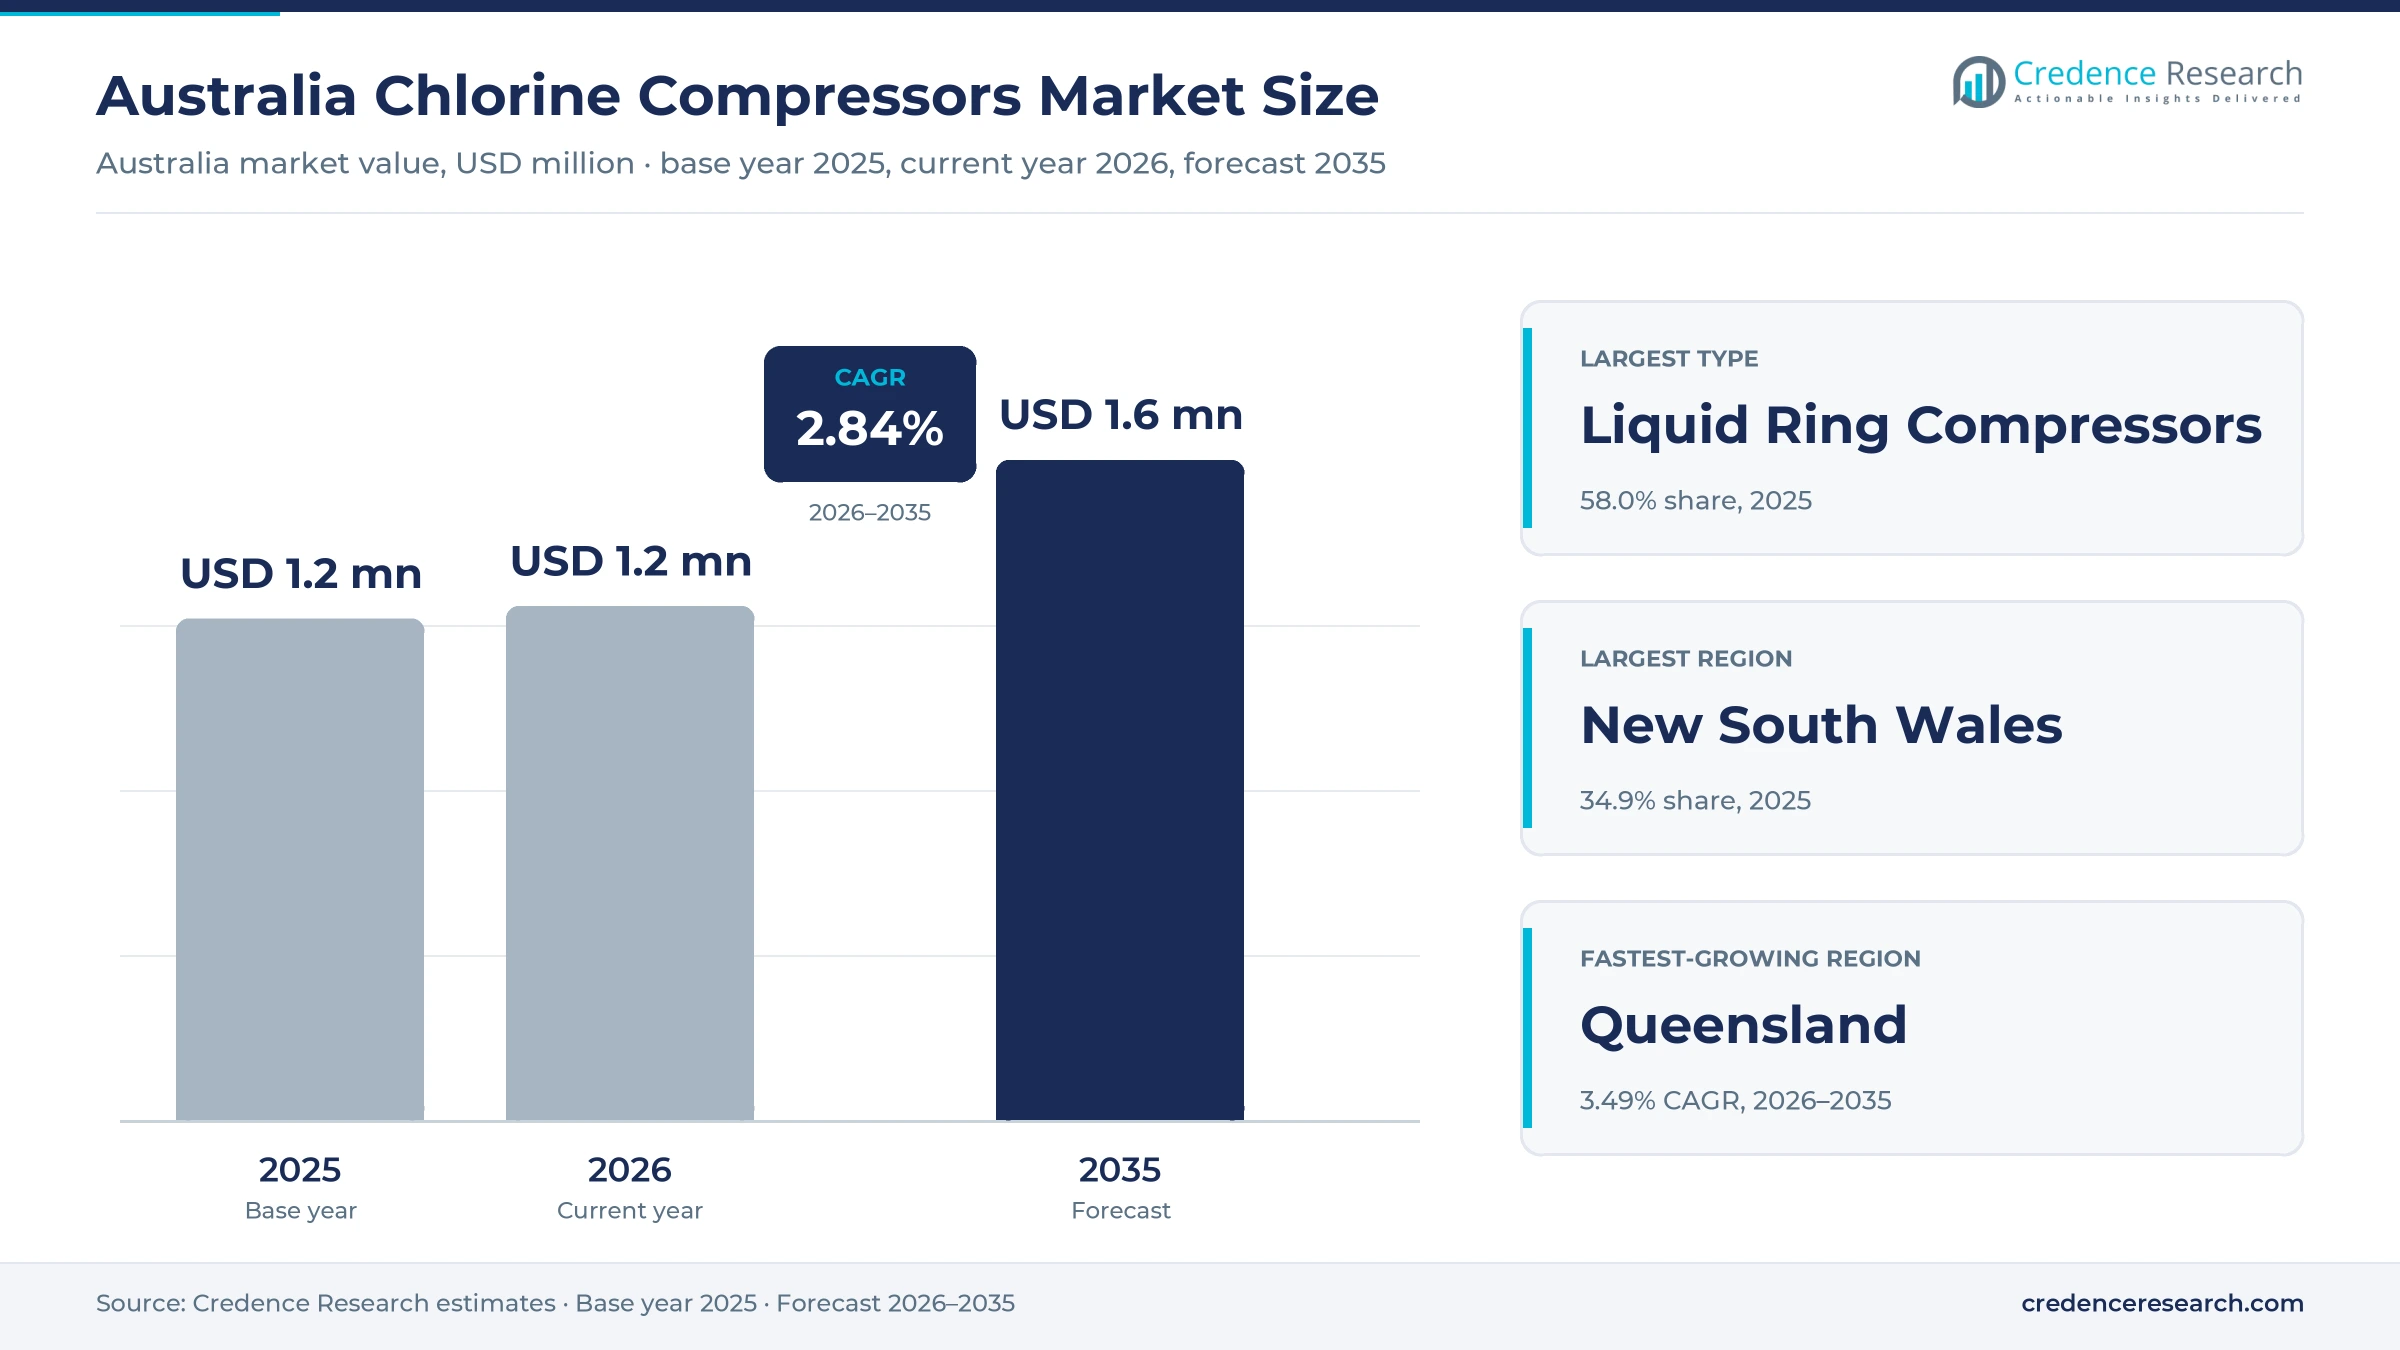
Australia Chlorine Compressors Market Insights
- The market moves from USD 1.20 million in 2025 to USD 1.58 million by 2035 at a 2.84% CAGR, a small base where single plant orders shape individual years.
- New South Wales held 34.9% of 2025 value, reflecting the Botany complex, while Queensland grows fastest at 3.49% a year on Lytton and Gladstone project activity.
- Liquid Ring Compressors led with 58.0% of 2025 value, a position consistent with the sulfuric acid sealed machine that IXOM describes at Botany.
- Coogee decided on July 20, 2026, to build chlorine drumming at Lytton, which would reduce reliance on the single Victorian liquefaction source for regional water supplies.
- QIC committed up to A$30 million to Project Halogen in October 2025, adding a planned independent chlorine producer and a new buyer of compression equipment.
Liquid ring machines and captive duty hold the value
Why do liquid ring machines hold the largest share?
Based on product type, the market is categorized into liquid ring compressors, centrifugal compressors and reciprocating and diaphragm compressors. Liquid Ring Compressors led with 58.0% of 2025 value because wet-chlorine duty suits them, and the published process description for the IXOM Botany plant specifies a rotary liquid ring machine sealed with sulfuric acid. Reciprocating and Diaphragm Compressors grow fastest at 3.60% a year as lower-volume liquefaction work expands, with Coogee deciding on July 20, 2026, to add drumming at Lytton from spare chlorine capacity. Sundyne lists chlorine gas among its centrifugal applications, although no Australian placement is public.
Which chlorine streams account for most compressor spending?
Based on end-use industry, the market is categorized into chlor-alkali manufacturing, water and wastewater treatment, mining and mineral processing, and pharmaceutical and specialty chemical manufacturing. Chlor-Alkali Manufacturing led with 62.0% of 2025 value because compression sits inside the electrolysis complexes, including Botany, where IXOM lists chlorine capacity of 90 metric tons a day. Water and Wastewater Treatment grows fastest at 3.71% a year as the IXOM Laverton plant is the only Australian site liquefying and packaging chlorine for water authorities, the exact gap that the Botany and Lytton projects target with new capacity.
How does captive chlorine use shape the application mix?
Based on application, the market is categorized into liquefaction feed compression, process gas transfer and chlorine gas recovery. Process Gas Transfer led with 52.0% of 2025 value because most gas moves directly into derivatives, as Botany does for hydrochloric acid, sodium hypochlorite and ferric chloride. The United States Environmental Protection Agency estimated 68% captive use of American chlorine output in 2022, which offers a comparable pattern. Liquefaction Feed Compression grows fastest at 3.64% a year as IXOM targets completion of its Botany liquefaction project by 2027, having liquefied chlorine there in the past.
Why do chlorine buyers mostly purchase directly from manufacturers?
Based on sales channel, the market is categorized into direct OEM sales, authorised distributor sales and independent engineering and service sales. Direct OEM Sales led with 56.0% of 2025 value because each machine is specified around seal liquid and materials, and NASH guidance separates nodular cast iron at low pressure from 316L or HC276 stainless at high pressure. Independent Engineering and Service Sales grows fastest at 3.41% a year as older trains age, since Coogee reports that Kwinana began operating in 1991 and commissioned its second chlorine train in early 2010.
| Segment Group | Leading Sub-segment | Share, 2025 | Fastest-growing Sub-segment | CAGR, 2026–2035 |
|---|---|---|---|---|
| By Product Type | Liquid Ring Compressors | 58.0% | Reciprocating and Diaphragm Compressors | 3.60% |
| By End-Use Industry | Chlor-Alkali Manufacturing | 62.0% | Water and Wastewater Treatment | 3.71% |
| By Application | Process Gas Transfer | 52.0% | Liquefaction Feed Compression | 3.64% |
| By Sales Channel | Direct OEM Sales | 56.0% | Independent Engineering and Service Sales | 3.41% |
Request a Free Sample
Fill in your details and we'll send you a free sample report.
- Sample data tables & charts
- Research methodology
Replacement, water supply and plant safety fund the spending
How does installed-base replacement anchor annual spending?
The fleet is small, aging and cannot safely run to failure, which keeps overhaul budgets recurring. Coogee reports that its Kwinana plant began operating in 1991 and commissioned a second chlorine train in early 2010, so its oldest equipment has passed three decades of service. Western Australia's Environmental Protection Authority records a 1997 proposal for that plant to reach 42,000 metric tons of chlorine a year, with storage rising from 50 to 150 metric tons. IXOM's Botany description adds that compression depends on two drying towers and a sulfuric acid system, which makes seals and rotors recurring wear items. As a result, overhauls and like-for-like machines keep caustic soda producers buying even in years without new capacity.
Why does water infrastructure renewal lift liquefaction duty?
Disinfection depends on drums reaching regional systems without interruption, which puts packaged liquid chlorine at the center of supply planning. IXOM states that Laverton is currently the only Australian site liquefying and packaging chlorine for water authorities, and that Botany would add a second site with about 3 to 4 extra trucks a week. The Australian Bureau of Statistics counted 27.8 million residents at Dec. 31, 2025, up 1.5% in a year, which keeps treated volumes growing. IPART's May 2025 draft also proposed Sydney Water prices for Oct. 1, 2025, to June 30, 2030, adding an average A$61 a year to typical bills. Consequently, liquefaction feed spending grows ahead of the wider market.
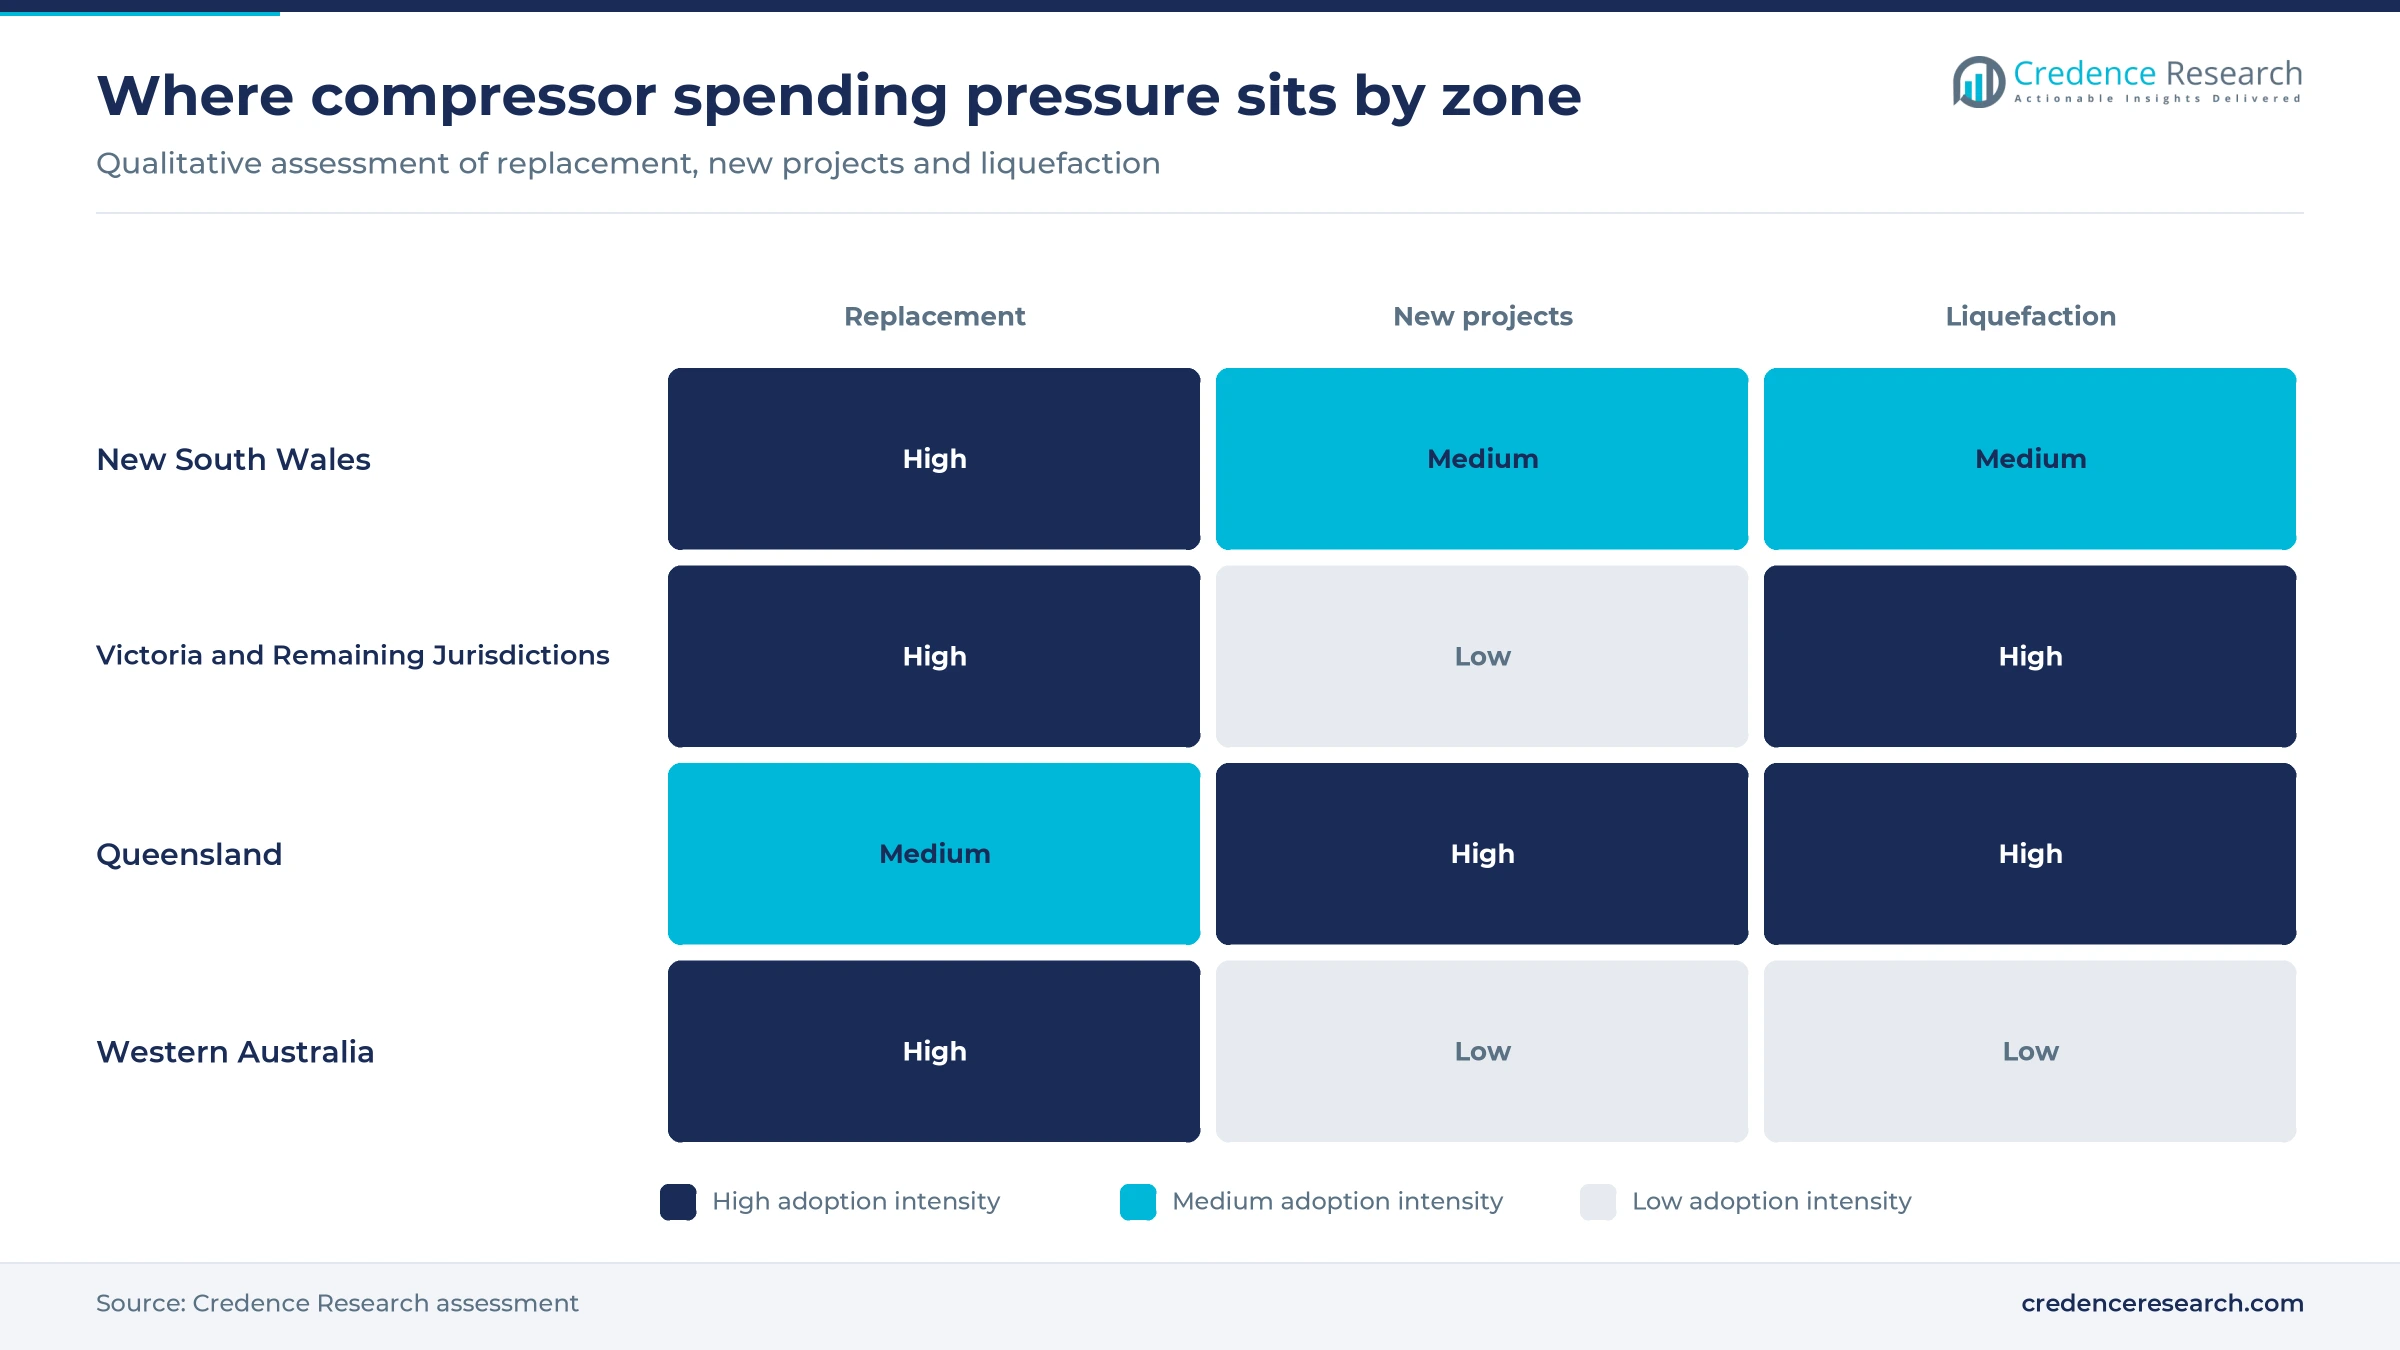
What makes hazardous-service reliability a purchasing priority?
Reliability drives purchasing because a chlorine release carries regulatory and community consequences that outweigh machine cost. Workplace Health and Safety Queensland sets a major hazard threshold of 25 metric tons for chlorine, with a 10% threshold quantity of 2.5 metric tons, and it names larger water treatment plants as an example. IXOM reports that its Botany emergency scrubber is designed for at least 10 minutes of full chlorine production during an upset, so compressor trips feed directly into safety cases. AS/NZS 2927:2019 further governs storage and handling of liquefied chlorine in Western Australia through Resources Safety. These obligations favor proven seals, spare machines and documented maintenance, and support Direct OEM Sales at 56.0% of 2025 value.
How do new chlor-alkali projects add compression demand?
New plants add the largest single orders because each one requires its own cooling, drying and compression train. Grenof Water Technologies' November 2025 planning report describes Project Halogen at Yarwun producing about 90 metric tons a day of liquefied chlorine and about 100 metric tons a day of caustic soda for Rio Tinto Yarwun, and it names chlorine compressors as a noise source. Gladstone News reported on June 15, 2026, that the Coordinator-General had approved the A$150 million development. Coogee separately announced its drumming investment at Lytton in Queensland in July 2026. Together these projects support above-average growth for Queensland, although final investment decisions remain the key uncertainty.
A second liquefaction site changes how chlorine moves
Shift toward a second domestic liquefaction source
Australia is moving away from a single liquefaction source, which changes where liquefaction machines will be installed. Coogee said on July 20, 2026, that drummed supply depends heavily on one Victorian source and that Lytton would add a domestic option, while also supplementing its imported drums for Western Australia and Far North Queensland. IXOM held community sessions on June 3 and 4, 2025, for its Botany project, which needs about 12 months of construction. A further source would come from Gladstone if Project Halogen proceeds as planned. In turn, liquefaction feed compression becomes a multi-site duty rather than one Victorian installation, and Liquefaction Feed Compression reaches 3.64% annual growth.
Rising use of on-site hypochlorite at smaller water sites
Smaller water systems are shifting from gas toward on-site generation, which narrows the long-run drum market that liquefaction serves. Centurion reported in September 2025 that WestWater had replaced chlorine gas systems with electrochlorination at Northern Territory facilities including Nhulunbuy, after about two and a half years of work. A 2026 Water Industry Operators Association paper reported trials at Yarra Valley Water and Coliban Water with 100% fewer chemical deliveries, and it put storage and delivery at about 60% of secondary chlorinator cost. TRILITY also describes four electrochlorination buildings at a Pilbara mine, designed to produce 5 kg/h of sodium hypochlorite. These systems raise demand for sodium hypochlorite equipment rather than for gas compression.
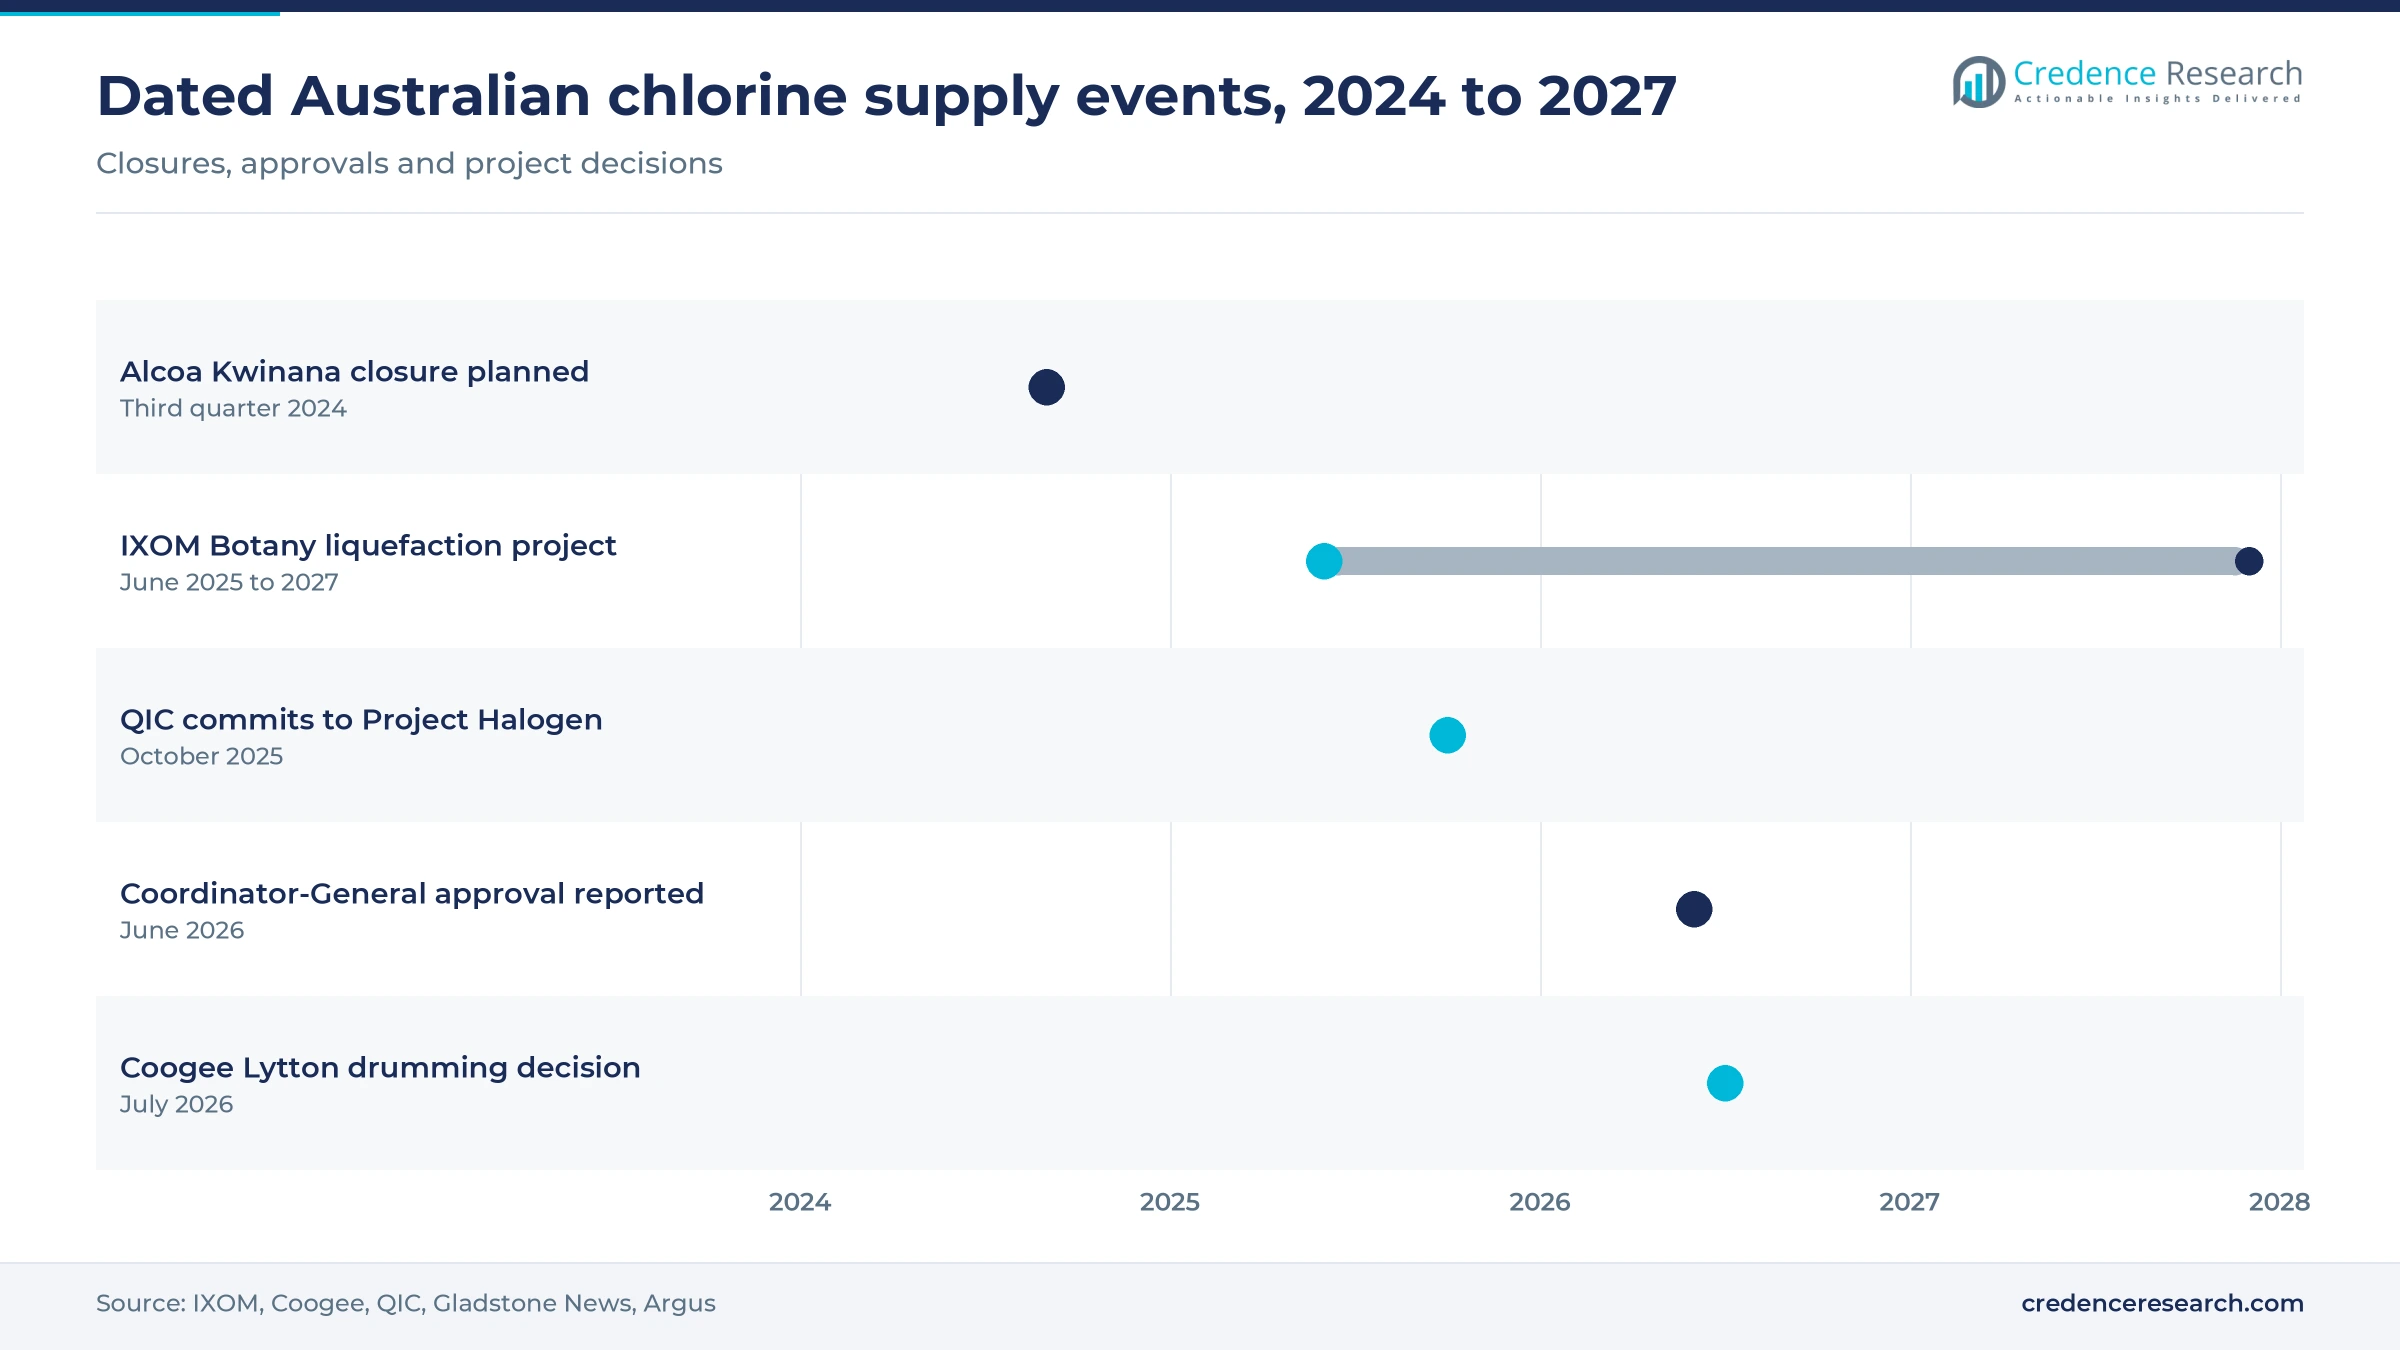
Opportunity in equipment packages for Project Halogen
Project Halogen is the clearest opening for suppliers because a greenfield plant buys complete compression packages rather than spares. QIC said on Oct. 15, 2025, that its fund would commit up to A$30 million, starting with A$5 million toward a final investment decision and taking a 50% shareholding, with completion planned for 2028. The same announcement put output at up to 160,000 metric tons of chemicals a year and cited Australian imports above three billion liters of caustic soda annually. Process Online reported Grenof's claim of 25% lower electricity use than current Australian plants. Vendors able to qualify early therefore have a defined opportunity before 2028.
Opportunity in connected monitoring and regional service
Service providers have an opening because chlorine sites sit far apart and benefit from earlier warning of seal or acid problems. Atlas Copco lists service coverage across 13 Western Australian locations including Bunbury, and it names SMARTLINK remote monitoring in its mining offer. Coogee's three chlor-alkali facilities span the Perth metro area, the Bunbury region and Brisbane, so a single owner already needs support across two states. Adapting machine condition monitoring to hazardous duty could also shorten callouts at Botany, which employs about 60 people according to IXOM. As a result, Independent Engineering and Service Sales grow at 3.41% a year.
Thin volumes, power costs and safety rules limit buyers
How do very few buyers limit supplier economics?
Few sites ever order a machine, which weakens the case for dedicated local specialists. Coogee describes itself as the second-largest Australian chlor-alkali producer with only three facilities, and Queensland had just one such plant when Coogee announced its Lytton expansion in July 2014. Consequently, a chlorine specialist can wait years between local orders, which discourages dedicated Australian inventories. Suppliers usually respond by serving this work from regional centers, though that lengthens lead times for owners needing urgent parts.
What do chemical plant closures signal for compressor demand?
Closures show the risk that buyers themselves may disappear, which weakens the replacement case at exposed sites. Chemistry Australia cites the closures of Qenos at Botany and Altona, Indorama Ventures at Botany and Incitec Pivot at Gibson Island, and warns that unaddressed energy costs threaten most industrial chemical manufacturing. Alcoa said on Jan. 8, 2024, that alumina production at its Kwinana refinery would cease in the third quarter of 2024, which removes a local caustic soda buyer. Electrolysis owners therefore face weaker co-product markets, and mitigation depends on long-term water supply contracts.
How do approvals slow new compression capacity?
Approval pathways delay orders because liquefaction adds regulated storage at sites already under hazard rules. IXOM expected about 20 weeks of assessment for Botany, with public exhibition running until Sept. 23, 2025, and then about 12 months of construction before completion by 2027. Coogee has also said that Lytton will become a Major Hazard Facility. Compressor vendors consequently wait through engineering, safety case and planning stages before receiving firm orders, which pushes revenue recognition later than project announcements suggest and rewards patient, locally supported suppliers.
Can on-site generation and tighter water budgets reduce future orders?
Alternatives and tighter utility budgets could limit the water share because gas chlorine is not the only route to disinfection. The Yarra Valley Water trial suggests capital savings of up to 50% on new secondary chlorination builds, using a 0.6% on-site solution. Inside Water also reported that capital spending at Sydney Water and WaterNSW was revised down after IPART determinations in September 2025. Suppliers cannot control these decisions, so they should plan around larger plants, where bulk gas supply remains practical and where liquefaction still earns a return.
New South Wales leads while Queensland adds projects
| Region | Value, 2025 (USD million) | Share, 2025 | CAGR, 2026–2035 |
|---|---|---|---|
| New South Wales | 0.4 | 34.9% | 2.89% |
| Victoria and Remaining Jurisdictions | 0.3 | 25.8% | 2.39% |
| Queensland | 0.3 | 21.3% | 3.49% |
| Western Australia | 0.2 | 18.0% | 2.59% |
New South Wales holds the largest share through Botany
New South Wales held a 34.9% share of 2025 value and grows at 2.89% a year. The Botany complex in Matraville anchors that position, with mercury-free membrane cells and 90 metric tons a day of chlorine capacity, according to IXOM. Its compression train feeds derivative production on site, and the proposed liquefaction upgrade would restore a past duty. The state also had 8.59 million residents at June 2025, according to the Centre for Population, so buyers of water treatment equipment sit close to the plant, as IXOM notes.
Victoria and remaining jurisdictions depend on Laverton
Victoria and Remaining Jurisdictions held a 25.8% share of 2025 value and grow at 2.39% a year. The IXOM Laverton plant dominates this zone because it is the only site now liquefying and packaging chlorine for water authorities. Growth is the slowest of the four zones as Botany, expected by 2027, and Lytton begin to share that duty. The zone combines Victoria, South Australia, Tasmania, the Northern Territory and the Australian Capital Territory, which together held 10.30 million residents at June 2025.
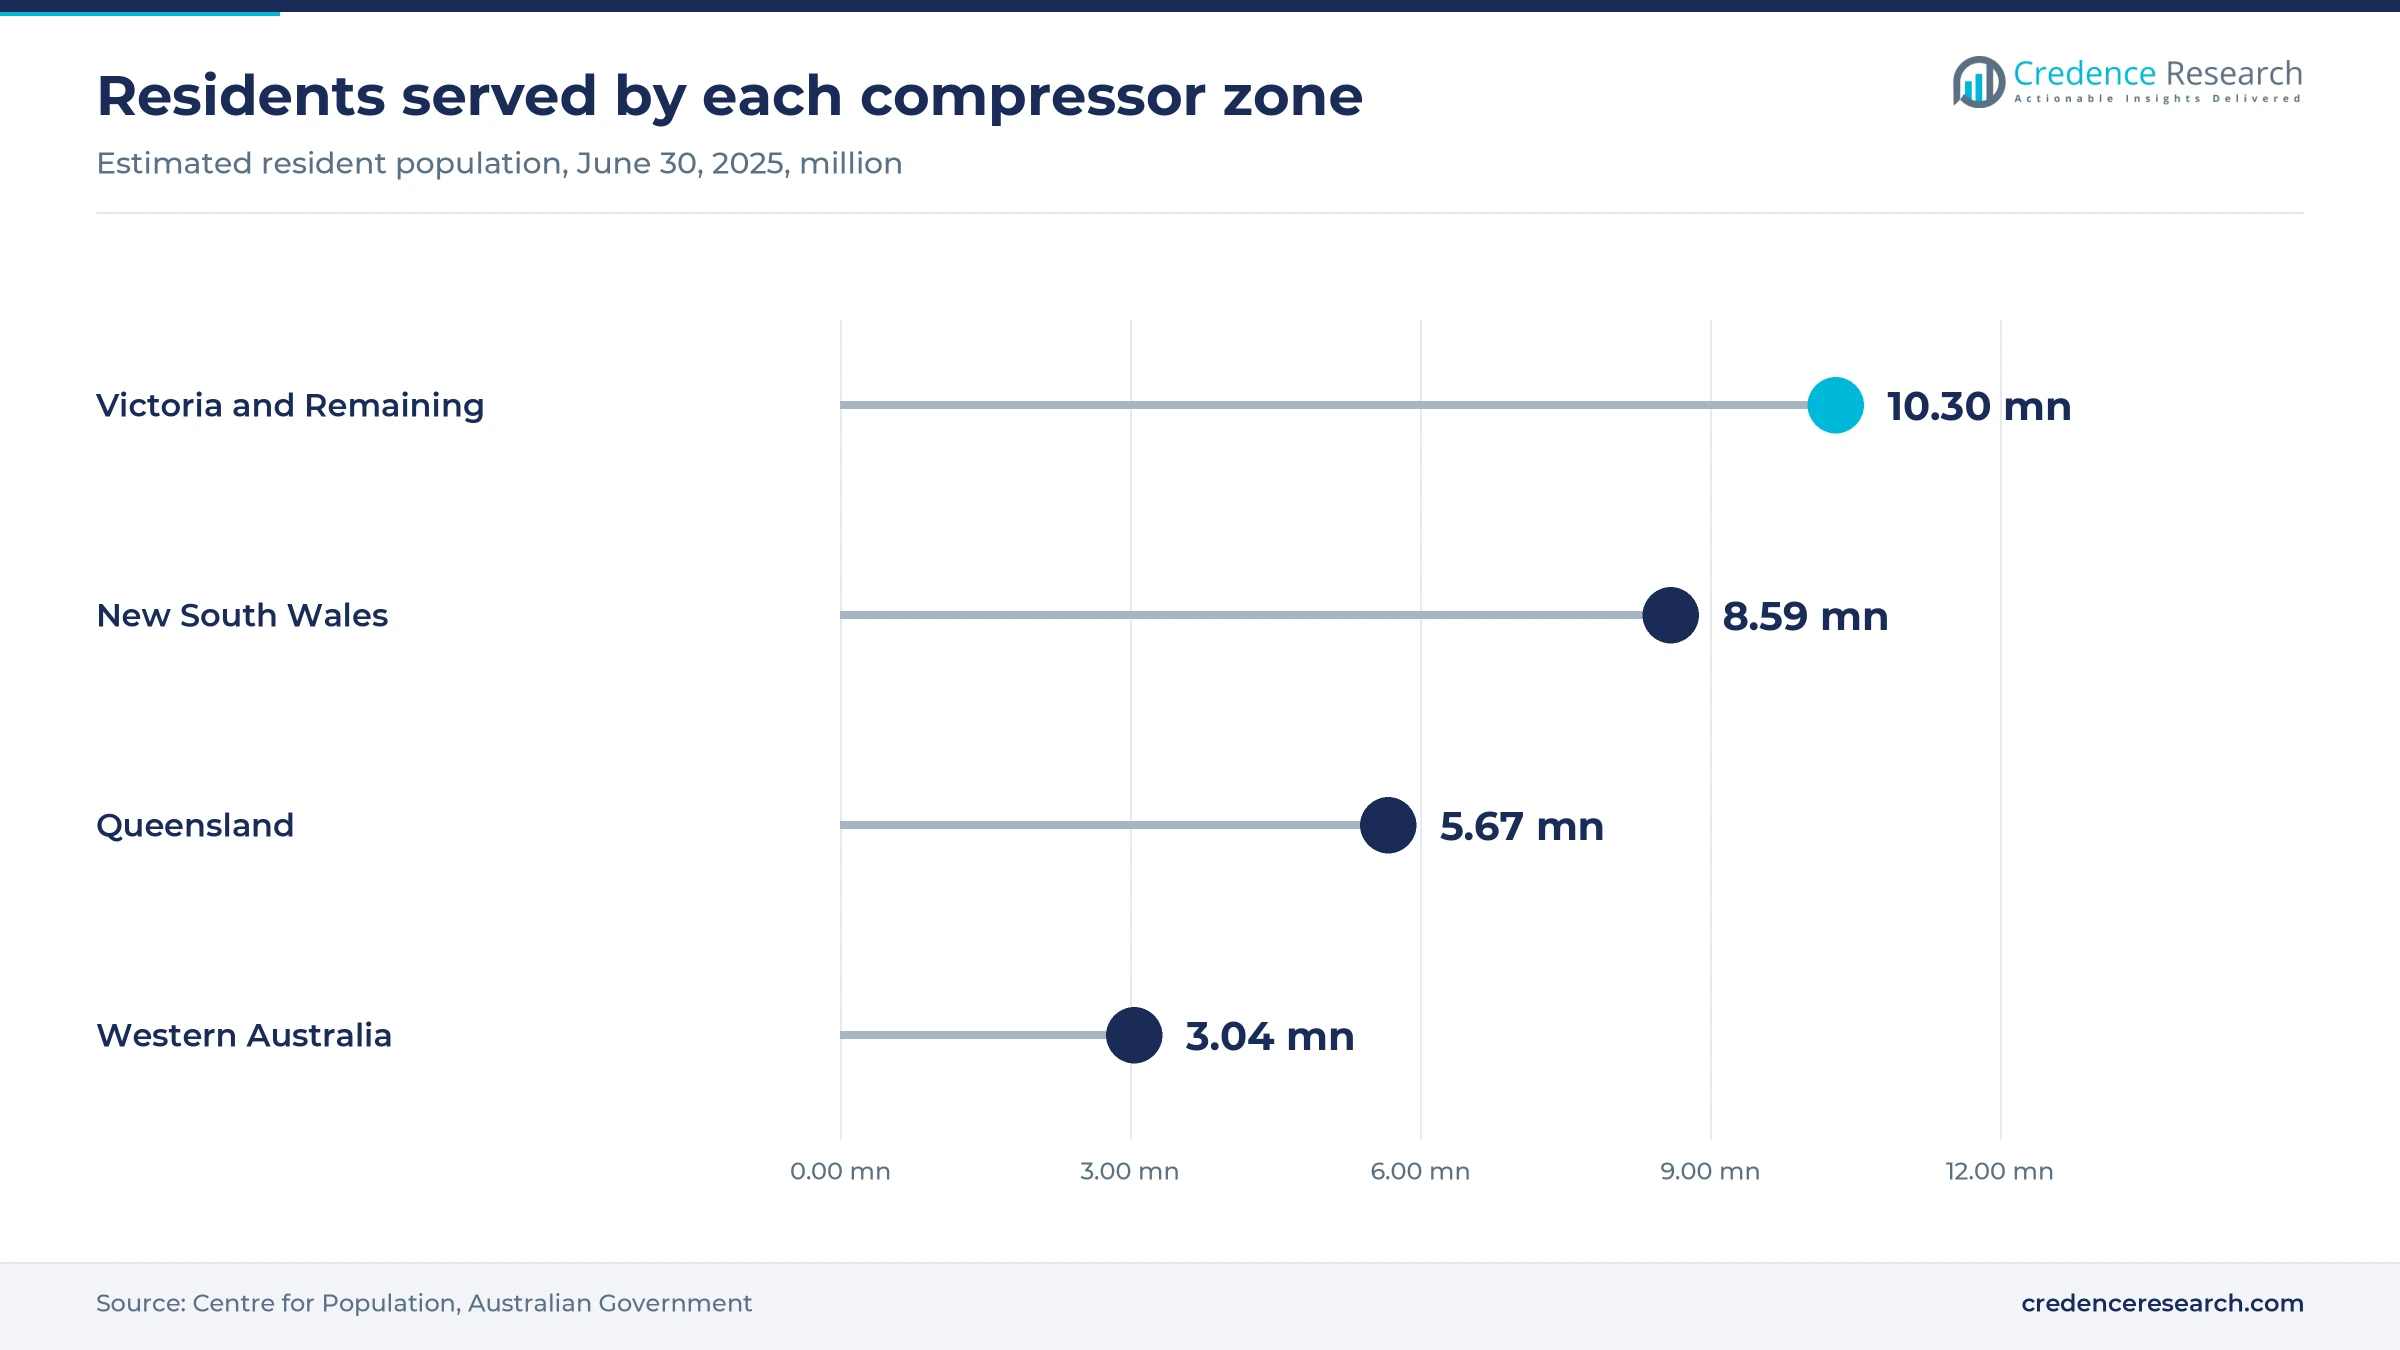
Queensland grows fastest on Lytton and Gladstone
Queensland held a 21.3% share of 2025 value and grows fastest at 3.49% a year. Coogee's Lytton plant supplies water treatment chemicals to most of the larger public pools and treatment facilities in the state, and it is now adding drumming from spare capacity. Project Halogen at Yarwun would then add liquefied chlorine in the Gladstone area, which would deliver about 100 metric tons a day of caustic soda directly to Rio Tinto Yarwun. Orica's earlier closure of its Yarwun chlor-alkali facility, noted by Coogee in 2014, also leaves room for that new source.
Western Australia relies on Kwinana and a southern site
Western Australia held an 18.0% share of 2025 value and grows at 2.59% a year. Coogee operates chlor-alkali facilities in the Perth metro and Bunbury regions, and Kwinana began by supplying feedstock to a local pigment plant. The state remained the fastest-growing by population, at 2.2% in the year to December 2025, according to the Australian Bureau of Statistics. However, Coogee still supplements local supply with imported drums, and the Alcoa Kwinana closure planned for 2024 cut expected caustic soda use, which holds growth below the national rate.
Three chlorine projects moved forward from 2025 to 2026
| Development | Status and market relevance |
|---|---|
| In June 2025, IXOM held community sessions on its Botany chlorine liquefaction and packaging project, and the proposal was on public exhibition until Sept. 23, 2025. | Completion expected by 2027; creates a second site for water authority supply |
| In October 2025, QIC announced a partnership with Grenof on Project Halogen, with up to A$30 million committed and a 50% shareholding. | Completion planned for 2028, subject to a final investment decision |
| In June 2026, Gladstone News reported that the Coordinator-General had approved the A$150 million Project Halogen development. | Approval reported; future buyer of chlorine compression |
| In July 2026, Coogee announced a decision to build a chlorine drumming facility at its Lytton plant in Queensland. | Site becomes a Major Hazard Facility; adds domestic drum supply |
| In September 2026, Atlas Copco acquired Compressors Australia, a nine-employee air compressor distributor in Brisbane and Melbourne. | General-industry service reach, not chlorine duty |
Seal liquids and materials decide compressor selection
- Sulfuric acid sealing lets liquid ring machines handle chlorine after drying, and NASH notes that it limits rust risk in cast iron at low pressure.
- Materials selection moves to 316L or HC276 stainless steel at high pressure, which NASH recommends for high-pressure casings.
- Centrifugal designs cover larger flows, with Sundyne rating its LF 2X80 at 6,000 acfm and listing chlorine gas as an application.
- Plant instrumentation matters most at interlocks, since the Botany scrubber is sized against full chlorine output during upsets and electrolyser rooms at Project Halogen use pressure monitoring.
Need a Custom Version of This Report?
Tailor the scope, geography, or segments to your exact requirements.
- Custom geography or segment scope
- Direct access to our analyst team
Plant owners, not vendors, shape this small market
Competition in chlorine compressors is defined less by vendor rivalry than by a handful of plant owners who choose suppliers once and then stay with them for decades. IXOM operates Botany and Laverton, while Coogee operates Kwinana, the Bunbury-region site and Lytton, and those two groups therefore influence most existing spending. Grenof and QIC would add a new buyer at Gladstone if Project Halogen reaches a final investment decision. Among suppliers, Atlas Copco Australia has the most visible local presence, established in 1950 with its head office at Blacktown, although its published Australian material addresses general compressed air service rather than chlorine duty. NASH and Sundyne publish chlorine-service product information globally, but no Australian placement is public.
Plant owners and suppliers visible in the public record
| Company | Type | Role in the market |
|---|---|---|
| IXOM | Plant owner | Operates the Botany chlor-alkali complex and the Laverton liquefaction plant |
| Coogee | Plant owner | Operates three chlor-alkali facilities and plans chlorine drumming at Lytton |
| Grenof Water Technologies | Project developer | Proposes Project Halogen at Yarwun, including liquefied chlorine output |
| QIC | Investor | Fund has committed up to A$30 million for a 50% shareholding in Project Halogen |
| Atlas Copco Australia | Compressor supplier | National sales and service network with gas and process compressors in its range |
Project timing matters more than volume growth
Credence Research's view is that this market should be read as a project calendar rather than a smooth growth curve. Three liquefaction or chlor-alkali decisions could fall between 2026 and 2028, yet the installed base is only a handful of sites. Any delay at Gladstone would therefore shift orders by a year or more without changing long-run need. Suppliers should qualify early with IXOM, Coogee and Grenof, because repeat service work tends to follow the first machine. Buyers should in turn insist on local parts, since a single trip affects drum supply to water authorities.
How the estimate was built from plant-level evidence
The report uses 2025 as the base year and forecasts to 2035. Market values come from the Credence Research model, which builds spending from plant-level evidence on chlorine capacity, site counts and project timing published by IXOM, Coogee, QIC, Grenof and Australian regulators. Compressor package prices and service ratios are not published, so they are Credence Research assumptions and are the most uncertain input. Segment and regional splits in the report are also Credence Research estimates. No interviews or surveys were conducted for this report at any stage.
Project spending peaks before 2030, then service takes over
Spending should reach USD 1.58 million by 2035, rising at 2.84% a year from the USD 1.23 million estimated for 2026. Project orders are likely to concentrate before 2030 if Botany, Lytton and Gladstone proceed as planned, after which service and overhaul work should carry more of the total. Queensland gains share on those projects, while Liquid Ring Compressors remain the core machine for wet-gas duty. The main swing factors are the Project Halogen investment decision, power costs at electrolysis plants and how far smaller water systems move to on-site generation.
Frequently Asked Questions
How big is the Australia chlorine compressors market?
What is the growth rate of this market?
Which compressor type leads in Australia?
Which region holds the largest share?
Which region is growing fastest?
Why does Australia need more chlorine liquefaction?
What is Project Halogen?
What is the main challenge in this market?
Table of Content
Chapter 1 Market Segmentation
- 1.1 Segmentation Framework
- 1.1.1 Product and Service Classification
- 1.1.2 Application and End-Use Classification
- 1.1.3 Technology and Solution Classification
- 1.1.4 Customer and Distribution Channel Classification
- 1.1.5 Geographic Segmentation
- 1.1.6 Market Segment Definitions and Boundaries
- 1.2 By Product Type
- 1.2.1 Liquid Ring Compressors
- 1.2.2 Centrifugal Compressors
- 1.2.3 Reciprocating and Diaphragm Compressors
- 1.3 By End-Use Industry
- 1.3.1 Chlor-Alkali Manufacturing
- 1.3.2 Water and Wastewater Treatment
- 1.3.3 Mining and Mineral Processing
- 1.3.4 Pharmaceutical and Specialty Chemical Manufacturing
- 1.4 By Application
- 1.4.1 Process Gas Transfer
- 1.4.2 Liquefaction Feed Compression
- 1.4.3 Chlorine Gas Recovery
- 1.5 By Sales Channel
- 1.5.1 Direct OEM Sales
- 1.5.2 Independent Engineering and Service Sales
- 1.5.3 Authorised Distributor Sales
Chapter 2 Introduction
- 2.1 Report Objectives and Scope
- 2.2 Product Definition and Industry Terminology
- 2.3 Market Inclusions and Exclusions
- 2.4 Research Process
- 2.4.1 Primary Research and Expert Interviews
- 2.4.2 Secondary Research and Source Review
- 2.4.3 Top-Down and Bottom-Up Estimation
- 2.4.4 Data Triangulation and Verification
- 2.5 Market Size Measurement Basis
- 2.5.1 2025: USD 1.20 million → 2035: USD 1.58 million
- 2.6 Historical and Forecast Reference Periods
- 2.6.1 Historical Period: 2018-2025
- 2.6.2 Base Year: 2025
- 2.6.3 Forecast Period: 2025-2035
- 2.7 Research Assumptions and Limitations
Chapter 3 Executive Summary
- 3.1 Market Snapshot and Key Findings
- 3.2 Base-Year Market Size, 2025
- 3.3 Forecast Market Size, 2035
- 3.4 Revenue and Volume Growth Outlook
- 3.5 Key Demand and Supply Indicators
- 3.6 Leading Market Segments
- 3.7 Fastest-Growing Market Opportunities
- 3.8 Regional Performance Highlights
- 3.9 Technology and Industry Transformation
- 3.10 Competitive Landscape Summary
- 3.11 Analyst View and Strategic Implications
Chapter 4 Australia Chlorine Compressors Market Trends and Developments
- 4.1 Historical Industry Development, 2018-2025
- 4.2 Recent Market Trends and Developments
- 4.3 Demand and Customer Behavior Trends
- 4.4 Technology and Product Innovation
- 4.5 Artificial Intelligence, Automation and Digitalization
- 4.6 Local Manufacturing and Supply Chain Realignment
- 4.7 Industry Partnerships, Mergers and Acquisitions
- 4.8 Sustainability and Circular Economy Developments
- 4.9 Government and Private Sector Investment Trends
- 4.10 Emerging Business Models and Commercialization
- 4.11 Industry Developments and Announcements
Chapter 5 Australia Chlorine Compressors Market Production, Supply and Demand Analysis
- 5.1 Demand Trend and Consumption Analysis, 2018-2025
- 5.2 Demand Forecast, 2025-2035
- 5.3 Production and Output Trend, 2018-2025
- 5.4 Production and Output Forecast, 2025-2035
- 5.5 Installed Capacity and Capacity Utilization
- 5.6 Company-Wise Production Plants and Statistics
- 5.6.1 Installed Production Capacity
- 5.6.2 Actual Production
- 5.6.3 Planned Capacity and Expansion Targets
- 5.7 Supply Chain Structure and Procurement Trends
- 5.8 Supply-Demand Gap and Bottlenecks
- 5.9 Import Dependence and Sourcing Structure
- 5.10 Contract Manufacturing and Outsourcing
- 5.11 Regional Supply and Demand Concentration
Chapter 6 Australia Chlorine Compressors Market Pricing Analysis
- 6.1 Pricing Structure and Measurement
- 6.2 Historical Pricing Trends, 2018-2025
- 6.3 Pricing Outlook, 2025-2035
- 6.4 Average Selling Price and Unit Economics
- 6.5 Pricing by Product and Market Segment
- 6.6 Geographic Pricing Differences
- 6.7 Key Input, Energy, Labor and Logistics Costs
- 6.8 Contract Pricing and Purchasing Models
- 6.9 Pricing Sensitivity and Competitive Positioning
- 6.10 Price, Margin and Profitability Implications
Chapter 7 Australia Chlorine Compressors Market Dynamics
- 7.1 Market Growth Drivers
- 7.1.1 Demand-Side Drivers
- 7.1.2 Technology and Innovation Drivers
- 7.1.3 Infrastructure and Investment Drivers
- 7.1.4 Regulatory and Policy Drivers
- 7.2 Market Restraints
- 7.2.1 Cost and Affordability Constraints
- 7.2.2 Technology and Adoption Barriers
- 7.2.3 Supply Chain and Operational Constraints
- 7.3 Market Challenges
- 7.3.1 Competitive Pressure and Margin Erosion
- 7.3.2 Skills, Infrastructure and Implementation Gaps
- 7.4 Emerging Market Opportunities
- 7.5 Market Dynamics Impact and Time-Horizon Assessment
Chapter 8 Australia Chlorine Compressors Value Chain Analysis
- 8.1 Industry Value Chain Overview
- 8.2 Upstream Suppliers and Critical Inputs
- 8.3 Technology and Component Providers
- 8.4 Manufacturing or Service Delivery
- 8.5 Distribution, Channel Partners and Integrators
- 8.6 Downstream Applications and End Users
- 8.7 Value Addition and Profit Pools
- 8.8 Vertical Integration and Outsourcing
- 8.9 Supplier Concentration and Risk
- 8.10 Supply Chain Localization and Resilience
Chapter 9 Australia Chlorine Compressors Market Regulations and Policies
- 9.1 Relevant Laws, Standards and Compliance Frameworks
- 9.2 Product, Service, Safety and Quality Requirements
- 9.3 Government Policies, Incentives and Subsidies
- 9.4 Imports, Exports and Trade Barriers
- 9.5 Public Procurement and Local Content Requirements
- 9.6 Environmental and Sustainability Compliance
- 9.7 Upcoming Policy Changes and Market Implications
Chapter 10 Australia Chlorine Compressors Market Hotspots and Opportunities
- 10.1 Market Opportunity Mapping and Growth Hotspots
- 10.2 High-Growth Applications and Customer Groups
- 10.3 Underserved Markets and White-Space Opportunities
- 10.4 Emerging Technology and Product Opportunities
- 10.5 New Capacity and Investment Hotspots
- 10.6 Market Entry and Expansion Opportunities
- 10.7 Distribution and Partnership Opportunities
- 10.8 Near-Term and Long-Term Commercial Potential
- 10.9 Opportunity Attractiveness and Execution Risks
Chapter 11 Australia Chlorine Compressors Market Outlook, 2025-2035
- 11.1 Market Size and Analysis
- 11.1.1 Revenue (Market Measurement: 2025: USD 1.20 million → 2035: USD 1.58 million)
- 11.1.2 Market Volume and Quantity Sold
- 11.1.3 Historical Market Size, 2018-2025
- 11.1.4 Base-Year Market Size, 2025
- 11.2 Market Forecast, 2025-2035
- 11.2.1 Revenue Forecast to 2035
- 11.2.2 Volume Forecast to 2035
- 11.2.3 CAGR and Year-on-Year Growth
- 11.2.4 Incremental Revenue Opportunity
- 11.3 Forecast Assumptions and Scenario Analysis
- 11.3.1 Base-Case Forecast
- 11.3.2 Optimistic and Conservative Scenarios
- 11.3.3 Technology, Pricing and Policy Sensitivities
- 11.4 Market Attractiveness and Growth Outlook
Chapter 12 Australia Chlorine Compressors Market Segmentation and Outlook
- 12.1 Segmentation Summary and Market Shares, 2025
- 12.2 Largest and Fastest-Growing Segments
- 12.3 By Product Type - Market Size and Forecast, 2025-2035
- 12.3.1 Segment Definition and Scope
- 12.3.2 Historical Market Size, 2018-2025
- 12.3.3 Revenue Forecast, 2025-2035
- 12.3.4 Volume Forecast, 2025-2035
- 12.3.5 Base-Year Market Share, 2025
- 12.3.6 Segment CAGR and Growth Drivers
- 12.3.7 Subsegment Market Size and Forecast
- 12.3.7.1 Liquid Ring Compressors
- 12.3.7.2 Centrifugal Compressors
- 12.3.7.3 Reciprocating and Diaphragm Compressors
- 12.3.8 Subsegment Pricing and Adoption Trends
- 12.3.9 Leading Suppliers and Competition
- 12.3.10 Regional Demand and Opportunities
- 12.4 By End-Use Industry - Market Size and Forecast, 2025-2035
- 12.4.1 Segment Definition and Scope
- 12.4.2 Historical Market Size, 2018-2025
- 12.4.3 Revenue Forecast, 2025-2035
- 12.4.4 Volume Forecast, 2025-2035
- 12.4.5 Base-Year Market Share, 2025
- 12.4.6 Segment CAGR and Growth Drivers
- 12.4.7 Subsegment Market Size and Forecast
- 12.4.7.1 Chlor-Alkali Manufacturing
- 12.4.7.2 Water and Wastewater Treatment
- 12.4.7.3 Mining and Mineral Processing
- 12.4.7.4 Pharmaceutical and Specialty Chemical Manufacturing
- 12.4.8 Subsegment Pricing and Adoption Trends
- 12.4.9 Leading Suppliers and Competition
- 12.4.10 Regional Demand and Opportunities
- 12.5 By Application - Market Size and Forecast, 2025-2035
- 12.5.1 Segment Definition and Scope
- 12.5.2 Historical Market Size, 2018-2025
- 12.5.3 Revenue Forecast, 2025-2035
- 12.5.4 Volume Forecast, 2025-2035
- 12.5.5 Base-Year Market Share, 2025
- 12.5.6 Segment CAGR and Growth Drivers
- 12.5.7 Subsegment Market Size and Forecast
- 12.5.7.1 Process Gas Transfer
- 12.5.7.2 Liquefaction Feed Compression
- 12.5.7.3 Chlorine Gas Recovery
- 12.5.8 Subsegment Pricing and Adoption Trends
- 12.5.9 Leading Suppliers and Competition
- 12.5.10 Regional Demand and Opportunities
- 12.6 By Sales Channel - Market Size and Forecast, 2025-2035
- 12.6.1 Segment Definition and Scope
- 12.6.2 Historical Market Size, 2018-2025
- 12.6.3 Revenue Forecast, 2025-2035
- 12.6.4 Volume Forecast, 2025-2035
- 12.6.5 Base-Year Market Share, 2025
- 12.6.6 Segment CAGR and Growth Drivers
- 12.6.7 Subsegment Market Size and Forecast
- 12.6.7.1 Direct OEM Sales
- 12.6.7.2 Independent Engineering and Service Sales
- 12.6.7.3 Authorised Distributor Sales
- 12.6.8 Subsegment Pricing and Adoption Trends
- 12.6.9 Leading Suppliers and Competition
- 12.6.10 Regional Demand and Opportunities
- 12.7 Segment Growth Comparison
- 12.8 Segment Attractiveness and Priority Matrix
Chapter 13 Australia Chlorine Compressors End-Use and Application Market Outlook
- 13.1 End-Use Industry and Customer Demand Structure
- 13.2 Leading Applications and Customer Groups
- 13.3 End-Use Market Size, Share and Forecast
- 13.4 Major End-Use Industry Deep Dives
- 13.4.1 Customer Requirements and Use Cases
- 13.4.2 Demand and Replacement Cycles
- 13.4.3 Technical and Regulatory Considerations
- 13.4.4 Purchasing and Procurement Models
- 13.4.5 Leading Vendors and Distribution Channels
- 13.4.6 Forecast and Commercial Opportunities
- 13.5 Emerging Applications and Cross-Segment Demand
- 13.6 End-Use Industry Investment Priorities
Chapter 14 Australia Chlorine Compressors Geographic Market Outlook, 2025-2035
- 14.1 Domestic Market Distribution and Demand Clusters
- 14.2 State- or Province-Wise Market Size and Forecast, 2025-2035
- 14.3 City and Metropolitan Market Outlook
- 14.4 Industrial, Manufacturing and Commercial Clusters
- 14.5 Geographic Concentration of Key End Users
- 14.6 Local Pricing and Purchasing Differences
- 14.7 Domestic Production Facilities and Capacity Map
- 14.8 Local Infrastructure and Project Pipeline
- 14.9 State-Level Policy and Incentive Differences
- 14.10 Subnational Investment Hotspots and Opportunities
- 14.11 Distribution and Logistics Networks
- 14.12 Domestic Competitive Footprint
Chapter 15 Australia Chlorine Compressors Technology, Innovation and Sustainability Outlook
- 15.1 Technology Landscape and Maturity
- 15.2 Product, Process and Service Innovation
- 15.3 AI, Automation and Digital Tools in the Industry
- 15.4 Technology Adoption and Performance Benchmarking
- 15.5 Innovation Pipeline and R&D Investment
- 15.6 Patent and Intellectual Property Trends
- 15.7 Energy Efficiency and Resource Management
- 15.8 Sustainability, Recycling and Circularity
- 15.9 Technology Roadmap, 2025-2035
- 15.10 Risks of Obsolescence and Technology Substitution
Chapter 16 Australia Chlorine Compressors Market Key Strategic Imperatives
- 16.1 Growth and Market Entry Priorities
- 16.2 High-Return Products and Segments
- 16.3 Pricing, Profitability and Cost Optimization
- 16.4 Technology Investment and Product Differentiation
- 16.5 Supply Chain Localization and Resilience
- 16.6 Distribution and Customer Acquisition
- 16.7 Partnership, Acquisition and Capacity Strategy
- 16.8 Regional Expansion Priorities
- 16.9 Short-, Medium- and Long-Term Actions
Chapter 17 Competition Outlook
- 17.1 Industry Competition Characteristics
- 17.2 Market Structure and Concentration
- 17.3 Market Share and Competitive Positioning, 2025
- 17.4 Company-Wise Revenue and Product Benchmarking
- 17.5 Production and Service Capacity Benchmarking
- 17.6 Technology, Pricing and Differentiation
- 17.7 Regional Footprint and Distribution Strength
- 17.8 Mergers, Acquisitions and Strategic Alliances
- 17.9 New Entrants and Competitive Threats
- 17.10 Porter's Five Forces and Industry Attractiveness
- 17.11 Competitive Outlook, 2025-2035
Chapter 18 Company Profiles
- 18.1 Company Coverage and Selection Criteria
- 18.2 IXOM
- 18.2.1 Business Description
- 18.2.2 Company Ownership and Geographic Presence
- 18.2.3 Product and Service Portfolio
- 18.2.4 Manufacturing and Operating Footprint
- 18.2.5 Production Capacity and Expansion Plans
- 18.2.6 Financial Performance and Investment
- 18.2.7 Market Share and Competitive Position
- 18.2.8 Technology and Innovation Capabilities
- 18.2.9 Strategic Alliances or Partnerships
- 18.2.10 Recent Developments
- 18.2.11 Growth Strategy and Outlook
- 18.3 Coogee
- 18.4 NASH
- 18.5 Atlas Copco Australia
- 18.6 Sundyne
- 18.7 Other Relevant Market Participants
Note: Every listed company is profiled on the structure shown under the first company. The company list is preliminary and may change based on research findings, market developments, data availability and client requirements.
Chapter 19 Disclaimer
- 19.1 Research and Forecast Disclaimer
- 19.2 Data Source and Estimation Limitations
Note: The depth of individual sections depends on data availability for this market. Volume, capacity, trade and other unit-based metrics are included where applicable.

