
| REPORT ATTRIBUTE | DETAILS |
|---|---|
| Historical Period | 2019-2022 |
| Base Year | 2023 |
| Forecast Period | 2024-2032 |
| Caustic Soda Market Size 2024 | USD 47,676.12 Million |
| Caustic Soda Market, CAGR | 3.20% |
| Caustic Soda Market Size 2032 | USD 63,302.11 Million |
Market Overview
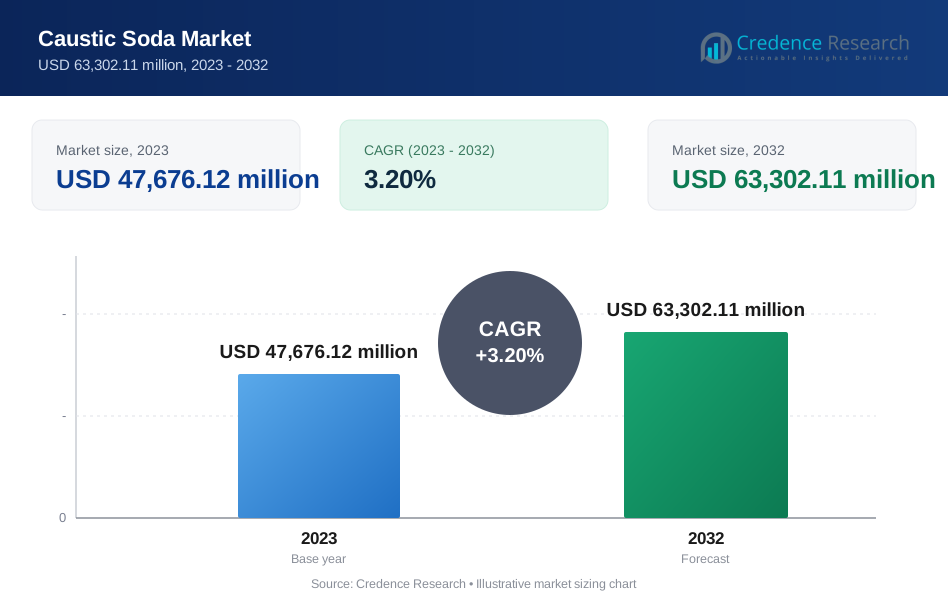
The Caustic Soda Market is projected to grow from USD 47,676.12 million in 2023 to an estimated USD 63,302.11 million by 2032, with a compound annual growth rate (CAGR) of 3.20% from 2024 to 2032. This growth underscores the essential role of caustic soda in various industries, including chemicals, textiles, and pulp and paper, where it serves as a critical raw material.
Key drivers in the caustic soda market include the rising need for wastewater treatment, particularly in developing economies, and the robust demand from the alumina sector. Additionally, technological advancements in production processes and innovations aimed at reducing environmental impact are influencing market trends. The shift towards eco-friendly production practices and recycling initiatives among end-use industries further complements these drivers, fostering steady market growth and adoption.
Geographically, Asia-Pacific dominates the caustic soda market, attributed to high demand from China and India due to their expanding chemical and textile sectors. North America and Europe are also significant markets, with increasing demand from the automotive and food processing industries. Key players in this market include Olin Corporation, Westlake Chemical Corporation, The Dow Chemical Company, and Tata Chemicals Limited, which continue to invest in capacity expansions and technological innovations to strengthen their positions in this competitive market landscape.
Market Drivers
Growing Demand in the Pulp and Paper Industry
The caustic soda market is witnessing increased demand from the pulp and paper industry, which relies heavily on caustic soda for its pulping process. As a strong alkaline solution, caustic soda plays a vital role in breaking down lignin and facilitating the separation of cellulose fibers, which is essential for producing paper and paperboard. With the growth in global literacy rates, expanding e-commerce packaging needs, and rising concerns for sustainable packaging, the demand for paper products has surged. This, in turn, drives the need for caustic soda in this sector. For instance, in a typical pulp and paper mill, approximately 230-260 kg of caustic soda is consumed per ton of pulp produced. This significant consumption rate underscores the vital role of caustic soda in the industry's operations. Moreover, regulatory support for sustainable forestry practices and eco-friendly products further strengthens this demand. As the global paper industry expands, especially in emerging markets like Asia-Pacific, the caustic soda market is anticipated to grow correspondingly.
Increasing Applications in Wastewater Treatment
With escalating environmental concerns and stringent regulatory requirements, the demand for effective wastewater treatment solutions is on the rise globally. Caustic soda is widely used in wastewater treatment to neutralize acidic waste streams and to precipitate heavy metals, which enables safe disposal of industrial effluents. Various industries, including chemicals, textiles, and oil and gas, employ caustic soda for wastewater treatment to comply with environmental standards. For instance, a large-scale textile manufacturing facility in Southeast Asia implemented a caustic soda dosing system in its wastewater treatment process, leading to a reduction of 70% in organic contaminants. This case study demonstrates the effectiveness of caustic soda in industrial wastewater treatment. Additionally, rising urbanization and industrialization in developing economies lead to greater wastewater generation, creating further demand for caustic soda in treatment processes. In response to these trends, many governments and industries are investing in wastewater treatment infrastructure, thereby boosting the caustic soda market.
Robust Demand from the Alumina Sector
The alumina sector represents one of the largest consumers of caustic soda, as it is a critical component in the Bayer process used for refining bauxite to produce alumina. Alumina is a key raw material in the production of aluminum, which is extensively used in industries such as automotive, aerospace, construction, and packaging. Given the surge in demand for lightweight and durable materials, particularly in automotive and aerospace sectors where aluminum is highly valued, the alumina industry has seen considerable expansion. For instance, in the Bayer process of aluminum production, bauxite ore is mixed with a hot solution of caustic soda at temperatures ranging from 138-143°C for gibbsitic bauxite. This temperature range highlights the specific conditions required for efficient alumina extraction using caustic soda. The rising trend of electrification in automotive manufacturing and the emphasis on reducing greenhouse gas emissions are further supporting the growth of aluminum production, and by extension, caustic soda demand. Consequently, the caustic soda market is closely linked to the alumina sector's growth trajectory, and as this sector expands, caustic soda consumption is expected to increase in parallel.
Rising Need in Household and Personal Care Products
Caustic soda is essential in producing a variety of household and personal care products, particularly in the manufacturing of soaps, detergents, and cleaners. As populations grow and urbanization increases, the demand for these products continues to rise, driven by a greater focus on hygiene and sanitation, especially highlighted during and after the COVID-19 pandemic. Caustic soda is utilized in saponification, a process that converts fats and oils into soap, making it indispensable for soap manufacturers. Additionally, it is used in cleaning agents to adjust pH levels and improve product efficiency. The growth in consumer awareness regarding cleanliness and hygiene, coupled with lifestyle shifts toward personal well-being, have amplified the demand for caustic soda in this sector. Furthermore, the trend of sustainable and eco-friendly cleaning products is prompting manufacturers to innovate in production processes, further encouraging the use of caustic soda as a reliable, versatile raw material in the formulation of household and personal care products.
Market Trends
Shift Toward Sustainable and Environmentally Friendly Production
One of the significant trends in the caustic soda market is the shift toward sustainable and environmentally friendly production practices. As environmental regulations tighten and the focus on sustainability heightens, manufacturers are adopting cleaner production technologies that reduce emissions and energy consumption. Traditional caustic soda production through the chlor-alkali process consumes significant energy and generates chlorine as a co-product, which presents disposal and environmental challenges. In response, companies are investing in technologies to improve energy efficiency, reduce by-product waste, and lower carbon footprints. For instance, membrane cell technology has enabled chlor-alkali plants to reduce energy consumption by up to 25% compared to older mercury cell processes. Some manufacturers have reported achieving a 30% reduction in carbon emissions through process optimizations and energy efficiency improvements. Moreover, some companies are exploring ways to recycle caustic soda within industrial processes, reducing the need for new production. This trend aligns with global sustainability goals and regulatory mandates, making environmentally friendly production not only desirable but essential for long-term market viability.
Increasing Integration of Digitalization and Automation in Production
Another trend shaping the caustic soda market is the increasing integration of digitalization and automation within production and supply chain processes. As industries move towards Industry 4.0, caustic soda manufacturers are leveraging digital technologies to optimize operations, improve product quality, and enhance process control. Automated systems and data analytics enable real-time monitoring and control of production parameters, ensuring precise control over process variables and reducing wastage. For instance, one major caustic soda producer implemented an AI-powered predictive maintenance system that reduced unplanned downtime by 20% and increased overall equipment effectiveness by 15%. Another company reported a 10% improvement in production yield after implementing advanced process control systems with real-time analytics. Furthermore, digital platforms are increasingly used for supply chain management, providing enhanced visibility and traceability of shipments. By integrating these advanced technologies, caustic soda manufacturers can respond more swiftly to market fluctuations, optimize resource allocation, and reduce operational risks. This trend reflects a broader movement within the chemical industry, where digitalization not only contributes to cost savings but also enhances environmental performance by reducing energy consumption and minimizing waste in production processes.
Market Restraints and Challenges
Environmental and Regulatory Challenges
One of the primary restraints facing the caustic soda market is the stringent environmental regulations surrounding its production and disposal. The traditional chlor-alkali process, which produces caustic soda, is energy-intensive and results in the generation of chlorine and other hazardous by-products, posing significant environmental risks. Regulatory authorities worldwide have implemented strict emission controls and waste management standards for the chemical industry, increasing operational compliance costs for caustic soda manufacturers. Meeting these environmental standards requires substantial investment in cleaner technologies and sustainable production practices, which can be cost-prohibitive for smaller or regional producers. Additionally, the disposal of by-products like chlorine remains a challenge, as improper handling can lead to serious environmental and health hazards. As regulatory scrutiny intensifies, caustic soda producers face growing pressures to adopt eco-friendly production methods, which could impact profitability and limit market growth, especially in regions with strict environmental mandates.
Fluctuating Raw Material Prices and Supply Chain Disruptions
Volatility in raw material prices, particularly electricity and salt, presents another significant challenge for the caustic soda market. Electricity is a crucial input in the chlor-alkali process, and any increase in energy prices can considerably raise production costs. Additionally, supply chain disruptions, as seen during the COVID-19 pandemic and recent geopolitical tensions, have impacted the availability and cost stability of these essential raw materials. Rising transportation costs, port congestions, and supply bottlenecks further exacerbate these challenges, leading to fluctuations in caustic soda prices and impacting profit margins. As caustic soda production is heavily energy-dependent, the industry remains highly vulnerable to energy price volatility, especially in regions relying on non-renewable energy sources. These supply chain and cost uncertainties pose considerable challenges for caustic soda manufacturers, who must balance between managing costs and maintaining competitive pricing in an increasingly price-sensitive market.
Market Segmentation Analysis
By Application
The caustic soda market sees significant demand across diverse applications. The alumina sector, one of the largest consumers, relies on caustic soda for refining bauxite into alumina, a critical step in aluminum production for automotive, aerospace, and construction industries. Inorganic chemicals, including phosphates, silicates, and sulfates, also utilize caustic soda for neutralization and pH control, supporting agriculture, textiles, and coatings markets. Organic chemicals consume large volumes of caustic soda in producing pharmaceuticals, plastics, and synthetic fibers, driven by growth in emerging economies. In the food industry, caustic soda aids in peeling, processing, and thickening applications, though regulatory controls on food safety present both challenges and opportunities. The paper and pulp industry relies on caustic soda for wood pulping, fueled by the e-commerce boom and demand for sustainable packaging. In soaps and detergents, caustic soda facilitates saponification, with demand surging due to heightened hygiene awareness and a shift towards eco-friendly cleaning products.
By Region
The Asia-Pacific region leads the caustic soda market, driven by high consumption in China and India due to the growth of chemical, textile, and alumina industries, along with rapid industrialization and urbanization. North America is a significant market, particularly in the U.S., where demand stems from automotive, food processing, and wastewater treatment sectors, supported by advanced technologies and regulatory frameworks that emphasize sustainable practices. In Europe, the market is influenced by the chemicals, automotive, and paper industries, with a strong focus on environmentally friendly production to comply with stringent regulations on emissions and energy efficiency. Latin America and the Middle East & Africa demonstrate moderate demand, fueled by industrialization and infrastructure investments, which contribute to a steady market outlook in these developing regions.
Segments
Based on Application
- Alumina
- Inorganic Chemicals
- Organic Chemicals
- Food Industry
- Paper & Pulp
- Soaps & Detergents
Based on Region
- North America
- U.S.
- Canada
- Mexico
- Europe
- Germany
- France
- U.K.
- Italy
- Spain
- Rest of Europe
- Asia Pacific
- China
- Japan
- India
- South Korea
- South-east Asia
- Rest of Asia Pacific
- Latin America
- Brazil
- Argentina
- Rest of Latin America
- Middle East & Africa
- GCC Countries
- South Africa
- Rest of the Middle East and Africa
Regional Analysis
Asia-Pacific (40%):
Asia-Pacific holds the largest share in the global caustic soda market, accounting for approximately 40% of the total market. This dominance is primarily due to the strong demand in China and India, where caustic soda plays a critical role in sectors like alumina, textiles, and chemicals. Rapid industrialization and urbanization in these countries have driven significant growth in the end-use industries, thereby increasing caustic soda consumption. China, as the world’s largest producer and consumer of caustic soda, heavily influences the regional market. Moreover, increasing investments in infrastructure and manufacturing sectors in Southeast Asia also contribute to market growth. The region’s large-scale production capabilities, combined with low production costs, position Asia-Pacific as a significant supplier of caustic soda to the global market.
North America (25%):
North America holds a substantial share of the caustic soda market, comprising around 25% of the global market. The U.S. leads the regional demand, with key applications in the chemicals, automotive, and food processing industries. North American manufacturers benefit from advanced production technologies, which improve process efficiency and environmental compliance. Additionally, the presence of established players with significant production capacities bolsters the market’s stability. Demand for caustic soda in wastewater treatment is also rising in this region due to strict environmental regulations. The North American market is further supported by initiatives to innovate in eco-friendly production processes, aligning with regulatory and consumer expectations.
Key players
- Dow
- Olin Corporation
- Westlake Corporation
- Occidental Petroleum Corporation
- Formosa Plastics Corporation
- Tata Chemicals
- Shin-Etsu Chemical Co., Ltd.
- Akzo Nobel N.V.
- Solvay
- Grasim Industries Limited (India) and Aditya Birla Chemicals (Thailand) Pvt. Ltd.
- SABIC
- Covestro AG
- Hanwha Group
- Tosoh India Pvt. Ltd.
Competitive Analysis
The caustic soda market is highly competitive, with prominent global players vying for market share through strategic expansions, product innovations, and sustainability-focused initiatives. Companies such as Dow, Olin Corporation, and Westlake Corporation lead the market with extensive product portfolios and advanced production capabilities. These players have a strong presence across multiple regions and leverage economies of scale to optimize production costs. Additionally, firms like Tata Chemicals, Solvay, and Shin-Etsu Chemical Co., Ltd. focus on eco-friendly manufacturing processes, aligning with global sustainability trends. Regional players, such as Grasim Industries and Aditya Birla Chemicals, are expanding their presence in emerging markets like Asia-Pacific. To gain a competitive edge, companies are increasingly investing in R&D, improving process efficiency, and targeting end-use industries with specialized solutions, thereby intensifying the market competition.
Recent Developments
- In December 2023, Dow launched two new caustic soda products - Caustic DEC and Tracelight DEC, as part of its Decarbia portfolio. These products are designed to produce up to 90% lower carbon dioxide emissions compared to conventional caustic soda.
- In August 2024, Olin Corporation announced the lifting of its systemwide force majeure on chlor-alkali products, including caustic soda, allowing for the return of normal production operations following disruptions caused by Hurricane Beryl.
- In February 2024, OxyChem (a subsidiary of Occidental) restarted caustic soda and VCM production at its Ingleside plant following a scheduled maintenance shutdown.
- In May 2023, Tata Chemicals reported a net loss of Rs 850 crore, attributed to lower soda ash demand linked to declining caustic soda prices.
- In August 2023, Shin-Etsu Chemical Co., Ltd. expected global caustic soda prices to reverse declines due to adjustments in producer operations and anticipated demand recovery in the second half of 2023.
- In January 2024, Solvay announced plans to reduce the production capacity of its Torrelavega, Spain plant by 300 kilotons to 600 kilotons of soda ash per year, effective January 2024.
- In February 2023, Covestro AG successfully started up a new world-scale facility for chlorine production in Tarragona, Spain, ensuring an efficient and sustainable supply of chlorine and caustic soda.
- In December 2023, Hanwha Solutions announced a USD282.3 million investment plan to expand the production of caustic soda, boosting capacity by 270,000 tons per year.
Market Concentration and Characteristics
The caustic soda market is moderately concentrated, with a few large players holding a significant share due to high entry barriers, including substantial capital investment and stringent environmental regulations. Major companies such as Dow, Olin Corporation, and Westlake Corporation dominate the market with advanced production facilities, global distribution networks, and well-established supply chains. The market exhibits characteristics of both price sensitivity and high demand stability, as caustic soda is essential across diverse industries like alumina, pulp and paper, and wastewater treatment. The presence of regional players, especially in Asia-Pacific, adds to the market’s competitive dynamics, though these companies often rely on local demand and cost advantages. Technological advancements in production processes and growing demand for sustainable practices also shape the market, compelling players to invest in energy-efficient and eco-friendly solutions to meet regulatory standards and consumer expectations.
Report Coverage
The research report offers an in-depth analysis based on Application and Region. It details leading market players, providing an overview of their business, product offerings, investments, revenue streams, and key applications. Additionally, the report includes insights into the competitive environment, SWOT analysis, current market trends, as well as the primary drivers and constraints. Furthermore, it discusses various factors that have driven market expansion in recent years. The report also explores market dynamics, regulatory scenarios, and technological advancements that are shaping the industry. It assesses the impact of external factors and global economic changes on market growth. Lastly, it provides strategic recommendations for new entrants and established companies to navigate the complexities of the market.
Future Outlook
- The caustic soda market is expected to grow steadily, driven by rising demand from key sectors such as alumina, pulp and paper, and wastewater treatment.
- With the growing emphasis on lightweight materials in automotive and aerospace, the alumina sector will continue to drive caustic soda demand over the coming years.
- Emerging markets, particularly in Asia-Pacific and Latin America, are anticipated to witness heightened demand due to rapid industrialization and urbanization.
- Stricter environmental regulations will push manufacturers to adopt sustainable production processes, including energy-efficient technologies and waste reduction practices.
- The expanding need for effective wastewater management in industrial processes will fuel caustic soda demand, especially in developing countries with increasing environmental concerns.
- Advancements in membrane cell technology and other innovations are expected to enhance production efficiency, helping companies meet regulatory standards and reduce operational costs.
- Digital technologies, such as IoT and predictive analytics, will become more prevalent in caustic soda production, optimizing process control and minimizing downtime.
- The growth in the household and personal care sectors will support caustic soda demand, as hygiene awareness and consumption of cleaning products continue to rise globally.
- Fluctuations in raw material prices and energy costs, as well as potential supply chain disruptions, may impact the market's stability and create cost pressures.
- As market players focus on expanding capacities, investing in R&D, and enhancing sustainability, competition will intensify, encouraging innovation and strategic partnerships among key players.
Request a Free Sample
Fill in your details and we'll send you a free sample report.
- Sample data tables & charts
- Research methodology
Need a Custom Version of This Report?
Tailor the scope, geography, or segments to your exact requirements.
- Custom geography or segment scope
- Direct access to our analyst team
Frequently Asked Questions
What is the projected market size of the caustic soda market in 2023 and 2032, and what is the expected CAGR?
What industries primarily drive demand in the caustic soda market?
Why is Asia-Pacific a leading region in the caustic soda market?
How do environmental regulations impact the caustic soda market?
What role does technology play in the caustic soda market?
Who are the key players in the global caustic soda market?
Table of Content
Chapter 1. Report Introduction
- 1.1 Report Description & Purpose
- 1.1.1 Report Title & Market Definition
- 1.1.2 Unique Selling Propositions (USP) & Key Differentiators
- 1.1.3 Value Proposition for Stakeholders
- 1.2 Research Objectives
- 1.2.1 Market Sizing Objectives (Volume & Revenue) (Volume Where Applicable)
- 1.2.2 Segmentation Objectives
- 1.2.3 Competitive Intelligence Objectives
- 1.2.4 Forecast & Scenario Objectives
- 1.3 Report Scope
- 1.3.1 Caustic Soda Scope – Segments & Subsegments Covered
- 1.3.2 Geographic Scope – Regions & Countries Covered
- 1.3.3 Historical Period, Base Year & Forecast Period (2023; forecast to 2032)
- 1.3.4 Inclusions & Exclusions
- 1.4 Industry Classification & Applicable Codes
- 1.5 Currency, Measurement Units & Valuation Basis
- 1.6 Target Stakeholders
- 1.7 Limitations & Assumptions
Chapter 2. Executive Summary
- 2.1 Global Caustic Soda Market Snapshot
- 2.1.1 Market Size – Historical (2023) & Forecast (2023-2032) (2023: USD 47,676.12 million → 2032: USD 63,302.11 million)
- 2.1.2 Volume & Revenue – Global Totals (Volume Where Applicable)
- 2.1.3 Key Market Highlights – Top Five Facts
- 2.2 Caustic Soda Market Segmentation Snapshot
- 2.2.1 Market Split by Region – 2023 vs. 2032
- 2.3 Competitive Snapshot
- 2.3.1 Top 10 Players by Revenue Share – 2023
- 2.3.2 Top 10 Players by Volume Share – 2023 (Volume Where Applicable)
- 2.3.3 Recent Strategic Developments (18-Month Summary)
- 2.4 Key Investment Highlights & Strategic Conclusions
Chapter 3. Caustic Soda Market Dynamics & Industry Analysis
- 3.1 Market Overview & Context
- 3.1.1 Caustic Soda Market Position in the Broader Industry Value Chain
- 3.1.2 Demand Structure & Purchasing Dynamics
- 3.1.3 Market Maturity & Development Stage by Region
- 3.2 Caustic Soda Market Drivers
- 3.3 Caustic Soda Market Restraints & Challenges
- 3.4 Caustic Soda Market Opportunities
- 3.5 Porter's Five Forces Analysis
- 3.5.1 Threat of New Entrants
- 3.5.2 Bargaining Power of Suppliers
- 3.5.3 Bargaining Power of Buyers
- 3.5.4 Threat of Substitutes
- 3.5.5 Competitive Rivalry – Intensity Assessment
- 3.6 Caustic Soda Value Chain Analysis
- 3.6.1 Upstream – Key Inputs, Resources & Suppliers
- 3.6.1.1 Key Input/Resource 1
- 3.6.1.2 Key Input/Resource 2
- 3.6.1.3 Key Input/Resource 3
- 3.6.2 Midstream – Core Operations & Value Creation
- 3.6.2.1 Operating Model & Process Overview
- 3.6.2.2 Key Operating Locations & Capabilities by Company
- 3.6.3 Downstream – Market Channels & End Users
- 3.6.3.1 Direct Sales & Customer Engagement Channels
- 3.6.3.2 Indirect Sales, Intermediaries & Partner Channels
- 3.6.4 Value Chain Profitability Analysis
- 3.6.1 Upstream – Key Inputs, Resources & Suppliers
- 3.7 PESTEL Analysis
- 3.7.1 Political Factors
- 3.7.2 Economic Factors
- 3.7.3 Social Factors
- 3.7.4 Technological Factors
- 3.7.5 Environmental Factors
- 3.7.6 Legal Factors
- 3.8 Caustic Soda Supply Chain Analysis
- 3.8.1 Critical Input & Resource Availability Risk Assessment
- 3.8.2 Supplier & Operational Concentration Risk (Geographic Exposure)
- 3.8.3 Supply & Service Disruption Impact Analysis
- 3.9 Regulatory & Policy Landscape
Note: The regulatory and policy landscape section covers regulations based on their applicability to the market, Caustic Soda category, geography, and scope of the study. Only regulatory frameworks with a material impact on operations, compliance, trade, sustainability, or market access are analyzed in detail.
Chapter 4. Key Investment Pockets & Opportunity Analysis
- 4.1 Caustic Soda Market Attractiveness Analysis
- 4.1.1 By Region – Investment Attractiveness Matrix (Market Size × CAGR)
- 4.2 Absolute Revenue Growth Opportunity
- 4.2.1 By Region – Absolute Revenue Growth Through 2032
- 4.3 Incremental Demand Opportunity
- 4.3.1 By Region – Incremental Demand Through 2032
- 4.3.2 Segment – Incremental Demand
- 4.4 Emerging Submarket Opportunity Deep Dive (Subject to Applicability)
- 4.5 Priority Market Opportunity Scorecards
- 4.5.1 United States
- 4.5.2 Europe
- 4.5.3 Asia
- 4.5.4 Middle East & Africa
Note: Priority market opportunity scorecards reflect the geographic scope and strategic relevance of the study. Listed markets are indicative and may be adapted to the industry.
Chapter 5. Caustic Soda Cross-Border Trade & Market Access Analysis
- 5.1 International Trade & Cross-Border Activity Overview
- 5.1.1 Global Export Value by Country (2023)
- 5.1.2 Global Export Volume by Country (2023) (Volume Where Applicable)
- 5.1.3 Global Import Value by Country (2023)
- 5.1.4 Global Import Volume by Country (2023) (Volume Where Applicable)
- 5.1.5 Net Trade Balance by Country (2023)
- 5.2 Export Analysis – Segment
- 5.2.1 Category 1 (Applicable Classification Code)
- 5.2.2 Category 2 (Applicable Classification Code)
- 5.2.3 Category 3 (Applicable Classification Code)
- 5.2.4 Category 4 (Applicable Classification Code)
- 5.2.5 Category 5 (Applicable Classification Code)
- 5.3 Import Analysis – Segment
- 5.3.1 Category 1 (Applicable Classification Code)
- 5.3.2 Category 2 (Applicable Classification Code)
- 5.3.3 Category 3 (Applicable Classification Code)
- 5.3.4 Category 4 (Applicable Classification Code)
- 5.3.5 Category 5 (Applicable Classification Code)
- 5.4 Cross-Border Pricing & Transaction Benchmarks
- 5.4.1 Export Pricing – Segment & Country
- 5.4.2 Import Pricing – Segment & Source Country
- 5.4.3 Price Trends (2023)
- 5.5 Key Cross-Border Trade & Delivery Routes
- 5.5.1 Cross-Border Trade/Delivery Route 1
- 5.5.2 Cross-Border Trade/Delivery Route 2
- 5.5.3 Cross-Border Trade/Delivery Route 3
- 5.5.4 Cross-Border Trade/Delivery Route 4
- 5.5.5 Cross-Border Trade/Delivery Route 5
- 5.6 Trade Policy & Market Access Impact Assessment
- 5.6.1 Tariff & Non-Tariff Barriers
- 5.6.2 Regional Trade & Economic Integration Frameworks
- 5.6.3 Bilateral & Multilateral Trade Agreements
- 5.6.4 Cross-Border Operating, Licensing & Localization Requirements
Note: This chapter applies where cross-border trade or delivery is relevant to Caustic Soda. Goods, services, and digital offerings are assessed using applicable classifications and transaction measures. Import-export volumes, trade balances, and route analyses are included only where meaningful to the market.
Chapter 6. Competitive Landscape & Company Benchmarking
- 6.1 Caustic Soda Market Concentration & Structure
- 6.1.1 Herfindahl-Hirschman Index (HHI) – vs. 2023
- 6.1.2 Leading, Mid-Sized & Emerging Player Structure
- 6.1.3 Global, Regional & Local Player Dynamics
- 6.2 Caustic Soda Market Share Analysis – 2023
- 6.2.1 Global Revenue Share by Company
- 6.2.2 Global Volume Share by Company (Volume Where Applicable)
- 6.2.3 Regional Revenue Share
- 6.2.4 Market Share Evolution ( vs. 2023)
- 6.2.5 Company Market Share by Key Segment
- 6.2.6 Company Market Share by Customer Group
- 6.3 Operating Scale, Capacity & Infrastructure Analysis
- 6.3.1 Global Operating Scale & Supply Capacity
- 6.3.2 Resource Utilization & Operating Efficiency
- 6.3.3 Output, Service Delivery & Activity Metrics
- 6.3.4 Operating Footprint & Infrastructure Map
- 6.3.5 Planned Operational & Capacity Expansion
- 6.4 Caustic Soda Competitive Benchmarking Matrix
- 6.4.1 Revenue, Growth, Profitability & Operating Metric Comparison
- 6.4.2 Channel Revenue Mix
- 6.4.3 Geographic Revenue Exposure
- 6.4.4 R&D Intensity
- 6.4.5 Sustainability Maturity
- 6.5 Strategic Developments in Caustic Soda (Last 24 Months)
- 6.5.1 Mergers, Acquisitions & Divestments
- 6.5.2 New Products, Services & Solutions in Caustic Soda
- 6.5.3 Operational & Infrastructure Expansions
- 6.5.4 Strategic Alliances, Joint Ventures & Partnerships
- 6.5.5 Distribution Expansion & Market Entry
- 6.5.6 Sustainability & ESG Initiatives
- 6.6 Competitive Strategy Mapping
- 6.6.1 Leader, Challenger, Follower & Niche Classification
- 6.6.2 Pricing Strategy Comparison
- 6.6.3 Channel Strategy Matrix
Note: Strategic developments are included based on their materiality and the availability of reliable information.
Chapter 7. Global Caustic Soda Market – By Sales & Delivery Channel
- 7.1 Segment Overview
- 7.1.1 Volume & Revenue Split by Channel (2023 & 2032) (Volume Where Applicable)
- 7.1.2 Channel Mix Evolution (2023-2032)
Chapter 8. Regional Market Analysis – Global Overview
- 8.1 Global Regional Overview
- 8.1.1 Regional Volume Share (Volume Where Applicable)
- 8.1.2 Regional Revenue Share
- 8.1.3 Regional Volume by Region (Volume Where Applicable)
- 8.1.4 Regional Revenue by Region
- 8.1.5 Regional Forecast Through 2032
- 8.2 Cross-Regional Segment Analysis
- 8.2.1 By Sales & Delivery Channel
- 8.2.2 By Competitive Positioning & Price Tier
Chapter 9. North America Caustic Soda Market
- 9.1 United States
- 9.2 Canada
- 9.3 Mexico
Chapter 10. Europe Caustic Soda Market
- 10.1 Germany
- 10.2 France
- 10.3 Italy
- 10.4 United Kingdom
- 10.5 Spain
- 10.6 Poland
- 10.7 Russia
- 10.8 Netherlands
- 10.9 Belgium
- 10.10 Sweden
- 10.11 Denmark
- 10.12 Norway
- 10.13 Rest of Europe
Chapter 11. Asia Pacific Caustic Soda Market
- 11.1 China
- 11.2 India
- 11.3 Japan
- 11.4 South Korea
- 11.5 Thailand
- 11.6 Indonesia
- 11.7 Vietnam
- 11.8 Malaysia
- 11.9 Australia
- 11.10 Rest of Asia Pacific
Chapter 12. Latin America Caustic Soda Market
- 12.1 Brazil
- 12.2 Argentina
- 12.3 Colombia
- 12.4 Chile
- 12.5 Rest of Latin America
Chapter 13. Middle East Caustic Soda Market
- 13.1 Saudi Arabia
- 13.2 United Arab Emirates
- 13.3 Turkey
- 13.4 Israel
- 13.5 Iran
- 13.6 Rest of the Middle East
Chapter 14. Africa Caustic Soda Market
- 14.1 South Africa
- 14.2 Egypt
- 14.3 Nigeria
- 14.4 Morocco
- 14.5 Rest of Africa
Chapter 15. Caustic Soda Company Profiles
- 15.1 [Company 01]
- 15.1.1 Company Overview
- 15.1.2 Key Management Personnel
- 15.1.3 Products & Services Portfolio
- 15.1.4 Financial Performance
- 15.1.5 Key Market Focus & Geographic Presence
- 15.1.6 Recent Developments & Strategic Initiatives
Note: The company profile list is preliminary and may change based on research findings, market developments, data availability, and client requirements.
Chapter 16. Appendices
- Appendix A – List of Abbreviations & Acronyms
- Appendix B – Industry Classification Code Reference – Full Series
- Appendix C – Supply, Output & Operating Capacity Data Tables
- Appendix D – End-Use & Demand Base Tables
- Appendix E – Demand, Adoption & Usage Assumptions
- Appendix F – Pricing & Revenue Metric Reference Tables
- Appendix G – Company Operations & Infrastructure Database
- Appendix H – Cross-Border Trade & Activity Data Tables (Where Applicable)
- Appendix I – Regulatory Summary Tables
- Appendix J – Primary Research Participant List (Anonymized)
- Appendix K – Primary Research Questionnaire Framework
- Appendix L – Data Sources & Bibliography
- Appendix M – Market Size Divergence & Source Comparison
Chapter 17. Research Methodology
- 17.1 Research Framework & Philosophy
- 17.2 Secondary Research – Sources, Hierarchy & Data Extraction
- 17.3 Data Modeling – Bottom-Up & Top-Down Market Sizing
- 17.4 Primary Research – Stakeholder Framework, LOI & Sample Sizes
- 17.5 Forecast Methodology – Regression, Scenario & Sensitivity Analysis
- 17.6 Quality Control – Four-Layer Validation Framework
- 17.7 Limitations & Standard Assumptions
- 17.8 Disclaimer
