
Emotion AI moves into cars, contact centers and clinics
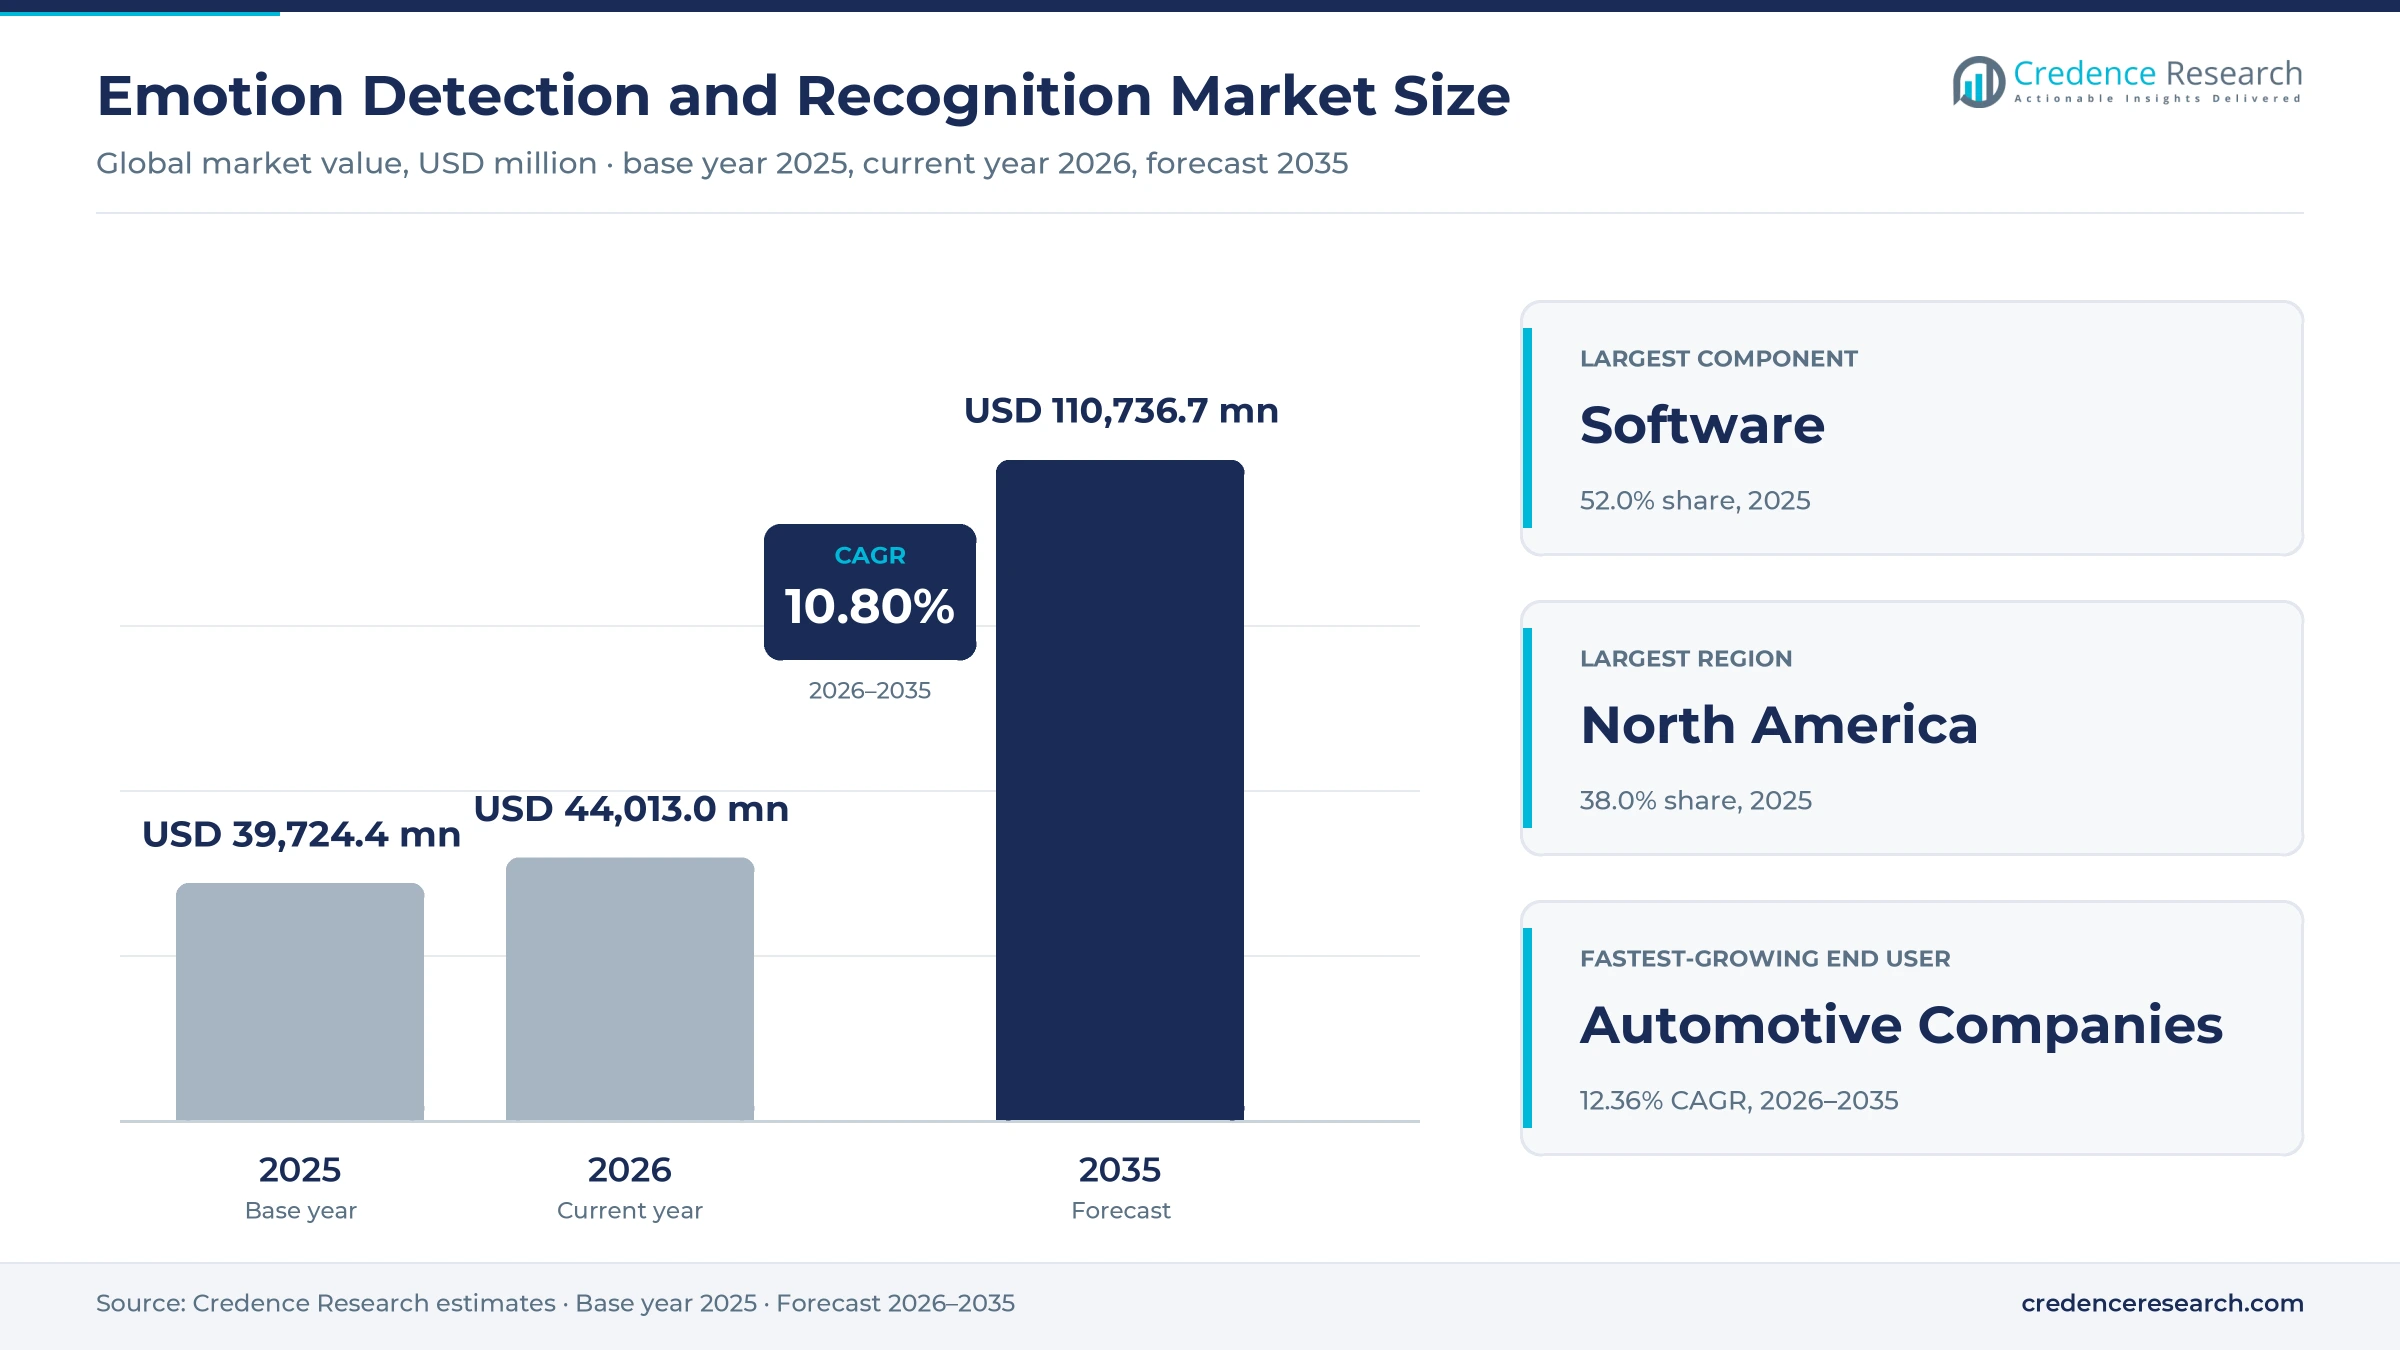
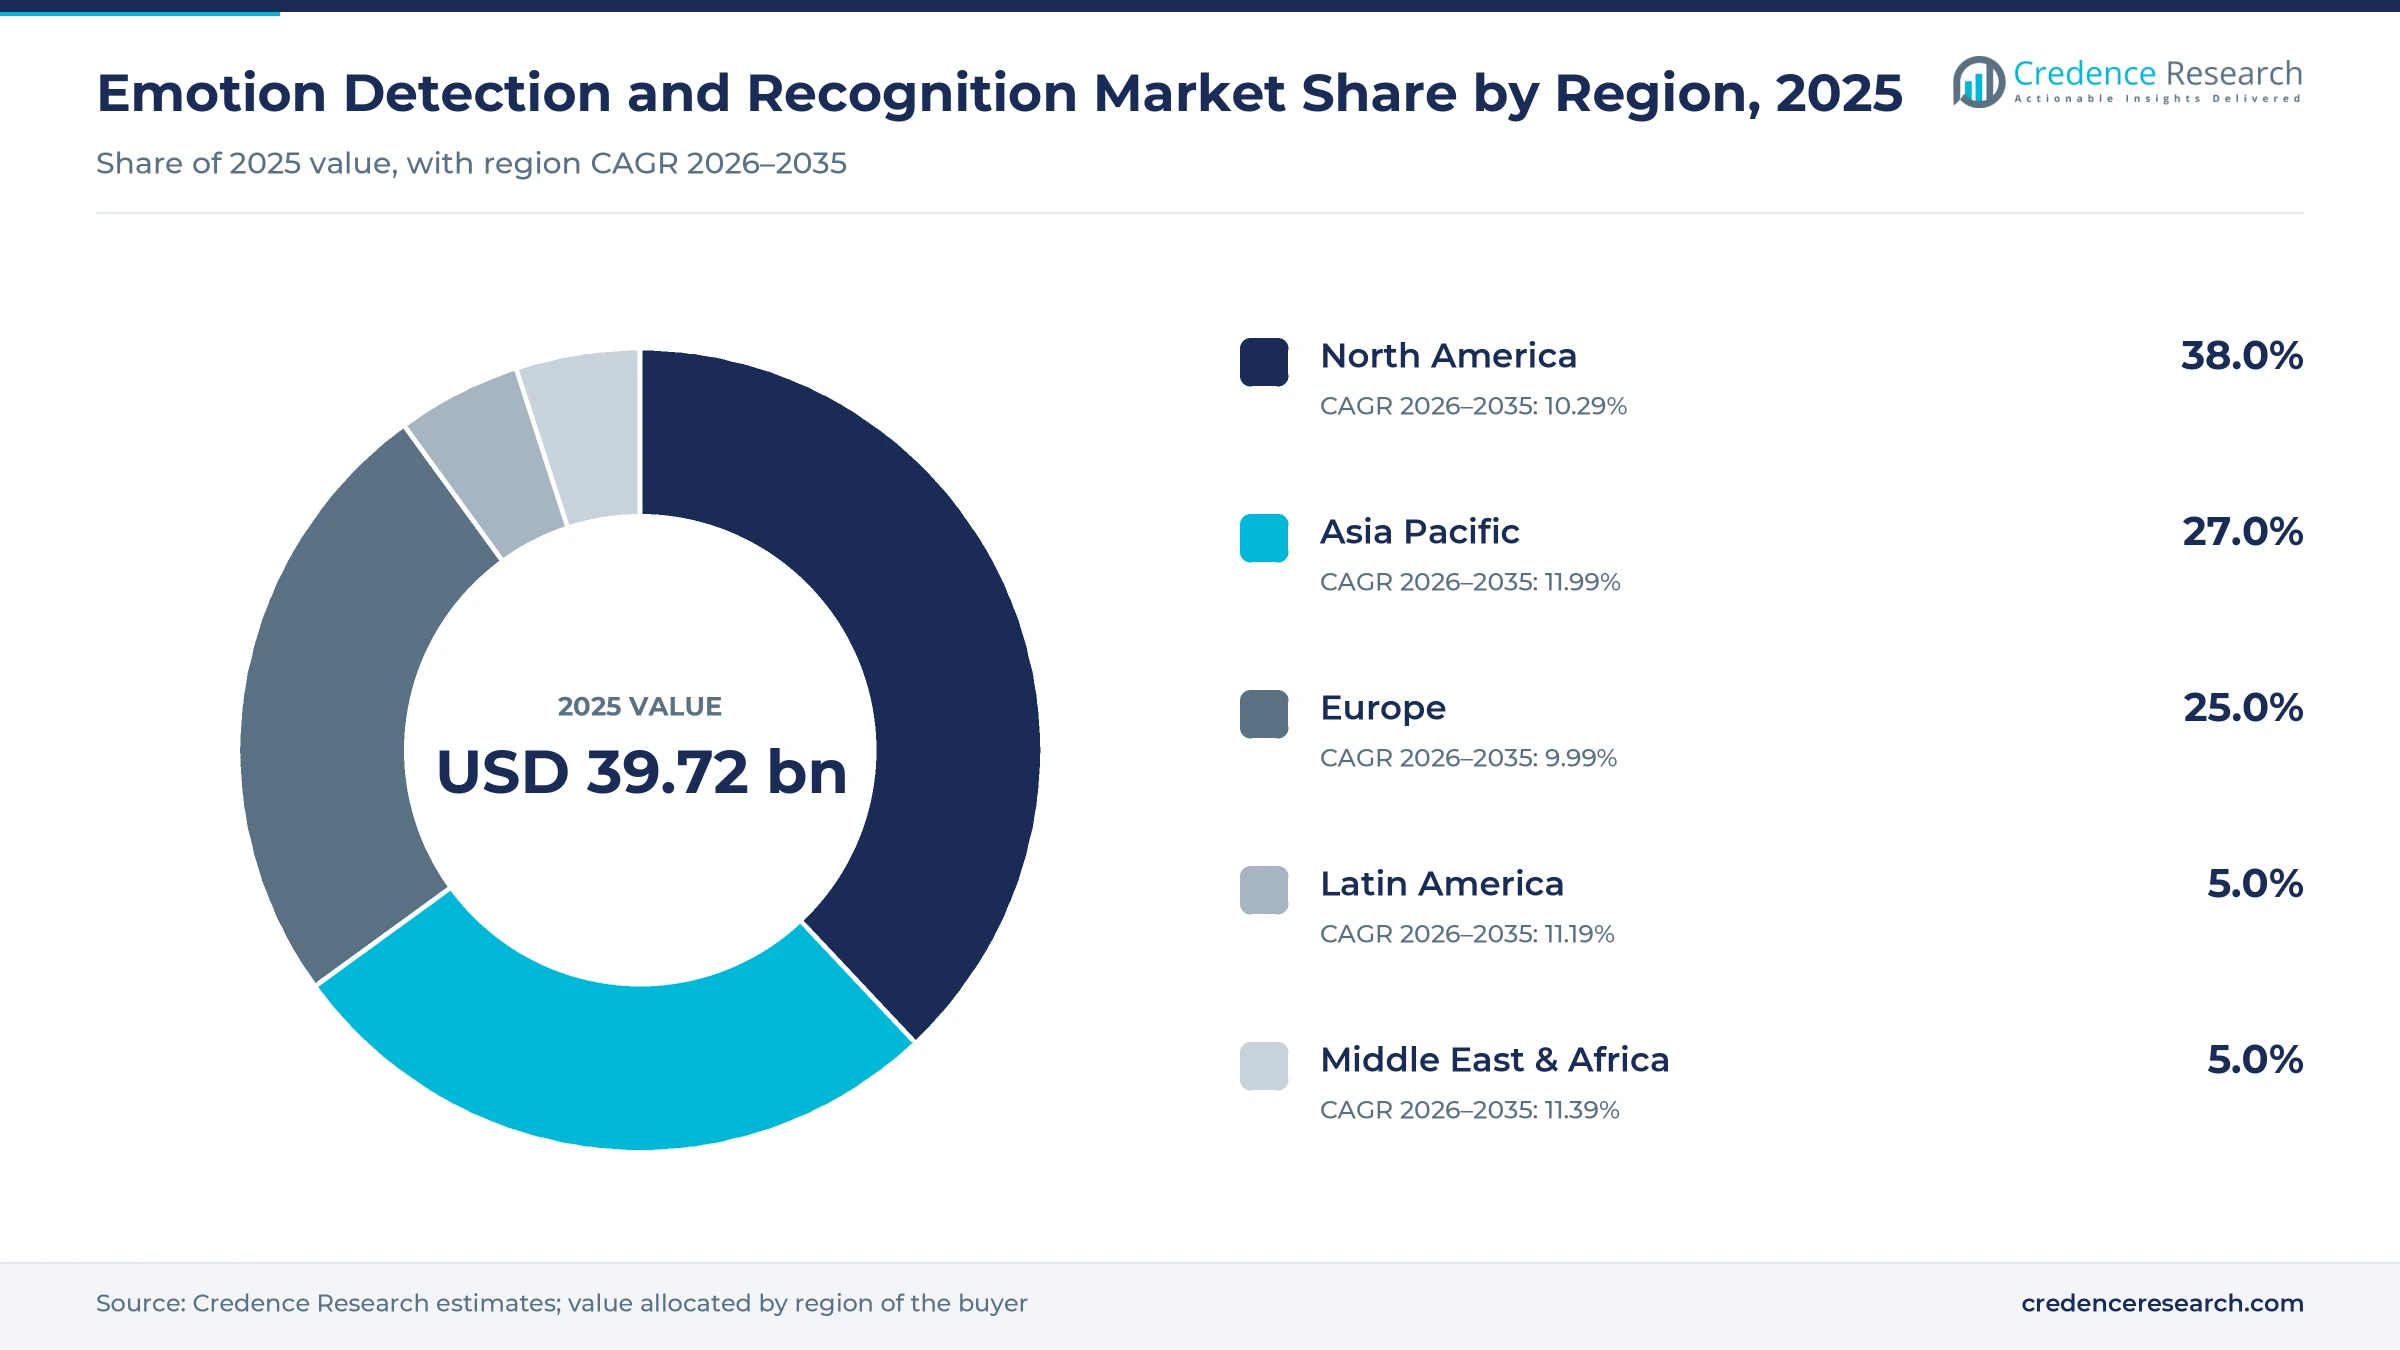
The global emotion detection and recognition market was valued at USD 39.72 billion in 2025 and is projected to increase from USD 44.01 billion in 2026 to USD 110.74 billion by 2035, registering a CAGR of 10.80% during 2026–2035. Demand comes from carmakers that must monitor driver attention, brands that analyze customer reactions, and health providers that track mood and stress. North America held the largest regional share, 38.0% in 2025, because large cloud, contact center and automotive buyers adopt affective computing tools there first. Asia Pacific is the fastest-growing region at 11.99% a year, as Japan, China and South Korea add camera-based safety systems and smart retail tools. The regulatory picture also shifted in 2025, when the European Union banned emotion inference in workplaces and schools. As a result, vendors are moving toward safety, health and consent-based customer uses.
Which emotion AI products and services does this analysis count?
The analysis counts software, sensing hardware and related services that infer emotional states from faces, voices, text and physiological signals, valued at vendor selling prices. Enterprises, carmakers, health providers and public agencies buy these tools through software licenses, cloud subscriptions, embedded modules and integration contracts.
General identity verification systems without an affective function sit outside the scope of this analysis. The value chain runs from camera, microphone and sensor suppliers through model developers and platform vendors to integrators and the organizations that use the insights in daily operations.
Emotion Detection and Recognition Market Insights
- The emotion detection and recognition market grows from USD 39.72 billion in 2025 to USD 110.74 billion by 2035, a 10.80% CAGR as affective AI moves into cars, contact centers and clinics.
- North America held 38.0% of global affective computing value in 2025, supported by large cloud providers, contact center buyers and research labs.
- Software led components with 52.0% of 2025 value, while automotive companies grow fastest among end users at 12.36% a year.
- In February 2025, EU rules banning emotion inference in workplaces and education institutions became effective, which pushed vendors toward safety and health uses.
- Tobii, NEC, Microsoft, IBM and Cognitec compete with specialist firms such as iMotions, Kairos and Elliptic Labs on accuracy, privacy and integration.
Software leads while voice analysis grows fastest
Why does software take most component spending?
Based on component, the market is categorized into hardware, software and services. Software led with a 52.0% share of 2025 value, because analysis models, cloud interfaces and analytics dashboards are sold as recurring licenses. Software also grows fastest at 11.19% a year, as buyers add affective features to existing platforms. Hardware covers cameras, infrared modules and biosensors, while services cover integration, model training and data labeling work.
Which technology grows fastest through 2035?
Based on technology, the market is categorized into text analysis, facial recognition, voice recognition and neurological measurement. Facial Recognition led with a 40.0% share of 2025 value, because cameras already sit in phones, cars, stores and laptops. Voice Recognition grows fastest at 11.43% a year, as voice agents and contact center tools read tone, pace and pauses in real time.
How do automotive buyers change the end-user mix?
Based on end user, the market is categorized into enterprises, healthcare providers, government and defense, automotive companies, media and entertainment companies, and others. Enterprises led with a 34.0% share of 2025 value, because brands and contact centers analyze customer reactions at scale. Automotive Companies grow fastest at 12.36% a year, as safety rules require driver attention monitoring in new vehicles.
Why does customer experience lead application spending?
Based on application, the market is categorized into customer experience and feedback analysis, healthcare and mental health monitoring, security and surveillance, and others. Customer Experience & Feedback Analysis led with a 39.0% share of 2025 value, because retailers and service firms measure reactions to products, calls and ads. Healthcare & Mental Health Monitoring grows fastest at 11.89% a year, as clinicians test voice and facial markers for stress and depression.
| Segment Group | Leading Sub-segment | Share, 2025 | Fastest-growing Sub-segment | CAGR, 2026–2035 |
|---|---|---|---|---|
| By Component | Software | 52.0% | Software | 11.19% |
| By Technology | Facial Recognition | 40.0% | Voice Recognition | 11.43% |
| By End User | Enterprises | 34.0% | Automotive Companies | 12.36% |
| By Application | Customer Experience & Feedback Analysis | 39.0% | Healthcare & Mental Health Monitoring | 11.89% |
Request a Free Sample
Fill in your details and we'll send you a free sample report.
- Sample data tables & charts
- Research methodology
Car safety rules and customer analytics lift demand
How do car safety rules push driver monitoring demand?
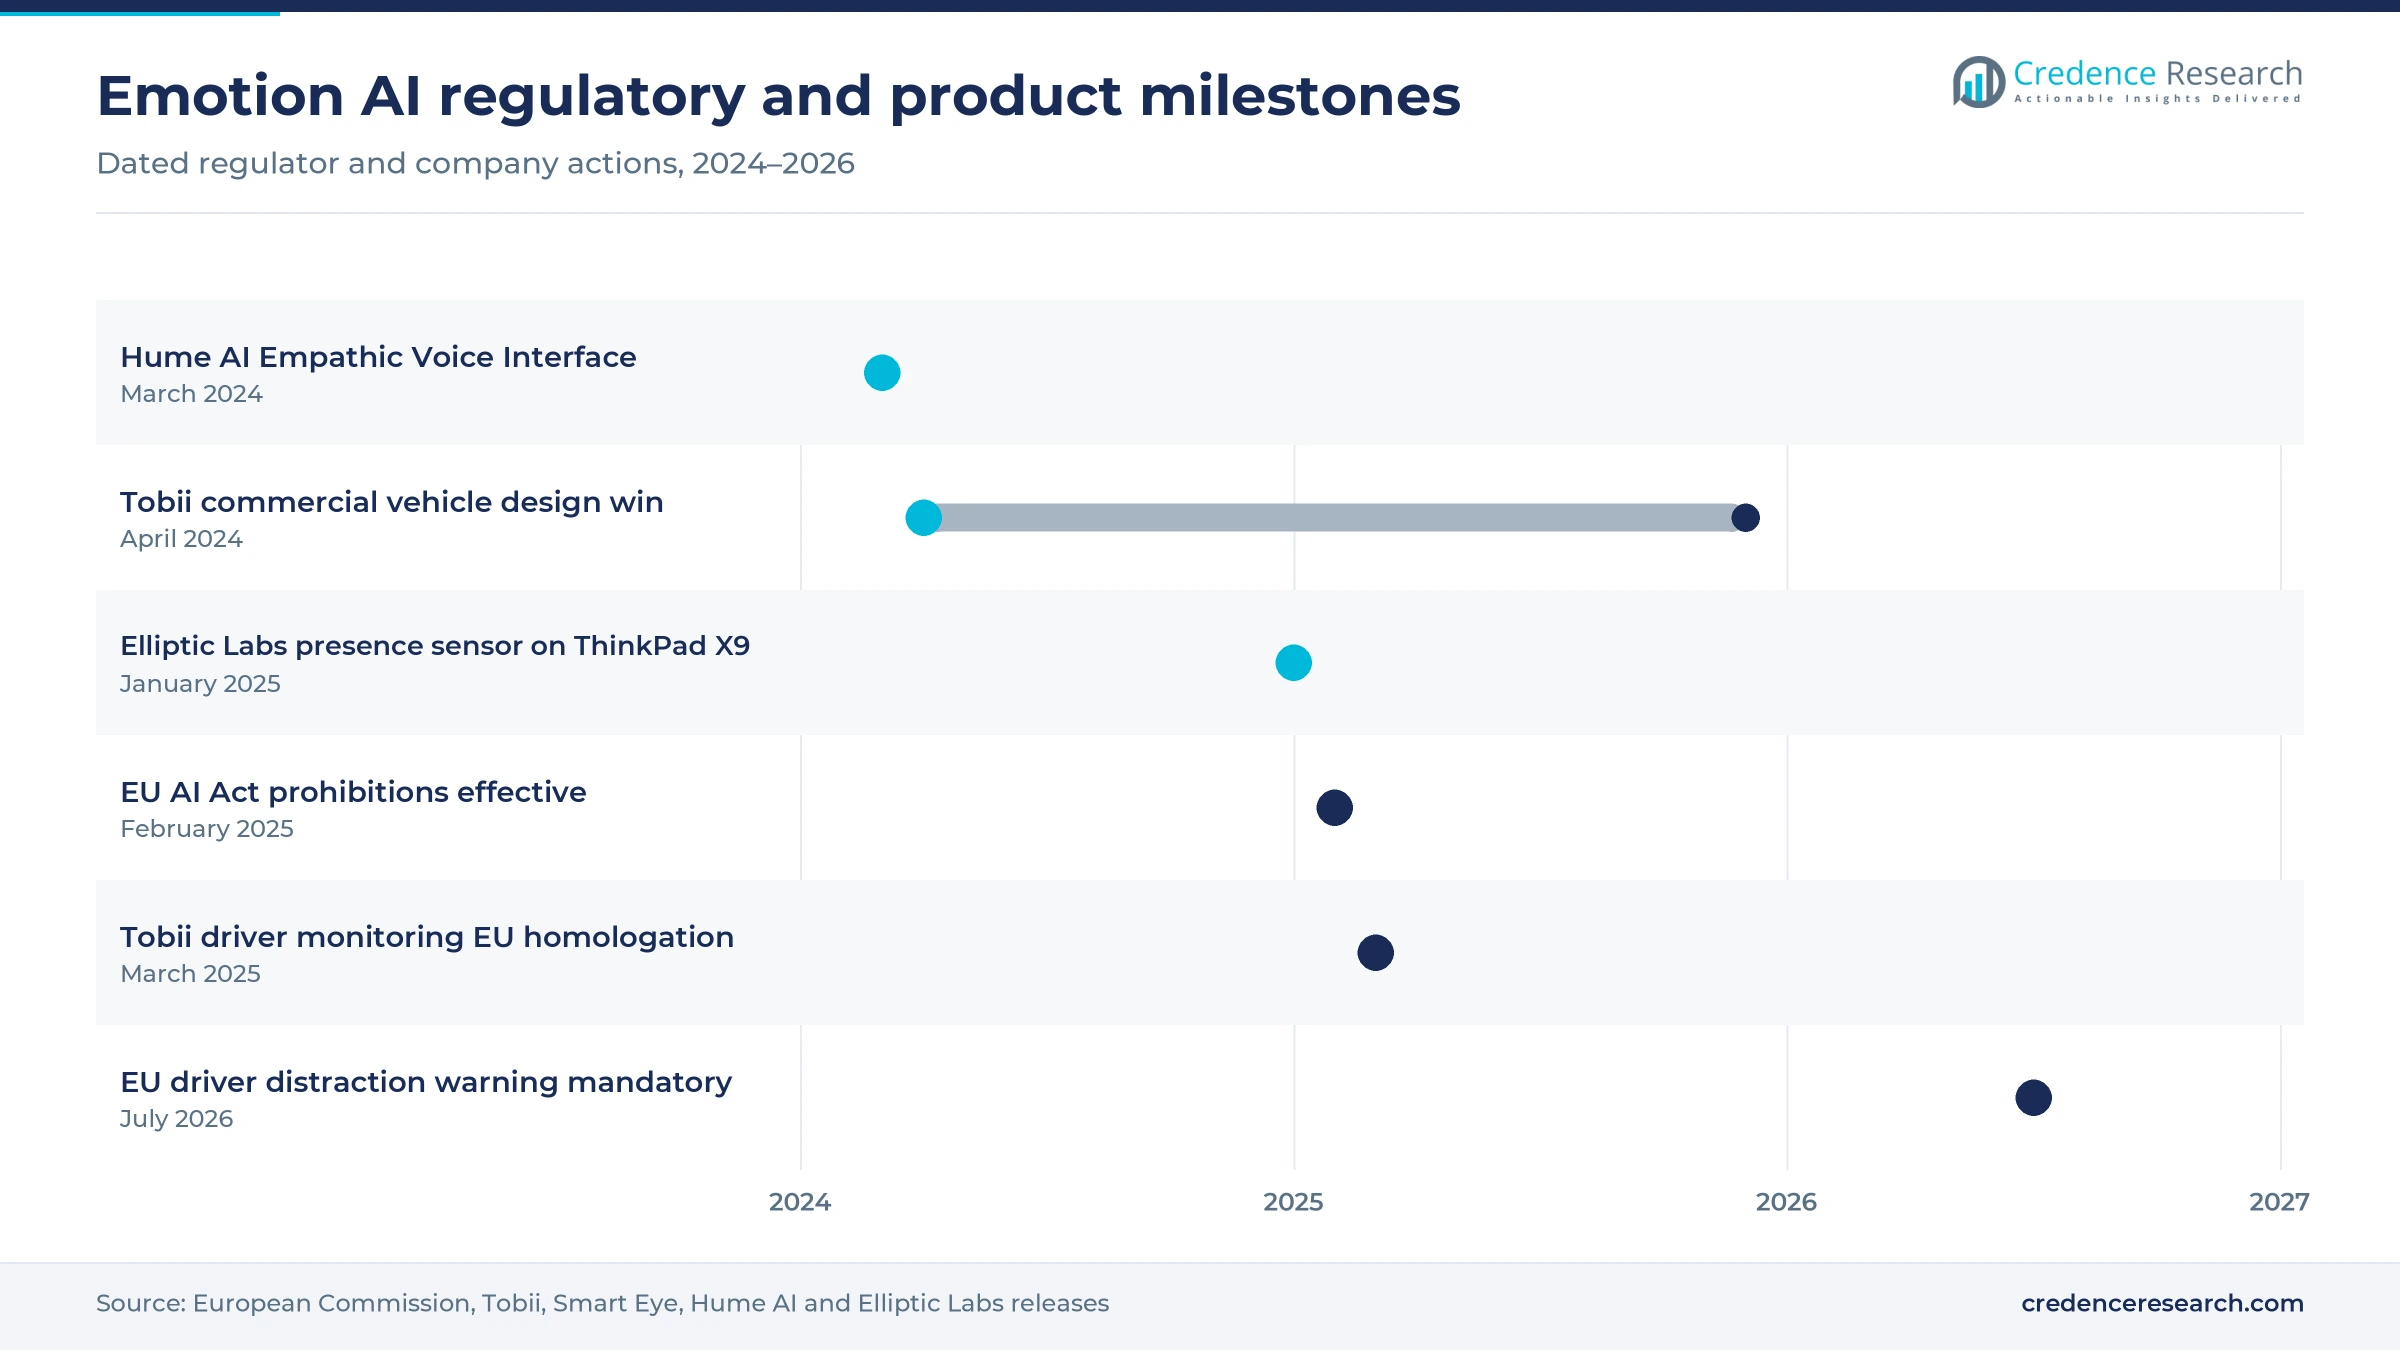
Vehicle safety rules are a strong driver, because carmakers must detect drowsy and distracted drivers inside the cabin. From July 7, 2026, advanced driver distraction warning systems became mandatory in all new vehicles sold in the European Union under the General Safety Regulation. These systems use cameras and software that read gaze, head position and eye closure, and Tobii software passed EU homologation for one such program in March 2025. As a result, driver monitoring systems now ship in far more vehicle models than before.
Why do supplier design wins expand cabin sensing?
Supplier design wins expand cabin sensing, because carmakers buy monitoring software through large tier 1 suppliers for many models at once. In April 2024, Tobii secured a design win with a European commercial vehicle OEM for driver monitoring software, with production for six vehicle models scheduled to start by late 2025. Tobii said its automotive unit served eight OEMs and three tier 1 suppliers, with design wins across more than 100 vehicle models. In turn, attention and fatigue analytics reach heavy trucks as well as passenger cars.
How does customer experience analytics raise software spending?
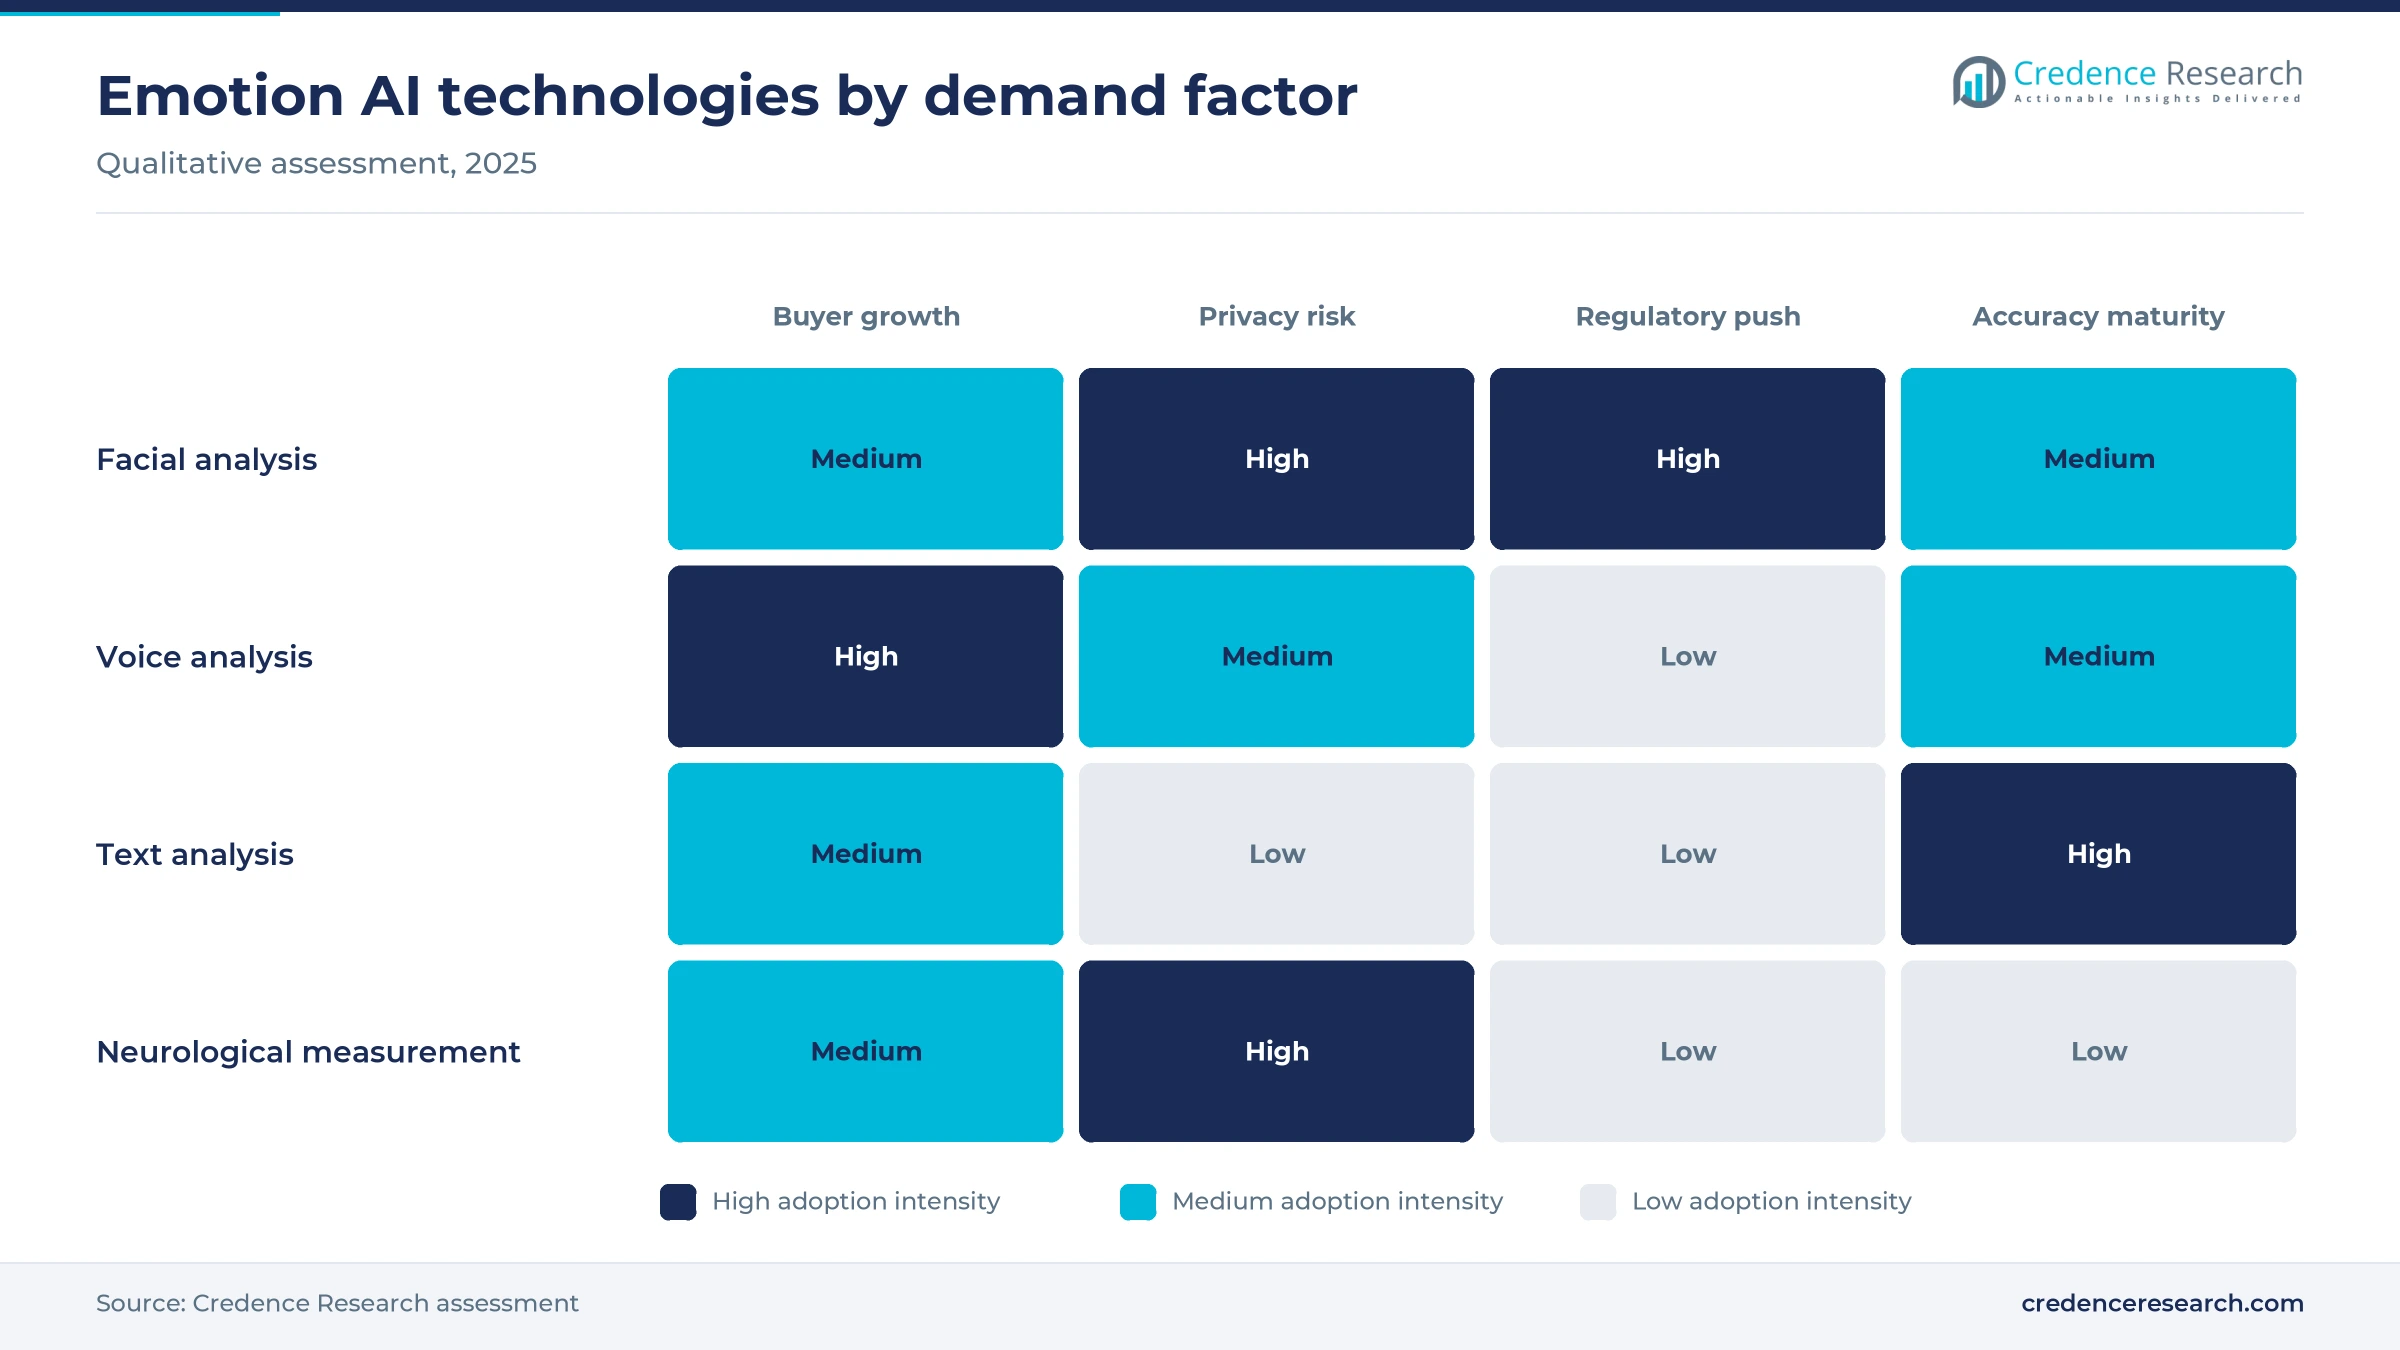
Customer experience analytics raises software spending, because brands want to know how buyers feel during calls, chats and store visits. Contact centers use voice tone and text sentiment to flag frustrated callers and guide agents in real time. Retailers and media firms also test ads and content with facial coding and eye tracking panels before launch. As a result, enterprises remain the largest buyer group, and they renew analytics subscriptions each year.
Why does wider AI adoption create more buyers?
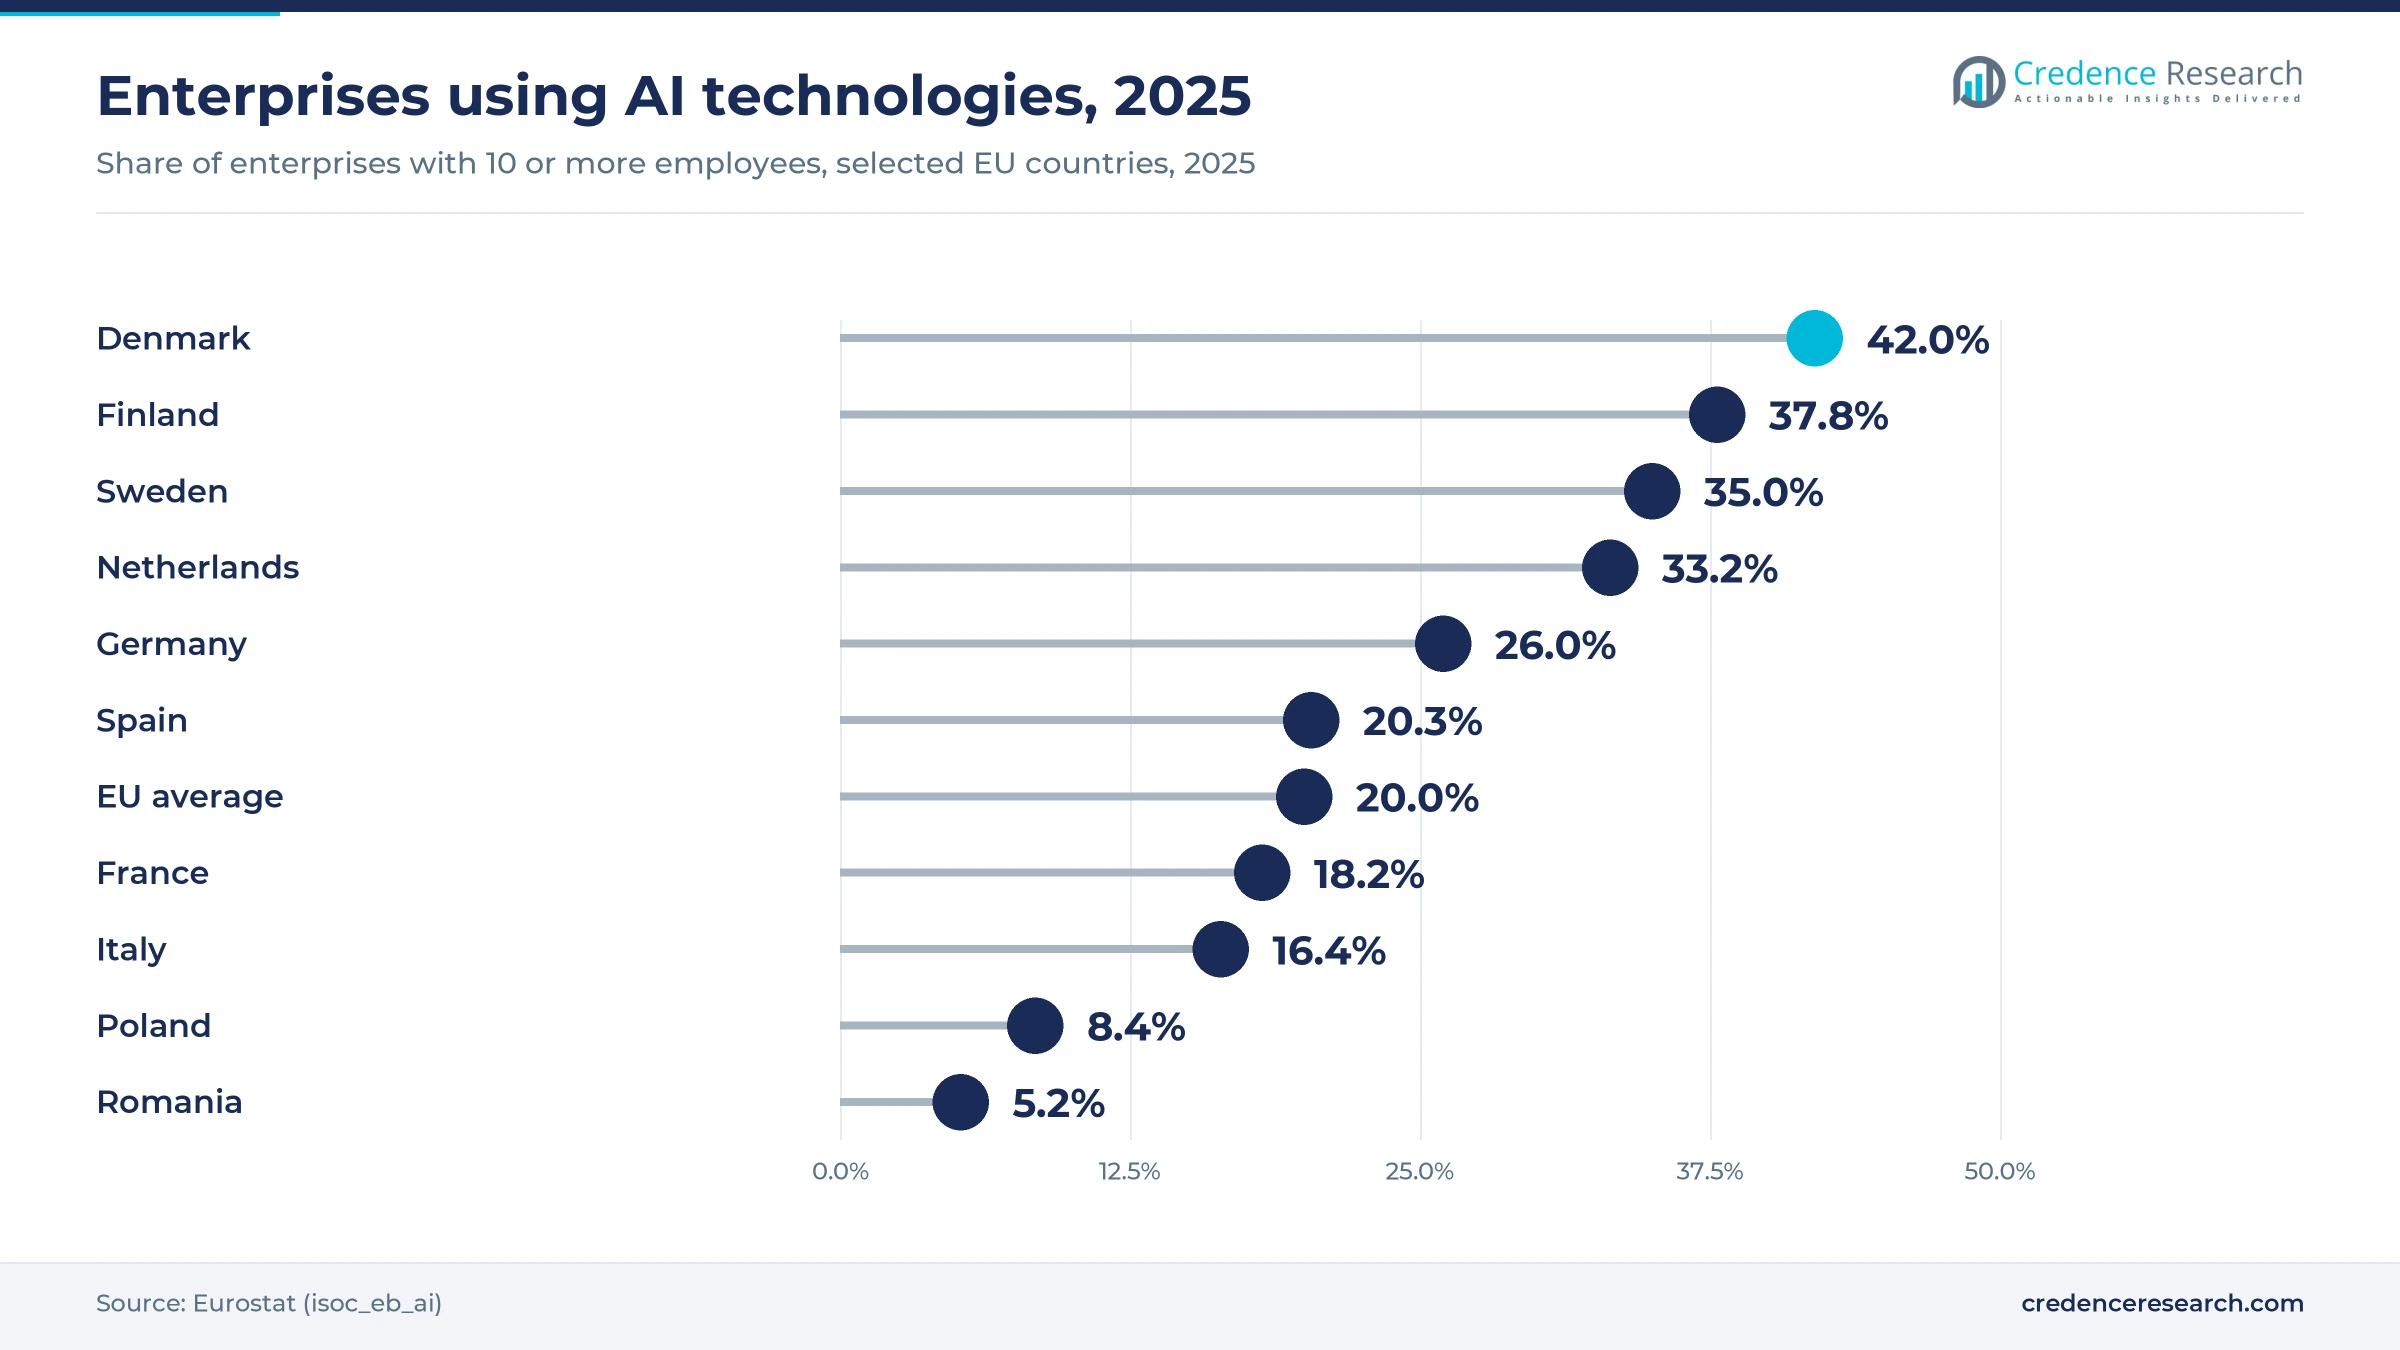
Wider AI adoption creates more buyers, because firms that already use machine learning can add affective features at low cost. Eurostat reported that 19.95% of EU enterprises with 10 or more employees used at least one AI technology in 2025. Denmark reached 42.03%, while Romania reached only 5.21%, which shows both strong demand and wide room for growth. In turn, vendors gain new customers as AI moves from pilot projects into routine business software.
Multimodal models and Empathic voice agents gain ground
How are empathic voice agents emerging in customer service?
Empathic voice agents are emerging quickly, because firms want automated assistants that respond to tone as well as words. In March 2024, Hume AI raised USD 50 million and unveiled its Empathic Voice Interface, a voice-to-voice system that reads vocal tone and knows when users finish speaking. Developers can build the interface into apps and service lines. As a result, conversational AI vendors now treat tone analysis as a standard feature.
Why is multimodal analysis rising over single signals?
Multimodal analysis is rising, because single signals such as facial expression alone often misread how a person feels. Research platforms such as iMotions combine facial coding, voice analysis, eye tracking, skin response and brain signals in one study, and its voice module added in September 2023 scores three dimensions of emotion. Carmakers likewise pair camera data with steering and seat signals to judge fatigue more reliably. In turn, buyers increasingly prefer vendors that fuse several inputs and report confidence levels for each result.
Can on-device sensing open a laptop and phone opportunity?
On-device sensing offers a clear opportunity, because processing data locally reduces privacy risk and cloud cost. In January 2025, Elliptic Labs launched its AI Virtual Human Presence Sensor on Lenovo ThinkPad X9 Aura Edition laptops. The software detects a user in front of the 14-inch screen without a dedicated hardware sensor, and it builds on the earlier ThinkPad X1 Carbon Gen 13 launch. As a result, device makers can add attention and presence features through software updates rather than new parts.
Where can vendors win share in mental health monitoring?
Vendors can win share in mental health monitoring, because clinicians need objective signals between visits for depression, anxiety and stress. Voice biomarkers, facial cues and wearable data can flag changes that patients may not report themselves. Providers also use computer vision to observe engagement during telehealth sessions with patient consent. As a result, tools with clinical evidence and clear consent models have strong prospects over the next decade.
Privacy law, bias and accuracy doubts slow adoption
How do EU AI rules restrict emotion inference?
EU rules are the main constraint, because the AI Act prohibits emotion recognition in workplaces and education institutions, and those prohibitions became effective in February 2025. Other uses of emotion recognition fall into the high-risk category, which requires documentation, testing and human oversight. Rules for high-risk uses in sensitive areas now apply from Dec. 2, 2027, after the AI Omnibus agreement. Vendors selling into Europe must therefore redesign products and limit employee monitoring features. As a result, sales cycles in Europe grow longer than in other regions.
Why do accuracy and bias concerns slow buyers?
Accuracy and bias concerns slow buyers, because facial expressions differ across cultures, ages and medical conditions. A smile or frown does not always reflect the emotion that a model assigns to it. Errors can lead to unfair decisions when results feed into hiring, security or credit checks, where mistakes can affect many people at once. In turn, cautious buyers limit use to aggregated insights and require vendors to publish testing results across demographic groups.
How do privacy laws and consent rules add cost?
Privacy laws add cost, because facial images, voice recordings and physiological signals are treated as sensitive personal data in many countries. Firms must collect consent, store data securely and delete recordings on request. Some vendors therefore move processing onto devices and avoid storing raw video, as Elliptic Labs did with its software-only presence sensor launched in January 2025. As a result, compliance work raises project costs and slows rollouts in retail and public spaces.
Why does public trust limit surveillance uses?
Public trust limits surveillance uses, because many citizens object to cameras that judge mood in streets, stations and stores. Civil society groups and regulators question whether emotion inference is scientifically reliable enough for policing. Government buyers then face legal challenges and reputational risk when they deploy these tools, and the AI Act limits real-time remote biometric identification in public spaces. In turn, security vendors shift toward video analytics for crowd flow and safety rather than individual emotion scoring.
North America leads as Asia Pacific grows fastest
| Region | Value, 2025 (USD billion) | Share, 2025 | CAGR, 2026–2035 |
|---|---|---|---|
| North America | 15.10 | 38.0% | 10.29% |
| Asia Pacific | 10.73 | 27.0% | 11.99% |
| Europe | 9.93 | 25.0% | 9.99% |
| Latin America | 1.99 | 5.0% | 11.19% |
| Middle East & Africa | 1.99 | 5.0% | 11.39% |
Why does North America hold the largest regional share?
North America held a 38.0% share of 2025 value and grows at 10.29% a year through 2035. The United States drives this position, because large cloud providers, contact center operators and advertising firms buy affective analytics at scale. Microsoft and IBM supply cloud AI services, while startups such as Hume AI and Kairos build specialist tools. Universities and health systems also fund research on voice and facial markers for mental health.
How fast is Asia Pacific adding deployments?
Asia Pacific held a 27.0% share of 2025 value and is the fastest-growing region at 11.99% a year. Japan has long used driver monitoring in production vehicles, and Tobii said its programs since 2019 had mostly shipped in Japan. NEC supplies face analysis and biometric systems across the region, while China and South Korea add smart retail and service robots. Rising vehicle output and dense camera networks keep demand growing faster than in other regions.
What shapes demand across Europe?
Europe held a 25.0% share of 2025 value and grows at 9.99% a year through 2035. Driver distraction warning rules support strong automotive demand, and in March 2025, Tobii said its driver monitoring software received EU homologation for a commercial vehicle program. However, the AI Act bans emotion inference in workplaces and schools, so enterprise and education uses grow more slowly than in North America. Eurostat data show AI use at 25.97% of German, 18.16% of French and 16.4% of Italian enterprises in 2025.
Where is Latin America adding demand?
Latin America held a 5.0% share of 2025 value and grows at 11.19% a year through 2035. Brazil and Mexico lead regional demand, mainly through contact center analytics and retail customer research.
What limits growth in the Middle East and Africa?
The Middle East and Africa held a 5.0% share of 2025 value and grows at 11.39% a year through 2035. Gulf states add demand from smart city and airport projects, while adoption across most of Africa remains limited.
Driver monitoring and voice AI advanced since 2024
| Development | Status and market relevance |
|---|---|
| In March 2024, Hume AI announced a USD 50 million Series B and unveiled its Empathic Voice Interface. | Launched; voice-to-voice AI that reads vocal tone in conversation |
| In April 2024, Tobii secured a design win to supply driver monitoring software to a European commercial vehicle OEM. | Production for six vehicle models scheduled to start by late 2025 |
| In January 2025, Elliptic Labs launched its AI Virtual Human Presence Sensor on Lenovo ThinkPad X9 Aura Edition laptops. | Shipping; software-only presence detection without a hardware sensor |
| In February 2025, EU AI Act prohibitions on emotion recognition in workplaces and education institutions became effective. | In force; other emotion recognition uses fall into the high-risk category |
| In March 2025, Tobii announced that its driver monitoring software received EU homologation for a commercial vehicle program. | Homologated; confirms the software meets EU safety standards for commercial vehicles |
Multimodal AI, edge sensors and voice models lead change
- Multimodal models combine face, voice, text and body signals, which reduces errors that come from reading a single cue.
- Infrared cabin cameras track gaze and eye closure in any light, which supports driver distraction warning rules applied to all new EU vehicles from July 2026.
- Empathic voice models read tone and timing in speech, which lets service agents and assistants respond to frustration or stress.
- On-device AI processing keeps raw images and audio on the device, which lowers privacy risk and cloud costs for buyers.
Need a Custom Version of This Report?
Tailor the scope, geography, or segments to your exact requirements.
- Custom geography or segment scope
- Direct access to our analyst team
Biometric specialists and cloud groups compete on accuracy
Competition is led by biometric specialists, eye tracking firms and large cloud and technology groups that sell affective features inside broader platforms. NEC and Cognitec supply face analysis engines for security and access control, while Ayonix and Kairos offer face analysis software for developers. Microsoft and IBM provide cloud AI services that enterprises use to build their own tools. Tobii competes in driver monitoring and attention computing with more than 100 vehicle models in its design wins, and Elliptic Labs sells software-only presence sensing for laptops and phones. iMotions offers a research platform that combines facial coding, eye tracking and physiological signals, and Beyond Verbal developed voice-based emotion analytics. Vendors compete on accuracy across demographic groups, privacy design, regulatory compliance and ease of integration. As a result, buyers often favor suppliers that can show validated results and offer on-device or private cloud deployment.
Companies profiled and their roles in this market
| Company | Type | Role in the market |
|---|---|---|
| NEC | Biometrics | Face analysis and biometric systems for security and public safety |
| IBM | Cloud and AI | AI services and natural language tools for enterprises |
| Microsoft | Cloud and AI | Azure AI services used to build analytics applications |
| Tobii | Eye tracking | Driver monitoring software and attention computing |
| Elliptic Labs | Software sensing | AI Virtual Smart Sensors for laptops and phones |
| Cognitec | Biometrics | Face recognition engines and analysis software |
| iMotions | Research platform | Multimodal human behavior research software |
| Beyond Verbal | Voice analytics | Voice-based emotion analytics |
| Ayonix | Biometrics | Face analysis software for developers |
| Kairos | Biometrics | Face analysis software and interfaces for developers |
Automotive and health uses set the growth pace
Credence Research's view is that automotive safety and health monitoring will set the pace of growth through 2035, because both have clear regulatory or clinical value. The overall market grows at 10.80% a year, supported by driver monitoring rules, customer analytics and wider AI adoption. Facial analysis keeps the largest base, but voice analysis grows faster as service agents become more conversational. Companies that combine multimodal accuracy with privacy by design and strong compliance will win the most contracts, while tools built for workplace monitoring face tighter limits in Europe.
How Credence Research sized affective computing spending
The report uses 2025 as the base year and 2026 to 2035 as the forecast period. Market values come from the Credence Research model, which builds spending by component, technology, end user, application and region. Regional and segment splits are Credence Research estimates informed by Eurostat statistics, European Commission regulatory documents and company press releases. No primary interviews or surveys were used in preparing this edition of the report.
Affective computing spending outlook to 2035
By 2035, the emotion detection and recognition market is projected to reach USD 110.74 billion, with growth led by automotive, voice and health uses. Facial analysis will remain the largest technology, although buyers will expect multimodal accuracy and clear consent. North America keeps the highest spending, while Asia Pacific adds the most new deployments through vehicles and smart devices. More processing will move onto devices over the forecast period. As a result, advantage will depend on validated accuracy, privacy design and regulatory compliance.
Frequently Asked Questions
How big is the global emotion detection and recognition market?
Which component leads the market?
Which region leads spending on emotion AI?
Which end user grows fastest?
How does the EU AI Act affect emotion recognition?
Why is driver monitoring important for this market?
Who are the leading emotion detection and recognition companies?
What restrains growth in emotion AI?
Table of Content
Chapter 1 Market Segmentation
- 1.1 Segmentation Framework
- 1.1.1 Product and Service Classification
- 1.1.2 Application and End-Use Classification
- 1.1.3 Technology and Solution Classification
- 1.1.4 Customer and Distribution Channel Classification
- 1.1.5 Geographic Segmentation
- 1.1.6 Market Segment Definitions and Boundaries
- 1.2 By Component
- 1.2.1 Software
- 1.2.2 Hardware
- 1.2.3 Services
- 1.3 By Technology
- 1.3.1 Facial Recognition
- 1.3.2 Voice Recognition
- 1.3.3 Text Analysis
- 1.3.4 Neurological Measurement
- 1.4 By End User
- 1.4.1 Enterprises
- 1.4.2 Government & Defense
- 1.4.3 Automotive Companies
- 1.4.4 Healthcare Providers
- 1.4.5 Media & Entertainment Companies
- 1.4.6 Others
- 1.5 By Application
- 1.5.1 Customer Experience & Feedback Analysis
- 1.5.2 Security & Surveillance
- 1.5.3 Healthcare & Mental Health Monitoring
- 1.5.4 Others
Chapter 2 Introduction
- 2.1 Report Objectives and Scope
- 2.2 Product Definition and Industry Terminology
- 2.3 Market Inclusions and Exclusions
- 2.4 Research Process
- 2.4.1 Primary Research and Expert Interviews
- 2.4.2 Secondary Research and Source Review
- 2.4.3 Top-Down and Bottom-Up Estimation
- 2.4.4 Data Triangulation and Verification
- 2.5 Market Size Measurement Basis
- 2.5.1 2025: USD 39.72 billion → 2035: USD 110.74 billion
- 2.6 Historical and Forecast Reference Periods
- 2.6.1 Historical Period: 2018-2025
- 2.6.2 Base Year: 2025
- 2.6.3 Forecast Period: 2025-2035
- 2.7 Research Assumptions and Limitations
Chapter 3 Executive Summary
- 3.1 Market Snapshot and Key Findings
- 3.2 Base-Year Market Size, 2025
- 3.3 Forecast Market Size, 2035
- 3.4 Revenue and Volume Growth Outlook
- 3.5 Key Demand and Supply Indicators
- 3.6 Leading Market Segments
- 3.7 Fastest-Growing Market Opportunities
- 3.8 Regional Performance Highlights
- 3.9 Technology and Industry Transformation
- 3.10 Competitive Landscape Summary
- 3.11 Analyst View and Strategic Implications
Chapter 4 Global Emotion Detection and Recognition Market Trends and Developments
- 4.1 Historical Industry Development, 2018-2025
- 4.2 Recent Market Trends and Developments
- 4.3 Demand and Customer Behavior Trends
- 4.4 Technology and Product Innovation
- 4.5 Artificial Intelligence, Automation and Digitalization
- 4.6 Local Manufacturing and Supply Chain Realignment
- 4.7 Industry Partnerships, Mergers and Acquisitions
- 4.8 Sustainability and Circular Economy Developments
- 4.9 Government and Private Sector Investment Trends
- 4.10 Emerging Business Models and Commercialization
- 4.11 Industry Developments and Announcements
Chapter 5 Global Emotion Detection and Recognition Market Production, Supply and Demand Analysis
- 5.1 Demand Trend and Consumption Analysis, 2018-2025
- 5.2 Demand Forecast, 2025-2035
- 5.3 Production and Output Trend, 2018-2025
- 5.4 Production and Output Forecast, 2025-2035
- 5.5 Installed Capacity and Capacity Utilization
- 5.6 Company-Wise Production Plants and Statistics
- 5.6.1 Installed Production Capacity
- 5.6.2 Actual Production
- 5.6.3 Planned Capacity and Expansion Targets
- 5.7 Supply Chain Structure and Procurement Trends
- 5.8 Supply-Demand Gap and Bottlenecks
- 5.9 Import Dependence and Sourcing Structure
- 5.10 Contract Manufacturing and Outsourcing
- 5.11 Regional Supply and Demand Concentration
Chapter 6 Global Emotion Detection and Recognition Market Pricing Analysis
- 6.1 Pricing Structure and Measurement
- 6.2 Historical Pricing Trends, 2018-2025
- 6.3 Pricing Outlook, 2025-2035
- 6.4 Average Selling Price and Unit Economics
- 6.5 Pricing by Product and Market Segment
- 6.6 Geographic Pricing Differences
- 6.7 Key Input, Energy, Labor and Logistics Costs
- 6.8 Contract Pricing and Purchasing Models
- 6.9 Pricing Sensitivity and Competitive Positioning
- 6.10 Price, Margin and Profitability Implications
Chapter 7 Global Emotion Detection and Recognition Market Dynamics
- 7.1 Market Growth Drivers
- 7.1.1 Demand-Side Drivers
- 7.1.2 Technology and Innovation Drivers
- 7.1.3 Infrastructure and Investment Drivers
- 7.1.4 Regulatory and Policy Drivers
- 7.2 Market Restraints
- 7.2.1 Cost and Affordability Constraints
- 7.2.2 Technology and Adoption Barriers
- 7.2.3 Supply Chain and Operational Constraints
- 7.3 Market Challenges
- 7.3.1 Competitive Pressure and Margin Erosion
- 7.3.2 Skills, Infrastructure and Implementation Gaps
- 7.4 Emerging Market Opportunities
- 7.5 Market Dynamics Impact and Time-Horizon Assessment
Chapter 8 Global Emotion Detection and Recognition Value Chain Analysis
- 8.1 Industry Value Chain Overview
- 8.2 Upstream Suppliers and Critical Inputs
- 8.3 Technology and Component Providers
- 8.4 Manufacturing or Service Delivery
- 8.5 Distribution, Channel Partners and Integrators
- 8.6 Downstream Applications and End Users
- 8.7 Value Addition and Profit Pools
- 8.8 Vertical Integration and Outsourcing
- 8.9 Supplier Concentration and Risk
- 8.10 Supply Chain Localization and Resilience
Chapter 9 Global Emotion Detection and Recognition Market Regulations and Policies
- 9.1 Relevant Laws, Standards and Compliance Frameworks
- 9.2 Product, Service, Safety and Quality Requirements
- 9.3 Government Policies, Incentives and Subsidies
- 9.4 Imports, Exports and Trade Barriers
- 9.5 Public Procurement and Local Content Requirements
- 9.6 Environmental and Sustainability Compliance
- 9.7 Upcoming Policy Changes and Market Implications
Chapter 10 Global Emotion Detection and Recognition Market Hotspots and Opportunities
- 10.1 Market Opportunity Mapping and Growth Hotspots
- 10.2 High-Growth Applications and Customer Groups
- 10.3 Underserved Markets and White-Space Opportunities
- 10.4 Emerging Technology and Product Opportunities
- 10.5 New Capacity and Investment Hotspots
- 10.6 Market Entry and Expansion Opportunities
- 10.7 Distribution and Partnership Opportunities
- 10.8 Near-Term and Long-Term Commercial Potential
- 10.9 Opportunity Attractiveness and Execution Risks
Chapter 11 Global Emotion Detection and Recognition Market Outlook, 2025-2035
- 11.1 Market Size and Analysis
- 11.1.1 Revenue (Market Measurement: 2025: USD 39.72 billion → 2035: USD 110.74 billion)
- 11.1.2 Market Volume and Quantity Sold
- 11.1.3 Historical Market Size, 2018-2025
- 11.1.4 Base-Year Market Size, 2025
- 11.2 Market Forecast, 2025-2035
- 11.2.1 Revenue Forecast to 2035
- 11.2.2 Volume Forecast to 2035
- 11.2.3 CAGR and Year-on-Year Growth
- 11.2.4 Incremental Revenue Opportunity
- 11.3 Forecast Assumptions and Scenario Analysis
- 11.3.1 Base-Case Forecast
- 11.3.2 Optimistic and Conservative Scenarios
- 11.3.3 Technology, Pricing and Policy Sensitivities
- 11.4 Market Attractiveness and Growth Outlook
Chapter 12 Global Emotion Detection and Recognition Market Segmentation and Outlook
- 12.1 Segmentation Summary and Market Shares, 2025
- 12.2 Largest and Fastest-Growing Segments
- 12.3 By Component - Market Size and Forecast, 2025-2035
- 12.3.1 Segment Definition and Scope
- 12.3.2 Historical Market Size, 2018-2025
- 12.3.3 Revenue Forecast, 2025-2035
- 12.3.4 Volume Forecast, 2025-2035
- 12.3.5 Base-Year Market Share, 2025
- 12.3.6 Segment CAGR and Growth Drivers
- 12.3.7 Subsegment Market Size and Forecast
- 12.3.7.1 Software
- 12.3.7.2 Hardware
- 12.3.7.3 Services
- 12.3.8 Subsegment Pricing and Adoption Trends
- 12.3.9 Leading Suppliers and Competition
- 12.3.10 Regional Demand and Opportunities
- 12.4 By Technology - Market Size and Forecast, 2025-2035
- 12.4.1 Segment Definition and Scope
- 12.4.2 Historical Market Size, 2018-2025
- 12.4.3 Revenue Forecast, 2025-2035
- 12.4.4 Volume Forecast, 2025-2035
- 12.4.5 Base-Year Market Share, 2025
- 12.4.6 Segment CAGR and Growth Drivers
- 12.4.7 Subsegment Market Size and Forecast
- 12.4.7.1 Facial Recognition
- 12.4.7.2 Voice Recognition
- 12.4.7.3 Text Analysis
- 12.4.7.4 Neurological Measurement
- 12.4.8 Subsegment Pricing and Adoption Trends
- 12.4.9 Leading Suppliers and Competition
- 12.4.10 Regional Demand and Opportunities
- 12.5 By End User - Market Size and Forecast, 2025-2035
- 12.5.1 Segment Definition and Scope
- 12.5.2 Historical Market Size, 2018-2025
- 12.5.3 Revenue Forecast, 2025-2035
- 12.5.4 Volume Forecast, 2025-2035
- 12.5.5 Base-Year Market Share, 2025
- 12.5.6 Segment CAGR and Growth Drivers
- 12.5.7 Subsegment Market Size and Forecast
- 12.5.7.1 Enterprises
- 12.5.7.2 Government & Defense
- 12.5.7.3 Automotive Companies
- 12.5.7.4 Healthcare Providers
- 12.5.7.5 Media & Entertainment Companies
- 12.5.7.6 Others
- 12.5.8 Subsegment Pricing and Adoption Trends
- 12.5.9 Leading Suppliers and Competition
- 12.5.10 Regional Demand and Opportunities
- 12.6 By Application - Market Size and Forecast, 2025-2035
- 12.6.1 Segment Definition and Scope
- 12.6.2 Historical Market Size, 2018-2025
- 12.6.3 Revenue Forecast, 2025-2035
- 12.6.4 Volume Forecast, 2025-2035
- 12.6.5 Base-Year Market Share, 2025
- 12.6.6 Segment CAGR and Growth Drivers
- 12.6.7 Subsegment Market Size and Forecast
- 12.6.7.1 Customer Experience & Feedback Analysis
- 12.6.7.2 Security & Surveillance
- 12.6.7.3 Healthcare & Mental Health Monitoring
- 12.6.7.4 Others
- 12.6.8 Subsegment Pricing and Adoption Trends
- 12.6.9 Leading Suppliers and Competition
- 12.6.10 Regional Demand and Opportunities
- 12.7 Segment Growth Comparison
- 12.8 Segment Attractiveness and Priority Matrix
Chapter 13 Global Emotion Detection and Recognition End-Use and Application Market Outlook
- 13.1 End-Use Industry and Customer Demand Structure
- 13.2 Leading Applications and Customer Groups
- 13.3 End-Use Market Size, Share and Forecast
- 13.4 Major End-Use Industry Deep Dives
- 13.4.1 Customer Requirements and Use Cases
- 13.4.2 Demand and Replacement Cycles
- 13.4.3 Technical and Regulatory Considerations
- 13.4.4 Purchasing and Procurement Models
- 13.4.5 Leading Vendors and Distribution Channels
- 13.4.6 Forecast and Commercial Opportunities
- 13.5 Emerging Applications and Cross-Segment Demand
- 13.6 End-Use Industry Investment Priorities
Chapter 14 Global Emotion Detection and Recognition Geographic Market Outlook, 2025-2035
- 14.1 Regional Market Size and Share, 2025
- 14.2 Regional Market Forecast, 2025-2035
- 14.3 Regional Pricing, Production and Demand Differences
- 14.4 North America
- 14.4.1 United States
- 14.4.2 Canada
- 14.4.3 Mexico
- 14.5 Europe
- 14.5.1 Germany
- 14.5.2 France
- 14.5.3 Italy
- 14.5.4 United Kingdom
- 14.5.5 Spain
- 14.5.6 Poland
- 14.5.7 Russia
- 14.5.8 Netherlands
- 14.5.9 Belgium
- 14.5.10 Sweden
- 14.5.11 Denmark
- 14.5.12 Norway
- 14.5.13 Rest of Europe
- 14.6 Asia Pacific
- 14.6.1 China
- 14.6.2 India
- 14.6.3 Japan
- 14.6.4 South Korea
- 14.6.5 Thailand
- 14.6.6 Indonesia
- 14.6.7 Vietnam
- 14.6.8 Malaysia
- 14.6.9 Australia
- 14.6.10 Rest of Asia Pacific
- 14.7 Latin America
- 14.7.1 Brazil
- 14.7.2 Argentina
- 14.7.3 Colombia
- 14.7.4 Chile
- 14.7.5 Rest of Latin America
- 14.8 Middle East
- 14.8.1 Saudi Arabia
- 14.8.2 United Arab Emirates
- 14.8.3 Turkey
- 14.8.4 Israel
- 14.8.5 Iran
- 14.8.6 Rest of the Middle East
- 14.9 Africa
- 14.9.1 South Africa
- 14.9.2 Egypt
- 14.9.3 Nigeria
- 14.9.4 Morocco
- 14.9.5 Rest of Africa
- 14.10 Regional Investment, Policy and Supply Chain Differences
- 14.11 Regional Competitive Landscape
- 14.12 Geographic Growth Hotspots
Chapter 15 Global Emotion Detection and Recognition Technology, Innovation and Sustainability Outlook
- 15.1 Technology Landscape and Maturity
- 15.2 Product, Process and Service Innovation
- 15.3 AI, Automation and Digital Tools in the Industry
- 15.4 Technology Adoption and Performance Benchmarking
- 15.5 Innovation Pipeline and R&D Investment
- 15.6 Patent and Intellectual Property Trends
- 15.7 Energy Efficiency and Resource Management
- 15.8 Sustainability, Recycling and Circularity
- 15.9 Technology Roadmap, 2025-2035
- 15.10 Risks of Obsolescence and Technology Substitution
Chapter 16 Global Emotion Detection and Recognition Market Key Strategic Imperatives
- 16.1 Growth and Market Entry Priorities
- 16.2 High-Return Products and Segments
- 16.3 Pricing, Profitability and Cost Optimization
- 16.4 Technology Investment and Product Differentiation
- 16.5 Supply Chain Localization and Resilience
- 16.6 Distribution and Customer Acquisition
- 16.7 Partnership, Acquisition and Capacity Strategy
- 16.8 Regional Expansion Priorities
- 16.9 Short-, Medium- and Long-Term Actions
Chapter 17 Competition Outlook
- 17.1 Industry Competition Characteristics
- 17.2 Market Structure and Concentration
- 17.3 Market Share and Competitive Positioning, 2025
- 17.4 Company-Wise Revenue and Product Benchmarking
- 17.5 Production and Service Capacity Benchmarking
- 17.6 Technology, Pricing and Differentiation
- 17.7 Regional Footprint and Distribution Strength
- 17.8 Mergers, Acquisitions and Strategic Alliances
- 17.9 New Entrants and Competitive Threats
- 17.10 Porter's Five Forces and Industry Attractiveness
- 17.11 Competitive Outlook, 2025-2035
Chapter 18 Company Profiles
- 18.1 Company Coverage and Selection Criteria
- 18.2 NEC
- 18.2.1 Business Description
- 18.2.2 Company Ownership and Geographic Presence
- 18.2.3 Product and Service Portfolio
- 18.2.4 Manufacturing and Operating Footprint
- 18.2.5 Production Capacity and Expansion Plans
- 18.2.6 Financial Performance and Investment
- 18.2.7 Market Share and Competitive Position
- 18.2.8 Technology and Innovation Capabilities
- 18.2.9 Strategic Alliances or Partnerships
- 18.2.10 Recent Developments
- 18.2.11 Growth Strategy and Outlook
- 18.3 IBM
- 18.4 Microsoft
- 18.5 Tobii
- 18.6 Elliptic Labs
- 18.7 Cognitec
- 18.8 iMotions
- 18.9 Beyond Verbal
- 18.10 Ayonix
- 18.11 Kairos
- 18.12 Other Relevant Market Participants
Note: Every listed company is profiled on the structure shown under the first company. The company list is preliminary and may change based on research findings, market developments, data availability and client requirements.
Chapter 19 Disclaimer
- 19.1 Research and Forecast Disclaimer
- 19.2 Data Source and Estimation Limitations
Note: The depth of individual sections depends on data availability for this market. Volume, capacity, trade and other unit-based metrics are included where applicable.

