Home » Automation & Process Control » Switchgears Market

Switchgears Market By Voltage (Low, Medium and High Voltage), By End Use (Transmission & Distribution Utilities, Manufacturing & Process Industries, Commercial & Residential Infrastructure) – Growth, Future Prospects And Competitive Analysis, 2017 – 2025

Price: $3699

Published: | Report ID: 10595 | Report Format : PDF

Market Insights

In the field of electrical engineering, electric switchgear is defined as a combination of devices that include switches, fuses, isolators, circuit breakers, relays, control panels, lightning arrestors, current transformers, and potential transformers, among others. The switchgear is typically used to detect faults and disconnect the corrupted section from the circuit to prevent any possible damage to the system. The switchgear equipment is essentially concerned with switching and interrupting currents either under normal or abnormal operating conditions. The use of switchgear instead of fuses offers superior benefits such as reliability, certain detection of faulty circuits, quick operation, and provision for manual control. Due to the aforementioned merits, switchgear has been extensively used to protect electrical equipment for a variety of electrical end-users.

Switchgear protection plays a vital role in every step of a modern-day electrical system, such as generation, transmission, and distribution. It prevents the loss of expensive electrical equipment from a variety of electrical abnormalities, including overcurrent, short circuits, and any other faults in the system. Depending on the application, switchgear is available in a wide range of ratings and varieties. Apart from power system networks, switchgear is also extensively used for industrial works, industrial projects, domestic and commercial buildings, marine applications, and mining, among others. With the growing trend of electrical network upgrades, the growing infrastructure for non-conventional energy systems, and the establishment of smart electric grids, switchgear provide a crucial aid in the field of electrical system automation. As a result, demand for switchgear is expected to rise in tandem with the global adoption of smart grid applications.

The report titled “Switchgear Market: Growth, Future Prospects, and Competitive Landscape, 2017–2025” offers strategic insights into the global switchgear market with a focus on the market’s size and estimates for the duration of 2015–2025. The said research study covers an in-depth analysis of market segments based on Voltage, end-use industry, and a cross-sectional study across different geographies. The study covers the comparative analysis of each sub-segment for the years 2016–2025. The report also provides a prolific view of market dynamics, such as market drivers, restraints, and opportunities.

In order to help strategic decision-makers, the report also includes competitive profiling of the leading switchgear manufacturers, their strategies, market positioning, and key developments. Some of the major players profiled in the report include ABB Ltd., Eaton Corporation PLC, General Electric Company, Mitsubishi Electric Corporation, TE Connectivity Ltd., Toshiba Corporation, Schneider Electric SA, Siemens AG, Hitachi Ltd., Crompton Greaves Ltd., Alstom SA, and Hyundai Heavy Industries Co. Ltd.

Other in-depth analysis provided in the report includes:

  • Current and future market trends to justify the forthcoming attractive markets within the switchgear industry
  • Market fuelers, market impediments, and their impact on market growth
  • Market inclination insights and key trend analysis for the switchgear market
  • in-depth competitive environment analysis
  • Trailing 2-year market size data (2015–2016)

Overall, the research study provides a holistic view of the global switchgear market, offering market size and estimates for the period from 2017 to 2025, keeping in mind the above-mentioned factors.

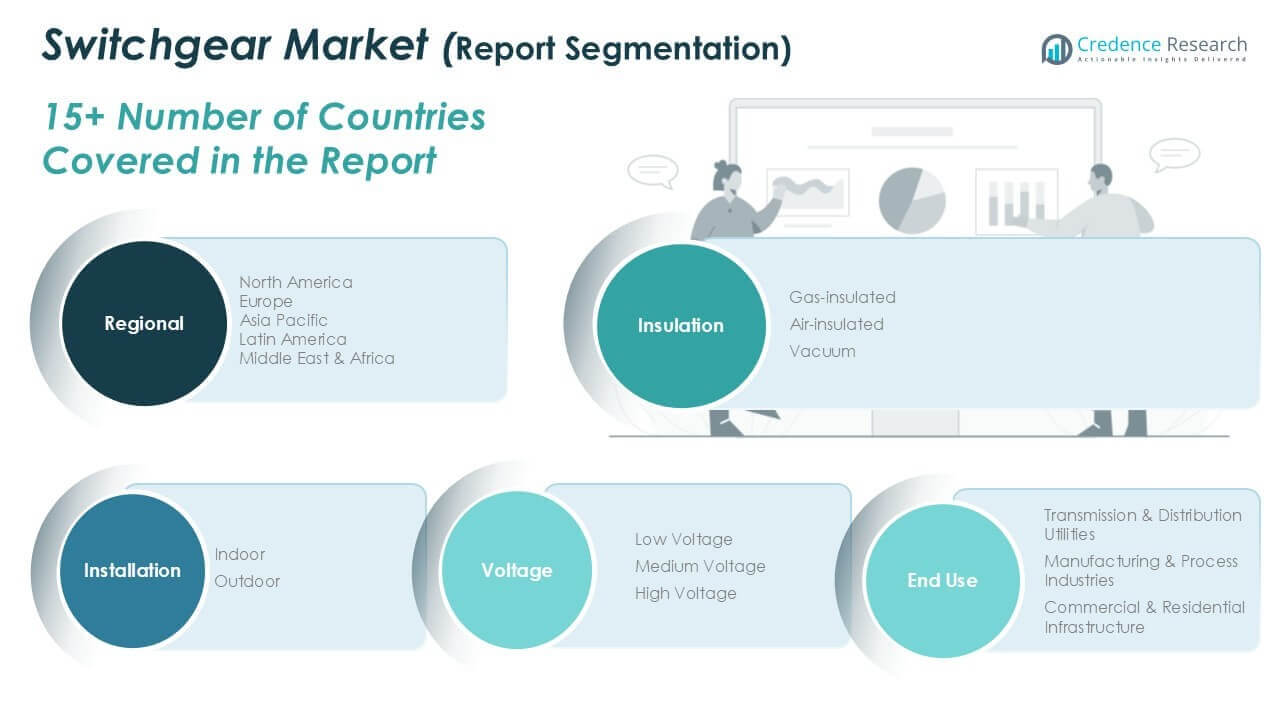
The global switchgear market is segmented, based on Voltage, into the following categories:

  • Low Voltage (less than 1000 volts)
  • 1KV to 75KV medium voltage
  • High Voltage (greater than 75 kV)

As of 2016, the low-voltage switchgear (less than 1KV) segment dominated the overall switchgear market worldwide. Low-voltage switchgear is used in a wide array of end-use applications, such as commercial, residential, and industrial ones. With consistently growing industrial, commercial, and residential infrastructures, the demand for switchgear is also growing in order to protect electric equipment from abnormalities in the electric supply.

In terms of revenue, the high-voltage switchgear (above 75KV) segment trailed the low-voltage segment in 2016. High-voltage switchgear is typically used in heavy applications such as power generation units and transmission and distribution utilities. With the growing demand for power, the demand for the aforementioned infrastructure is also growing persistently. Therefore, the demand for high-voltage switchgear for electricity generation and distribution is also expected to grow consistently throughout the forecast period from 2017 to 2025.

The global switchgear market is segmented, based on the end-use industry, into the following categories:

  • Transmission and Distribution Utilities
  • Manufacturing and Process Industries
  • Commercial and Residential Infrastructure

As of 2016, the transmission and distribution utility segment dominated the overall switchgear market worldwide. Consistently rising demand for power has encouraged the setup of new power plants and transmission and distribution utilities. Switchgears are extensively used to safeguard equipment and control systems from abnormalities in the electricity systems in power plants, transmission utilities, and distribution utilities. Furthermore, the switchgear market is expected to grow in proportion to the growing trend of up-gradation and renovation of power transmission and distribution utilities and the introduction of smart grids.

In terms of revenue in the overall switchgear market, the manufacturing and process industries end-use segment trailed the transmission and distribution utility segment in 2016. After the past economic depression, manufacturing and process industries have shown significant growth in recent years. Switchgears are widely used in the manufacturing and processing industries in order to protect electrical devices and circuits from overload, short-circuit, and voltage fluctuations, among others. With consistent growth in the manufacturing and processing industries, the switchgear market is expected to witness positive growth in this segment.

The global switchgear market has been segmented on the basis of geographical regions, as per the following regions and countries:

  • North America
    • The U.S.
    • Canada
  • Europe
    • Germany
    • France
    • The U.K.
    • Italy
    • Spain
    • Rest of Europe
  • Asia Pacific
    • China
    • Japan
    • India
    • South Korea
    • South-east Asia
    • Rest of Asia Pacific
  • Latin America
    • Brazil
    • Mexico
    • Rest of Latin America
  • Middle East & Africa
    • GCC Countries
    • South Africa
    • Rest of the Middle East and Africa

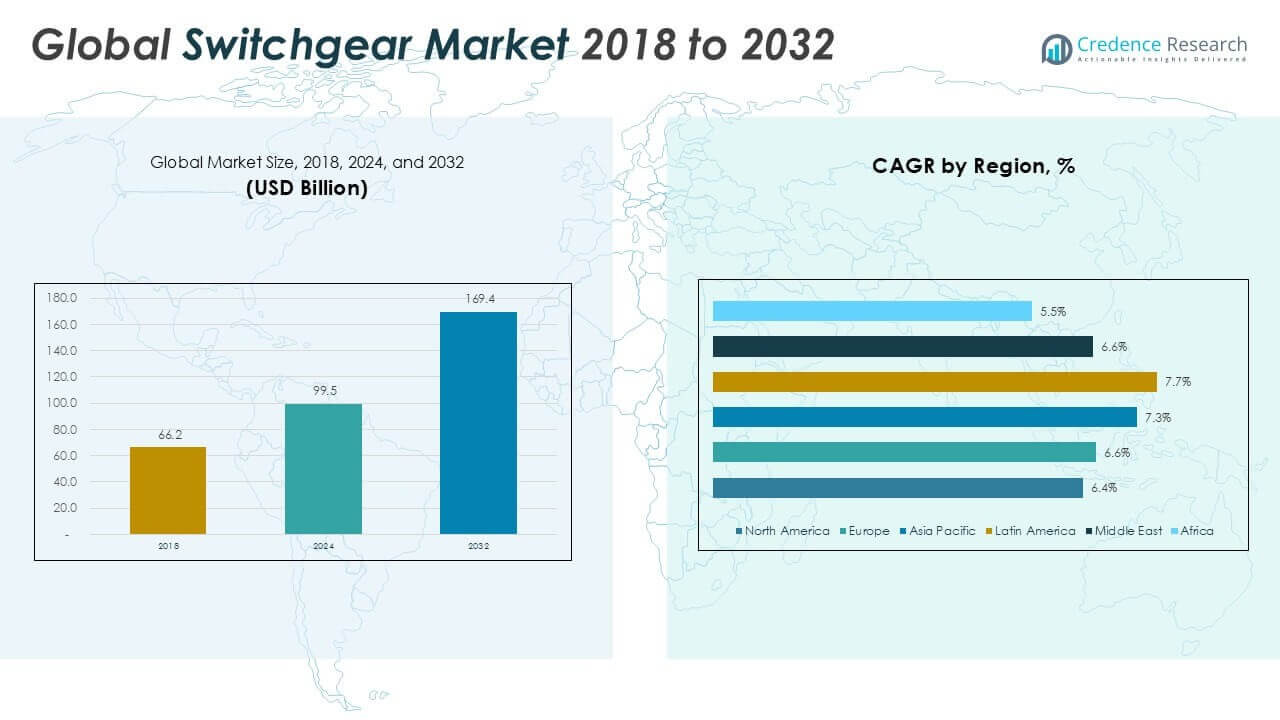
As of 2016, Asia Pacific dominated the overall switchgear market in terms of revenue as well as volume. Since a few years, Asia Pacific has seen significant improvements in electrical infrastructure and networking. With the growing demand for electrical energy, new power plants, transmission lines, and distribution units are being set up at a brisk pace. In order to protect the expensive equipment in the aforementioned utilities, the demand for switchgear has increased significantly in the region. Furthermore, flourishing manufacturing and processing industries have also uplifted the demand for switchgear in this region. Due to the aforementioned reasons, Asia Pacific is expected to dominate the overall switchgear market throughout the forecast period from 2017 to 2025.

North America trailed Asia Pacific in the overall switchgear market in terms of revenue and volume. The consistent development of smart grid infrastructures has escalated the demand for switchgear in North America. Switchgears play a vital role in the development of non-conventional energy generation systems by ensuring the safety of other equipment from overloads and voltage fluctuations. Furthermore, the widespread use of switchgear in industrial manufacturing and processing units, as well as commercial and residential infrastructures, has fueled the growth of the switchgear market.

1. Preface
1.1. Report Scope and Description
1.2. Research Methodology
1.2.1. Phase I-Secondary Research
1.2.2. Phase II-Primary Research
1.2.3. Phase II-Expert Panel Review
1.2.4. Assumptions
1.2.5. Approach Adopted

2. Executive Summary
2.1. Global Switchgears Market Snapshot
2.2. Global Switchgears Market, By Voltage
2.3. Global Switchgears Market, By End-use Industry

3. Global Switchgears Market Analysis
3.1. Global Switchgears Market Overview
3.2. Market Inclination Insights
3.2.1. Recent Trends
3.2.2. Future Outlook
3.3. Market Dynamics
3.3.1. Market Drivers
3.3.2. Market Challenges
3.4. See-Saw Analysis
3.5. Attractive Investment Proposition
3.6. Market Positioning of Key Industry Participants
3.6.1. Major Strategies Adopted
3.6.2. Analyst Recommendations

4. Global Switchgears Market Revenue, By Voltage, 2015 – 2025 (US$ Mn)
4.1. Market Analysis
4.2. Low Voltage (Less than 1KV)
4.3. Medium Voltage (From 1KV to 75KV)
4.4. High Voltage (More than 75KV)

5. Global Switchgears Market Revenue, By End-use Industry, 2015 – 2025 (US$ Mn)
5.1. Market Analysis
5.2. Transmission and Distribution Utilities
5.3. Manufacturing and Processing Industries
5.4. Commercial and Residential Infrastructures

6. North America Switchgears Market Analysis, 2015 – 2025 (US$ Mn)
6.1. North America Switchgears Market Revenue, By Voltage, 2015 – 2025 (US$ Mn)
6.1.1. Low Voltage (Less than 1KV)
6.1.2. Medium Voltage (From 1KV to 75KV)
6.1.3. High Voltage (More than 75KV)
6.2. North America Switchgears Market Revenue, By End-use Industry, 2015 – 2025 (US$ Mn)
6.2.1. Transmission and Distribution Utilities
6.2.2. Manufacturing and Processing Industries
6.2.3. Commercial and Residential Infrastructures
6.3. North America Switchgears Market Revenue, By Country, 2015 – 2025 (US$ Mn)
6.3.1. U.S.
6.3.2. Rest of North America

7. Europe Switchgears Market Analysis, 2015 – 2025 (US$ Mn)
7.1. Europe Switchgears Market Revenue, By Voltage, 2015 – 2025 (US$ Mn)
7.1.1. Low Voltage (Less than 1KV)
7.1.2. Medium Voltage (From 1KV to 75KV)
7.1.3. High Voltage (More than 75KV)
7.2. Europe Switchgears Market Revenue, By End-use Industry, 2015 – 2025 (US$ Mn)
7.2.1. Transmission and Distribution Utilities
7.2.2. Manufacturing and Processing Industries
7.2.3. Commercial and Residential Infrastructures
7.3. Europe Switchgears Market Revenue, By Region, 2015 – 2025 (US$ Mn)
7.3.1. U.K.
7.3.2. Germany
7.3.3. France
7.3.4. Rest of Europe

8. Asia Pacific Switchgears Market Analysis, 2015 – 2025 (US$ Mn)
8.1. Asia Pacific Switchgears Market Revenue, By Voltage, 2015 – 2025 (US$ Mn)
8.1.1. Low Voltage (Less than 1KV)
8.1.2. Medium Voltage (From 1KV to 75KV)
8.1.3. High Voltage (More than 75KV)
8.2. Asia Pacific Switchgears Market Revenue, By End-use Industry, 2015 – 2025 (US$ Mn)
8.2.1. Transmission and Distribution Utilities
8.2.2. Manufacturing and Processing Industries
8.2.3. Commercial and Residential Infrastructures
8.3. Asia Pacific Switchgears Market Revenue, By Country, 2015 – 2025 (US$ Mn)
8.3.1. Japan
8.3.2. China
8.3.3. India
8.3.4. Rest of Asia Pacific

9. Rest of World (RoW) Switchgears Market Analysis, 2015 – 2025 (US$ Mn)
9.1. RoW Switchgears Market Revenue, By Voltage, 2015 – 2025 (US$ Mn)
9.1.1. Low Voltage (Less than 1KV)
9.1.2. Medium Voltage (From 1KV to 75KV)
9.1.3. High Voltage (More than 75KV)
9.2. RoW Switchgears Market Revenue, By End-use Industry, 2015 – 2025 (US$ Mn)
9.2.1. Transmission and Distribution Utilities
9.2.2. Manufacturing and Processing Industries
9.2.3. Commercial and Residential Infrastructures
9.3. Rest of World Switchgears Market Revenue, By Region, 2015 – 2025 (US$ Mn)
9.3.1. Latin America
9.3.2. Middle-East and Africa

10. Company Profiles
10.1. ABB Ltd
10.2. Eaton Corporation PLC
10.3. General Electric
10.4. Mitsubishi Electric Corporation
10.5. TE Connectivity Ltd
10.6. Toshiba Corporation
10.7. Schneider Electric SA
10.8. Siemens AG
10.9. Hitachi Ltd
10.10. Crompton Greaves Ltd
10.11. Alstom
10.12. Hyundai Heavy Industries Co. Ltd

List of Figures

FIG. 1 Global Switchgears: Market Segmentation
FIG. 2 Global Switchgears Market: Research Methodology
FIG. 3 Top-Down and Bottom Up Approach
FIG. 4 Global Switchgears Market, By Voltage, 2015 (US$ Mn)
FIG. 5 Global Switchgears Market, By End-use Industry, 2015 (US$ Mn)
FIG. 6 Global Switchgears Market, By Geography, 2015 (US$ Mn)
FIG. 7 Global Switchgears Market Revenue and Growth, 2015 – 2025, (US$ Mn and % Y-o-Y)
FIG. 8 See-Saw Analysis : Global Switchgears Market
FIG. 9 Market Positioning of Key Industry Participants, 2015
FIG. 10 Global Switchgears Market Revenue Contribution, By Voltage, 2016 & 2025 (Value %)
FIG. 11 Global Low Voltage Switchgears Market Revenue and Growth, 2015 – 2025, (US$ Mn)
FIG. 12 Global Medium Voltage Switchgears Market Revenue and Growth, 2015 – 2025, (US$ Mn)
FIG. 13 Global High Voltage Switchgears Market Revenue and Growth, 2015 – 2025, (US$ Mn)
FIG. 14 Global Switchgears Market Revenue Contribution, By End-use Industry, 2016 & 2025 (Value %)
FIG. 15 Global Switchgears Market for Transmission & Distribution Utilities Revenue and Growth, 2015 – 2025, (US$ Mn)
FIG. 16 Global Switchgears Market for Manufacturing & Process Industries Revenue and Growth, 2015 – 2025, (US$ Mn)
FIG. 17 Global Switchgears Market for Commercial & Residential Infrastructure Revenue and Growth, 2015 – 2025, (US$ Mn)
FIG. 18 North America Switchgears Market Revenue and Growth, 2015 – 2025, (US$ Mn) (Y-o-Y %)
FIG. 19 Europe Switchgears Market Revenue and Growth, 2015 – 2025, (US$ Mn) (Y-o-Y %)
FIG. 20 Asia Pacific Switchgears Market Revenue and Growth, 2015 – 2025, (US$ Mn) (Y-o-Y %)
FIG. 21 RoW Switchgears Market Revenue and Growth, 2015– 2025, (US$ Mn) (Y-o-Y %)

List of Tables

TABLE 1 Market Snapshot: Global Switchgears Market
TABLE 2 Impact Indicators
TABLE 3 Impact Analysis of Drivers and Restraints
TABLE 4 North America Switchgears Market Revenue, By Voltage, 2015 – 2025 (US$ Mn)
TABLE 5 North America Switchgears Market Revenue, By End-use Industry, 2015 – 2025 (US$ Mn)
TABLE 6 North America Switchgears Market Revenue, By Country, 2015 – 2025 (US$ Mn)
TABLE 7 U.S. Switchgears Market Revenue, By Voltage, 2015 – 2025 (US$ Mn)
TABLE 8 U.S. Switchgears Market Revenue, By End-use Industry, 2015 – 2025 (US$ Mn)
TABLE 9 Rest of North America Switchgears Market Revenue, By Voltage, 2015 – 2025 (US$ Mn)
TABLE 10 Rest of North America Switchgears Market Revenue, By End-use Industry, 2015 – 2025 (US$ Mn)
TABLE 11 Europe Switchgears Market Revenue, By Voltage, 2015 – 2025 (US$ Mn)
TABLE 12 Europe Switchgears Market Revenue, By End-use Industry, 2015 – 2025 (US$ Mn)
TABLE 13 Europe Switchgears Market Revenue, By Country, 2015 – 2025 (US$ Mn)
TABLE 14 U.K. Switchgears Market Revenue, By Voltage, 2015 – 2025 (US$ Mn)
TABLE 15 U.K. Switchgears Market Revenue, By End-use Industry, 2015 – 2025 (US$ Mn)
TABLE 16 France Switchgears Market Revenue, By Voltage, 2015 – 2025 (US$ Mn)
TABLE 17 France Switchgears Market Revenue, By End-use Industry, 2015 – 2025 (US$ Mn)
TABLE 18 Germany Switchgears Market Revenue, By Voltage, 2015 – 2025 (US$ Mn)
TABLE 19 Germany Switchgears Market Revenue, By End-use Industry, 2015 – 2025 (US$ Mn)
TABLE 20 Rest of Europe Switchgears Market Revenue, By Voltage, 2015 – 2025 (US$ Mn)
TABLE 21 Rest of Europe Switchgears Market Revenue, By End-use Industry, 2015 – 2025 (US$ Mn)
TABLE 22 Asia Pacific Switchgears Market Revenue, By Voltage, 2015 – 2025 (US$ Mn)
TABLE 23 Asia Pacific Switchgears Market Revenue, By End-use Industry, 2015 – 2025 (US$ Mn)
TABLE 24 Asia Pacific Switchgears Market Revenue, By Country, 2015 – 2025 (US$ Mn)
TABLE 25 China Switchgears Market Revenue, By Voltage, 2015- 2025 (US$ Mn)
TABLE 26 China Switchgears Market Revenue, By End-use Industry, 2015- 2025 (US$ Mn)
TABLE 27 Japan Switchgears Market Revenue, By Voltage, 2015 – 2025 (US$ Mn)
TABLE 28 Japan Switchgears Market Revenue, By End-use Industry, 2015 – 2025 (US$ Mn)
TABLE 29 India Switchgears Market Revenue, By Voltage, 2015 – 2025 (US$ Mn)
TABLE 30 India Switchgears Market Revenue, By End-use Industry, 2015 – 2025 (US$ Mn)
TABLE 31 Rest of Asia Pacific Switchgears Market Revenue, By Voltage, 2015 – 2025 (US$ Mn)
TABLE 32 Rest of Asia Pacific Switchgears Market Revenue, By End-use Industry, 2015 – 2025 (US$ Mn)
TABLE 33 Rest of World Switchgears Market Revenue, By Voltage, 2015 – 2025 (US$ Mn)
TABLE 34 Rest of World Switchgears Market Revenue, By End-use Industry, 2015 – 2025 (US$ Mn)
TABLE 35 Rest of World Switchgears Market Revenue, By Region, 2015 – 2025 (US$ Mn)
TABLE 36 Latin America Switchgears Market Revenue, By Voltage, 2015 – 2025 (US$ Mn)
TABLE 37 Latin America Switchgears Market Revenue, By End-use Industry, 2015 – 2025 (US$ Mn)
TABLE 38 Middle-East and Africa Switchgears Market Revenue, By Voltage, 2015 – 2025 (US$ Mn)
TABLE 39 Middle-East and Africa Switchgears Market Revenue, By End-use Industry, 2015 – 2025 (US$ Mn)
TABLE 40 ABB Ltd.: Company Snapshot (Company Details, Geographical Presence, Product Portfolio, Key Industries Served, Recent Developments)
TABLE 41 Eaton Corporation PLC: Company Snapshot (Company Details, Geographical Presence, Product Portfolio, Key Industries Served, Recent Developments)
TABLE 42 General Electric Company: Company Snapshot (Company Details, Geographical Presence, Product Portfolio, Key Industries Served, Recent Developments)
TABLE 43 Mitsubishi Electric Corporation: Company Snapshot (Company Details, Geographical Presence, Product Portfolio, Key Industries Served, Recent Developments)
TABLE 44 TE Connectivity Ltd.: Company Snapshot (Company Details, Geographical Presence, Product Portfolio, Key Industries Served, Recent Developments)
TABLE 45 Toshiba Corporation: Company Snapshot (Company Details, Geographical Presence, Product Portfolio, Key Industries Served, Recent Developments)
TABLE 46 Schneider Electric SA: Company Snapshot (Company Details, Geographical Presence, Product Portfolio, Key Industries Served, Recent Developments)
TABLE 47 Siemens AG: Company Snapshot (Company Details, Geographical Presence, Product Portfolio, Key Industries Served, Recent Developments)
TABLE 48 Hitachi Ltd: Company Snapshot (Company Details, Geographical Presence, Product Portfolio, Key Industries Served, Recent Developments)
TABLE 49 Crompton Greaves Ltd.t: Company Snapshot (Company Details, Geographical Presence, Product Portfolio, Key Industries Served, Recent Developments)
TABLE 50 Alstom SA: Company Snapshot (Company Details, Geographical Presence, Product Portfolio, Key Industries Served, Recent Developments)
TABLE 51 Hyundai Heavy Industries Co. Ltd.: Company Snapshot (Company Details, Geographical Presence, Product Portfolio, Key Industries Served, Recent Developments)

Frequently Asked Question:

What is the size of Switchgears Market?

The market for Switchgears Market is expected to reach USD$ 89.4 Bn in 2025.

What is the Switchgears Market CAGR?

The Switchgears Market is expected to see significant CAGR growth over the coming years, at 9.2 %.

What is the Forecast period considered for Switchgears Market?

The report is forecasted from 2017-2025.

What is the base year considered for Switchgears Market?

The base year of this report is 2016.

Who are the major players in this market?

ABB Ltd., Eaton Corporation PLC, General Electric Company, Mitsubishi Electric Corporation, TE Connectivity Ltd.are some of the major players in the global market.

Low Voltage AC Drives Market

Published:
Report ID: 50049

Europe Robotic Laser Cutting Market

Published:
Report ID: 49791

Europe Fabric Cutting Machines Market

Published:
Report ID: 44478

Mechanized Irrigation Systems Market

Published:
Report ID: 8736

Busway-Bus Duct Market

Published:
Report ID: 49297

India Gas Cutting Machine Market

Published:
Report ID: 48869

Gas Cutting Machine Market

Published:
Report ID: 48840

Fabric Cutting Machines Market

Published:
Report ID: 5980

Middle East and Africa Fabric Cutting Machines Market

Published:
Report ID: 48649

Middle East and Africa Gas Cutting Machine Market

Published:
Report ID: 48650

Car Seat and Accessories Market

Published:
Report ID: 48515

Control Room Solution Market

Published:
Report ID: 48518

Purchase Options

The report comes as a view-only PDF document, optimized for individual clients. This version is recommended for personal digital use and does not allow printing.
$3699

To meet the needs of modern corporate teams, our report comes in two formats: a printable PDF and a data-rich Excel sheet. This package is optimized for internal analysis and multi-location access, making it an excellent choice for organizations with distributed workforce.
$4699

The report will be delivered in printable PDF format along with the report’s data Excel sheet. This license offers 100 Free Analyst hours where the client can utilize Credence Research Inc.’s research team. It is highly recommended for organizations seeking to execute short, customized research projects related to the scope of the purchased report.
$6699

Smallform of Sample request

Have a question?

User Profile

Don’t settle for less – trust Mitul to help you find the best solution.

Report delivery within 24 to 48 hours

– Other Info –

What people say?-

User Review

I am very impressed with the information in this report. The author clearly did their research when they came up with this product and it has already given me a lot of ideas.

Jana Schmidt
CEDAR CX Technologies

– Connect with us –

Phone

+91 6232 49 3207


support

24/7 Research Support


sales@credenceresearch.com

– Research Methodology –

Going beyond the basics: advanced techniques in research methodology

– Trusted By –

Pepshi, LG, Nestle
Motorola, Honeywell, Johnson and johnson
LG Chem, SIEMENS, Pfizer
Unilever, Samsonite, QIAGEN