
New electrolysis plants lift green ammonia output value
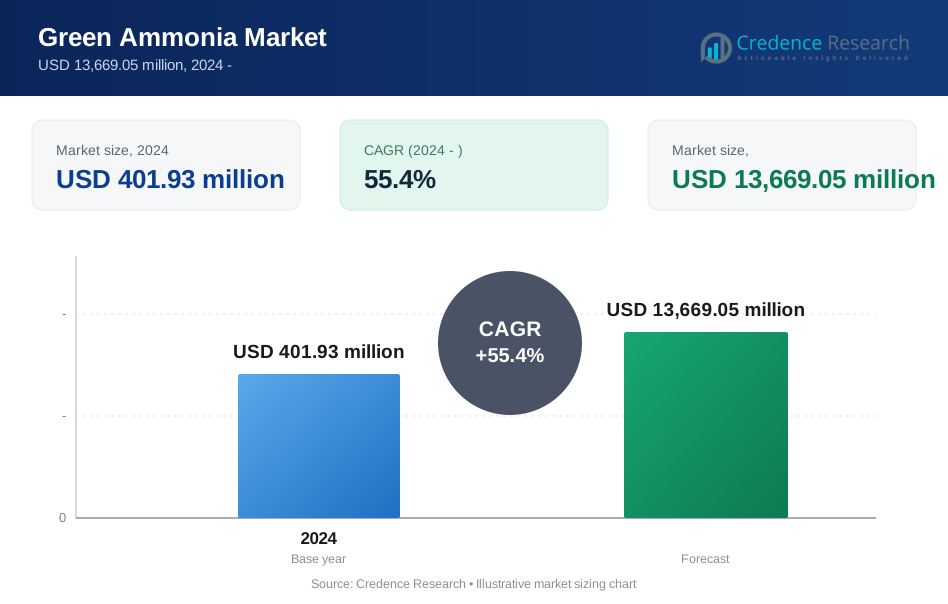
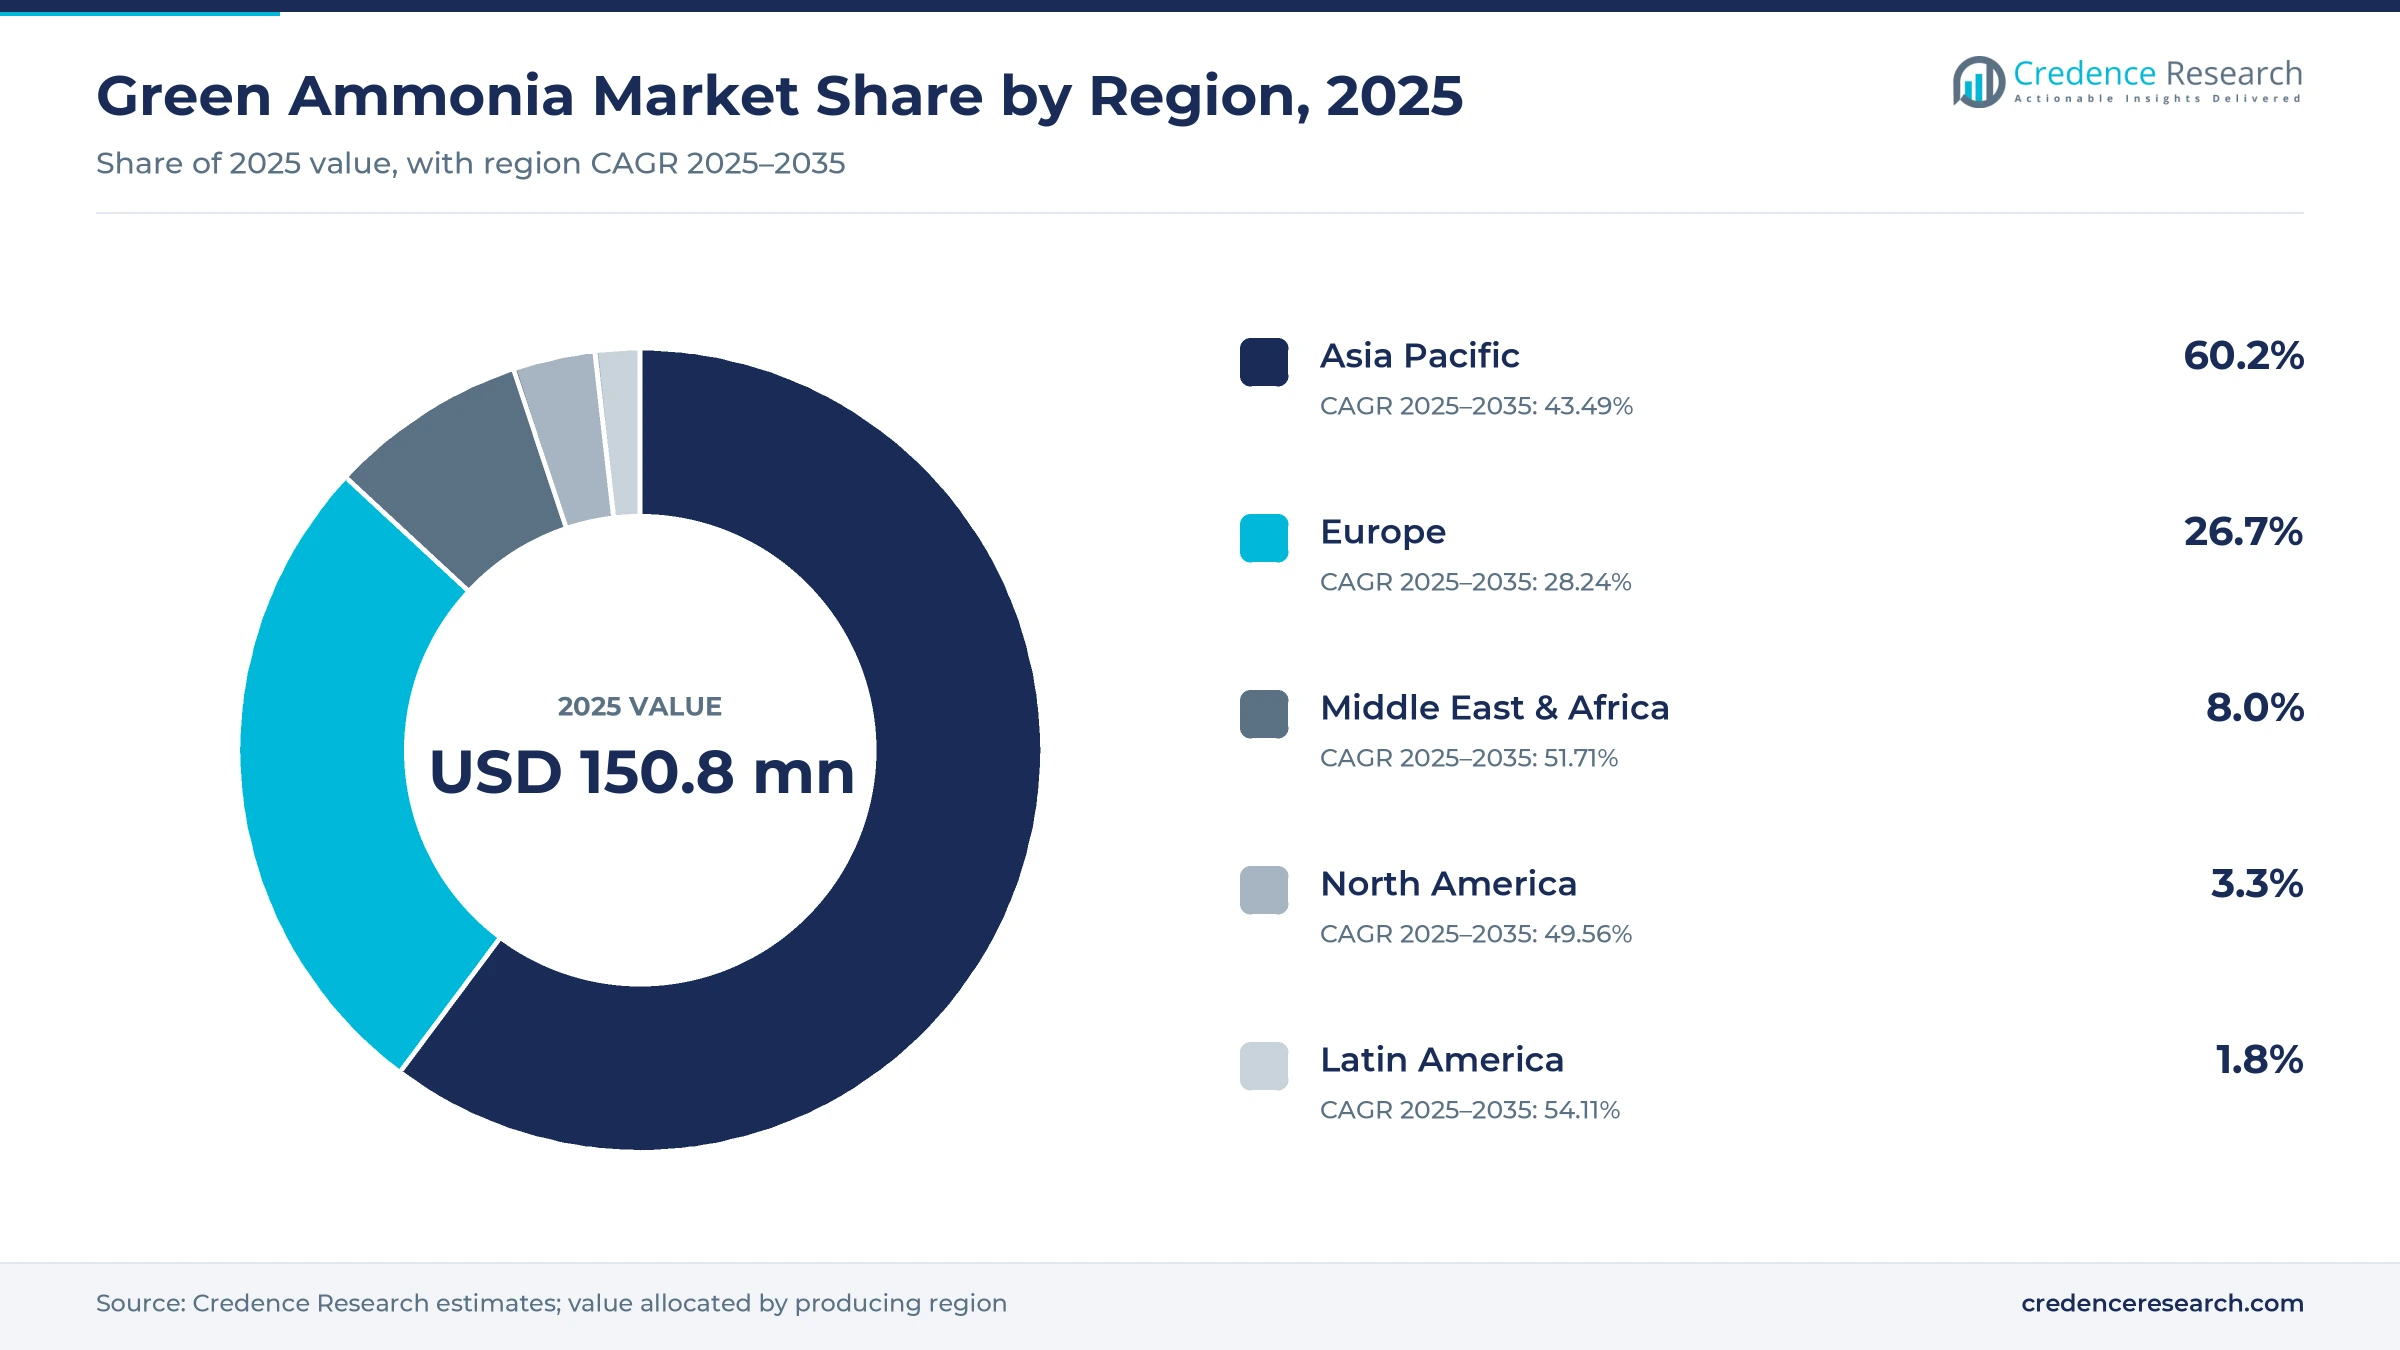
The green ammonia market was valued at USD 150.8 million in 2025 and is projected to increase from USD 415.2 million in 2026 to USD 5.10 billion by 2035, registering a CAGR of 42.22% during 2025–2035. Demand rests on Indian auctions that tie fertilizer plants to fixed-price supply, binding export contracts from European and Asian buyers, and low-cost wind, solar and electrolyzers in northern China. Asia Pacific held the largest regional share, 60.2% in 2025, because China hosts the three largest operating plants. Latin America is the fastest-growing region at 54.11% a year from a small base. The main commercial change is the arrival of binding offtake. In January 2026, Uniper signed a long-term contract with AM Green for certified ammonia from Kakinada, India, with first shipments as early as 2028.
Which ammonia counts as green, and who buys it?
Green ammonia uses the same synthesis loop, storage and shipping as conventional ammonia, but its hydrogen comes from water electrolysis powered by wind or solar electricity instead of natural gas or coal. The estimate includes dedicated wind and solar plants on or off the grid, including RFNBO-certified cargoes for Europe, Japan and Korea, and electrolyzers retrofitted into fertilizer complexes, counted for their renewable share only. Fertilizer makers, chemical producers, Asian utilities and, later, shipowners are the buyers.
The scope excludes low-carbon ammonia made from natural gas with carbon capture, and the electrolyzers, renewable power plants and terminals themselves. Urea, ammonium nitrate and other downstream products count only for the ammonia value they contain.
Green Ammonia Market Insights
- The green ammonia market is projected to expand from USD 415.2 million in 2026 to USD 5.10 billion by 2035, a 42.22% CAGR, as contracted export plants in India and the Gulf start up.
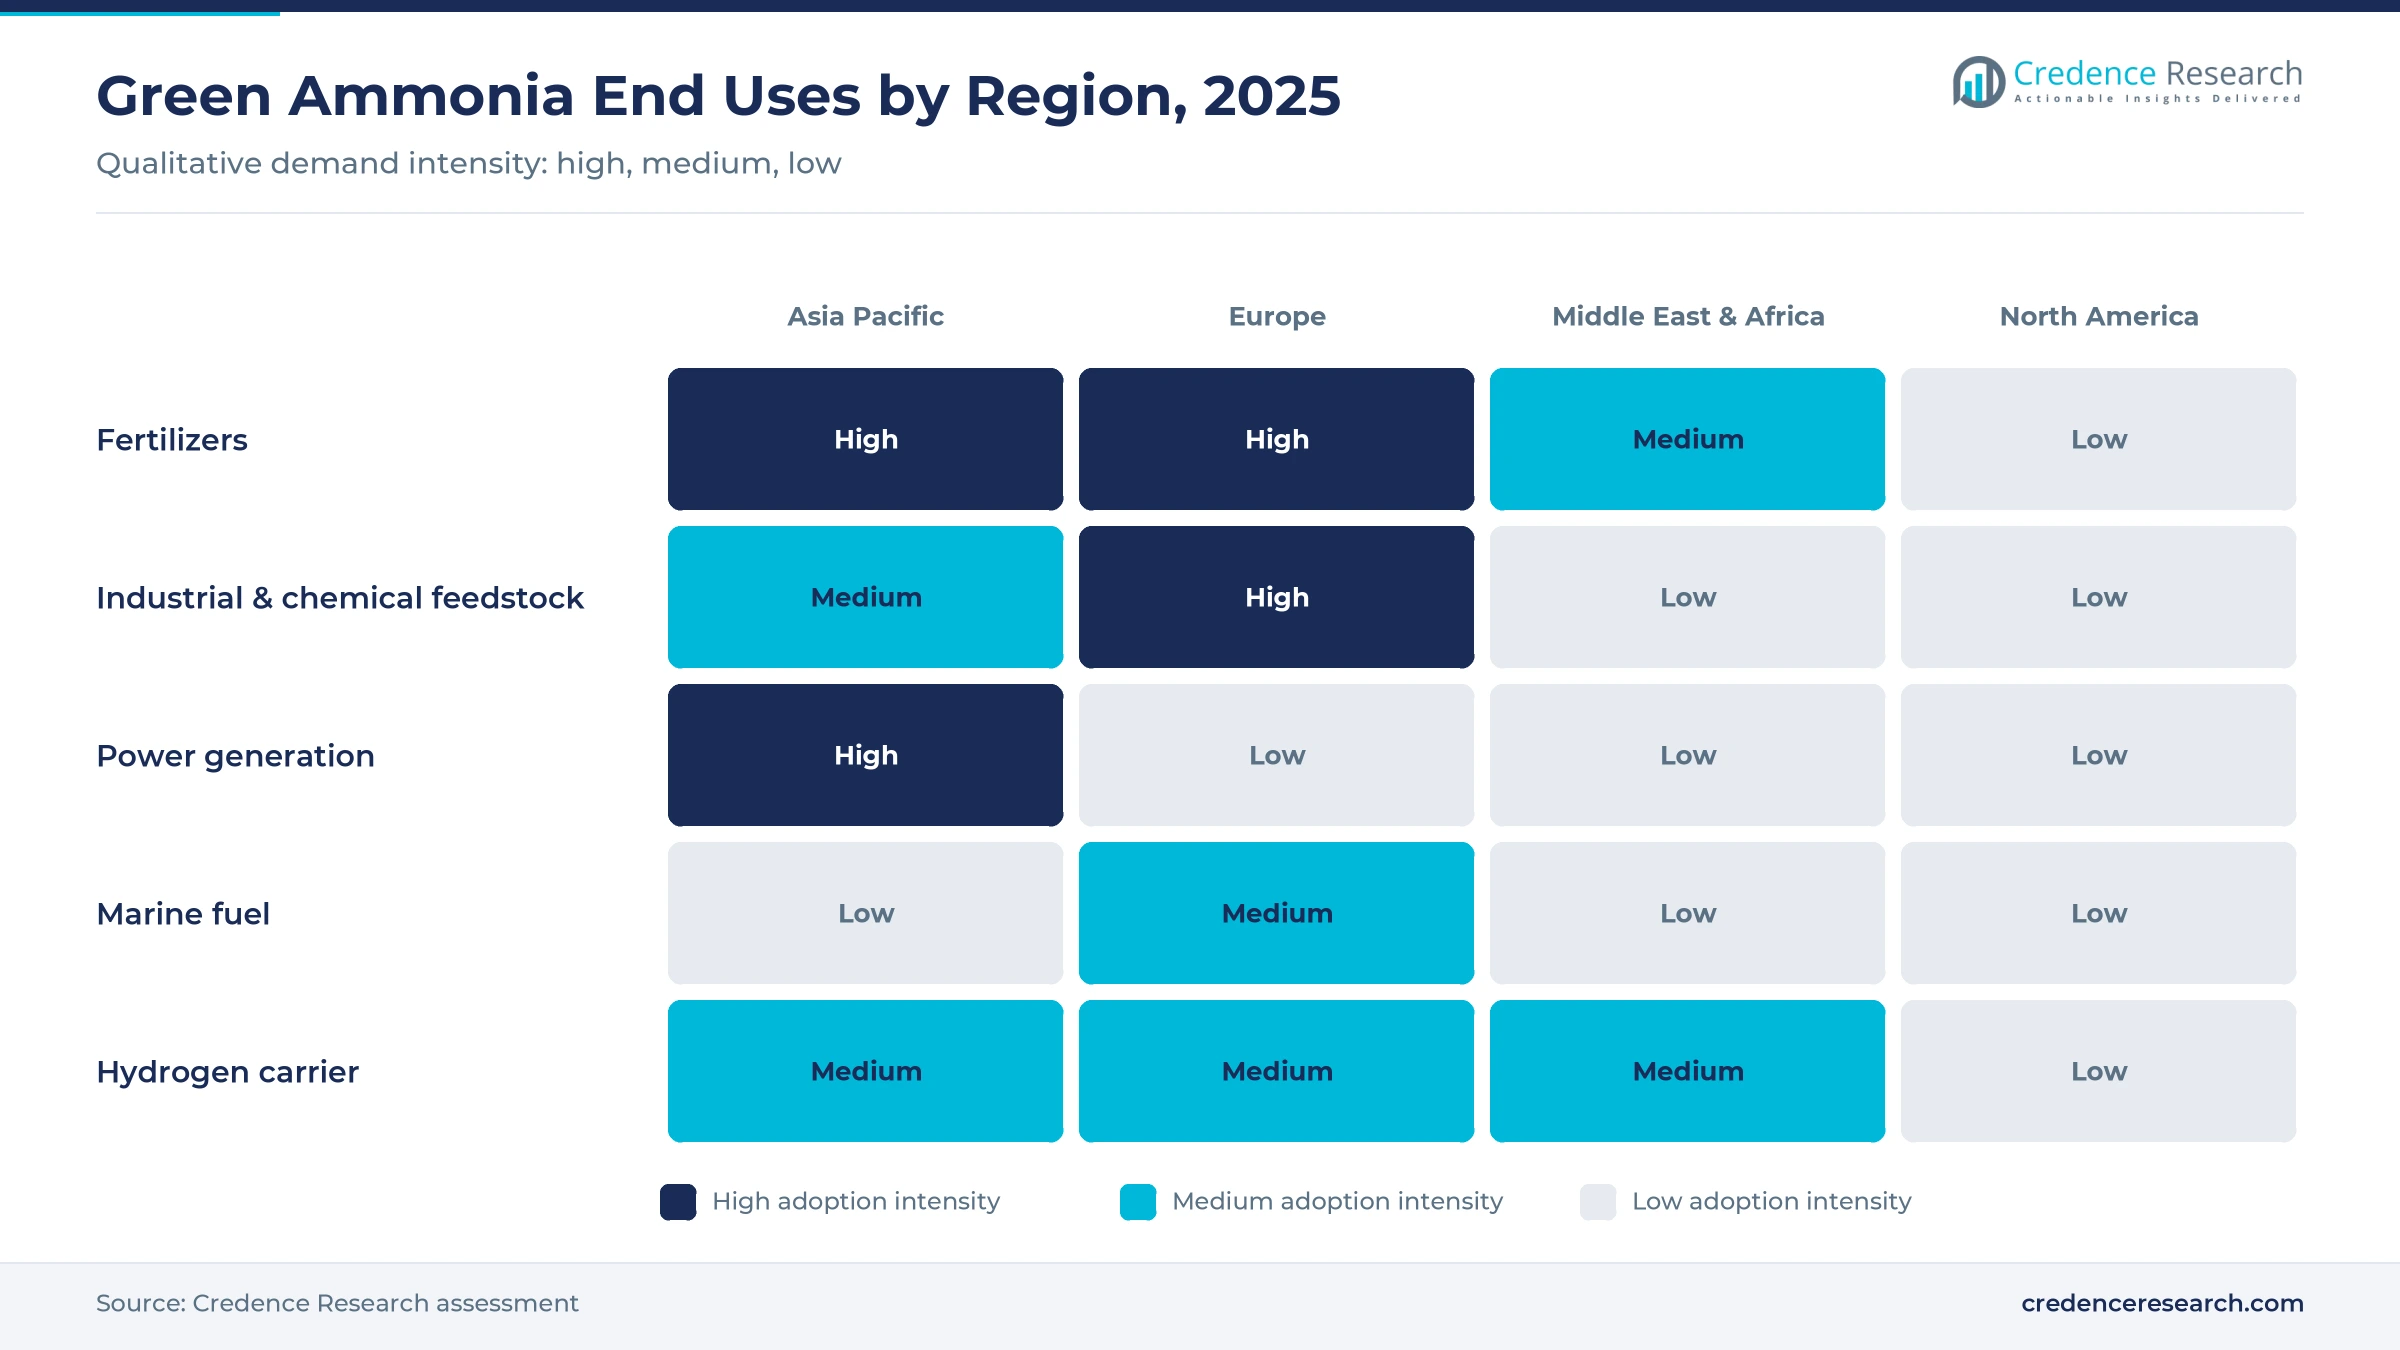
- Asia Pacific held 60.2% of 2025 value, the largest regional share, because plants at Chifeng, Da'an and Songyuan in China began production between July and December 2025.
- Alkaline water electrolysis accounted for 73.6% of 2025 value, the largest technology, because Chinese suppliers build low-cost alkaline stacks at the scale large plants need.
- Envision shipped the first RFNBO-compliant ammonia cargo from Chifeng to LOTTE Fine Chemical in Ulsan in February 2026, opening certified seaborne trade from China to North Asia.
- Binding offtake now decides which plants get built. Uniper signed with AM Green in January 2026, and Air Products holds a 30-year agreement for all NEOM output.
Alkaline stacks and fertilizers lead as ship fuel surges
Alkaline electrolysis leads the technology mix while solid oxide expands fastest
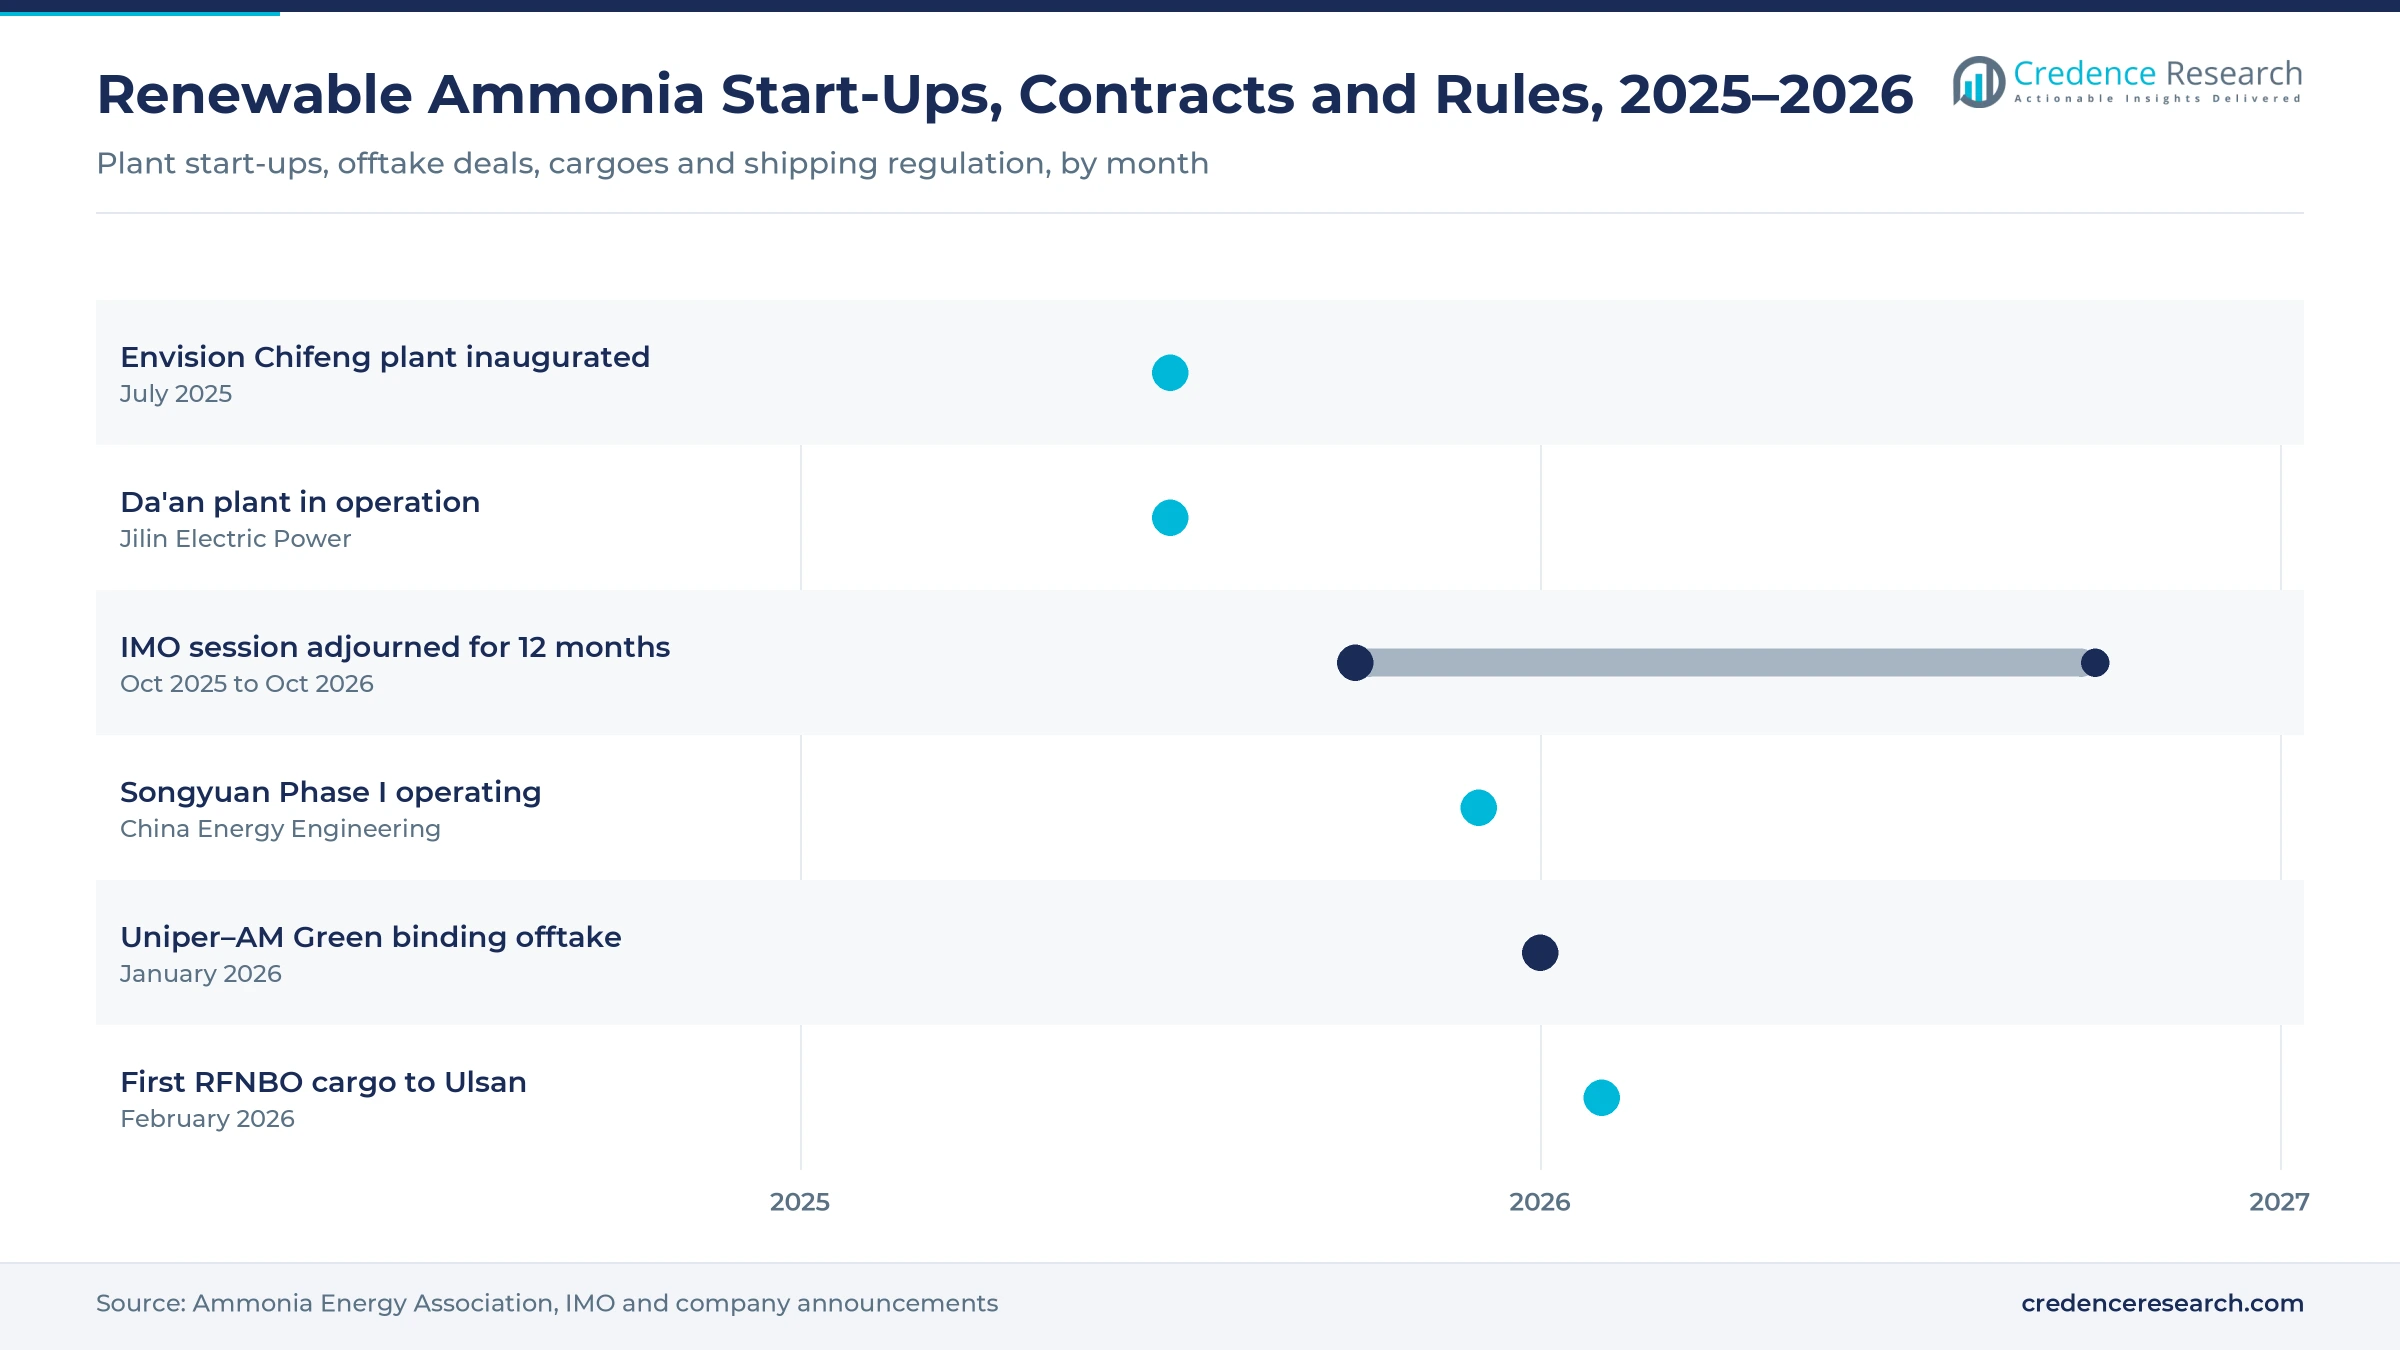
Based on technology, the market is categorized into alkaline water electrolysis, proton exchange membrane (PEM) electrolysis and solid oxide electrolysis. Alkaline water electrolysis led with 73.6% of 2025 value, because it is the cheapest proven route per unit of capacity and Chinese suppliers build it at scale for plants that buffer power with storage. Solid oxide electrolysis grows fastest at 63.37% a year from a small base, as high-temperature stacks reuse heat from the ammonia loop to cut electricity per ton.
Fertilizer plants lead applications while marine fuel expands fastest
Based on application, the market is categorized into fertilizers, industrial and chemical feedstock, power generation, marine fuel and others, including hydrogen carriers and refrigeration. Fertilizers led with 68.3% of 2025 value, because ammonia plants can swap fossil hydrogen for electrolytic hydrogen without changing the product, storage or customer. Marine fuel grows fastest at 70.82% a year from a tiny base, once ammonia engines, bunkering and a global carbon price for ship fuel arrive in the 2030s.
| Segment Group | Leading Sub-segment | Share, 2025 | Fastest-growing Sub-segment | CAGR, 2025–2035 |
|---|---|---|---|---|
| By Technology | Alkaline Water Electrolysis | 73.6% | Solid Oxide Electrolysis | 63.37% |
| By Application | Fertilizers | 68.3% | Marine Fuel | 70.82% |
Request a Free Sample
Fill in your details and we'll send you a free sample report.
- Sample data tables & charts
- Research methodology
Indian auctions and named buyers drive renewable ammonia
Indian fertilizer auctions turn policy into 10-year supply contracts
In August 2025, the Solar Energy Corporation of India ran green ammonia auctions for domestic fertilizer plants under the National Green Hydrogen Mission and discovered record-low prices. Jakson Green won a 10-year contract to supply Coromandel International at Kakinada, and NTPC Renewable Energy, ACME, Oriana Power, SCC Infrastructure and Onix Renewables won other rounds. Fixed prices and a subsidy in the first three years remove offtake risk, which keeps Asia Pacific growing at 43.49% a year through 2035.
Binding export contracts replace nonbinding memorandums
On Jan. 12, 2026, Uniper signed a binding long-term offtake with AM Green for RFNBO-certified ammonia from Kakinada, with first shipments as early as 2028. Air Products holds an exclusive 30-year agreement for all ammonia from NEOM in Saudi Arabia, and Marubeni agreed to buy Chifeng output for Asia Pacific markets from 2026. Named buyers let developers raise project finance, while plants without them stall. The effect is medium term and strongest in export hubs in India and the Gulf.
Low-cost Chinese wind power and electrolyzers narrow the gap with fossil ammonia
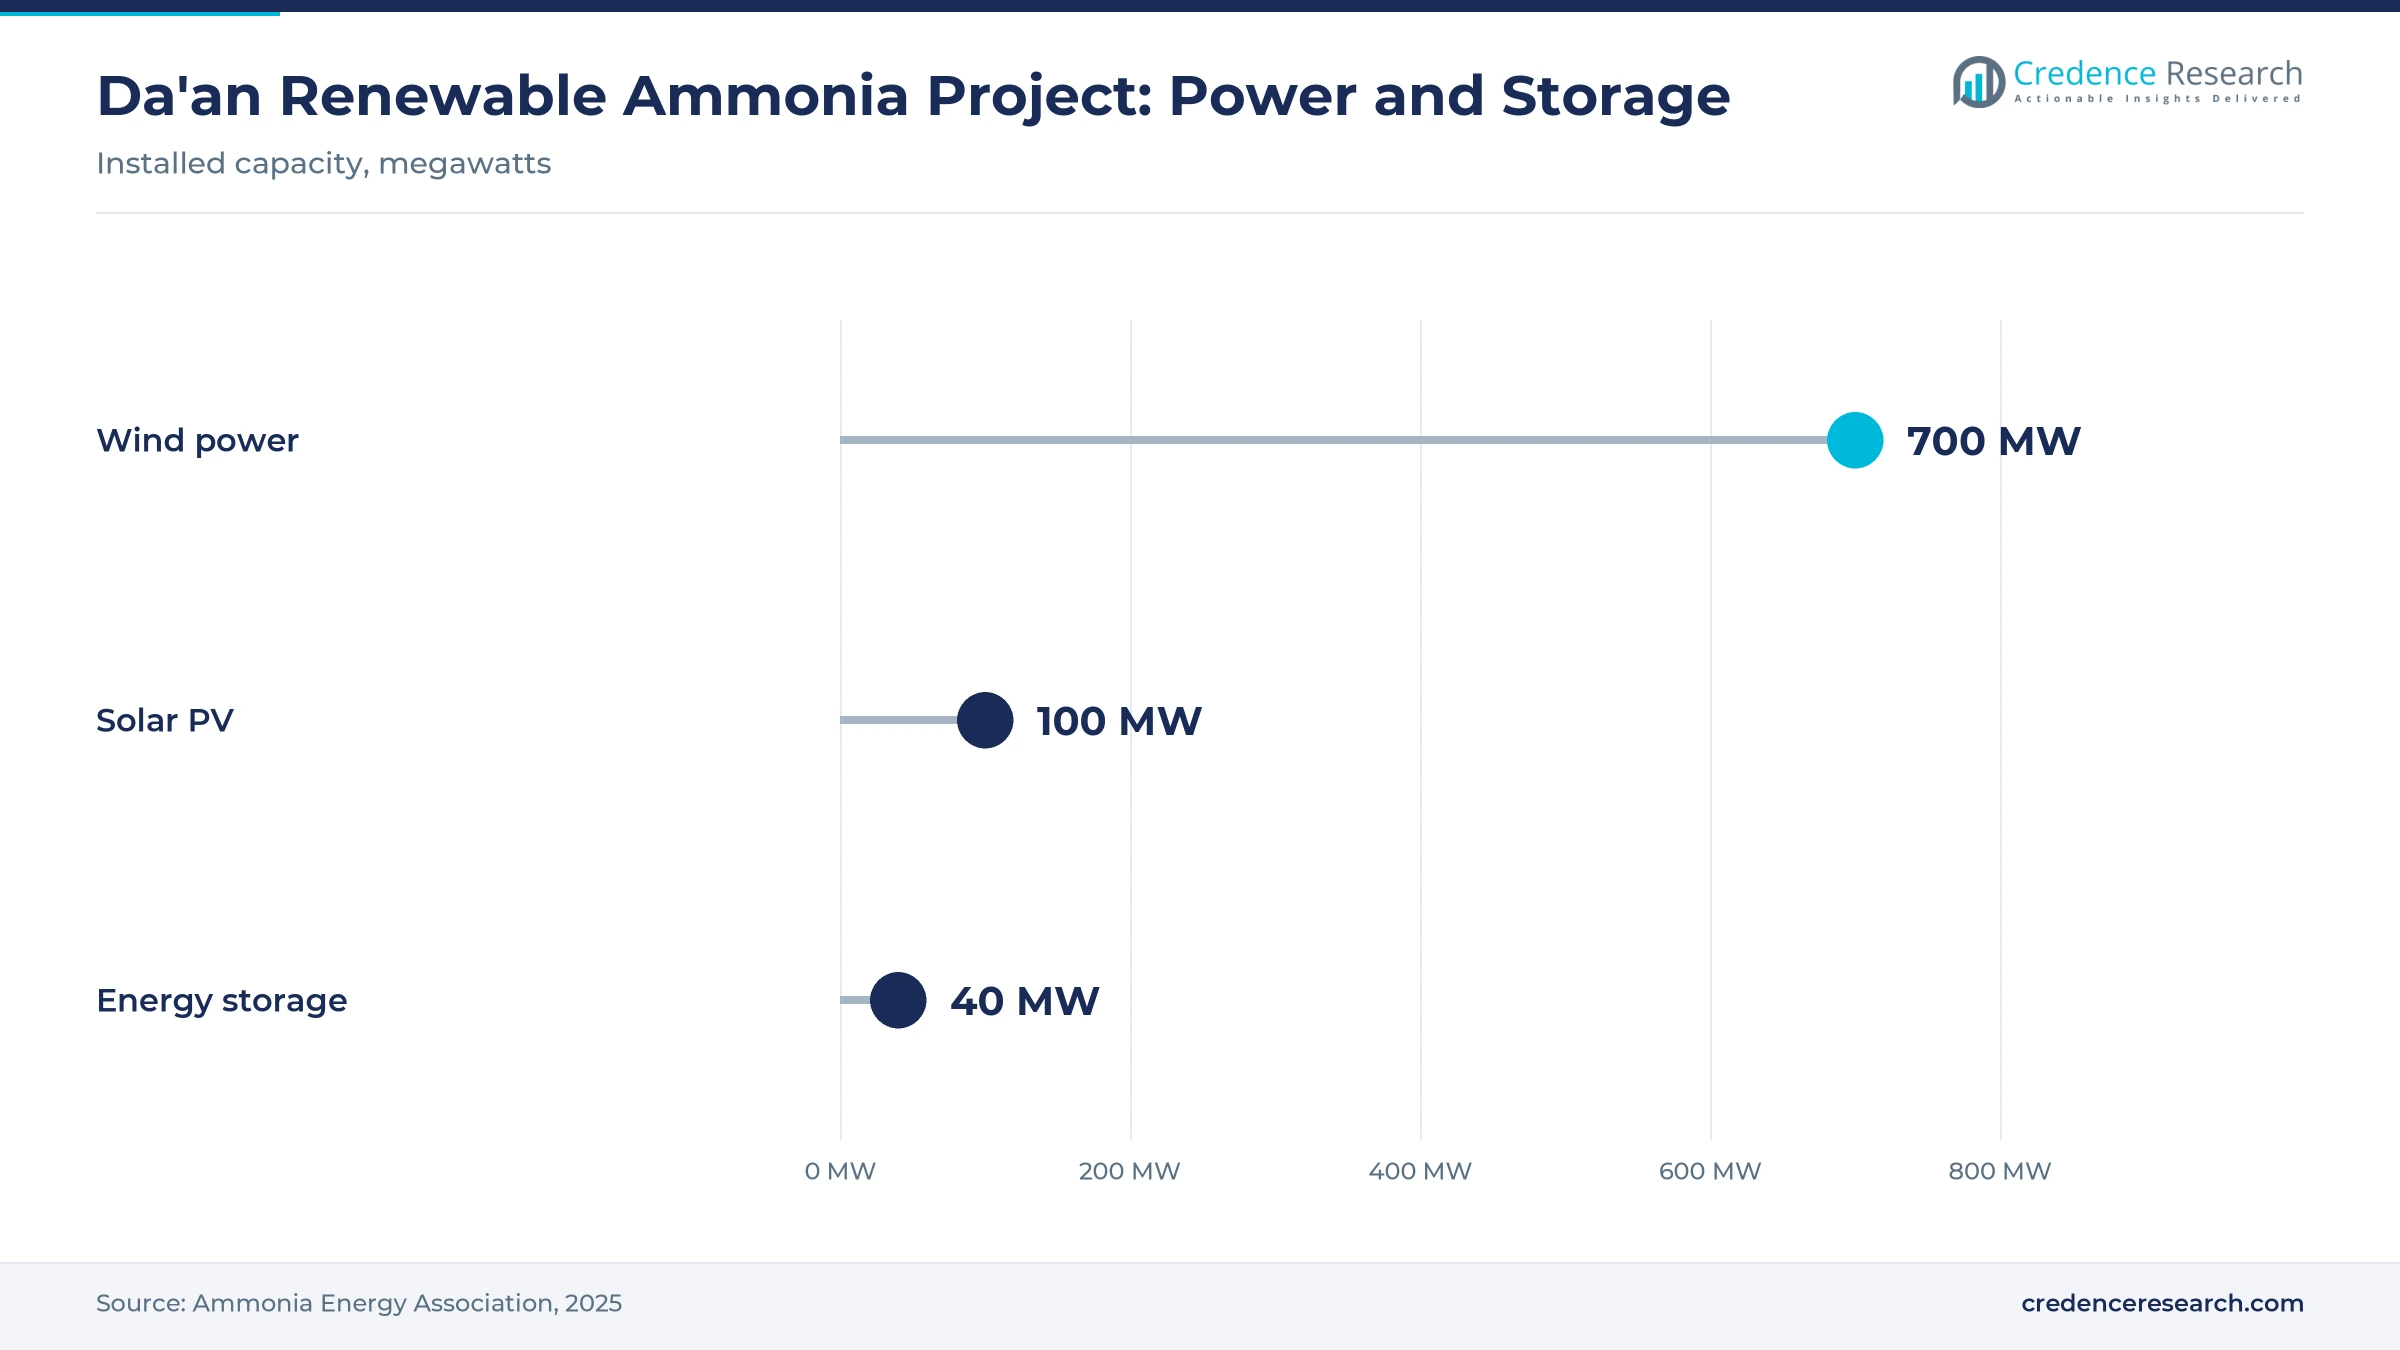
China leads electrolyzer manufacturing, deployment and cost, according to the International Energy Agency. Jilin Electric Power's Da'an plant, rated at 180,000 tons a year and costing USD 822 million, pairs 700 MW of wind and 100 MW of solar with a 40 MW storage system, according to the Ammonia Energy Association. Caixin reported that Envision's Chifeng plant buys power at roughly 60% below local industrial grid rates. That cost base explains why Asia Pacific leads regional value.
Certification rules let low-carbon sellers earn a premium
Europe's RFNBO rules define which ammonia counts as renewable toward EU targets, and ISCC EU and RFNBO certification let Envision ship a certified cargo to South Korea in early 2026. Certified tons sell at a premium to buyers with carbon targets, while uncertified domestic tons price near fossil ammonia. Makers of nitric acid, explosives and caprolactam can switch without changing their process. The effect is medium term, strongest for exporters selling into Europe, Japan and Korea, which pay the highest prices.
Northern China takes the lead as certified cargoes spread
Production leadership shifts from Norway and Spain to northern China
Until 2024, the largest operating sites were Yara's Porsgrunn plant in Norway and Iberdrola's Puertollano plant feeding Fertiberia in Spain. Within 6 months of 2025, Envision's Chifeng plant, the Da'an project of the State Power Investment Corporation group and Energy China's Songyuan park all started up and dwarfed them. Europe still held 26.7% of 2025 value because its tons sell at a premium, but it grows at 28.24% a year, the slowest pace of any region through 2035.
Multi-product parks split electrolyzer output between ammonia and methanol
The largest Chinese sites now make more than one molecule. Songyuan Phase I produces both ammonia and methanol, and Chifeng is planned as a wider net-zero industrial park. Developers spread electrolyzer output across products to match shipping, chemical and fertilizer buyers, which lowers the risk of depending on a single offtaker. As a result, electrolyzer suppliers win larger orders from these parks.
Certified seaborne cargoes to Japan and Korea open an opportunity
Envision delivered the first RFNBO-compliant ammonia cargo from Chifeng to LOTTE Fine Chemical in Ulsan, South Korea, in February 2026. The voyage proves that the chain from electrolyzer to import terminal works. Japanese and Korean utilities and chemical importers are the next buyers, backed by government support for low-carbon ammonia imports, and certified cargoes from China, India and the Gulf now have a path to their terminals.
Ship fuel and hydrogen carrier markets offer an opportunity for the 2030s
Ammonia carries more hydrogen per cubic meter than liquid hydrogen and ships in existing gas carriers, which makes it a candidate fuel for vessels and a carrier that can be cracked back to hydrogen at import terminals. Marine fuel grows fastest among applications at 70.82% a year from a very small base. Engine makers, bunkering ports and producers with coastal plants are positioned to win once shipping rules settle.
Cost gaps, cancellations and the IMO delay restrain growth
A persistent cost gap with gas-based ammonia
Outside the best Chinese and Indian sites, renewable ammonia still costs more than fossil ammonia. The IEA expects low-emissions hydrogen to stay more expensive than unabated fossil production in the near term and has turned less optimistic on electrolyzer cost declines. Without a premium, a mandate or a subsidy, most fertilizer and chemical buyers still choose gas-based ammonia, which limits sales. Auctions such as India's and certified premium sales are the main mitigation.
Cancellations and retreats thin the project pipeline
The IEA lowered its 2030 outlook for low-emissions hydrogen in September 2025, citing delays and cancellations. Fortescue shelved its Arizona hydrogen and PEM50 projects in July 2025, and CF Industries disclosed to the U.S. Securities and Exchange Commission in February 2026 that it would not complete its Donaldsonville electrolyzer and would favor carbon capture. As a result, North America holds only 3.3% of 2025 value. Developers mitigate the risk by securing binding buyers before committing capital.
The IMO delay holds back shipping demand
Shipping demand depends on a global carbon price for ship fuel. The International Maritime Organization adjourned the Oct. 14-17, 2025, session meant to adopt amendments including its Net-Zero Framework and set it to reconvene in 12 months. Until the framework is adopted, shipowners have little reason to pay for ammonia-fueled vessels, which delays orders for engines and bunkering. Producers mitigate the risk by selling first to fertilizer, chemical and power buyers whose demand does not depend on shipping rules.
Variable wind and solar strain ammonia synthesis loops
Ammonia synthesis prefers steady operation, while wind and sun do not deliver it. Caixin reported that Chifeng had to buy grid power after three days of little wind or sunshine during trial operation. Lower utilization raises cost per ton for plant owners and can break off-grid certification claims. Hydrogen buffers, batteries such as the 40 MW system at Da'an, and flexible synthesis loops mitigate the problem but add capital cost, and the first plants are still learning to run at high rates.
Chinese plants lead while Latin America and the Gulf surge
| Region | Share, 2025 | CAGR, 2025–2035 |
|---|---|---|
| Asia Pacific | 60.2% | 43.49% |
| Europe | 26.7% | 28.24% |
| Middle East & Africa | 8.0% | 51.71% |
| North America | 3.3% | 49.56% |
| Latin America | 1.8% | 54.11% |
Asia Pacific is the largest region, anchored by Chinese start-ups and Indian auctions
Asia Pacific held 60.2% of 2025 value and grows at 43.49% a year. China supplies almost all of today's output from Chifeng, Da'an and Songyuan, where developers pair large wind and solar fleets with domestic electrolyzers. India adds AM Green at Kakinada, ACME in Odisha with IHI of Japan as a buyer, and the SECI auction winners later in the decade, while Japan and Korea are the main import markets.
Europe's pioneer plants earn a premium as the region turns to imports
Europe held 26.7% of 2025 value and grows at 28.24% a year, the slowest regional pace. Yara's Porsgrunn and Iberdrola's Puertollano plants are among the longest-running sites, and buyers pay the highest prices for RFNBO-certified tons. High power costs limit new large plants, so European buyers increasingly contract imports, such as Uniper's 2026 agreement for Indian ammonia, rather than build at home.
Middle East & Africa sees NEOM lead a wave of coastal export projects
The Middle East & Africa held 8.0% of 2025 value and grows at 51.71% a year. NEOM Green Hydrogen Company, owned by ACWA Power, Air Products and NEOM, neared completion of its wind and solar complex in July 2026 and targets first ammonia in 2027, with Air Products as sole buyer. Coastal sites in Oman, Egypt and Morocco combine strong sun and wind with deep-water ports, which makes them candidates for the next export hubs.
North America and Latin America see carbon capture compete while southern projects build
North America held 3.3% of 2025 value and grows at 49.56% a year. Most U.S. ammonia producers favor carbon capture over electrolysis, while Hy2gen's Courant project in Quebec is the main Canadian green ammonia development. Latin America held 1.8% and is the fastest-growing region at 54.11% a year. Chile and Brazil combine strong wind and solar resources with large fertilizer imports.
Indian auctions and a first certified cargo, 2025–2026
| Development | Status and market relevance |
|---|---|
| In February 2026, Envision delivered its first RFNBO-compliant ammonia cargo from Chifeng to LOTTE Fine Chemical in Ulsan, South Korea. | Delivered. Proves certified seaborne trade from China to North Asia. |
| In January 2026, Uniper and AM Green signed a binding long-term offtake agreement for RFNBO ammonia from Kakinada, with first shipment as early as 2028. | Signed. Gives an Indian export plant a European anchor buyer. |
| In December 2025, China Energy Engineering began operating Phase I of its Songyuan green hydrogen, ammonia and methanol park. | Operating. Adds a third large Chinese producer. |
| In October 2025, the IMO adjourned adoption of its Net-Zero Framework and set the session to reconvene in 12 months. | Adjourned. Delays the carbon price that would pull ammonia into shipping. |
| In August 2025, SECI auctions for Indian fertilizer plants discovered record-low green ammonia prices, and Jakson Green won supply to Coromandel at Kakinada. | Awarded. Creates 10-year domestic demand for Indian producers. |
Electrolyzer choice and certification set plant economics
- Alkaline electrolysis, which held 73.6% of 2025 value, is the low-cost default for large plants, especially in China, where domestic suppliers build stacks at scale and plants buffer variable power with storage.
- PEM electrolysis responds quickly to changing power, which suits sites tied directly to wind and solar. Da'an combines PEM and alkaline units from 4 Chinese suppliers.
- Solid oxide electrolysis, the fastest-growing technology at 63.37% a year, runs at high temperature and can use waste heat from the ammonia loop to cut electricity use per ton once larger stacks prove their lifetimes.
- Certification under RFNBO and ISCC EU rules decides which tons earn a premium in Europe, Japan and Korea, splitting output into certified export cargoes and domestic tons.
Need a Custom Version of This Report?
Tailor the scope, geography, or segments to your exact requirements.
- Custom geography or segment scope
- Direct access to our analyst team
Chinese groups and export developers divide supply
Supply splits three ways, starting with Chinese energy groups, led by Envision Energy, State Power Investment Corporation through Jilin Electric Power, and China Energy Engineering, which own the plants that made most 2025 tons and compete on power cost and scale. Export developers, including NEOM Green Hydrogen Company with Air Products as sole buyer, AM Green, ACME Group and Hy2gen, are building the next wave against long-term contracts. European fertilizer and utility groups, including Yara International, Iberdrola and Fertiberia, run smaller pioneer sites and decide how fast renewable tons enter their own plants. Fortescue shelved 2 hydrogen projects in 2025, showing the pressure on developers without firm buyers. Supply is highly concentrated today and becomes less so after 2027 as NEOM and Indian exporters start. No company reports green ammonia sales on a comparable basis, so no share ranking is given.
Renewable ammonia producers, developers and buyers
| Company | Type | Role in the market |
|---|---|---|
| Envision Energy | Chinese producer | Off-grid Chifeng plant, inaugurated July 2025; first RFNBO-compliant cargo to South Korea |
| State Power Investment Corporation | Chinese producer | Da'an project in Jilin through Jilin Electric Power, 180,000 tons a year |
| China Energy Engineering | Chinese producer | Songyuan ammonia and methanol park, Phase I from December 2025 |
| NEOM Green Hydrogen Company | Export developer | Saudi Arabian plant targeting first ammonia in 2027 |
| Air Products | Offtaker and co-owner | Exclusive 30-year buyer of NEOM output |
| AM Green | Export developer | Kakinada project with Uniper as binding buyer |
| ACME Group | Export developer | Odisha project with IHI as buyer; SECI auction winner |
| Yara International | Fertilizer producer | Porsgrunn electrolysis plant in Norway |
| Iberdrola | Utility | Puertollano plant supplying hydrogen for Fertiberia |
| Fertiberia | Fertilizer producer | Ammonia plant supplied from Puertollano |
| Hy2gen | Developer | Courant project in Quebec; production timing not confirmed |
| Fortescue | Developer | Shelved Arizona hydrogen and PEM50 projects in July 2025 |
Contracts, not capacity announcements, set the curve
Credence Research's assessment is that 2025 was the year renewable ammonia stopped being a demonstration product, but contracts, not capacity announcements, now set the curve. Plants with a named buyer, such as NEOM with Air Products and Kakinada with Uniper, will reach full rates; many announced projects without one will not. The largest new value lies in certified exports to Europe, Japan and Korea. Investors and buyers should watch Indian auction volumes, the IMO's reconvened session and the timing of the first NEOM shipments.
Plant-by-plant output and offtake tests behind the estimate
The report uses 2025 as the base year and forecasts to 2035, with CAGR calculated over 2025–2035. Market values come from Credence Research's market model, built plant by plant from nameplate capacity, start date, ramp-up and realized regional prices, tested against IEA data on low-emissions hydrogen output and against contracted offtake, while segment and regional splits are Credence Research estimates.
Export hubs, importers and ships join fertilizer buyers
Through 2035, renewable ammonia will move from a handful of Chinese and European plants to export hubs in India, Saudi Arabia and other coastal sites with strong sun and wind. Fertilizer plants, which took 68.3% of 2025 value, remain the anchor, while chemical makers, Asian utilities and, after the IMO adopts a carbon price, shipowners add demand. Asia Pacific stays the largest producer, and the Middle East & Africa, growing 51.71% a year, and Latin America gain share.
Frequently Asked Questions
What was the size of the green ammonia market in 2025?
What is the forecast value and CAGR of the green ammonia market?
How is green ammonia different from blue ammonia?
Which region leads green ammonia production?
Which electrolyzer technology leads the green ammonia market?
What is green ammonia mainly used for?
Who are the major companies in the green ammonia market?
What challenges could slow the green ammonia market?
Table of Content
Chapter 1 Market Segmentation
- 1.1 Segmentation Framework
- 1.1.1 Product and Service Classification
- 1.1.2 Application and End-Use Classification
- 1.1.3 Technology and Solution Classification
- 1.1.4 Customer and Distribution Channel Classification
- 1.1.5 Geographic Segmentation
- 1.1.6 Market Segment Definitions and Boundaries
- 1.2 By Technology
- 1.2.1 Alkaline Water Electrolysis
- 1.2.2 Proton Exchange Membrane (PEM)
- 1.2.3 Solid Oxide Electrolysis
- 1.3 By Application
- 1.3.1 Fertilizers
- 1.3.2 Industrial & Chemical Feedstock
- 1.3.3 Power Generation
- 1.3.4 Marine Fuel
- 1.3.5 Others (Hydrogen Carrier, Refrigeration)
Chapter 2 Introduction
- 2.1 Report Objectives and Scope
- 2.2 Product Definition and Industry Terminology
- 2.3 Market Inclusions and Exclusions
- 2.4 Research Process
- 2.4.1 Primary Research and Expert Interviews
- 2.4.2 Secondary Research and Source Review
- 2.4.3 Top-Down and Bottom-Up Estimation
- 2.4.4 Data Triangulation and Verification
- 2.5 Market Size Measurement Basis
- 2.5.1 2025: USD 150.8 million → 2035: USD 5.10 billion
- 2.6 Historical and Forecast Reference Periods
- 2.6.1 Historical Period: 2018-2025
- 2.6.2 Base Year: 2025
- 2.6.3 Forecast Period: 2025-2035
- 2.7 Research Assumptions and Limitations
Chapter 3 Executive Summary
- 3.1 Market Snapshot and Key Findings
- 3.2 Base-Year Market Size, 2025
- 3.3 Forecast Market Size, 2035
- 3.4 Revenue and Volume Growth Outlook
- 3.5 Key Demand and Supply Indicators
- 3.6 Leading Market Segments
- 3.7 Fastest-Growing Market Opportunities
- 3.8 Regional Performance Highlights
- 3.9 Technology and Industry Transformation
- 3.10 Competitive Landscape Summary
- 3.11 Analyst View and Strategic Implications
Chapter 4 Global Green Ammonia Market Trends and Developments
- 4.1 Historical Industry Development, 2018-2025
- 4.2 Recent Market Trends and Developments
- 4.3 Demand and Customer Behavior Trends
- 4.4 Technology and Product Innovation
- 4.5 Artificial Intelligence, Automation and Digitalization
- 4.6 Local Manufacturing and Supply Chain Realignment
- 4.7 Industry Partnerships, Mergers and Acquisitions
- 4.8 Sustainability and Circular Economy Developments
- 4.9 Government and Private Sector Investment Trends
- 4.10 Emerging Business Models and Commercialization
- 4.11 Industry Developments and Announcements
Chapter 5 Global Green Ammonia Market Production, Supply and Demand Analysis
- 5.1 Demand Trend and Consumption Analysis, 2018-2025
- 5.2 Demand Forecast, 2025-2035
- 5.3 Production and Output Trend, 2018-2025
- 5.4 Production and Output Forecast, 2025-2035
- 5.5 Installed Capacity and Capacity Utilization
- 5.6 Company-Wise Production Plants and Statistics
- 5.6.1 Installed Production Capacity
- 5.6.2 Actual Production
- 5.6.3 Planned Capacity and Expansion Targets
- 5.7 Supply Chain Structure and Procurement Trends
- 5.8 Supply-Demand Gap and Bottlenecks
- 5.9 Import Dependence and Sourcing Structure
- 5.10 Contract Manufacturing and Outsourcing
- 5.11 Regional Supply and Demand Concentration
Chapter 6 Global Green Ammonia Market Pricing Analysis
- 6.1 Pricing Structure and Measurement
- 6.2 Historical Pricing Trends, 2018-2025
- 6.3 Pricing Outlook, 2025-2035
- 6.4 Average Selling Price and Unit Economics
- 6.5 Pricing by Product and Market Segment
- 6.6 Geographic Pricing Differences
- 6.7 Key Input, Energy, Labor and Logistics Costs
- 6.8 Contract Pricing and Purchasing Models
- 6.9 Pricing Sensitivity and Competitive Positioning
- 6.10 Price, Margin and Profitability Implications
Chapter 7 Global Green Ammonia Market Dynamics
- 7.1 Market Growth Drivers
- 7.1.1 Demand-Side Drivers
- 7.1.2 Technology and Innovation Drivers
- 7.1.3 Infrastructure and Investment Drivers
- 7.1.4 Regulatory and Policy Drivers
- 7.2 Market Restraints
- 7.2.1 Cost and Affordability Constraints
- 7.2.2 Technology and Adoption Barriers
- 7.2.3 Supply Chain and Operational Constraints
- 7.3 Market Challenges
- 7.3.1 Competitive Pressure and Margin Erosion
- 7.3.2 Skills, Infrastructure and Implementation Gaps
- 7.4 Emerging Market Opportunities
- 7.5 Market Dynamics Impact and Time-Horizon Assessment
Chapter 8 Global Green Ammonia Value Chain Analysis
- 8.1 Industry Value Chain Overview
- 8.2 Upstream Suppliers and Critical Inputs
- 8.3 Technology and Component Providers
- 8.4 Manufacturing or Service Delivery
- 8.5 Distribution, Channel Partners and Integrators
- 8.6 Downstream Applications and End Users
- 8.7 Value Addition and Profit Pools
- 8.8 Vertical Integration and Outsourcing
- 8.9 Supplier Concentration and Risk
- 8.10 Supply Chain Localization and Resilience
Chapter 9 Global Green Ammonia Market Regulations and Policies
- 9.1 Relevant Laws, Standards and Compliance Frameworks
- 9.2 Product, Service, Safety and Quality Requirements
- 9.3 Government Policies, Incentives and Subsidies
- 9.4 Imports, Exports and Trade Barriers
- 9.5 Public Procurement and Local Content Requirements
- 9.6 Environmental and Sustainability Compliance
- 9.7 Upcoming Policy Changes and Market Implications
Chapter 10 Global Green Ammonia Market Hotspots and Opportunities
- 10.1 Market Opportunity Mapping and Growth Hotspots
- 10.2 High-Growth Applications and Customer Groups
- 10.3 Underserved Markets and White-Space Opportunities
- 10.4 Emerging Technology and Product Opportunities
- 10.5 New Capacity and Investment Hotspots
- 10.6 Market Entry and Expansion Opportunities
- 10.7 Distribution and Partnership Opportunities
- 10.8 Near-Term and Long-Term Commercial Potential
- 10.9 Opportunity Attractiveness and Execution Risks
Chapter 11 Global Green Ammonia Market Outlook, 2025-2035
- 11.1 Market Size and Analysis
- 11.1.1 Revenue (Market Measurement: 2025: USD 150.8 million → 2035: USD 5.10 billion)
- 11.1.2 Market Volume and Quantity Sold
- 11.1.3 Historical Market Size, 2018-2025
- 11.1.4 Base-Year Market Size, 2025
- 11.2 Market Forecast, 2025-2035
- 11.2.1 Revenue Forecast to 2035
- 11.2.2 Volume Forecast to 2035
- 11.2.3 CAGR and Year-on-Year Growth
- 11.2.4 Incremental Revenue Opportunity
- 11.3 Forecast Assumptions and Scenario Analysis
- 11.3.1 Base-Case Forecast
- 11.3.2 Optimistic and Conservative Scenarios
- 11.3.3 Technology, Pricing and Policy Sensitivities
- 11.4 Market Attractiveness and Growth Outlook
Chapter 12 Global Green Ammonia Market Segmentation and Outlook
- 12.1 Segmentation Summary and Market Shares, 2025
- 12.2 Largest and Fastest-Growing Segments
- 12.3 By Technology - Market Size and Forecast, 2025-2035
- 12.3.1 Segment Definition and Scope
- 12.3.2 Historical Market Size, 2018-2025
- 12.3.3 Revenue Forecast, 2025-2035
- 12.3.4 Volume Forecast, 2025-2035
- 12.3.5 Base-Year Market Share, 2025
- 12.3.6 Segment CAGR and Growth Drivers
- 12.3.7 Subsegment Market Size and Forecast
- 12.3.7.1 Alkaline Water Electrolysis
- 12.3.7.2 Proton Exchange Membrane (PEM)
- 12.3.7.3 Solid Oxide Electrolysis
- 12.3.8 Subsegment Pricing and Adoption Trends
- 12.3.9 Leading Suppliers and Competition
- 12.3.10 Regional Demand and Opportunities
- 12.4 By Application - Market Size and Forecast, 2025-2035
- 12.4.1 Segment Definition and Scope
- 12.4.2 Historical Market Size, 2018-2025
- 12.4.3 Revenue Forecast, 2025-2035
- 12.4.4 Volume Forecast, 2025-2035
- 12.4.5 Base-Year Market Share, 2025
- 12.4.6 Segment CAGR and Growth Drivers
- 12.4.7 Subsegment Market Size and Forecast
- 12.4.7.1 Fertilizers
- 12.4.7.2 Industrial & Chemical Feedstock
- 12.4.7.3 Power Generation
- 12.4.7.4 Marine Fuel
- 12.4.7.5 Others (Hydrogen Carrier, Refrigeration)
- 12.4.8 Subsegment Pricing and Adoption Trends
- 12.4.9 Leading Suppliers and Competition
- 12.4.10 Regional Demand and Opportunities
- 12.5 Segment Growth Comparison
- 12.6 Segment Attractiveness and Priority Matrix
Chapter 13 Global Green Ammonia End-Use and Application Market Outlook
- 13.1 End-Use Industry and Customer Demand Structure
- 13.2 Leading Applications and Customer Groups
- 13.3 End-Use Market Size, Share and Forecast
- 13.4 Major End-Use Industry Deep Dives
- 13.4.1 Customer Requirements and Use Cases
- 13.4.2 Demand and Replacement Cycles
- 13.4.3 Technical and Regulatory Considerations
- 13.4.4 Purchasing and Procurement Models
- 13.4.5 Leading Vendors and Distribution Channels
- 13.4.6 Forecast and Commercial Opportunities
- 13.5 Emerging Applications and Cross-Segment Demand
- 13.6 End-Use Industry Investment Priorities
Chapter 14 Global Green Ammonia Geographic Market Outlook, 2025-2035
- 14.1 Regional Market Size and Share, 2025
- 14.2 Regional Market Forecast, 2025-2035
- 14.3 Regional Pricing, Production and Demand Differences
- 14.4 North America
- 14.4.1 United States
- 14.4.2 Canada
- 14.4.3 Mexico
- 14.5 Europe
- 14.5.1 Germany
- 14.5.2 France
- 14.5.3 Italy
- 14.5.4 United Kingdom
- 14.5.5 Spain
- 14.5.6 Poland
- 14.5.7 Russia
- 14.5.8 Netherlands
- 14.5.9 Belgium
- 14.5.10 Sweden
- 14.5.11 Denmark
- 14.5.12 Norway
- 14.5.13 Rest of Europe
- 14.6 Asia Pacific
- 14.6.1 China
- 14.6.2 India
- 14.6.3 Japan
- 14.6.4 South Korea
- 14.6.5 Thailand
- 14.6.6 Indonesia
- 14.6.7 Vietnam
- 14.6.8 Malaysia
- 14.6.9 Australia
- 14.6.10 Rest of Asia Pacific
- 14.7 Latin America
- 14.7.1 Brazil
- 14.7.2 Argentina
- 14.7.3 Colombia
- 14.7.4 Chile
- 14.7.5 Rest of Latin America
- 14.8 Middle East
- 14.8.1 Saudi Arabia
- 14.8.2 United Arab Emirates
- 14.8.3 Turkey
- 14.8.4 Israel
- 14.8.5 Iran
- 14.8.6 Rest of the Middle East
- 14.9 Africa
- 14.9.1 South Africa
- 14.9.2 Egypt
- 14.9.3 Nigeria
- 14.9.4 Morocco
- 14.9.5 Rest of Africa
- 14.10 Regional Investment, Policy and Supply Chain Differences
- 14.11 Regional Competitive Landscape
- 14.12 Geographic Growth Hotspots
Chapter 15 Global Green Ammonia Technology, Innovation and Sustainability Outlook
- 15.1 Technology Landscape and Maturity
- 15.2 Product, Process and Service Innovation
- 15.3 AI, Automation and Digital Tools in the Industry
- 15.4 Technology Adoption and Performance Benchmarking
- 15.5 Innovation Pipeline and R&D Investment
- 15.6 Patent and Intellectual Property Trends
- 15.7 Energy Efficiency and Resource Management
- 15.8 Sustainability, Recycling and Circularity
- 15.9 Technology Roadmap, 2025-2035
- 15.10 Risks of Obsolescence and Technology Substitution
Chapter 16 Global Green Ammonia Market Key Strategic Imperatives
- 16.1 Growth and Market Entry Priorities
- 16.2 High-Return Products and Segments
- 16.3 Pricing, Profitability and Cost Optimization
- 16.4 Technology Investment and Product Differentiation
- 16.5 Supply Chain Localization and Resilience
- 16.6 Distribution and Customer Acquisition
- 16.7 Partnership, Acquisition and Capacity Strategy
- 16.8 Regional Expansion Priorities
- 16.9 Short-, Medium- and Long-Term Actions
Chapter 17 Competition Outlook
- 17.1 Industry Competition Characteristics
- 17.2 Market Structure and Concentration
- 17.3 Market Share and Competitive Positioning, 2025
- 17.4 Company-Wise Revenue and Product Benchmarking
- 17.5 Production and Service Capacity Benchmarking
- 17.6 Technology, Pricing and Differentiation
- 17.7 Regional Footprint and Distribution Strength
- 17.8 Mergers, Acquisitions and Strategic Alliances
- 17.9 New Entrants and Competitive Threats
- 17.10 Porter's Five Forces and Industry Attractiveness
- 17.11 Competitive Outlook, 2025-2035
Chapter 18 Company Profiles
- 18.1 Company Coverage and Selection Criteria
- 18.2 Envision Energy
- 18.2.1 Business Description
- 18.2.2 Company Ownership and Geographic Presence
- 18.2.3 Product and Service Portfolio
- 18.2.4 Manufacturing and Operating Footprint
- 18.2.5 Production Capacity and Expansion Plans
- 18.2.6 Financial Performance and Investment
- 18.2.7 Market Share and Competitive Position
- 18.2.8 Technology and Innovation Capabilities
- 18.2.9 Strategic Alliances or Partnerships
- 18.2.10 Recent Developments
- 18.2.11 Growth Strategy and Outlook
- 18.3 State Power Investment Corporation
- 18.4 China Energy Engineering
- 18.5 NEOM Green Hydrogen Company
- 18.6 Air Products
- 18.7 AM Green
- 18.8 ACME Group
- 18.9 Yara International
- 18.10 Iberdrola
- 18.11 Fertiberia
- 18.12 Hy2gen
- 18.13 Fortescue
- 18.14 Other Relevant Market Participants
Note: Every listed company is profiled on the structure shown under the first company. The company list is preliminary and may change based on research findings, market developments, data availability and client requirements.
Chapter 19 Disclaimer
- 19.1 Research and Forecast Disclaimer
- 19.2 Data Source and Estimation Limitations
Note: The depth of individual sections depends on data availability for this market. Volume, capacity, trade and other unit-based metrics are included where applicable.

