Market Overview
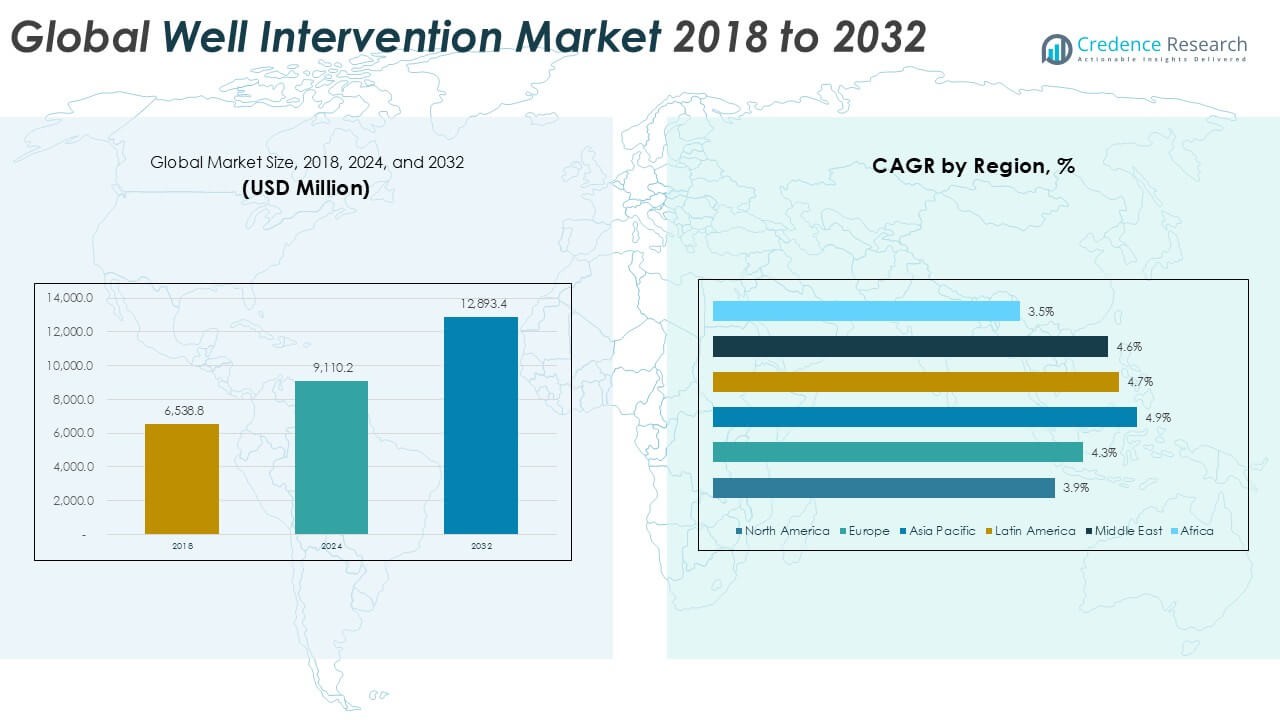
Global Well Intervention market size was valued at USD 6,538.8 million in 2018, reaching USD 9,110.2 million in 2024, and is anticipated to reach USD 12,893.4 million by 2032, at a CAGR of 4.37% during the forecast period.
| REPORT ATTRIBUTE |
DETAILS |
| Historical Period |
2020-2023 |
| Base Year |
2024 |
| Forecast Period |
2025-2032 |
| Well Intervention Market Size 2024 |
USD 9,110.2 Million |
| Well Intervention Market, CAGR |
4.37% |
| Well Intervention Market Size 2032 |
USD 12,893.4 Million |
The global well intervention market is dominated by established oilfield service leaders such as Halliburton, SLB, Baker Hughes, and Weatherford, who maintain strong positions through broad service portfolios and global operations. These players leverage advanced intervention technologies, digital monitoring, and integrated solutions to serve both onshore and offshore wells. Regional and niche companies, including Expro Group, Helix Energy, and AKOFS Offshore, strengthen competition by specializing in subsea and deepwater interventions. From a regional perspective, North America led the market in 2024 with a 33.1% share, followed by Asia Pacific with 26.9% and Europe with 22%. This regional concentration highlights the dominance of mature oilfields in North America and rising offshore exploration in Asia Pacific and Europe, shaping the competitive dynamics globally.
Access crucial information at unmatched prices!
Request your sample report today & start making informed decisions powered by Credence Research Inc.!
Download Sample
Market Insights
- The global well intervention market was valued at USD 9,110.2 million in 2024 and is projected to reach USD 12,893.4 million by 2032, growing at a CAGR of 4.37%.
- Market growth is driven by the rising need for stimulation and artificial lift services in mature oilfields, particularly across North America, the Middle East, and Russia.
- A key trend is the rapid adoption of digital intervention tools, such as real-time monitoring and AI-driven predictive analytics, which improve efficiency and reduce downtime.
- The competitive landscape is led by Halliburton, SLB, Baker Hughes, and Weatherford, supported by regional players like Expro Group and Helix Energy, focusing on deepwater and subsea operations.
- Regionally, North America led with a 33.1% share in 2024, followed by Asia Pacific at 26.9% and Europe at 22%, while Latin America, the Middle East, and Africa contributed smaller but steadily growing shares.
Market Segmentation Analysis:
By Services
In the global well intervention market, stimulation services accounted for the dominant share, representing more than 25% of total revenue in 2024. Stimulation remains critical for enhancing well productivity and extending operational lifespan, especially in mature oilfields across North America and the Middle East. Rising demand for acidizing and hydraulic fracturing techniques further supports growth. Other service segments, including remedial cementing, sand control, and artificial lift, are witnessing steady adoption due to the need for well integrity, improved recovery, and optimized production in both conventional and unconventional reserves.
- For instance, in 2023, SLB (formerly Schlumberger) expanded its stimulation activities in strategic markets, including U.S. shale basins and Middle Eastern oilfields, to enhance recovery rates for clients.
By Type
Light intervention held the largest share of the well intervention market in 2024, contributing over 40% of global revenue. Its dominance stems from cost-efficiency and minimal equipment requirements, making it highly suitable for routine well maintenance and production enhancement. Light interventions are increasingly applied in offshore shallow water assets where operators prioritize lower operating costs. Medium and heavy interventions, although smaller in share, are gaining traction in deepwater and complex well environments where advanced technologies are needed for zonal isolation, re-perforation, and complex repair activities.
- For instance, in 2023, Helix Energy Solutions conducted significant well intervention operations in both the Gulf of Mexico and the North Sea, which included activities focused on improving recovery efficiency and decommissioning end-of-life oil and gas wells. The company’s well intervention segment achieved 88% vessel utilization in 2023, contributing to a strong overall performance for the year.
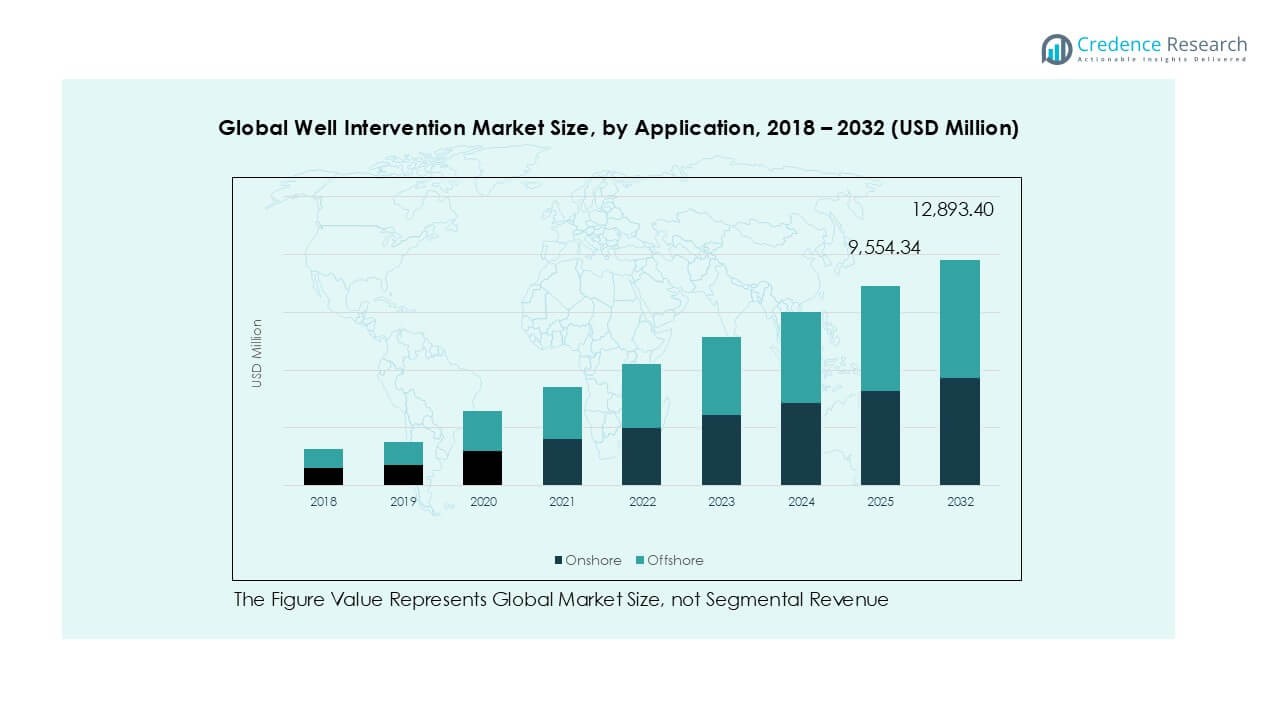
By Application
Onshore applications led the global well intervention market in 2024, holding more than 60% of overall market share. The segment benefits from the high concentration of mature oilfields in North America, Russia, and the Middle East, where intervention activities are vital to maintain production rates. Offshore applications, while smaller in share, are expanding rapidly due to increasing deepwater exploration and production projects, particularly in the Gulf of Mexico and Brazil. Rising investments in offshore rigs and subsea technologies are expected to drive demand for well intervention services in offshore fields over the forecast period.
Key Growth Drivers
Rising Demand from Mature Oilfields
Mature oilfields account for a significant share of global hydrocarbon production, making well intervention services essential to sustain output levels. Declining reservoir productivity in North America, the Middle East, and Russia has accelerated demand for stimulation, remedial cementing, and artificial lift services. Operators increasingly rely on cost-effective interventions to extend the lifespan of wells instead of investing in new drilling projects, which are often capital intensive. This trend aligns with energy companies’ strategies to maximize recovery factors while maintaining operational efficiency. The growing need to manage aging fields and optimize recovery continues to fuel steady growth in well intervention activities across both onshore and offshore environments.
- For instance, in 2023, Halliburton saw strong demand and high activity for its cementing and stimulation services in mature fields across North America and the Middle East, supporting operators in sustaining production from aging wells.
Expansion of Offshore Exploration and Production
The rising investment in offshore oil and gas activities, particularly in deepwater and ultra-deepwater reserves, is driving demand for advanced well intervention services. Offshore reservoirs, especially in the Gulf of Mexico, Brazil, and West Africa, require complex intervention techniques such as heavy intervention, zonal isolation, and fishing services. Increasing offshore capital expenditure by key oil companies reflects a long-term commitment to tapping challenging reserves. Moreover, advancements in subsea technology and remotely operated vehicles (ROVs) are making offshore well interventions more efficient and safer. With offshore production expected to contribute a rising share of global oil supply, demand for intervention services will continue to expand significantly in the coming years.
- For instance, in 2023, Helix Energy Solutions utilized its subsea intervention vessels and ROV technology to support deepwater production and decommissioning projects in multiple regions, including the Gulf of Mexico and Brazil. In Brazil, the company deployed its two Siem Helixvessels on long-term contracts. In the Gulf of Mexico, Helix completed a significant full-field decommissioning contract in the shallow water shelf region, which included the plugging and abandonment of 39 wells.
Technological Advancements in Well Intervention Techniques
Innovation in well intervention technologies, including real-time digital monitoring, coiled tubing systems, and advanced hydraulic fracturing solutions, is transforming the market. Operators are deploying automated tools, downhole sensors, and smart analytics to enhance precision and reduce downtime. Digitalization and remote monitoring not only lower costs but also improve operational safety and efficiency, particularly in high-risk offshore wells. New-generation artificial lift systems and sand control technologies further enhance recovery rates while minimizing environmental impacts. The integration of robotics and predictive maintenance models provides a competitive advantage for operators seeking to reduce non-productive time. These advancements are positioning technology-driven services as a critical growth enabler for the global well intervention market.
Key Trends & Opportunities
Growing Adoption of Digital Well Intervention Solutions
Digital transformation is emerging as a significant trend in the well intervention industry. Oilfield service providers are increasingly adopting cloud-based platforms, digital twins, and AI-driven predictive models to monitor well conditions in real time. These solutions enable operators to identify potential failures early, optimize intervention strategies, and reduce downtime. Remote operations also limit human exposure to hazardous environments, enhancing worker safety. With rising emphasis on operational efficiency and cost control, digital well intervention services present a lucrative opportunity for service providers. This trend is expected to expand further as oil and gas companies continue to embrace Industry 4.0 technologies.
- For instance, Baker Hughes deployed over 1,200 digital twin models in 2023 to support well monitoring and intervention optimization, helping operators cut intervention-related downtime by up to 20% across global assets.
Increasing Focus on Sustainable Intervention Practices
Sustainability concerns are shaping the future of well intervention, with operators exploring low-emission solutions and eco-friendly stimulation methods. The transition toward reducing carbon intensity is prompting companies to develop energy-efficient intervention equipment and techniques. Opportunities are emerging in the use of water-based fluids, reduced chemical additives, and technologies that minimize methane emissions during interventions. In addition, regulatory pressures in Europe and North America are encouraging adoption of environmentally responsible practices. Companies that can deliver interventions aligned with ESG (Environmental, Social, and Governance) goals are likely to gain stronger market positioning and long-term growth opportunities.
Key Challenges
Volatility in Oil Prices
Fluctuating crude oil prices remain one of the biggest challenges for the well intervention market. Uncertainty in global oil demand, influenced by geopolitical tensions and energy transition policies, directly affects exploration and production investments. When prices decline, operators often delay or scale back intervention projects, particularly in offshore and deepwater fields where costs are higher. This cyclic dependency creates revenue instability for service providers and complicates long-term planning. Sustained price volatility continues to pose a major restraint, making the market highly sensitive to global macroeconomic and political shifts.
High Operational and Safety Risks
Well intervention activities, particularly in deepwater and ultra-deepwater environments, involve significant technical and safety challenges. Operations such as heavy intervention, fishing, and re-perforation require specialized equipment and skilled personnel, leading to high costs and operational complexity. Risks include blowouts, equipment failures, and hazardous exposure for workers, which can cause severe downtime and financial losses. Stricter safety and environmental regulations also increase compliance costs for service providers. Managing these operational risks while ensuring efficiency remains a critical barrier to market growth, especially for smaller service providers with limited resources.
Regional Analysis
North America
North America dominated the global well intervention market in 2024 with a 33.1% share, valued at USD 3,013.66 million. The region grew from USD 2,215.98 million in 2018 and is projected to reach USD 4,125.89 million by 2032 at a CAGR of 3.9%. The market’s growth is driven by the presence of a large number of mature oilfields in the U.S. and Canada, where intervention services are critical to sustain output. Increased shale production and enhanced oil recovery techniques continue to support demand for stimulation and remedial cementing services.
Europe
Europe accounted for 22% of the global market share in 2024, with revenues of USD 2,001.39 million. The market rose from USD 1,445.72 million in 2018 and is forecast to reach USD 2,808.18 million by 2032 at a CAGR of 4.3%. The North Sea remains a key hub for well intervention due to aging offshore fields in the UK and Norway. Growing focus on maximizing output from existing wells and investments in offshore assets are propelling market expansion. Demand for light interventions is particularly strong in mature European fields.
Asia Pacific
Asia Pacific emerged as the fastest-growing regional market, holding 26.9% of global revenue in 2024, valued at USD 2,452.47 million. It grew from USD 1,707.27 million in 2018 and is projected to reach USD 3,610.15 million by 2032, expanding at a CAGR of 4.9%. The growth is fueled by rising offshore exploration in China, India, and Southeast Asia. Increasing intervention activities in deepwater reserves and growing domestic energy demand are creating strong opportunities. Stimulation and artificial lift services are in high demand as countries work to enhance oil recovery from mature fields.
Latin America
Latin America represented 10.9% of the global market share in 2024, with revenues of USD 999.65 million. The market increased from USD 704.88 million in 2018 and is expected to reach USD 1,447.93 million by 2032, at a CAGR of 4.7%. Brazil’s deepwater and ultra-deepwater reserves remain a primary growth driver, supported by investments in subsea intervention technologies. Mexico’s reforms and new offshore developments are also boosting service demand. Regional operators focus heavily on fishing and heavy interventions due to complex offshore well structures, supporting consistent market growth in the forecast period.
Middle East
The Middle East accounted for 4.8% of the global share in 2024, valued at USD 440.15 million. The market grew from USD 312.55 million in 2018 and is forecast to reach USD 631.78 million by 2032 at a CAGR of 4.6%. Intervention services are vital in maintaining high production levels across the region’s giant oilfields. Saudi Arabia, UAE, and Kuwait lead investments in artificial lift, zonal isolation, and stimulation services to maximize well efficiency. Ongoing national energy expansion strategies and efforts to optimize reservoir recovery continue to sustain strong demand for interventions.
Africa
Africa contributed 3.1% of the global well intervention market in 2024, reaching USD 202.90 million. It expanded from USD 152.35 million in 2018 and is expected to reach USD 269.47 million by 2032 at a CAGR of 3.5%. Growth is primarily concentrated in Nigeria, Angola, and Algeria, where aging onshore and offshore wells require frequent interventions. Despite challenges from political instability and operational risks, rising offshore exploration in West Africa is fueling demand. Stimulation and remedial cementing services are particularly sought after to improve productivity and extend well lifespans across the region.
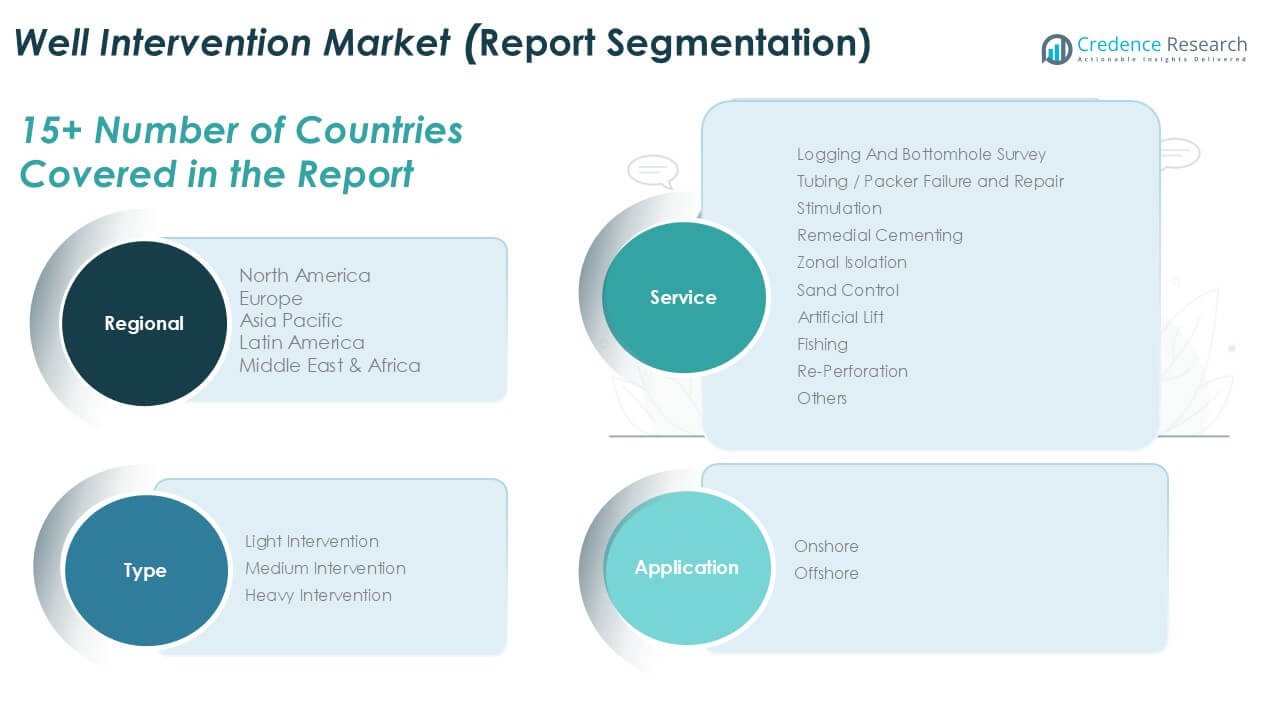
Market Segmentations:
By Services
- Logging and Bottomhole Survey
- Tubing / Packer Failure and Repair
- Stimulation
- Remedial Cementing
- Zonal Isolation
- Sand Control
- Artificial Lift
- Fishing
- Re-Perforation
- Others
By Type
- Light Intervention
- Medium Intervention
- Heavy Intervention
By Application
By Geography
- North America
- Europe
- Germany
- France
- U.K.
- Italy
- Spain
- Rest of Europe
- Asia Pacific
- China
- Japan
- India
- South Korea
- South-east Asia
- Rest of Asia Pacific
- Latin America
- Brazil
- Argentina
- Rest of Latin America
- Middle East & Africa
- GCC Countries
- South Africa
- Rest of the Middle East and Africa
Competitive Landscape
The global well intervention market is highly competitive, shaped by the presence of multinational oilfield service companies and specialized regional players. Major companies such as Halliburton, SLB, Baker Hughes, and Weatherford dominate with extensive service portfolios, global networks, and advanced intervention technologies. They focus on integrated solutions covering stimulation, artificial lift, and heavy interventions, catering to both onshore and offshore operations. Niche players like Expro Group, Helix Energy, and AKOFS Offshore strengthen the market with expertise in subsea and offshore segments, particularly in deepwater applications. Continuous investment in digital well monitoring, robotics, and eco-friendly intervention practices is driving differentiation among leading providers. Strategic partnerships, mergers, and regional expansions remain central to growth strategies, as companies aim to secure long-term contracts with national and independent oil companies. This competitive landscape is defined by technology innovation, operational efficiency, and adaptability to volatile oil prices and regulatory demands.
Shape Your Report to Specific Countries or Regions & Enjoy 30% Off!
Key Player Analysis
- Halliburton
- SLB
- Baker Hughes
- Weatherford
- Expro Group
- Key Energy Services
- AKOFS Offshore
- Helix Energy
- Oceaneering International, Inc.
- Hunting PLC
- Deepwell AS
- Other Key Players
Recent Developments
- In April 2024, SLB launched two artificial lift systems: The Reda Agile compact wide-range electric submersible pump (ESP) system and the rodless Reda PowerEdge. These systems are designed to enhance performance and operating range in oil and gas production operations. The introduction of these advanced technologies demonstrates SLB’s commitment to innovation and improving efficiency in the industry.
- In February 2024, Baker Hughes secured a substantial contract from Petrobras for integrated well construction services in the Buzios field offshore Brazil. The contract involves a significant award for Baker Hughes to provide comprehensive well construction services, emphasizing its continued presence and growth in the Brazilian offshore market.
- In January 2024, Halliburton introduced the CorrosaLock Cement System to its CCUS portfolio, enhancing CO2 storage infrastructure. The new solution provides corrosion-resistant radial cement sheaths for long-term barrier support, crucial for carbon capture, utilization, and storage initiatives. It comprises a composite of Portland-based cement and Halliburton’s proprietary WellLock resin, offering superior resistance to CO2, reduced permeability, and increased elasticity compared to conventional cement systems. This innovation reinforces Halliburton’s commitment to advancing sustainable energy solutions.
- In July 2023, Weatherford secured a long-term five-year contract with Petrobras for intervention services offshore Brazil. This deal underscores Weatherford’s commitment to providing essential services in the Brazilian offshore market. The agreement signifies a significant milestone in Weatherford’s partnership with Petrobras, highlighting its continued involvement and contribution to the oil and gas industry in the region.
Report Coverage
The research report offers an in-depth analysis based on Services, Type, Application and Geography. It details leading market players, providing an overview of their business, product offerings, investments, revenue streams, and key applications. Additionally, the report includes insights into the competitive environment, SWOT analysis, current market trends, as well as the primary drivers and constraints. Furthermore, it discusses various factors that have driven market expansion in recent years. The report also explores market dynamics, regulatory scenarios, and technological advancements that are shaping the industry. It assesses the impact of external factors and global economic changes on market growth. Lastly, it provides strategic recommendations for new entrants and established companies to navigate the complexities of the market.
Future Outlook
- Demand for well intervention will increase with the rising number of mature oilfields worldwide.
- Offshore exploration growth, especially in deepwater reserves, will boost heavy intervention services.
- Digital technologies such as real-time monitoring and predictive analytics will reshape intervention efficiency.
- Artificial lift and stimulation services will remain crucial to enhance oil recovery rates.
- Sustainability initiatives will push adoption of low-emission and eco-friendly intervention solutions.
- North America will maintain its lead, while Asia Pacific will post the fastest growth rate.
- Service providers will expand subsea and remote-operated technologies to reduce risks in offshore fields.
- Consolidation through mergers and strategic partnerships will strengthen the competitive landscape.
- Regulatory compliance and safety standards will drive investments in advanced intervention tools.
- Volatility in oil prices will continue to influence investment patterns and project timelines.


