
Production Oilfield Services & Equipment Market Overview:
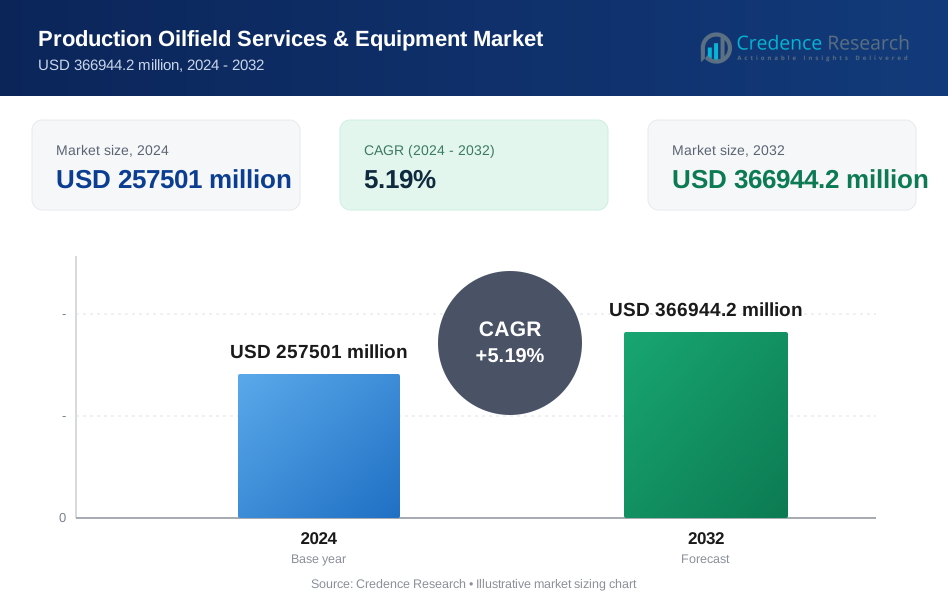
The Production Oilfield Services & Equipment market reached USD 257501 million in 2025. The market is projected to grow to USD 366944.2 million by 2032, driven by a CAGR of 5.19% during the forecast period.
| REPORT ATTRIBUTE | DETAILS |
|---|---|
| Historical Period | 2021-2024 |
| Base Year | 2025 |
| Forecast Period | 2026-2032 |
| Production Oilfield Services & Equipment Market Size 2025 | USD 257501 million |
| Production Oilfield Services & Equipment Market, CAGR | 5.19% |
| Production Oilfield Services & Equipment Market Size 2032 | USD 366944.2 million |
Production Oilfield Services & Equipment Market Insights
- Demand rises as operators focus on production optimization and enhanced oil recovery, with production services leading the segment at 42% due to strong requirements in mature fields and rising well maintenance activity.
- Key trends include greater adoption of digital monitoring, automation technology, and high-efficiency pumps, improving production stability and extending asset life across onshore and offshore environments.
- Leading companies such as Schlumberger, Halliburton, Baker Hughes, and Weatherford compete through technology upgrades, advanced lift solutions, and corrosion-resistant equipment designs, while price volatility and operational risk restrain long-term investment plans.
- North America holds a 36% regional share, supported by shale growth and strong infrastructure, followed by Europe at 25% through offshore expansion and Asia Pacific at 23% through field modernization and rising energy demand.
Production Oilfield Services & Equipment Market Segmentation Analysis:
By Service Type
Production services lead the service type segment with a market share of 42%, driven by rising demand for enhanced oil recovery, artificial lift systems, and ongoing well maintenance. Operators depend on continuous production optimization to improve output efficiency and reduce downtime, especially in mature fields. Workover and completion activities follow, supported by increasing well rehabilitation needs and expansion of horizontal drilling programs. Well intervention services benefit from real-time monitoring and digital diagnostics that improve decision-making accuracy. The segment continues to expand as energy producers prioritize long-term asset performance, service reliability, and operational cost reduction across diverse reservoir conditions.
- For instance, Schlumberger’s Delfi digital platform helped optimize lift performance across 88 wells in 2023, lifting output by 7,500 barrels per day through real-time analytics.
By Equipment Type
Pumps hold the largest equipment share at 39%, reflecting strong utilization across artificial lift, fluid handling, and production support processes. Growing investment in electric submersible pumps and progressive cavity systems strengthens demand, especially in fields requiring high flow rates and long production cycles. Valves and separators follow due to increased focus on pressure control, flow regulation, and multiphase fluid management. Equipment reliability and corrosion resistance remain critical purchase drivers. Advances in digital asset monitoring and automated control systems enhance equipment lifespan and reduce service disruptions. These factors continue to support strong spending on high-performance production equipment.
- For instance, Baker Hughes set a field record with its 1,800-horsepower ESP system in Oman during 2023, enabling continuous operation at 12,000 barrels per day.
By Application
Onshore operations dominate the application segment with a market share of 62%, supported by lower production costs, broad field availability, and faster project execution timelines. Growing redevelopment of mature wells and sustained drilling in unconventional reservoirs drive strong equipment and service uptake. Offshore and deepwater applications continue to expand as exploration targets shift toward high-potential reserves. Shallow water environments benefit from improved intervention methods and modular production units that lower operational risk. Overall market growth reflects steady global energy demand, field lifecycle extension, and increased focus on optimizing well productivity and safety across both onshore and offshore environments.
Key Growth Drivers
Increasing Focus on Production Optimization and Recovery Enhancement
Producers continue to invest in advanced production technologies to maximize recovery rates, improve reservoir management, and extend well lifecycles. Demand rises for artificial lift, real-time monitoring, and stimulation services that enhance output consistency and reduce downtime. Mature field redevelopment strengthens service requirements across multiple regions. Operators rely on integrated solutions to lower operating costs and increase production efficiency. These factors support strong investment in production services and performance-driven equipment.
- For instance, NOV installed automated drilling control systems that reduced average drilling cycle times per well.
Rising Development of Unconventional Resources
Growth in shale reservoirs and tight formations drives higher demand for specialized equipment and technical expertise. Producers expand drilling and hydraulic fracturing programs, creating opportunities for pumps, artificial lift systems, and high-pressure control tools. Strong focus on well productivity increases the need for workover and intervention services. Advancements in drilling efficiency and horizontal well design further strengthen service requirements. This trend continues to lift market activity and capital spending.
- For instance, Nabors Industries deployed high-spec AC rigs across U.S. shale basins, supporting extreme measured-depth wells that extended through several kilometers of lateral distance.
Expansion in Offshore and Deepwater Production Activities
Offshore project reinstatements and new deepwater field developments create sustained demand for high-strength equipment and integrated production support services. Operators focus on safe, reliable, and high-output solutions suited to harsh marine conditions. Growth in subsea systems, corrosion control, and flow assurance technologies drives long-term investments. Improved project economics and rising energy security goals reinforce offshore development momentum. These factors support stable market expansion across marine environments.
Key Trends & Opportunities
Integration of Digital and Analytics-Based Production Systems
Producers increasingly adopt digital sensors, automated control platforms, and predictive maintenance tools to improve efficiency and reduce downtime. Real-time data collection enhances reservoir decision-making and asset integrity. Remote operations enable faster troubleshooting and lower workforce requirements on site. These advancements offer strong opportunities for service providers and equipment manufacturers to expand value-added offerings. Adoption of analytics platforms continues to increase across mature fields and high-volume reservoirs.
- For instance, ConocoPhillips used automated well analytics to optimize 1,400 horizontal wells in 2023, improving production output by 19,000 barrels per day through reduced deferment.
Shift Toward Low-Emission and Energy-Efficient Equipment
The industry shows strong interest in cleaner production solutions that lower energy use and reduce emissions. Manufacturers introduce electric-driven lift systems, high-efficiency pumps, and advanced separation units designed to optimize field performance. Operators explore carbon reduction pathways, including equipment electrification and improved fluid management practices. These developments open opportunities for suppliers offering sustainable and compliance-driven product lines. The trend supports long-term modernization across global production networks.
- For instance, TechnipFMC has deployed subsea all-electric production systems that eliminate hydraulic fluid discharge and significantly reduce offshore platform emissions.
Key Challenges
Volatility in Crude Oil Prices
Price fluctuations influence investment decisions, project timelines, and capital spending across global production fields. Declining oil prices reduce budgets for drilling, workover, and well service programs, delaying equipment upgrades and maintenance schedules. Market uncertainty affects supplier profitability and inventory planning. Operators often prioritize cost efficiency, increasing competition and pricing pressure among service providers. Sustained volatility may limit long-term commitments and weaken equipment demand cycles.
Operational Risks and Field Infrastructure Complexity
Production equipment operates under high pressure, corrosive conditions, and varying flow environments, increasing risk of mechanical failure and unplanned downtime. Offshore fields add logistical challenges, high safety requirements, and strict regulatory standards. Procurement delays and supply chain constraints can disrupt project execution and maintenance planning. Reliability concerns drive significant cost exposure for operators. These factors present ongoing challenges to ensuring consistent field productivity and asset performance.
Regional Analysis
North America
North America leads the Production Oilfield Services & Equipment market with a market share of 36%, supported by strong drilling activity, shale field expansion, and investment in enhanced recovery solutions. The United States drives regional performance with sustained production in the Permian Basin, Bakken, and Eagle Ford. Increasing use of artificial lift systems, high-capacity pumps, and digital production controls strengthens equipment demand. Canada contributes through redevelopment of mature wells and ongoing oil sands activity. Service providers benefit from well intervention demand and rising focus on production efficiency. These factors help maintain the region’s dominant position.
Europe
Europe holds a market share of 25%, driven by extensive offshore activity in the North Sea and continued investment in field redevelopment. Operators prioritize equipment reliability and intervention services to sustain reservoir output and meet energy security goals. Norway and the United Kingdom lead regional demand, supported by subsea production developments and well extension programs. Strong emphasis on low-emission technologies and digital asset management improves operational efficiency. Growing interest in deepwater fields and brownfield optimization further supports service and equipment adoption. The region’s long-established infrastructure continues to reinforce its market share.
Asia Pacific
Asia Pacific accounts for a market share of 23%, driven by expanding offshore and onshore activity across China, India, Australia, and Southeast Asia. Increased investment in artificial lift systems, valves, and separator units supports rising production volumes. National oil companies play a major role in field development and service deployment. Offshore projects in Malaysia and Indonesia contribute to stronger equipment spending. The region benefits from growing energy demand, operational upgrades, and field modernization programs. Rising interest in shale development and enhanced recovery techniques supports long-term market growth across Asia Pacific.
Latin America and Middle East & Africa
Latin America and Middle East & Africa collectively hold a market share of 16%, supported by rising field activity, large offshore reserves, and steady project advancement. Brazil and Mexico drive Latin American demand through deepwater development and expanded well intervention services. In the Middle East, strong production output in Saudi Arabia, the UAE, and Qatar supports long-term equipment and service requirements. Africa contributes through offshore growth in Angola and Nigeria. Regional investment emphasizes production sustainability and infrastructure development. These factors continue to support increasing demand for production-focused services and equipment.
Production Oilfield Services & Equipment Market Segmentations:
By Service Type
- Production Services
- Workover and Completion
- Well Intervention
- Others
By Equipment Type
- Pumps
- Valves
- Separators
- Others
By Application
- Onshore
- Offshore
- Shallow Water
- Deepwater
By Geography
- North America
- U.S.
- Canada
- Mexico
- Europe
- Germany
- France
- U.K.
- Italy
- Spain
- Rest of Europe
- Asia Pacific
- China
- Japan
- India
- South Korea
- South-east Asia
- Rest of Asia Pacific
- Latin America
- Brazil
- Argentina
- Rest of Latin America
- Middle East & Africa
- GCC Countries
- South Africa
- Rest of the Middle East and Africa
Competitive Landscape
Competitive landscape in the Production Oilfield Services & Equipment market features leading companies such as Schlumberger, Halliburton, Baker Hughes, Weatherford, NOV, and TechnipFMC, supported by strong portfolios in production optimization, well intervention, and advanced equipment manufacturing. These companies invest in digital production tools, high-strength pumps, and corrosion-resistant systems to improve output reliability and reduce operating costs. Demand for artificial lift, valves, and separator units drives continued product innovation and service expansion. Regional service firms and equipment specialists increase competition with tailored field solutions and competitive pricing models. Market growth also benefits from offshore project reinstatements and unconventional resource development, creating new opportunities for service contracts and equipment deployment. Companies strengthen customer engagement through integrated service models, asset performance analytics, and field maintenance programs. Rising focus on ESG compliance, energy efficiency, and emissions control continues to shape strategic investment priorities across global operations.
Key Player Analysis
- Schlumberger Limited
- Halliburton Company
- Baker Hughes Company
- Weatherford International plc
- NOV Inc.
- TechnipFMC plc
- Tenaris S.A.
- Vallourec S.A.
- Nabors Industries Ltd.
- Apergy Corporation
Recent Developments
- In September 2025, Nabors Industries Ltd. announced a multi-year contract with Caturus Energy for the deployment of its next-generation PACE-X Ultra X33 rig.
- In July 2025, Schlumberger Limited agreed with Canada’s Competition Bureau to divest a subsidiary and license IP to resolve competition concerns linked to its ChampionX acquisition.
Report Coverage
The research report offers an in-depth analysis based on Service Type, Equipment Type, Application and Geography. It details leading market players, providing an overview of their business, product offerings, investments, revenue streams, and key applications. Additionally, the report includes insights into the competitive environment, SWOT analysis, current market trends, as well as the primary drivers and constraints. Furthermore, it discusses various factors that have driven market expansion in recent years. The report also explores market dynamics, regulatory scenarios, and technological advancements that are shaping the industry. It assesses the impact of external factors and global economic changes on market growth. Lastly, it provides strategic recommendations for new entrants and established companies to navigate the complexities of the market.
Future Outlook
- Demand will grow as operators increase focus on production efficiency and recovery rates.
- Digital monitoring and automation will improve real-time field control and asset performance.
- Offshore and deepwater developments will support long-term service and equipment demand.
- Artificial lift, pump systems, and separator technology will gain higher adoption.
- Mature field redevelopment will create opportunities for well intervention and workover services.
- Energy operators will invest more in emissions control and low-impact production solutions.
- Supply chain expansion will support faster delivery and field maintenance response.
- Advanced corrosion-resistant materials will extend equipment lifespan and reduce downtime.
- Regional companies will gain presence through cost-effective field solutions and service specialization.
- Integration of predictive analytics and AI will enhance planning accuracy and production outcomes.
Request a Free Sample
Fill in your details and we'll send you a free sample report.
- Sample data tables & charts
- Research methodology
Need a Custom Version of This Report?
Tailor the scope, geography, or segments to your exact requirements.
- Custom geography or segment scope
- Direct access to our analyst team
Frequently Asked Questions
What is the current market size for the Production Oilfield Services & Equipment market, and what is its projected size in 2032?
At what Compound Annual Growth Rate is the Production Oilfield Services & Equipment market projected to grow between 2024 and 2032?
Which Production Oilfield Services & Equipment market segment held the largest share in 2024?
What are the primary factors fueling the growth of the Production Oilfield Services & Equipment market?
Who are the leading companies in the Production Oilfield Services & Equipment market?
Which region commanded the largest share of the Production Oilfield Services & Equipment market in 2024?
Table of Content
Chapter 1. Report Introduction
- 1.1 Report Description & Purpose
- 1.1.1 Report Title & Market Definition
- 1.1.2 Unique Selling Propositions (USP) & Key Differentiators
- 1.1.3 Value Proposition for Stakeholders
- 1.2 Research Objectives
- 1.2.1 Market Sizing Objectives (Volume & Revenue)
- 1.2.2 Segmentation Objectives
- 1.2.3 Competitive Intelligence Objectives
- 1.2.4 Forecast & Scenario Objectives
- 1.3 Report Scope
- 1.3.1 Production Oilfield Services & Equipment Scope – Types & Subtypes Covered
- 1.3.2 Geographic Scope – Regions & Countries Covered
- 1.3.3 Historical Period, Base Year & Forecast Period (2024; forecast to 2032)
- 1.3.4 Inclusions & Exclusions
- 1.4 HS Code & Classification Framework
- 1.5 Currency, Units & Pricing Basis
- 1.6 Target Stakeholders
- 1.7 Limitations & Assumptions
Chapter 2. Executive Summary
- 2.1 Global Production Oilfield Services & Equipment Market Snapshot
- 2.1.1 Market Size – Historical (2024) & Forecast (2024-2032) (2024: USD 257501 million → 2032: USD 366944.2 million)
- 2.1.2 Volume & Revenue – Global Totals
- 2.1.3 Key Market Highlights – Top Five Facts
- 2.2 Production Oilfield Services & Equipment Market Segmentation Snapshot
- 2.2.1 Market Split by Region – 2024 vs. 2032
- 2.3 Competitive Snapshot
- 2.3.1 Top 10 Players by Revenue Share – 2024
- 2.3.2 Top 10 Players by Volume Share – 2024
- 2.3.3 Recent Strategic Developments (18-Month Summary)
- 2.4 Key Investment Highlights & Strategic Conclusions
Chapter 3. Production Oilfield Services & Equipment Market Dynamics & Industry Analysis
- 3.1 Market Overview & Context
- 3.1.1 Production Oilfield Services & Equipment Market Position in the Broader Automotive Value Chain
- 3.1.2 OEM vs. Replacement Market Dynamics
- 3.1.3 Market Maturity & Development Stage by Region
- 3.2 Production Oilfield Services & Equipment Market Drivers
- 3.3 Production Oilfield Services & Equipment Market Restraints & Challenges
- 3.4 Production Oilfield Services & Equipment Market Opportunities
- 3.5 Porter's Five Forces Analysis
- 3.5.1 Threat of New Entrants
- 3.5.2 Bargaining Power of Suppliers
- 3.5.3 Bargaining Power of Buyers
- 3.5.4 Threat of Substitutes
- 3.5.5 Competitive Rivalry – Intensity Assessment
- 3.6 Production Oilfield Services & Equipment Value Chain Analysis
- 3.6.1 Upstream – Raw Material/Input Suppliers
- 3.6.1.1 Raw Material/Input 1
- 3.6.1.2 Raw Material/Input 2
- 3.6.1.3 Raw Material/Input 3
- 3.6.2 Midstream – Production/Manufacturing/Service Delivery
- 3.6.2.1 Production/Process Overview
- 3.6.2.2 Key Facility Locations & Capacity by Manufacturer
- 3.6.3 Downstream – Distribution & End Consumer
- 3.6.3.1 Primary Channel – B2B/OEM
- 3.6.3.2 Secondary Channels – Dealer, Retail, Online, Direct
- 3.6.4 Value Chain Profitability Analysis
- 3.6.1 Upstream – Raw Material/Input Suppliers
- 3.7 PESTEL Analysis
- 3.7.1 Political Factors
- 3.7.2 Economic Factors
- 3.7.3 Social Factors
- 3.7.4 Technological Factors
- 3.7.5 Environmental Factors
- 3.7.6 Legal Factors
- 3.8 Production Oilfield Services & Equipment Supply Chain Analysis
- 3.8.1 Raw Material/Input Supply Risk Assessment
- 3.8.2 Manufacturing Concentration Risk (Geographic Exposure)
- 3.8.3 Trade Disruption Impact Analysis
- 3.9 Regulatory & Policy Landscape
Note: The regulatory and policy landscape section covers regulations based on their applicability to the market, Production Oilfield Services & Equipment category, geography, and scope of the study. Only regulatory frameworks with a material impact on operations, compliance, trade, sustainability, or market access are analyzed in detail.
Chapter 4. Key Investment Pockets & Opportunity Analysis
- 4.1 Production Oilfield Services & Equipment Market Attractiveness Analysis
- 4.1.1 By Region – Investment Attractiveness Matrix (Volume × CAGR)
- 4.2 Absolute Revenue Growth Opportunity
- 4.2.1 By Region – Absolute USD Growth Through 2032
- 4.3 Incremental Volume Opportunity
- 4.3.1 By Region – Incremental Volume Through 2032
- 4.3.2 Segment – Incremental Volume
- 4.4 Emerging Submarket Opportunity Deep Dive (Subject to Applicability)
- 4.5 Emerging Market Opportunity Scorecards
- 4.5.1 United States
- 4.5.2 Europe
- 4.5.3 Asia
- 4.5.4 Middle East & Africa
Note: Emerging Market Opportunity Scorecards will be included based on relevance and strategic importance. Regions listed are indicative and may vary depending on data availability and market dynamics.
Chapter 5. Production Oilfield Services & Equipment Import-Export Analysis & Trade Flows
- 5.1 Global Trade Overview
- 5.1.1 Global Export Value by Country (2024)
- 5.1.2 Global Export Volume by Country (2024)
- 5.1.3 Global Import Value by Country (2024)
- 5.1.4 Global Import Volume by Country (2024)
- 5.1.5 Net Trade Balance by Country (2024)
- 5.2 Export Analysis – Segment
- 5.2.1 Type 1 (HS Code)
- 5.2.2 Type 2 (HS Code)
- 5.2.3 Type 3 (HS Code)
- 5.2.4 Type 4 (HS Code)
- 5.2.5 Type 5 (HS Code)
- 5.3 Import Analysis – Segment
- 5.3.1 Type 1 (HS Code)
- 5.3.2 Type 2 (HS Code)
- 5.3.3 Type 3 (HS Code)
- 5.3.4 Type 4 (HS Code)
- 5.3.5 Type 5 (HS Code)
- 5.4 Average Unit Trade Prices
- 5.4.1 Average Export Price – Segment & Country
- 5.4.2 Average Import Price – Segment & Source Country
- 5.4.3 Price Trends (2024)
- 5.5 Key Trade Route Analysis
- 5.5.1 Trade Route 1
- 5.5.2 Trade Route 2
- 5.5.3 Trade Route 3
- 5.5.4 Trade Route 4
- 5.5.5 Trade Route 5
- 5.6 Trade Policy Impact Assessment
- 5.6.1 US Anti-Dumping & Section 301 Tariffs
- 5.6.2 EU Customs Union Impact
- 5.6.3 Major Free Trade Agreements
- 5.6.4 USMCA Rules of Origin
Note: Trade policy analysis will be included only where relevant to the Production Oilfield Services & Equipment market.
Chapter 6. Competitive Landscape & Company Benchmarking
- 6.1 Production Oilfield Services & Equipment Market Concentration & Structure
- 6.1.1 Herfindahl-Hirschman Index (HHI) – vs. 2024
- 6.1.2 Tier 1, Tier 2 & Tier 3 Market Structure
- 6.1.3 Global, Regional & Local Player Dynamics
- 6.2 Production Oilfield Services & Equipment Market Share Analysis – 2024
- 6.2.1 Global Revenue Share by Company
- 6.2.2 Global Volume Share by Company
- 6.2.3 Regional Revenue Share
- 6.2.4 Market Share Evolution ( vs. 2024)
- 6.2.5 OEM Segment Share by Company
- 6.2.6 Replacement Segment Share by Company
- 6.3 Production/Delivery Capacity & Facility Analysis
- 6.3.1 Global Installed Capacity
- 6.3.2 Capacity Utilization Rates
- 6.3.3 Production/Output Volume
- 6.3.4 Facility Locations & Capacity Map
- 6.3.5 Planned Capacity Additions
- 6.4 Production Oilfield Services & Equipment Competitive Benchmarking Matrix
- 6.4.1 Revenue, Volume, CAGR & Profitability Comparison
- 6.4.2 Channel Revenue Mix
- 6.4.3 Geographic Revenue Exposure
- 6.4.4 R&D Intensity
- 6.4.5 Sustainability Maturity
- 6.5 Strategic Developments in Production Oilfield Services & Equipment (Last 24 Months)
- 6.5.1 Mergers, Acquisitions & Divestments
- 6.5.2 New Production Oilfield Services & Equipment Launches
- 6.5.3 Facility Expansions
- 6.5.4 Strategic Alliances, Joint Ventures & Partnerships
- 6.5.5 Distribution Expansion & Market Entry
- 6.5.6 Sustainability & ESG Initiatives
- 6.6 Competitive Strategy Mapping
- 6.6.1 Leader, Challenger, Follower & Niche Classification
- 6.6.2 Pricing Strategy Comparison
- 6.6.3 Channel Strategy Matrix
Note: Strategic developments are included based on their materiality and the availability of reliable information.
Chapter 7. Global Production Oilfield Services & Equipment Market – By Distribution Channel
- 7.1 Segment Overview
- 7.1.1 Volume & Revenue Split by Channel (2024 & 2032)
- 7.1.2 Channel Mix Evolution (2024-2032)
Chapter 8. Regional Market Analysis – Global Overview
- 8.1 Global Regional Overview
- 8.1.1 Regional Volume Share
- 8.1.2 Regional Revenue Share
- 8.1.3 Regional Volume by Region
- 8.1.4 Regional Revenue by Region
- 8.1.5 Regional Forecast Through 2032
- 8.2 Cross-Regional Segment Analysis
- 8.2.1 By Distribution Channel
- 8.2.2 By Brand/Price Tier
Chapter 9. North America Production Oilfield Services & Equipment Market
- 9.1 United States
- 9.2 Canada
- 9.3 Mexico
Chapter 10. Europe Production Oilfield Services & Equipment Market
- 10.1 Germany
- 10.2 France
- 10.3 Italy
- 10.4 United Kingdom
- 10.5 Spain
- 10.6 Poland
- 10.7 Russia
- 10.8 Netherlands
- 10.9 Belgium
- 10.10 Sweden
- 10.11 Denmark
- 10.12 Norway
- 10.13 Rest of Europe
Chapter 11. Asia Pacific Production Oilfield Services & Equipment Market
- 11.1 China
- 11.2 India
- 11.3 Japan
- 11.4 South Korea
- 11.5 Thailand
- 11.6 Indonesia
- 11.7 Vietnam
- 11.8 Malaysia
- 11.9 Australia
- 11.10 Rest of Asia Pacific
Chapter 12. Latin America Production Oilfield Services & Equipment Market
- 12.1 Brazil
- 12.2 Argentina
- 12.3 Colombia
- 12.4 Chile
- 12.5 Rest of Latin America
Chapter 13. Middle East Production Oilfield Services & Equipment Market
- 13.1 Saudi Arabia
- 13.2 United Arab Emirates
- 13.3 Turkey
- 13.4 Israel
- 13.5 Iran
- 13.6 Rest of the Middle East
Chapter 14. Africa Production Oilfield Services & Equipment Market
- 14.1 South Africa
- 14.2 Egypt
- 14.3 Nigeria
- 14.4 Morocco
- 14.5 Rest of Africa
Chapter 15. Production Oilfield Services & Equipment Company Profiles
- 15.1 [Company 01]
- 15.1.1 Company Overview
- 15.1.2 Key Management Personnel
- 15.1.3 Products & Services Portfolio
- 15.1.4 Financial Performance
- 15.1.5 Key Market Focus & Geographic Presence
- 15.1.6 Recent Developments & Strategic Initiatives
Note: The company profile list is preliminary and may change based on research findings, market developments, data availability, and client requirements.
Chapter 16. Appendices
- Appendix A – List of Abbreviations & Acronyms
- Appendix B – Industry Classification Code Reference – Full Series
- Appendix C – Production & Capacity Data Tables
- Appendix D – End-Use & Demand Base Tables
- Appendix E – Consumption & Replacement Rate Assumptions
- Appendix F – ASP Reference Tables
- Appendix G – Manufacturing & Facility Database
- Appendix H – Import-Export Data Tables
- Appendix I – Regulatory Summary Tables
- Appendix J – Primary Research Participant List (Anonymized)
- Appendix K – Primary Research Questionnaire Framework
- Appendix L – Data Sources & Bibliography
- Appendix M – Market Size Divergence & Source Comparison
Chapter 17. Research Methodology
- 17.1 Research Framework & Philosophy
- 17.2 Secondary Research – Sources, Hierarchy & Data Extraction
- 17.3 Data Modeling – Bottom-Up & Top-Down Market Sizing
- 17.4 Primary Research – Stakeholder Framework, LOI & Sample Sizes
- 17.5 Forecast Methodology – Regression, Scenario & Sensitivity Analysis
- 17.6 Quality Control – Four-Layer Validation Framework
- 17.7 Limitations & Standard Assumptions
- 17.8 Disclaimer
