
Steel assets in harsh sites keep Australian demand steady
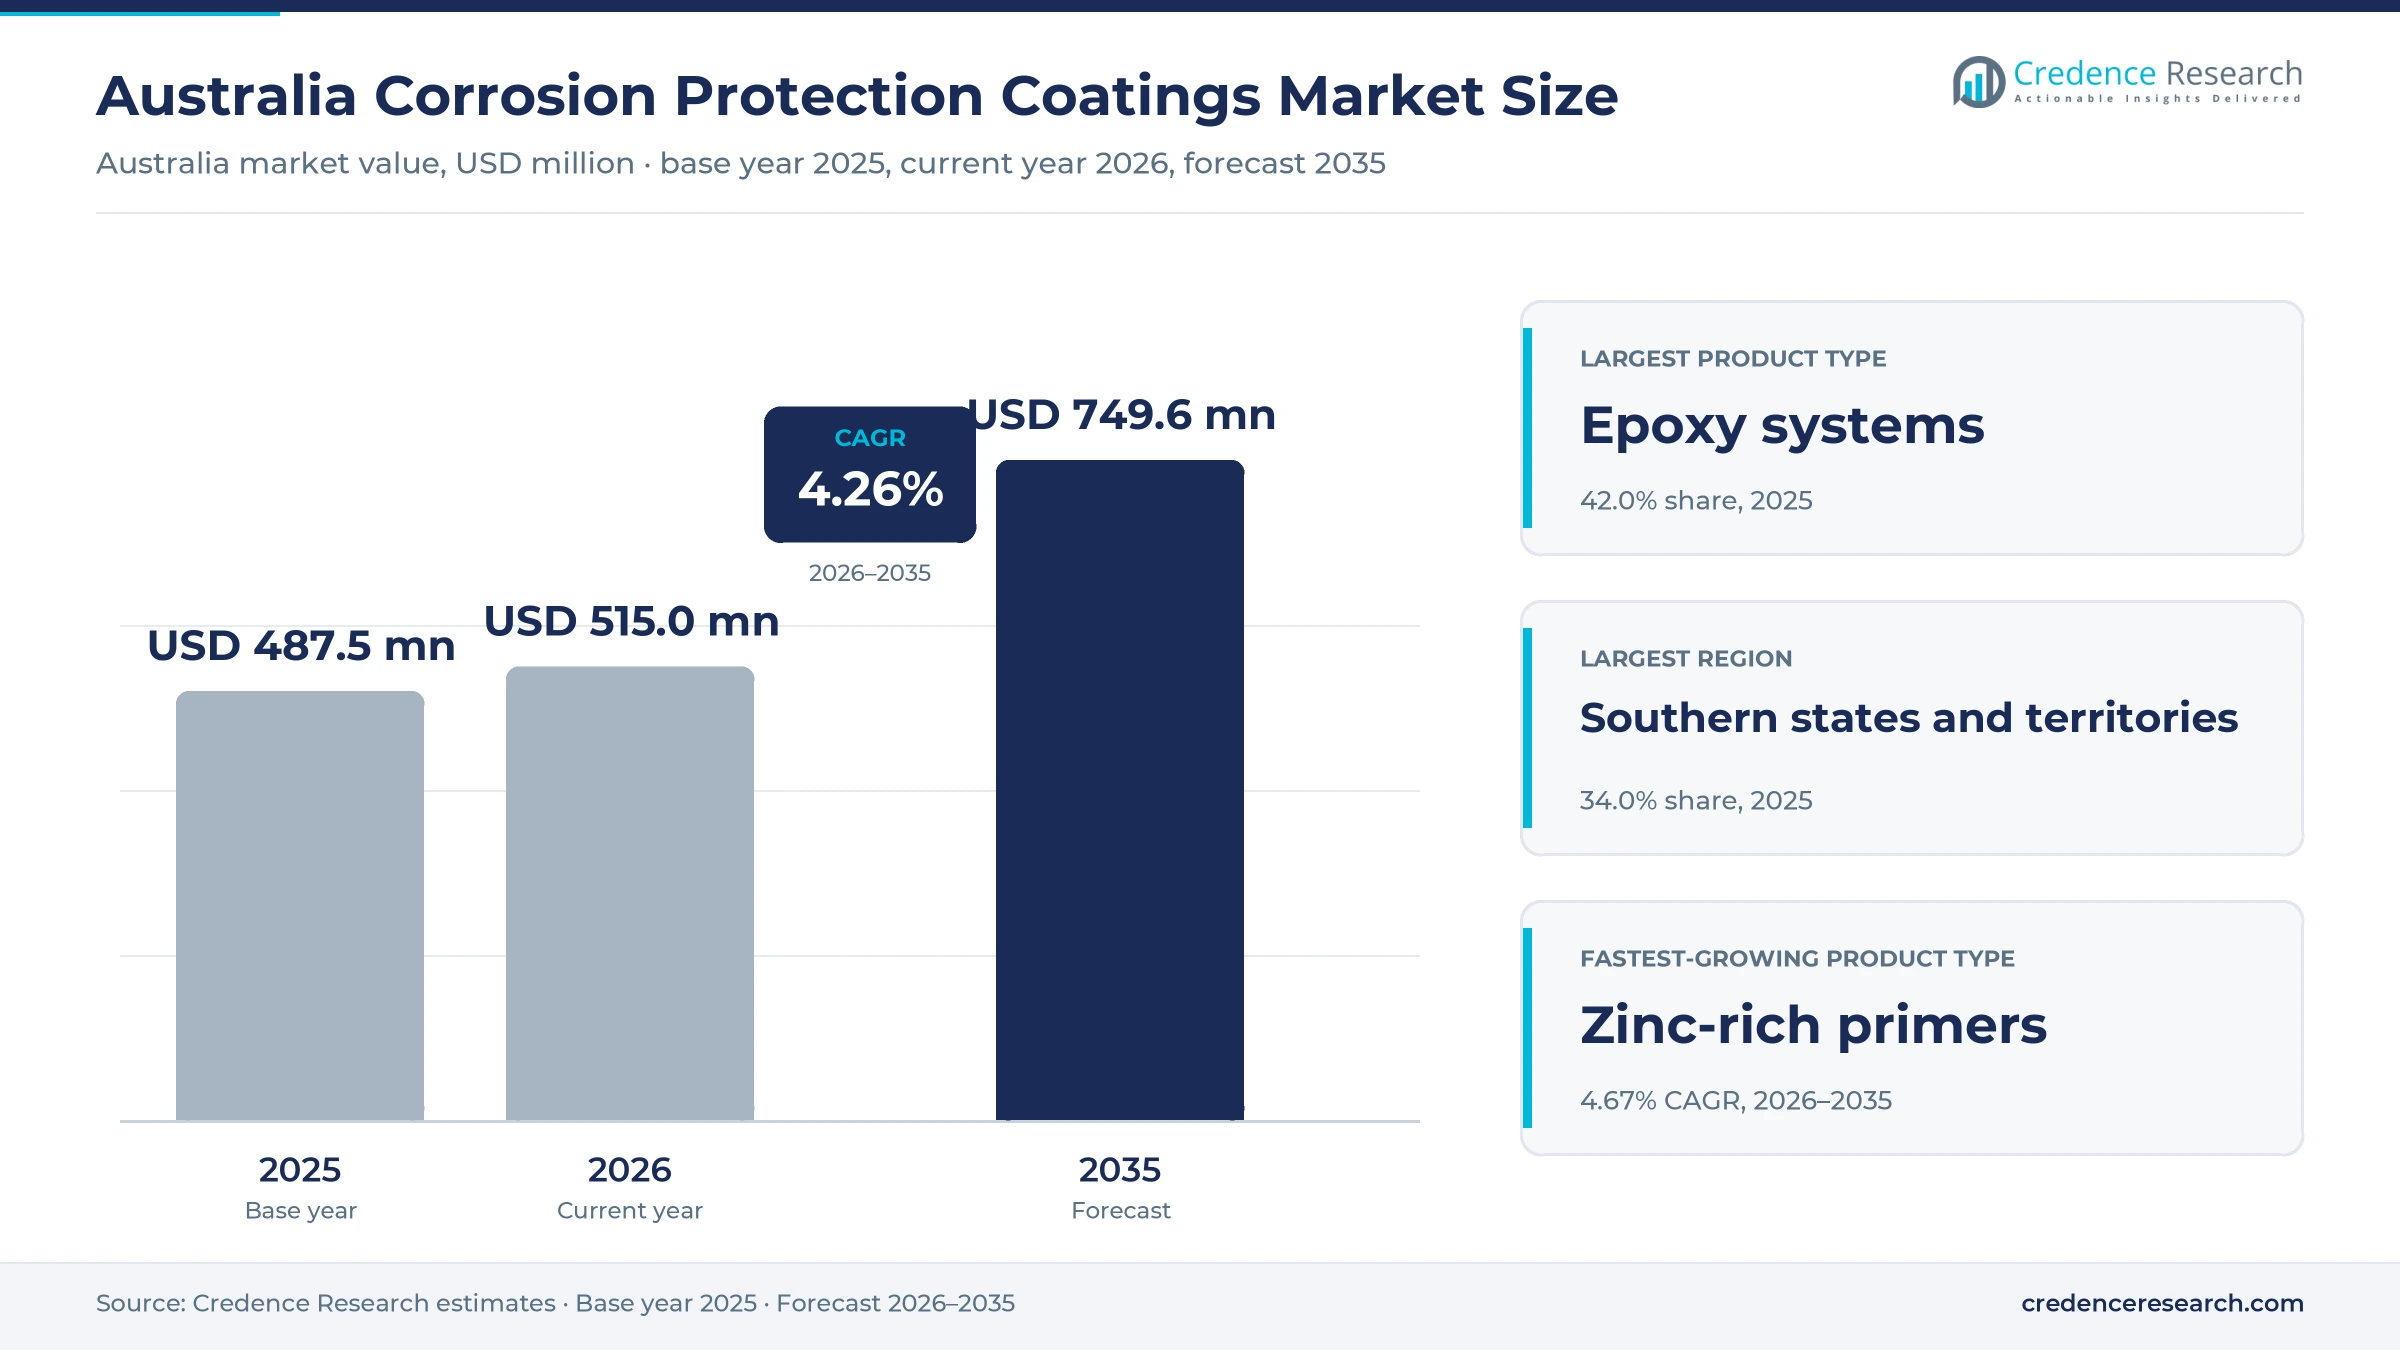
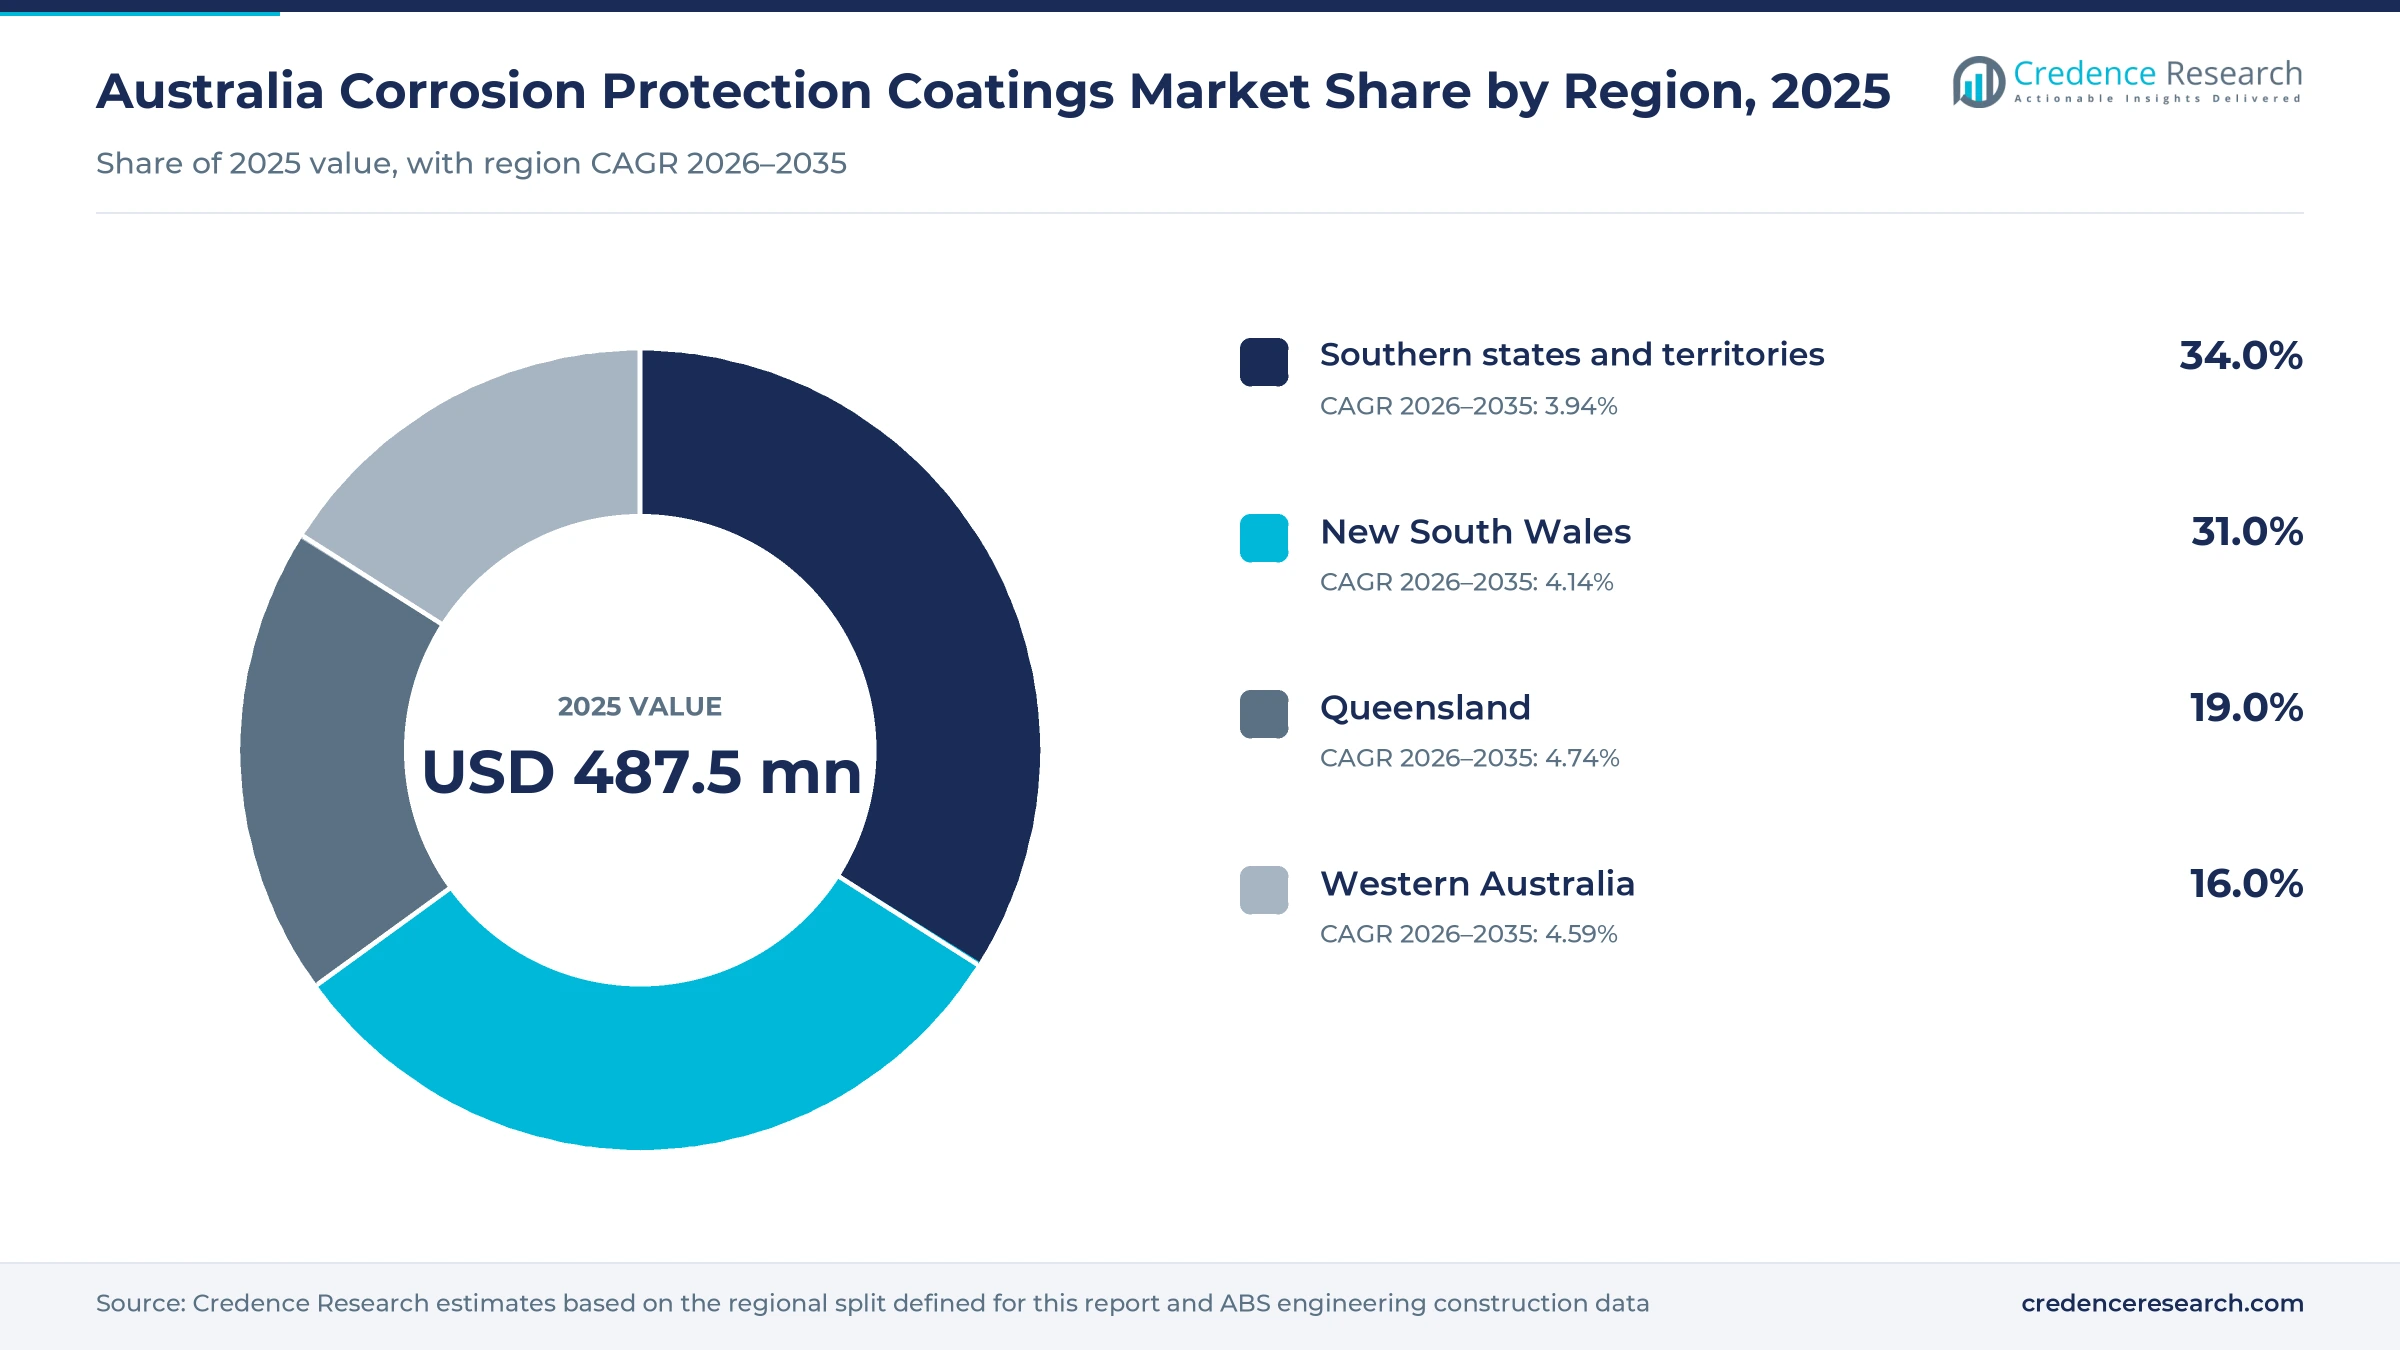
The Australia corrosion protection coatings market was valued at USD 487.5 million in 2025 and is projected to increase from USD 515.0 million in 2026 to USD 749.6 million by 2035, registering a CAGR of 4.26% during 2026–2035. Demand comes from owners of bridges, ports, pipelines, mine plants, tanks and ships that must renew paint systems on fixed cycles, and from fabricators that prime new structural steel for resource, transport and energy projects. The southern states and territories held the largest regional share, 34.0% in 2025, because Victoria and South Australia combine a large stock of aging bridges and plants with major coating factories. Queensland is the fastest-growing region at 4.74% a year, as bridge renewal and transport works there gather pace. In turn, offshore wind licensing, long transmission lines and a new frigate program are pushing buyers toward higher-performance zinc, epoxy and polysiloxane systems with longer service lives.
Which paint systems does the national estimate count?
Spending on liquid and powder paint systems that protect steel and concrete from corrosion in Australia forms the base of this estimate, including epoxy, polyurethane, zinc-rich, alkyd, acrylic and specialty products. It counts systems sold for maintenance and new construction on oil and gas, transport, marine, mining, utility and process assets, in atmospheric and immersion service.
The estimate excludes decorative house paint, hot-dip galvanizing, cathodic protection hardware and application labor. The value chain runs from resin, pigment and zinc dust suppliers to local and imported paint makers, then through direct accounts, industrial distributors and project supply agreements to asset owners, coating contractors, steel fabricators and shipyards.
Australia Corrosion Protection Coatings Market Insights
- The Australia corrosion protection coatings market was valued at USD 487.5 million in 2025 and is projected to reach USD 749.6 million by 2035, registering a CAGR of 4.26% during 2026–2035.
- The southern states and territories held a 34.0% share of 2025 value, because Victoria and South Australia combine aging bridges, plants and major coating factories.
- Epoxy systems led product types with a 42.0% share of 2025 value, because they form the barrier coat in most bridge, tank and plant specifications.
- Infrastructure Australia reported on Nov. 13, 2025, that the five-year major public infrastructure pipeline reached A$242 billion, with transport making up A$129 billion.
- Zinc-rich primers grow fastest among product types at 4.67% a year during 2026–2035, as new steel for energy and transport projects needs galvanic priming.
Epoxy leads while zinc-rich primers grow fastest
Why do epoxy systems hold the largest share?
Based on product type, the market is categorized into Epoxy systems, Polyurethane systems, Zinc-rich primers and Alkyd, acrylic and specialty systems. Epoxy systems led with a 42.0% share of 2025 value, because epoxy forms the barrier coat in most bridge, tank and plant specifications. Zinc-rich primers grow fastest at 4.67% a year, as fabricators apply galvanic zinc primer layers to more new steel for energy and transport projects.
Which industries buy the most protective paint?
Based on end-use industry, the market is categorized into Oil and gas, Transport infrastructure and marine, Mining and Utilities and process industry. Transport infrastructure and marine led with a 33.0% share of 2025 value, because bridges, rail structures, wharves and ships need repeated repainting, a larger pool than factory-applied industrial finishes. Utilities and process industry grows fastest at 4.78% a year, as transmission towers, water assets and offshore wind structures enter service.
Why does atmospheric maintenance lead applications?
Based on application, the market is categorized into Atmospheric maintenance, Immersion maintenance, Atmospheric new construction and Immersion new construction. Atmospheric maintenance led with a 46.0% share of 2025 value, because the installed base of exposed steel is far larger than yearly new builds. Immersion new construction grows fastest at 4.66% a year, as frigate, LNG and offshore projects add hulls, tanks and subsea steel.
How is the technology mix shifting?
Based on technology, the market is categorized into Solvent-based systems, Water-based systems, Powder systems and Solvent-free and specialty systems. Solvent-based systems led with a 52.0% share of 2025 value, because high-build epoxy and zinc grades remain standard for field work in harsh sites. Water-based systems grow fastest at 5.16% a year, as asset owners seek lower solvent emissions on enclosed and urban jobs.
| Segment Group | Leading Sub-segment | Share, 2025 | Fastest-growing Sub-segment | CAGR, 2026–2035 |
|---|---|---|---|---|
| By Product Type | Epoxy systems | 42.0% | Zinc-rich primers | 4.67% |
| By End-Use Industry | Transport infrastructure and marine | 33.0% | Utilities and process industry | 4.78% |
| By Application | Atmospheric maintenance | 46.0% | Immersion new construction | 4.66% |
| By Technology | Solvent-based systems | 52.0% | Water-based systems | 5.16% |
Request a Free Sample
Fill in your details and we'll send you a free sample report.
- Sample data tables & charts
- Research methodology
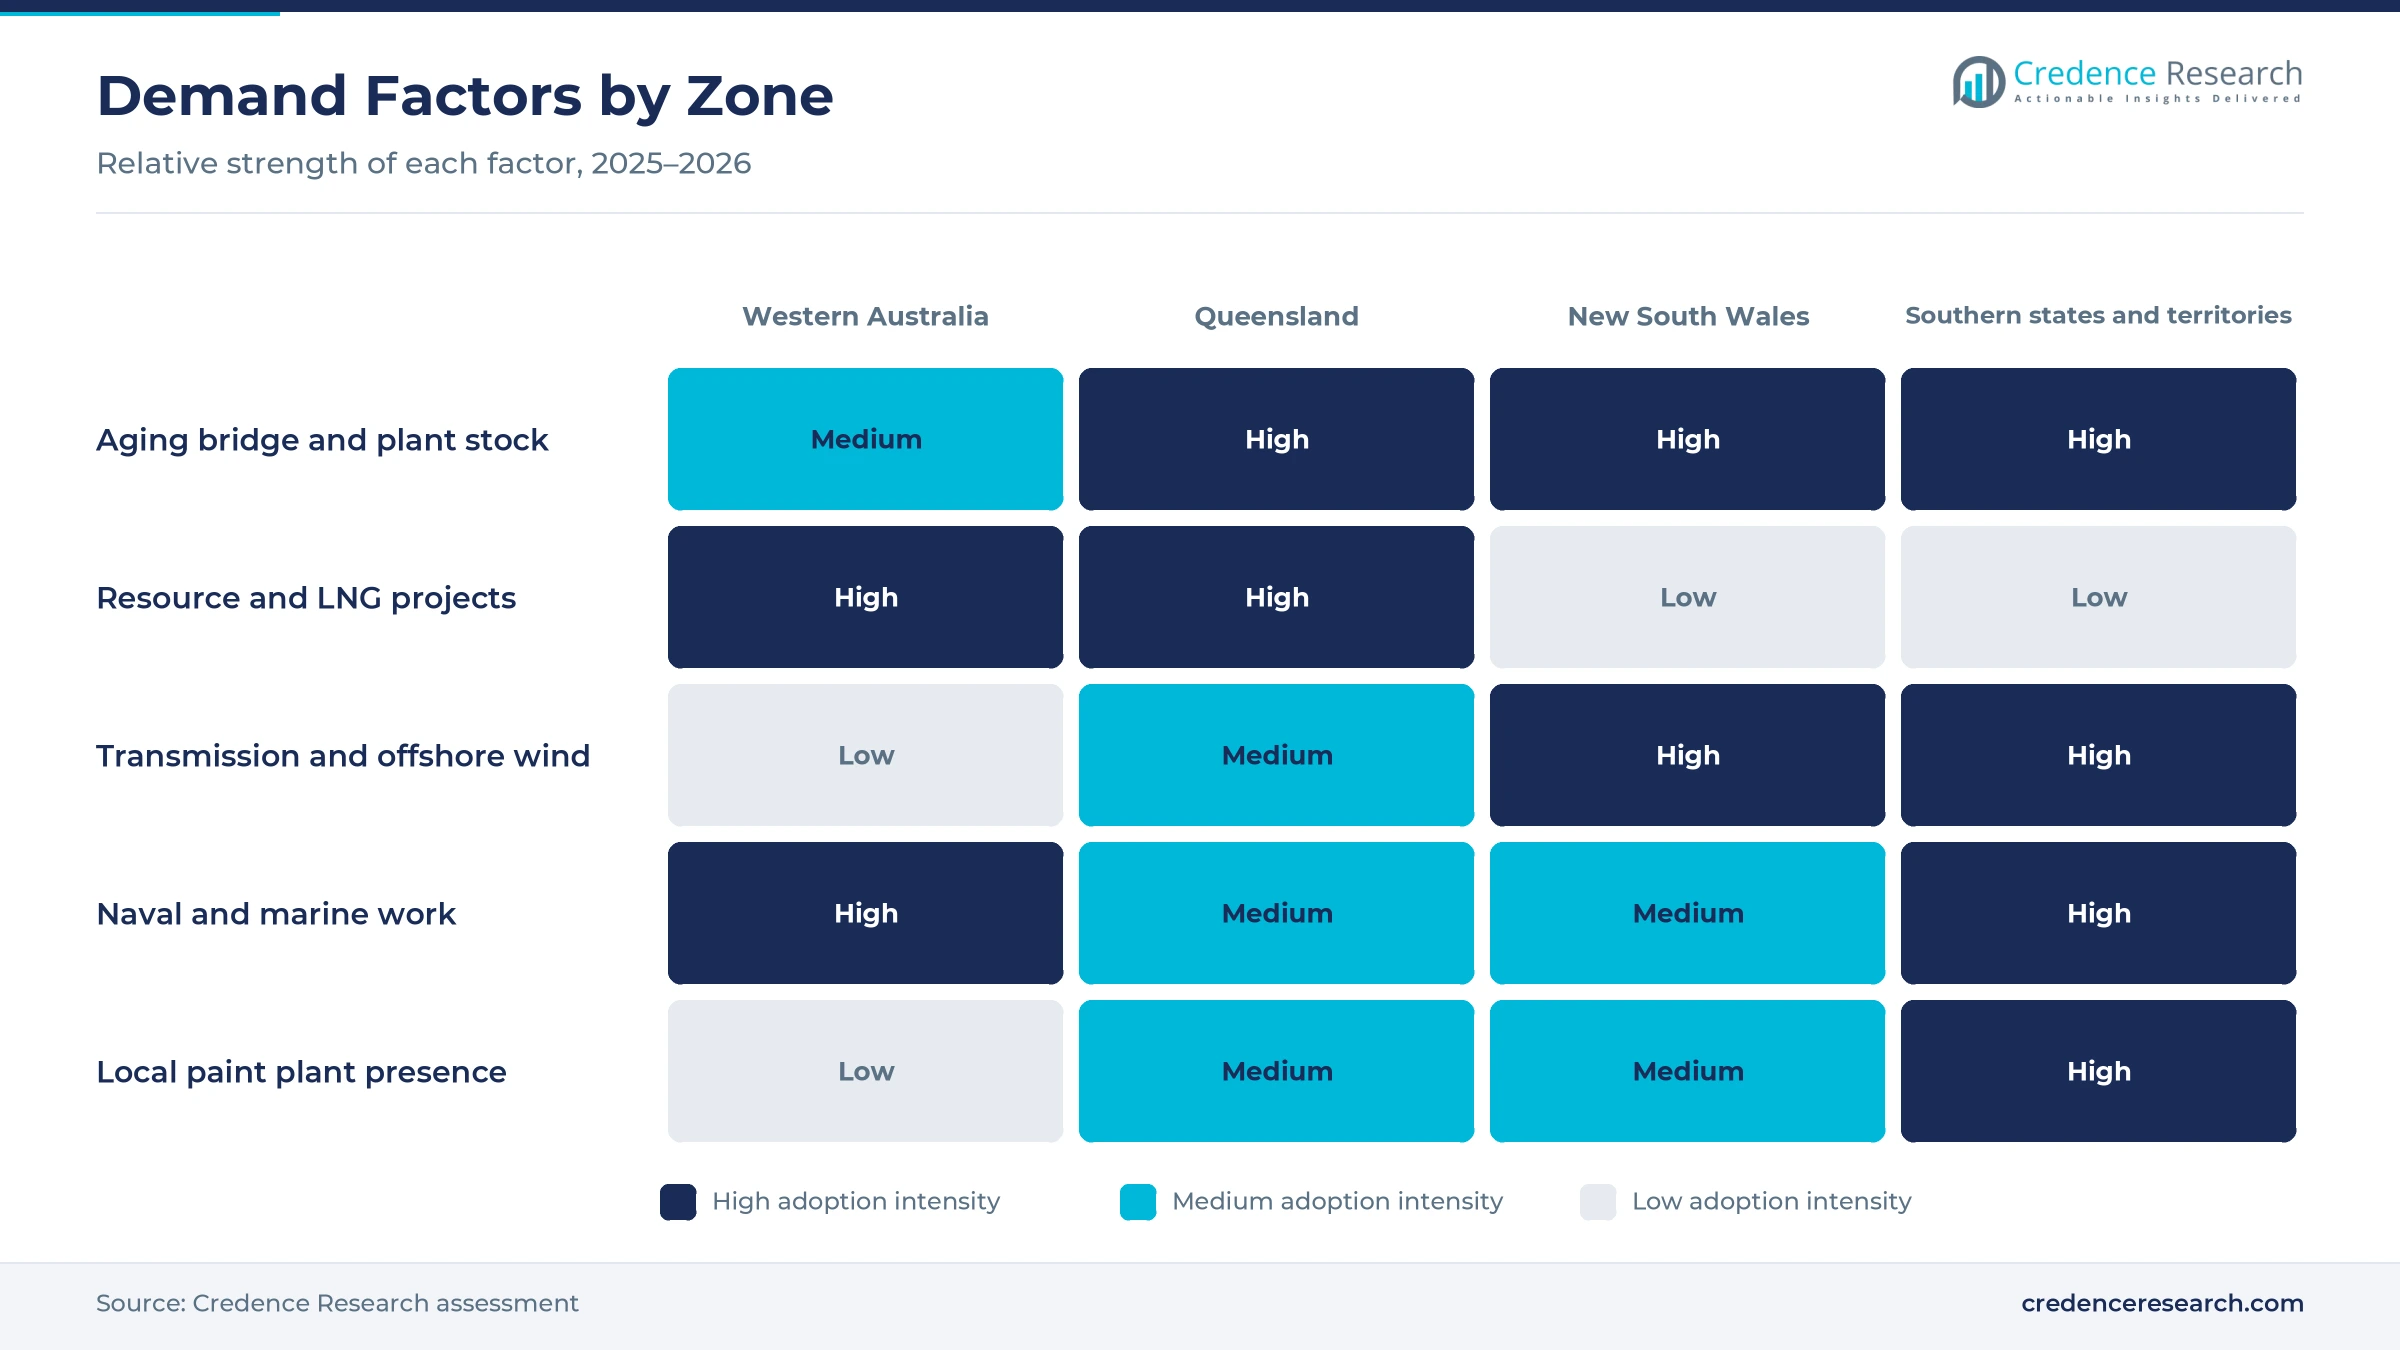
Maintenance cycles and project pipelines lift demand
How does recurring asset maintenance anchor demand?
Recurring maintenance of steel bridges, plants and ships forms the steadiest source of demand, because paint systems on aging assets must be renewed on fixed cycles. The Australasian Corrosion Association put corrosion-related maintenance of infrastructure such as bridges at about A$8 billion a year, excluding housing, in an August 2020 review. The same association estimated that corrosion cost the Royal Australian Navy between A$137 million and A$242 million in 2015. Brisbane City Council puts the 20-year renewal bill for the Story Bridge at about A$3.6 billion, with A$1.35 billion needed before 2032 for steel, concrete and other works. As a result, Atmospheric maintenance held 46.0% of 2025 value, the largest application share.
Why do resource and transport projects widen demand?
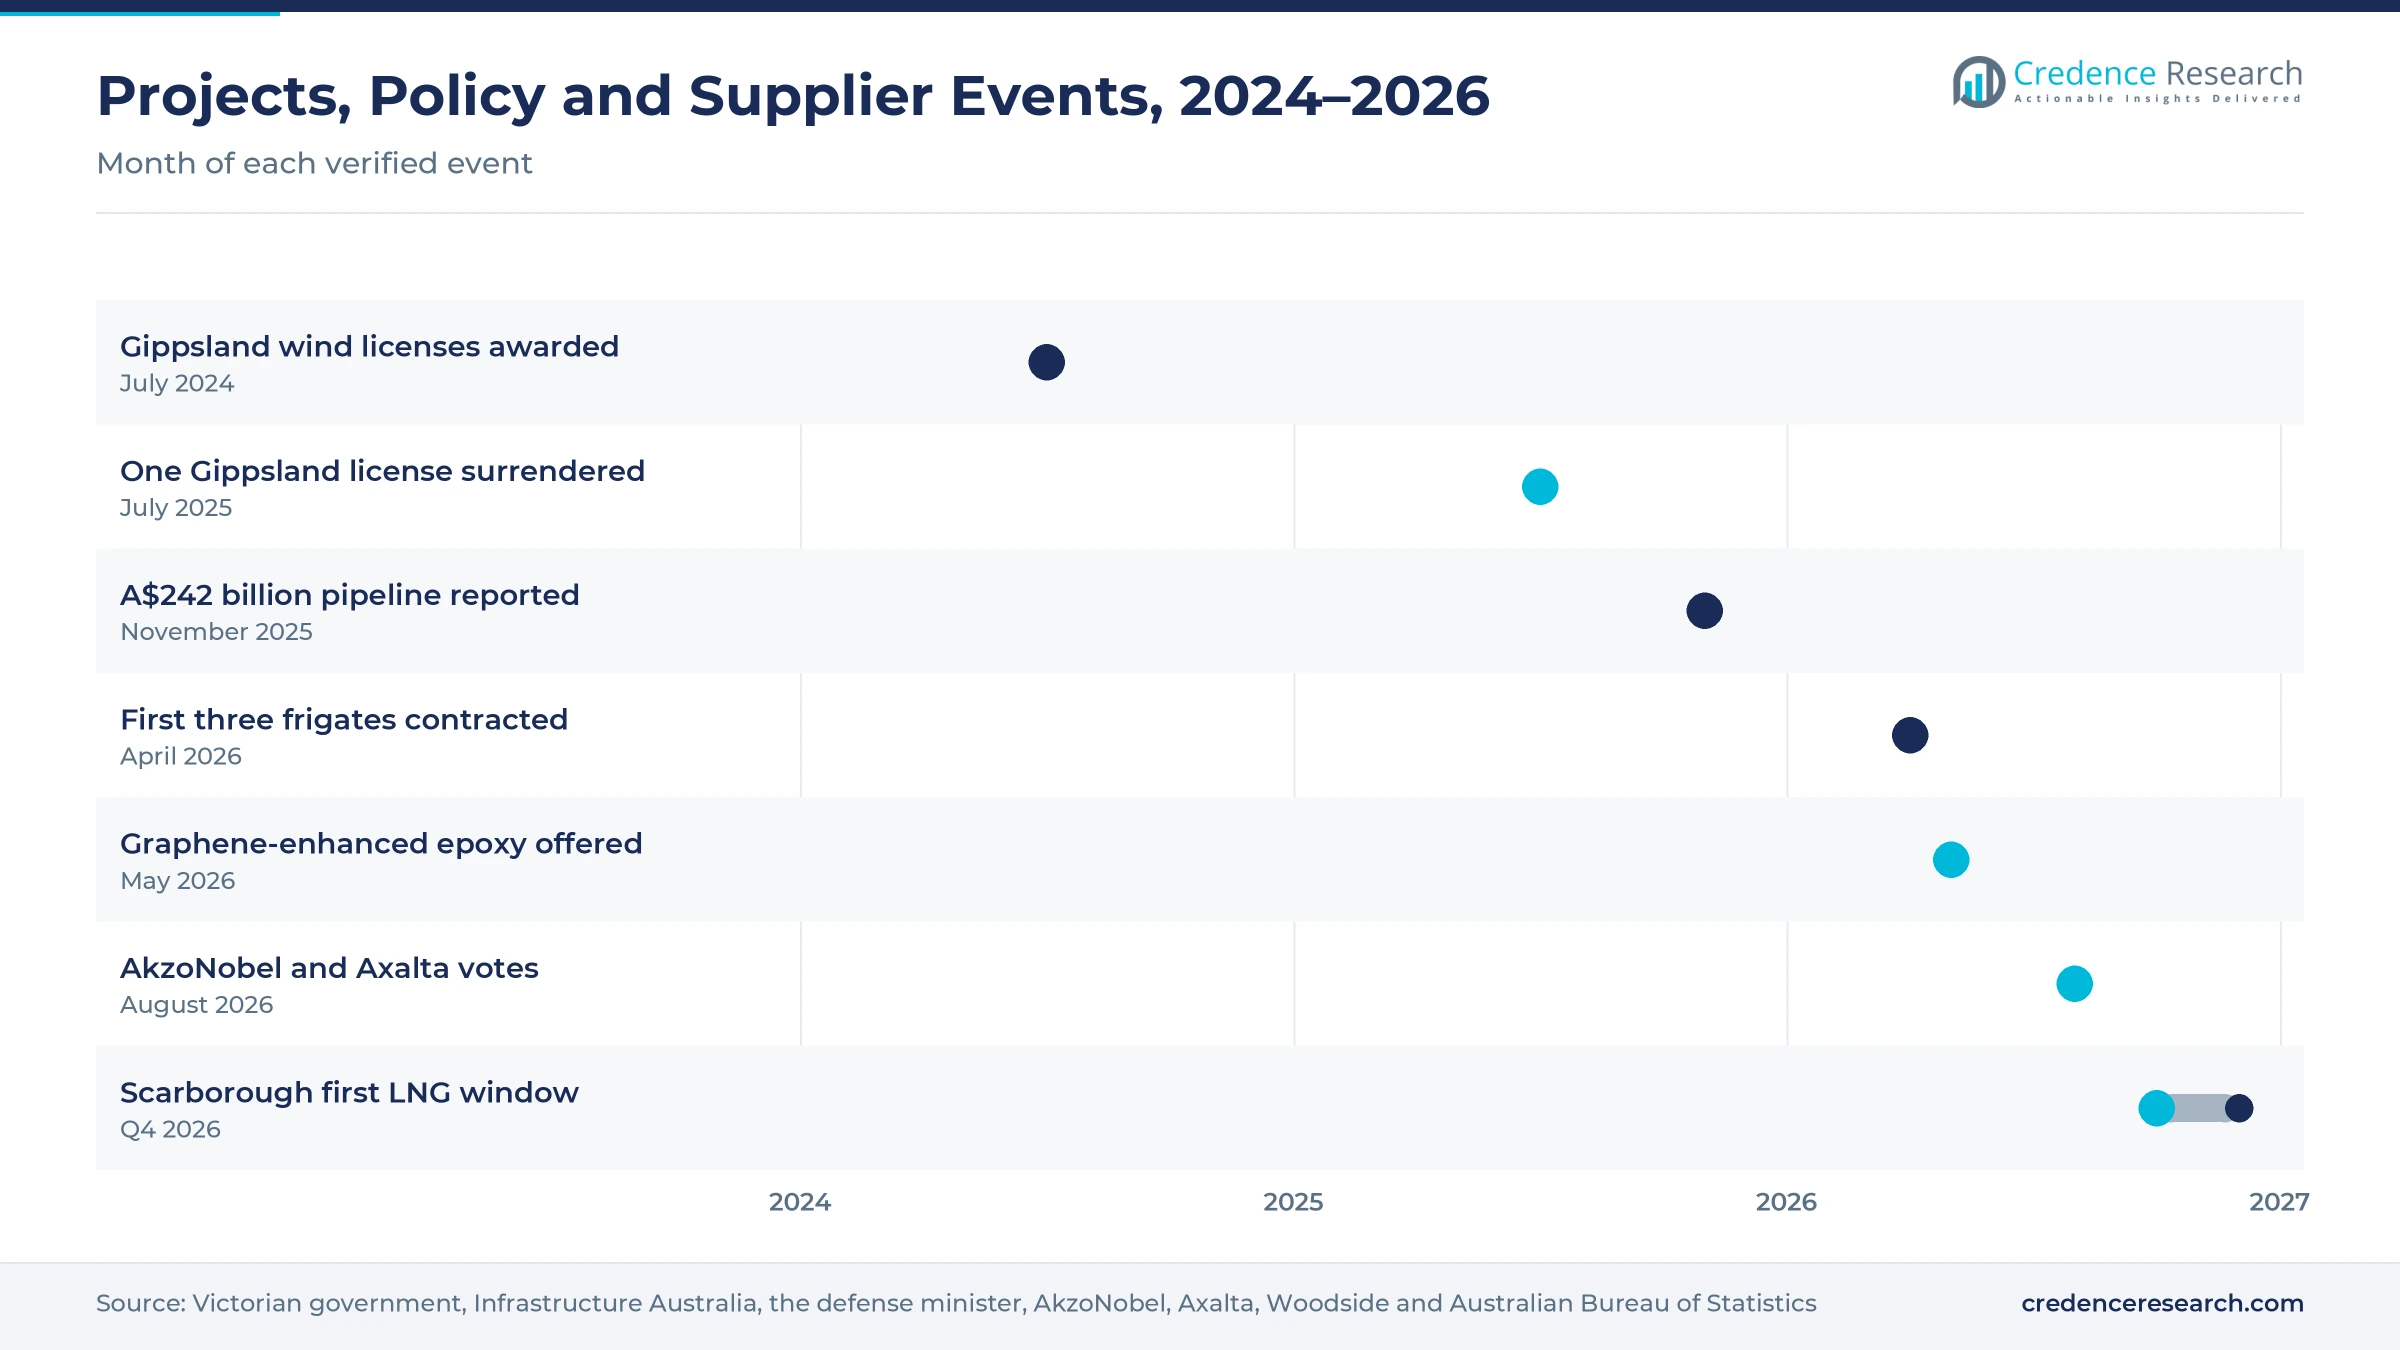
Large resource and transport programs add new steel that must be primed and painted before it enters service, which widens demand beyond maintenance. Infrastructure Australia reported on Nov. 13, 2025, that the five-year major public infrastructure pipeline reached A$242 billion, with transport accounting for A$129 billion. The June 2026 Resources and Energy Quarterly forecast resource and energy export earnings of A$405 billion in 2025–26 and A$416 billion in 2026–27, according to the federal resources minister. The Australian Bureau of Statistics also recorded A$37.2 billion of engineering construction work done in the June quarter of 2026. In turn, Transport infrastructure and marine led end uses with 33.0% of 2025 value.
How do energy transition projects upgrade specifications?
New grid and offshore assets carry design lives of several decades at harsh coastal and inland sites, so owners specify heavier zinc, epoxy and topcoat systems from the start. Transgrid and Elecnor Australia erected 1,508 towers and monopoles on EnergyConnect using 46,068 metric tons of structural steel, according to ESD News. The Victorian government reports that 12 offshore wind feasibility licenses were awarded off Gippsland in July 2024, and 11 remain after one developer surrendered its license in July 2025. Infrastructure Australia also expects energy transmission spending in the national pipeline to more than double to A$36 billion. As a result, Utilities and process industry grows fastest among end uses at 4.78% a year.
Why do naval and LNG builds lift immersion grades?
Naval shipbuilding and offshore gas projects need immersion-grade systems for hulls, tanks and subsea steel, which adds high-value volume. The federal defense minister's office announced on April 18, 2026, contracts with Mitsubishi Heavy Industries for the first three general purpose frigates, within up to A$20 billion committed over the decade. Later ships are planned for construction at the Henderson Defence Precinct in Western Australia, which the government links to about 10,000 high-skilled jobs. Woodside said its Scarborough and Pluto Train 2 developments were 99% complete at the end of September 2026, according to OilPrice.com. In turn, Immersion new construction grows fastest among applications at 4.66% a year.
Longer-life systems and new chemistry gain ground
Why are longer-life multi-coat systems on the rise?
Asset owners are shifting to high-build systems that stretch the interval between repaints, because access, traffic control and blasting make each cycle costly. Dulux Protective Coatings lists a four-part plus stripe coat system for Melbourne's West Gate Bridge, starting with Zincanode 402 and finishing with Weathermax HBR MIO. PPG supplied its PSX polysiloxane system for the refurbishment of the Burnett River Bridge in Queensland, according to Industrial Coatings Ltd. Standards Australia and Standards New Zealand published AS/NZS 2312.1 on Dec. 1, 2014, as the guide for protecting structural steel against atmospheric corrosion. As a result, Epoxy systems kept 42.0% of 2025 value as the standard barrier layer.
How is graphene-enhanced epoxy emerging locally?
Additive-enhanced epoxies are emerging as suppliers look for longer protection on offshore and coastal steel. Sparc Technologies said AkzoNobel would offer an ecosparc graphene-enhanced version of Interzone 954 in Australia from May 2026, according to Small Caps. AkzoNobel will make the product to order at its local Australian manufacturing facility, after field trials that ran for more than 21 months. Interzone 954 already serves offshore oil and gas facilities, offshore wind towers, jetties, sluice gates and petrochemical plants, according to the same report. In turn, Water-based systems grow fastest among technologies at 5.16% a year, as buyers test lower-emission and higher-performance chemistry on new projects.
Can local steel fabrication gaps open shop-applied work?
Large structural steel needs open an opportunity for shop-applied systems, because fabricators prime and paint most new steel before it reaches site. Infrastructure Australia estimates that about 26.6 million metric tons of structural steel is needed from 2024–25 to 2028–29, including 3.6 million metric tons for the major public pipeline. Domestic fabrication capacity is about 1.4 million metric tons a year, according to the same agency, so imports must fill the gap. Fabricated steel imports in 2024 also ran nearly 50% above the 2016–2021 yearly average. As a result, local fabricators that offer certified blasting, priming and topcoat lines can win back work, which supports Zinc-rich primers at 4.67% a year.
Is resource export strength an opening for mine-site suppliers?
Processing plants, conveyors, tanks and port loaders on mine sites offer suppliers a large and recurring pool of repaint work. Ores and metals made up 34.6% of merchandise exports in 2025, and fuels a further 26.9%, according to the World Bank. The federal resources minister said iron ore is expected to account for more than 25% of resource and energy exports over the outlook, despite easing prices. Mine operators also maintain fixed plant and underground mining equipment in wet, abrasive conditions that shorten paint life. In turn, Western Australia, which held 16.0% of 2025 value, grows at 4.59% a year.
Blasting rules, labor gaps and funding limits weigh
Why do blasting rules raise surface preparation costs?
Surface preparation faces tighter controls, because work health and safety laws prohibit abrasive blasting media containing more than 1% crystalline silica. National silica safety guidance states that river, beach and white sand cannot be used, so contractors must buy garnet, glass, metal shot or slag instead. As a result, blasting costs rise for maintenance jobs on bridges and tanks. Some metal slags also contain lead and chromium, which adds handling and waste costs for contractors.
How do workforce gaps delay coating programs?
Shortages of trades workers slow blasting and painting crews on public projects. Infrastructure Australia estimated a shortfall of about 141,000 workers on public infrastructure in October 2025, rising to more than 300,000 in mid-2027. Trades workers and labourers alone face a peak gap of 126,000 in mid-2027, according to the same report. In turn, asset owners may defer repaint cycles, while contractors favor systems that need fewer coats.
Why do funding gaps defer maintenance work?
Maintenance budgets often fall short of what large steel assets need, which delays repainting. Brisbane City Council has committed A$135 million to 2032 for Story Bridge priority works, against about A$1.35 billion that its renewal plan says is needed before 2032. As a result, major renewal works depend on further funding from other governments. Paint suppliers face lumpy demand when large jobs wait for budget decisions.
How does project timing make demand uneven?
Engineering work swings from quarter to quarter, which makes new-construction volumes hard to plan. The Australian Bureau of Statistics reported that engineering construction work done fell 4.7% in the June quarter of 2026, with private work down 7.4%. In turn, suppliers holding project stock can face slower call-offs. Firms with a larger maintenance base, which runs on fixed cycles, absorb these swings better than project-focused rivals.
Southern states lead as Queensland grows fastest
| Region | Value, 2025 (USD million) | Share, 2025 | CAGR, 2026–2035 |
|---|---|---|---|
| Southern states and territories | 165.8 | 34.0% | 3.94% |
| New South Wales | 151.1 | 31.0% | 4.14% |
| Queensland | 92.6 | 19.0% | 4.74% |
| Western Australia | 78.0 | 16.0% | 4.59% |
Why do the southern states and territories lead?
Victoria, South Australia, Tasmania and the territories together held 34.0% of 2025 value and grow at 3.94% a year. Victoria hosts the West Gate Bridge, the Gippsland offshore wind zone and the Merrifield plant that Dulux Protective Coatings calls the largest paint factory in Australia and New Zealand. Jotun Australia makes antifouling hull paint at its Melbourne factory for yacht and commercial vessels. South Australia is linked to New South Wales by the EnergyConnect line, which supports maintenance and new tower work across the zone.
How does New South Wales anchor engineering demand?
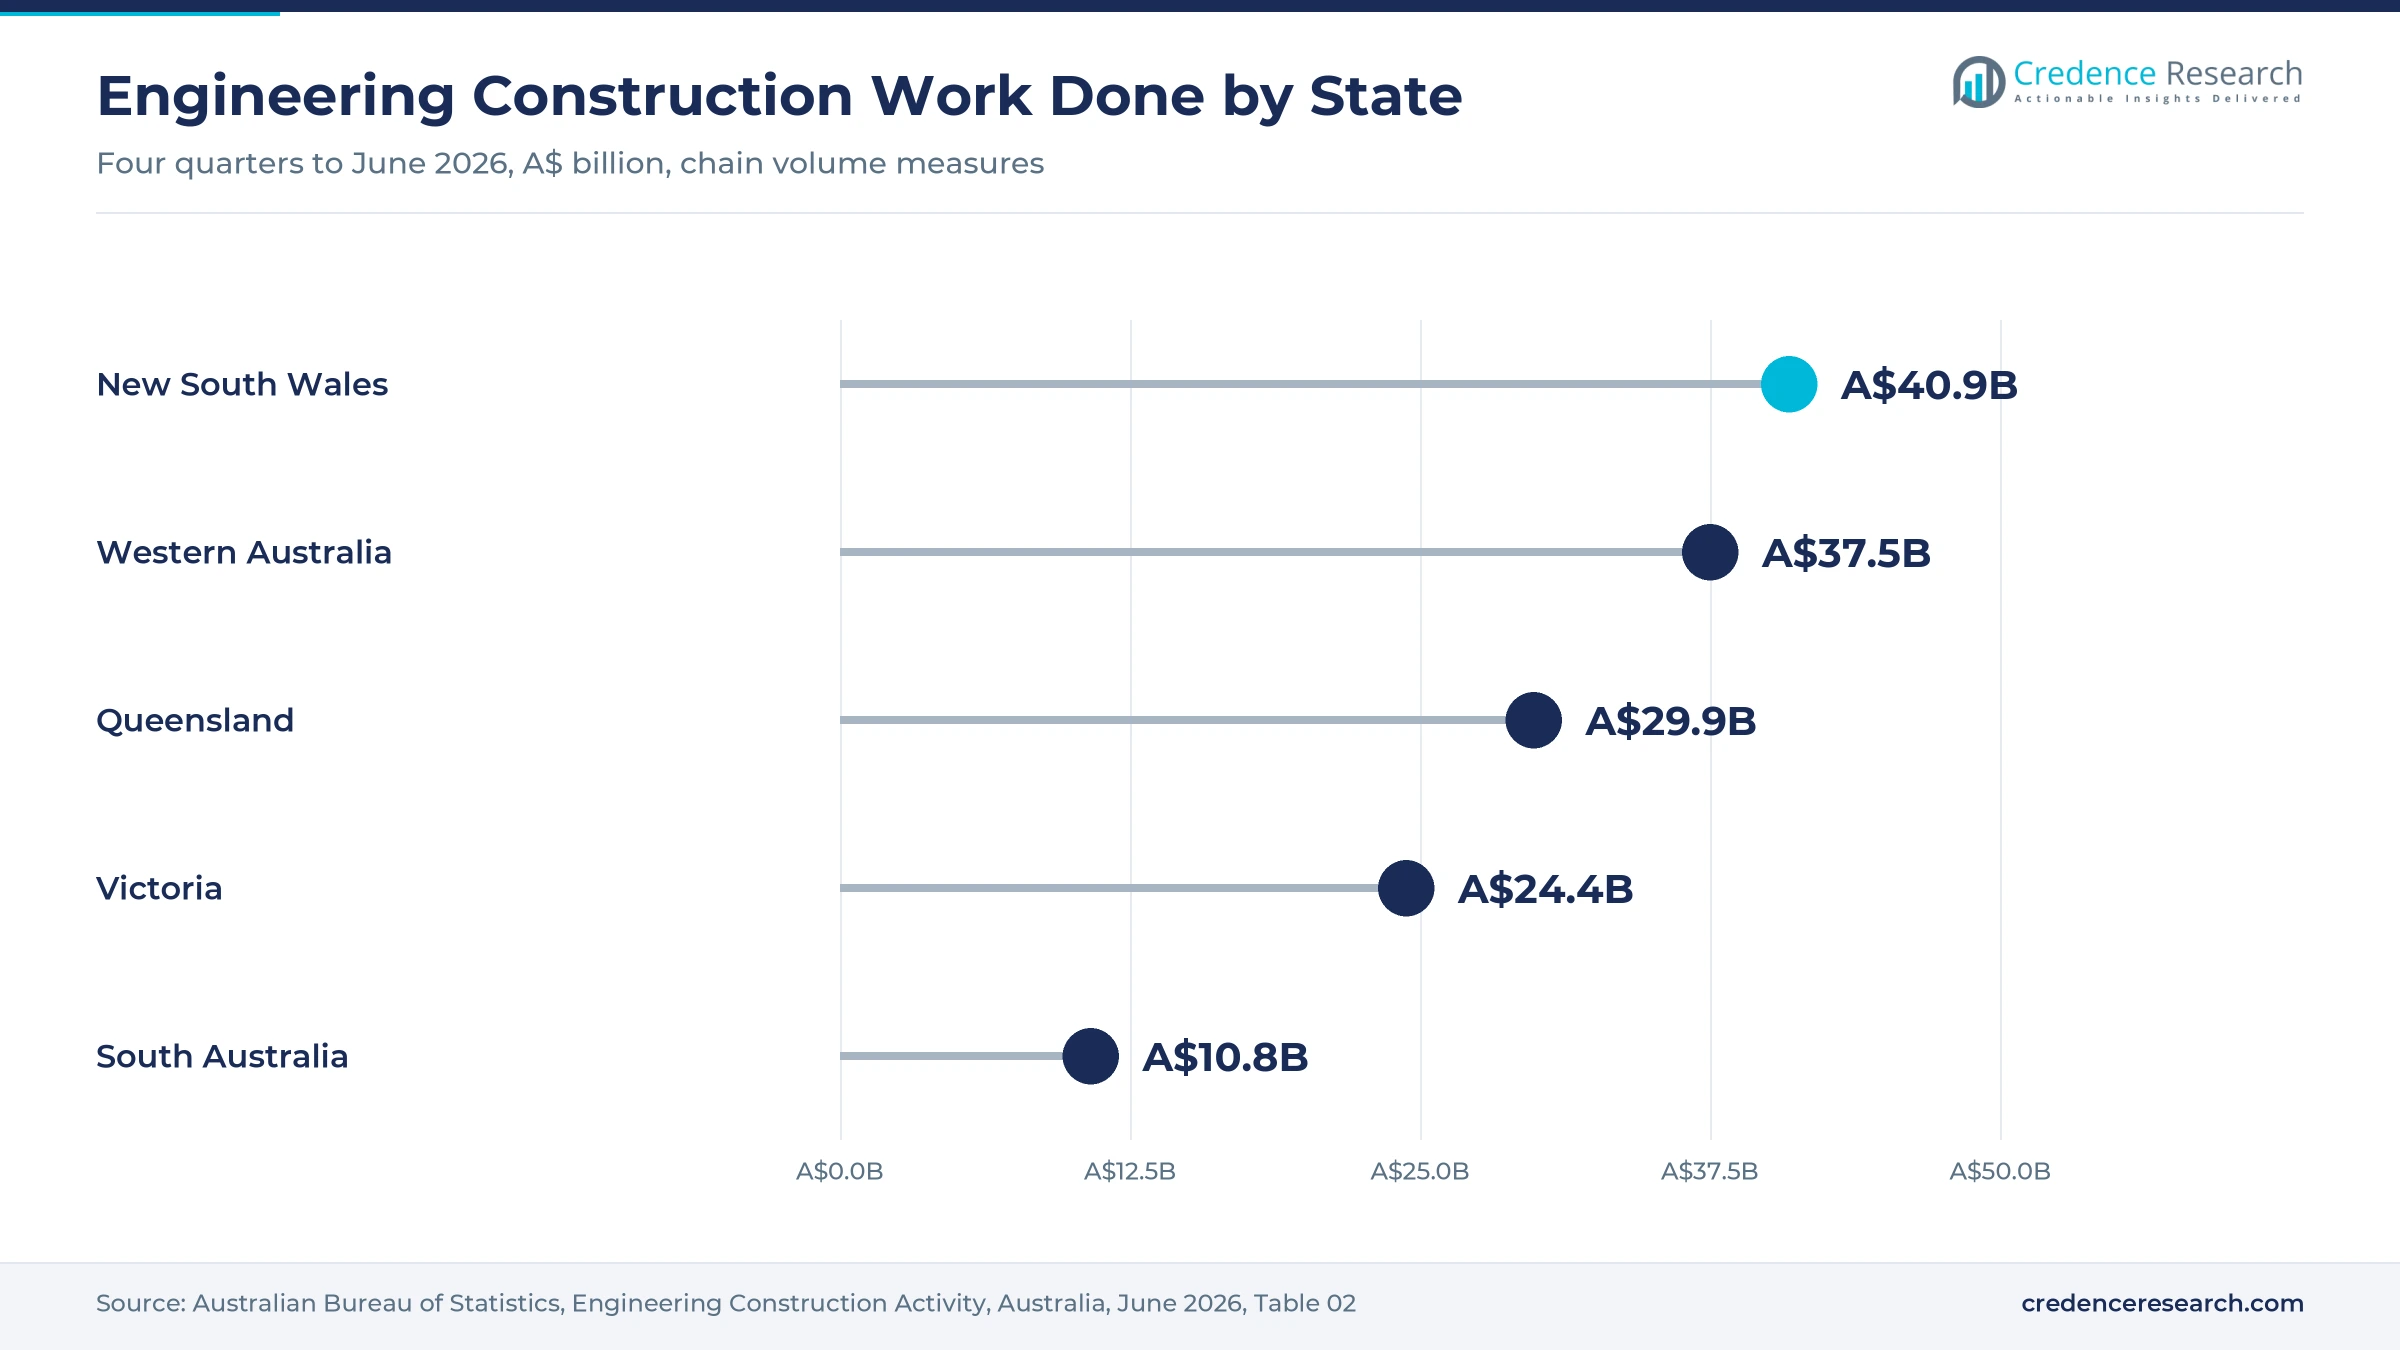
New South Wales held 31.0% of 2025 value and grows at 4.14% a year. The state recorded about A$40.9 billion of engineering construction work in the four quarters to June 2026, the most of any state, based on Australian Bureau of Statistics data. Hempel (Wattyl) is headquartered at Baulkham Hills in Sydney, and the 700-kilometer New South Wales backbone of EnergyConnect adds transmission steel that needs priming and maintenance.
Why does Queensland grow fastest to 2035?
Queensland held a 19.0% share of 2025 value and grows fastest at 4.74% a year. The state recorded about A$29.9 billion of engineering construction work in the four quarters to June 2026, based on Australian Bureau of Statistics data. Story Bridge renewal, the Burnett River Bridge refurbishment and coastal mining and port assets keep repaint demand high, while Dulux Protective Coatings also makes product at Rocklea in Brisbane.
How do LNG and naval builds shape Western Australia?
Western Australia held a 16.0% share of 2025 value and grows at 4.59% a year. The state recorded about A$37.5 billion of engineering construction work in the four quarters to June 2026, based on Australian Bureau of Statistics data. The Scarborough gas development and planned frigate construction at the Henderson Defence Precinct add immersion and marine work, although much new resource steel arrives already painted from overseas fabricators.
Frigates, mergers and new epoxy grades, 2025–2026
| Development | Status and market relevance |
|---|---|
| In November 2025, Infrastructure Australia reported a A$242 billion five-year public infrastructure pipeline, with energy transmission spending set to more than double to A$36 billion. | Sets the project volume behind new-construction paint demand |
| In April 2026, Australia signed contracts with Mitsubishi Heavy Industries for its first three general purpose frigates, with later ships planned for Western Australia. | Adds future naval hull and tank work at Henderson |
| In May 2026, AkzoNobel began offering an ecosparc graphene-enhanced version of Interzone 954 in Australia, made to order at its local plant. | Brings new additive chemistry to heavy-duty epoxy specifications |
| In August 2026, AkzoNobel and Axalta shareholders approved their all-stock merger of equals, with closing expected in late 2026 to early 2027. | Could reshape supplier ranks pending regulatory approvals |
| In October 2026, Woodside said its Scarborough and Pluto Train 2 developments were 99% complete, with first LNG due in the fourth quarter. | Moves a large offshore asset from construction into maintenance |
Zinc, epoxy and polysiloxane layers set system life
- Zinc-rich priming protects steel galvanically, so the zinc corrodes first and shields scratches, as in the Zincanode primers that Dulux Protective Coatings supplies.
- Epoxy barrier coats build film thickness to block water and oxygen, and micaceous iron oxide grades such as Durebild STE MIO add a layered pigment barrier.
- Polysiloxane and polyurethane topcoats resist ultraviolet light and keep color, which suits exposed bridges such as the Burnett River Bridge refurbished with PPG PSX.
- Graphene additives reinforce epoxy films, as in the ecosparc-enhanced Interzone 954 that AkzoNobel offers in Australia from May 2026.
Need a Custom Version of This Report?
Tailor the scope, geography, or segments to your exact requirements.
- Custom geography or segment scope
- Direct access to our analyst team
Five established suppliers compete on approvals and reach
Competition in Australian corrosion protection is led by five global and local suppliers that hold approvals under the Australian Paint Approval Scheme run through CSIRO, which many public specifications require. DuluxGroup, through Dulux Protective Coatings, has served the region for more than 90 years and makes product at Merrifield, Rocklea and Dandenong. Hempel completed its acquisition of Wattyl Australia and New Zealand on March 31, 2021, adding two Australian factories and nearly 100 stores. Jotun Australia makes antifouling in Melbourne, while AkzoNobel offers International brand marine, yacht and protective products. PPG Industries supplies polysiloxane and epoxy systems for bridge and plant work, while the pending merger of AkzoNobel and Axalta could change supplier ranks. Suppliers compete on approved systems, technical inspection support, distribution reach and long warranties.
Which paint suppliers compete for Australian asset owners?
| Company | Type | Role in the market |
|---|---|---|
| DuluxGroup | Local manufacturer | Dulux Protective Coatings systems such as Durebild, Weathermax and Zincanode from Merrifield and Rocklea |
| PPG Industries | Global supplier | PSX polysiloxane and protective systems for bridges and plant, with APAS approvals |
| Hempel (Wattyl) | Global supplier with local plants | Owner of Wattyl since March 2021, with two Australian factories |
| Jotun Australia | Global supplier with local plant | Antifouling made in Melbourne and protective systems with APAS approvals |
| AkzoNobel (International Paint) | Global supplier with local plant | International brand marine and protective products, including Interzone 954 |
Credence Research view on protective paint demand
Credence Research's view is that Australian demand for corrosion protection coatings will grow steadily, because a large stock of aging steel needs repainting on fixed cycles while transport, energy and naval projects add new steel. Epoxy remains the largest product pool, while zinc-rich primers gain as more new steel is primed in the shop. Labor shortages, silica rules on blasting and stretched maintenance budgets will slow some programs. Suppliers that pair approved long-life systems with inspection support should win more specifications.
How the national protective paint estimate was built
The report uses 2025 as the base year on a calendar basis, and market values come from the Credence Research model. That model combines engineering construction data, infrastructure pipeline reports, resource export forecasts, supplier product ranges and company disclosures. Segment splits and zone growth rates are Credence Research estimates, while zone shares follow the regional split defined for this report. Sources used are government agencies, official statistics, international agency data, industry associations and company publications, and no interviews or surveys were used.
Maintenance and energy work carry growth to 2035
Value across Australian corrosion protection coatings is expected to reach USD 749.6 million by 2035, a 4.26% CAGR during 2026–2035, as maintenance cycles, transport works and energy projects keep steel protection in demand. Growth should be strongest in Queensland, where bridge renewal and transport works gather pace. Utilities, offshore wind and naval builds will lift immersion and new-construction work, while water-based and solvent-free systems take a larger share of urban jobs. Suppliers that offer approved long-life systems with inspection support should gain the most.
Frequently Asked Questions
How big is the Australia corrosion protection coatings market?
Which product type leads protective paint spending?
Which region leads protective paint spending in Australia?
Why is maintenance the largest application?
Which end use grows fastest?
How do blasting rules affect contractors?
Which companies supply corrosion protection paint in Australia?
What are the main challenges for suppliers?
Table of Content
Chapter 1 Market Segmentation
- 1.1 Segmentation Framework
- 1.1.1 Product and Service Classification
- 1.1.2 Application and End-Use Classification
- 1.1.3 Technology and Solution Classification
- 1.1.4 Customer and Distribution Channel Classification
- 1.1.5 Geographic Segmentation
- 1.1.6 Market Segment Definitions and Boundaries
- 1.2 By Product Type
- 1.2.1 Epoxy systems
- 1.2.2 Polyurethane systems
- 1.2.3 Zinc-rich primers
- 1.2.4 Alkyd, acrylic and specialty systems
- 1.3 By End-Use Industry
- 1.3.1 Oil and gas
- 1.3.2 Transport infrastructure and marine
- 1.3.3 Mining
- 1.3.4 Utilities and process industry
- 1.4 By Application
- 1.4.1 Atmospheric maintenance
- 1.4.2 Immersion maintenance
- 1.4.3 Atmospheric new construction
- 1.4.4 Immersion new construction
- 1.5 By Technology
- 1.5.1 Solvent-based systems
- 1.5.2 Water-based systems
- 1.5.3 Powder systems
- 1.5.4 Solvent-free and specialty systems
Chapter 2 Introduction
- 2.1 Report Objectives and Scope
- 2.2 Product Definition and Industry Terminology
- 2.3 Market Inclusions and Exclusions
- 2.4 Research Process
- 2.4.1 Primary Research and Expert Interviews
- 2.4.2 Secondary Research and Source Review
- 2.4.3 Top-Down and Bottom-Up Estimation
- 2.4.4 Data Triangulation and Verification
- 2.5 Market Size Measurement Basis
- 2.5.1 2025: USD 487.5 million → 2035: USD 749.6 million
- 2.6 Historical and Forecast Reference Periods
- 2.6.1 Historical Period: 2018-2025
- 2.6.2 Base Year: 2025
- 2.6.3 Forecast Period: 2025-2035
- 2.7 Research Assumptions and Limitations
Chapter 3 Executive Summary
- 3.1 Market Snapshot and Key Findings
- 3.2 Base-Year Market Size, 2025
- 3.3 Forecast Market Size, 2035
- 3.4 Revenue and Volume Growth Outlook
- 3.5 Key Demand and Supply Indicators
- 3.6 Leading Market Segments
- 3.7 Fastest-Growing Market Opportunities
- 3.8 Regional Performance Highlights
- 3.9 Technology and Industry Transformation
- 3.10 Competitive Landscape Summary
- 3.11 Analyst View and Strategic Implications
Chapter 4 Australia Corrosion Protection Coatings Market Trends and Developments
- 4.1 Historical Industry Development, 2018-2025
- 4.2 Recent Market Trends and Developments
- 4.3 Demand and Customer Behavior Trends
- 4.4 Technology and Product Innovation
- 4.5 Artificial Intelligence, Automation and Digitalization
- 4.6 Local Manufacturing and Supply Chain Realignment
- 4.7 Industry Partnerships, Mergers and Acquisitions
- 4.8 Sustainability and Circular Economy Developments
- 4.9 Government and Private Sector Investment Trends
- 4.10 Emerging Business Models and Commercialization
- 4.11 Industry Developments and Announcements
Chapter 5 Australia Corrosion Protection Coatings Market Production, Supply and Demand Analysis
- 5.1 Demand Trend and Consumption Analysis, 2018-2025
- 5.2 Demand Forecast, 2025-2035
- 5.3 Production and Output Trend, 2018-2025
- 5.4 Production and Output Forecast, 2025-2035
- 5.5 Installed Capacity and Capacity Utilization
- 5.6 Company-Wise Production Plants and Statistics
- 5.6.1 Installed Production Capacity
- 5.6.2 Actual Production
- 5.6.3 Planned Capacity and Expansion Targets
- 5.7 Supply Chain Structure and Procurement Trends
- 5.8 Supply-Demand Gap and Bottlenecks
- 5.9 Import Dependence and Sourcing Structure
- 5.10 Contract Manufacturing and Outsourcing
- 5.11 Regional Supply and Demand Concentration
Chapter 6 Australia Corrosion Protection Coatings Market Pricing Analysis
- 6.1 Pricing Structure and Measurement
- 6.2 Historical Pricing Trends, 2018-2025
- 6.3 Pricing Outlook, 2025-2035
- 6.4 Average Selling Price and Unit Economics
- 6.5 Pricing by Product and Market Segment
- 6.6 Geographic Pricing Differences
- 6.7 Key Input, Energy, Labor and Logistics Costs
- 6.8 Contract Pricing and Purchasing Models
- 6.9 Pricing Sensitivity and Competitive Positioning
- 6.10 Price, Margin and Profitability Implications
Chapter 7 Australia Corrosion Protection Coatings Market Dynamics
- 7.1 Market Growth Drivers
- 7.1.1 Demand-Side Drivers
- 7.1.2 Technology and Innovation Drivers
- 7.1.3 Infrastructure and Investment Drivers
- 7.1.4 Regulatory and Policy Drivers
- 7.2 Market Restraints
- 7.2.1 Cost and Affordability Constraints
- 7.2.2 Technology and Adoption Barriers
- 7.2.3 Supply Chain and Operational Constraints
- 7.3 Market Challenges
- 7.3.1 Competitive Pressure and Margin Erosion
- 7.3.2 Skills, Infrastructure and Implementation Gaps
- 7.4 Emerging Market Opportunities
- 7.5 Market Dynamics Impact and Time-Horizon Assessment
Chapter 8 Australia Corrosion Protection Coatings Value Chain Analysis
- 8.1 Industry Value Chain Overview
- 8.2 Upstream Suppliers and Critical Inputs
- 8.3 Technology and Component Providers
- 8.4 Manufacturing or Service Delivery
- 8.5 Distribution, Channel Partners and Integrators
- 8.6 Downstream Applications and End Users
- 8.7 Value Addition and Profit Pools
- 8.8 Vertical Integration and Outsourcing
- 8.9 Supplier Concentration and Risk
- 8.10 Supply Chain Localization and Resilience
Chapter 9 Australia Corrosion Protection Coatings Market Regulations and Policies
- 9.1 Relevant Laws, Standards and Compliance Frameworks
- 9.2 Product, Service, Safety and Quality Requirements
- 9.3 Government Policies, Incentives and Subsidies
- 9.4 Imports, Exports and Trade Barriers
- 9.5 Public Procurement and Local Content Requirements
- 9.6 Environmental and Sustainability Compliance
- 9.7 Upcoming Policy Changes and Market Implications
Chapter 10 Australia Corrosion Protection Coatings Market Hotspots and Opportunities
- 10.1 Market Opportunity Mapping and Growth Hotspots
- 10.2 High-Growth Applications and Customer Groups
- 10.3 Underserved Markets and White-Space Opportunities
- 10.4 Emerging Technology and Product Opportunities
- 10.5 New Capacity and Investment Hotspots
- 10.6 Market Entry and Expansion Opportunities
- 10.7 Distribution and Partnership Opportunities
- 10.8 Near-Term and Long-Term Commercial Potential
- 10.9 Opportunity Attractiveness and Execution Risks
Chapter 11 Australia Corrosion Protection Coatings Market Outlook, 2025-2035
- 11.1 Market Size and Analysis
- 11.1.1 Revenue (Market Measurement: 2025: USD 487.5 million → 2035: USD 749.6 million)
- 11.1.2 Market Volume and Quantity Sold
- 11.1.3 Historical Market Size, 2018-2025
- 11.1.4 Base-Year Market Size, 2025
- 11.2 Market Forecast, 2025-2035
- 11.2.1 Revenue Forecast to 2035
- 11.2.2 Volume Forecast to 2035
- 11.2.3 CAGR and Year-on-Year Growth
- 11.2.4 Incremental Revenue Opportunity
- 11.3 Forecast Assumptions and Scenario Analysis
- 11.3.1 Base-Case Forecast
- 11.3.2 Optimistic and Conservative Scenarios
- 11.3.3 Technology, Pricing and Policy Sensitivities
- 11.4 Market Attractiveness and Growth Outlook
Chapter 12 Australia Corrosion Protection Coatings Market Segmentation and Outlook
- 12.1 Segmentation Summary and Market Shares, 2025
- 12.2 Largest and Fastest-Growing Segments
- 12.3 By Product Type - Market Size and Forecast, 2025-2035
- 12.3.1 Segment Definition and Scope
- 12.3.2 Historical Market Size, 2018-2025
- 12.3.3 Revenue Forecast, 2025-2035
- 12.3.4 Volume Forecast, 2025-2035
- 12.3.5 Base-Year Market Share, 2025
- 12.3.6 Segment CAGR and Growth Drivers
- 12.3.7 Subsegment Market Size and Forecast
- 12.3.7.1 Epoxy systems
- 12.3.7.2 Polyurethane systems
- 12.3.7.3 Zinc-rich primers
- 12.3.7.4 Alkyd, acrylic and specialty systems
- 12.3.8 Subsegment Pricing and Adoption Trends
- 12.3.9 Leading Suppliers and Competition
- 12.3.10 Regional Demand and Opportunities
- 12.4 By End-Use Industry - Market Size and Forecast, 2025-2035
- 12.4.1 Segment Definition and Scope
- 12.4.2 Historical Market Size, 2018-2025
- 12.4.3 Revenue Forecast, 2025-2035
- 12.4.4 Volume Forecast, 2025-2035
- 12.4.5 Base-Year Market Share, 2025
- 12.4.6 Segment CAGR and Growth Drivers
- 12.4.7 Subsegment Market Size and Forecast
- 12.4.7.1 Oil and gas
- 12.4.7.2 Transport infrastructure and marine
- 12.4.7.3 Mining
- 12.4.7.4 Utilities and process industry
- 12.4.8 Subsegment Pricing and Adoption Trends
- 12.4.9 Leading Suppliers and Competition
- 12.4.10 Regional Demand and Opportunities
- 12.5 By Application - Market Size and Forecast, 2025-2035
- 12.5.1 Segment Definition and Scope
- 12.5.2 Historical Market Size, 2018-2025
- 12.5.3 Revenue Forecast, 2025-2035
- 12.5.4 Volume Forecast, 2025-2035
- 12.5.5 Base-Year Market Share, 2025
- 12.5.6 Segment CAGR and Growth Drivers
- 12.5.7 Subsegment Market Size and Forecast
- 12.5.7.1 Atmospheric maintenance
- 12.5.7.2 Immersion maintenance
- 12.5.7.3 Atmospheric new construction
- 12.5.7.4 Immersion new construction
- 12.5.8 Subsegment Pricing and Adoption Trends
- 12.5.9 Leading Suppliers and Competition
- 12.5.10 Regional Demand and Opportunities
- 12.6 By Technology - Market Size and Forecast, 2025-2035
- 12.6.1 Segment Definition and Scope
- 12.6.2 Historical Market Size, 2018-2025
- 12.6.3 Revenue Forecast, 2025-2035
- 12.6.4 Volume Forecast, 2025-2035
- 12.6.5 Base-Year Market Share, 2025
- 12.6.6 Segment CAGR and Growth Drivers
- 12.6.7 Subsegment Market Size and Forecast
- 12.6.7.1 Solvent-based systems
- 12.6.7.2 Water-based systems
- 12.6.7.3 Powder systems
- 12.6.7.4 Solvent-free and specialty systems
- 12.6.8 Subsegment Pricing and Adoption Trends
- 12.6.9 Leading Suppliers and Competition
- 12.6.10 Regional Demand and Opportunities
- 12.7 Segment Growth Comparison
- 12.8 Segment Attractiveness and Priority Matrix
Chapter 13 Australia Corrosion Protection Coatings End-Use and Application Market Outlook
- 13.1 End-Use Industry and Customer Demand Structure
- 13.2 Leading Applications and Customer Groups
- 13.3 End-Use Market Size, Share and Forecast
- 13.4 Major End-Use Industry Deep Dives
- 13.4.1 Customer Requirements and Use Cases
- 13.4.2 Demand and Replacement Cycles
- 13.4.3 Technical and Regulatory Considerations
- 13.4.4 Purchasing and Procurement Models
- 13.4.5 Leading Vendors and Distribution Channels
- 13.4.6 Forecast and Commercial Opportunities
- 13.5 Emerging Applications and Cross-Segment Demand
- 13.6 End-Use Industry Investment Priorities
Chapter 14 Australia Corrosion Protection Coatings Geographic Market Outlook, 2025-2035
- 14.1 Domestic Market Distribution and Demand Clusters
- 14.2 State- or Province-Wise Market Size and Forecast, 2025-2035
- 14.3 City and Metropolitan Market Outlook
- 14.4 Industrial, Manufacturing and Commercial Clusters
- 14.5 Geographic Concentration of Key End Users
- 14.6 Local Pricing and Purchasing Differences
- 14.7 Domestic Production Facilities and Capacity Map
- 14.8 Local Infrastructure and Project Pipeline
- 14.9 State-Level Policy and Incentive Differences
- 14.10 Subnational Investment Hotspots and Opportunities
- 14.11 Distribution and Logistics Networks
- 14.12 Domestic Competitive Footprint
Chapter 15 Australia Corrosion Protection Coatings Technology, Innovation and Sustainability Outlook
- 15.1 Technology Landscape and Maturity
- 15.2 Product, Process and Service Innovation
- 15.3 AI, Automation and Digital Tools in the Industry
- 15.4 Technology Adoption and Performance Benchmarking
- 15.5 Innovation Pipeline and R&D Investment
- 15.6 Patent and Intellectual Property Trends
- 15.7 Energy Efficiency and Resource Management
- 15.8 Sustainability, Recycling and Circularity
- 15.9 Technology Roadmap, 2025-2035
- 15.10 Risks of Obsolescence and Technology Substitution
Chapter 16 Australia Corrosion Protection Coatings Market Key Strategic Imperatives
- 16.1 Growth and Market Entry Priorities
- 16.2 High-Return Products and Segments
- 16.3 Pricing, Profitability and Cost Optimization
- 16.4 Technology Investment and Product Differentiation
- 16.5 Supply Chain Localization and Resilience
- 16.6 Distribution and Customer Acquisition
- 16.7 Partnership, Acquisition and Capacity Strategy
- 16.8 Regional Expansion Priorities
- 16.9 Short-, Medium- and Long-Term Actions
Chapter 17 Competition Outlook
- 17.1 Industry Competition Characteristics
- 17.2 Market Structure and Concentration
- 17.3 Market Share and Competitive Positioning, 2025
- 17.4 Company-Wise Revenue and Product Benchmarking
- 17.5 Production and Service Capacity Benchmarking
- 17.6 Technology, Pricing and Differentiation
- 17.7 Regional Footprint and Distribution Strength
- 17.8 Mergers, Acquisitions and Strategic Alliances
- 17.9 New Entrants and Competitive Threats
- 17.10 Porter's Five Forces and Industry Attractiveness
- 17.11 Competitive Outlook, 2025-2035
Chapter 18 Company Profiles
- 18.1 Company Coverage and Selection Criteria
- 18.2 DuluxGroup
- 18.2.1 Business Description
- 18.2.2 Company Ownership and Geographic Presence
- 18.2.3 Product and Service Portfolio
- 18.2.4 Manufacturing and Operating Footprint
- 18.2.5 Production Capacity and Expansion Plans
- 18.2.6 Financial Performance and Investment
- 18.2.7 Market Share and Competitive Position
- 18.2.8 Technology and Innovation Capabilities
- 18.2.9 Strategic Alliances or Partnerships
- 18.2.10 Recent Developments
- 18.2.11 Growth Strategy and Outlook
- 18.3 PPG Industries
- 18.4 Hempel (Wattyl)
- 18.5 Jotun Australia
- 18.6 AkzoNobel (International Paint)
- 18.7 Other Relevant Market Participants
Note: Every listed company is profiled on the structure shown under the first company. The company list is preliminary and may change based on research findings, market developments, data availability and client requirements.
Chapter 19 Disclaimer
- 19.1 Research and Forecast Disclaimer
- 19.2 Data Source and Estimation Limitations
Note: The depth of individual sections depends on data availability for this market. Volume, capacity, trade and other unit-based metrics are included where applicable.

