
An imported C12 monomer bought in kilograms, not bulk
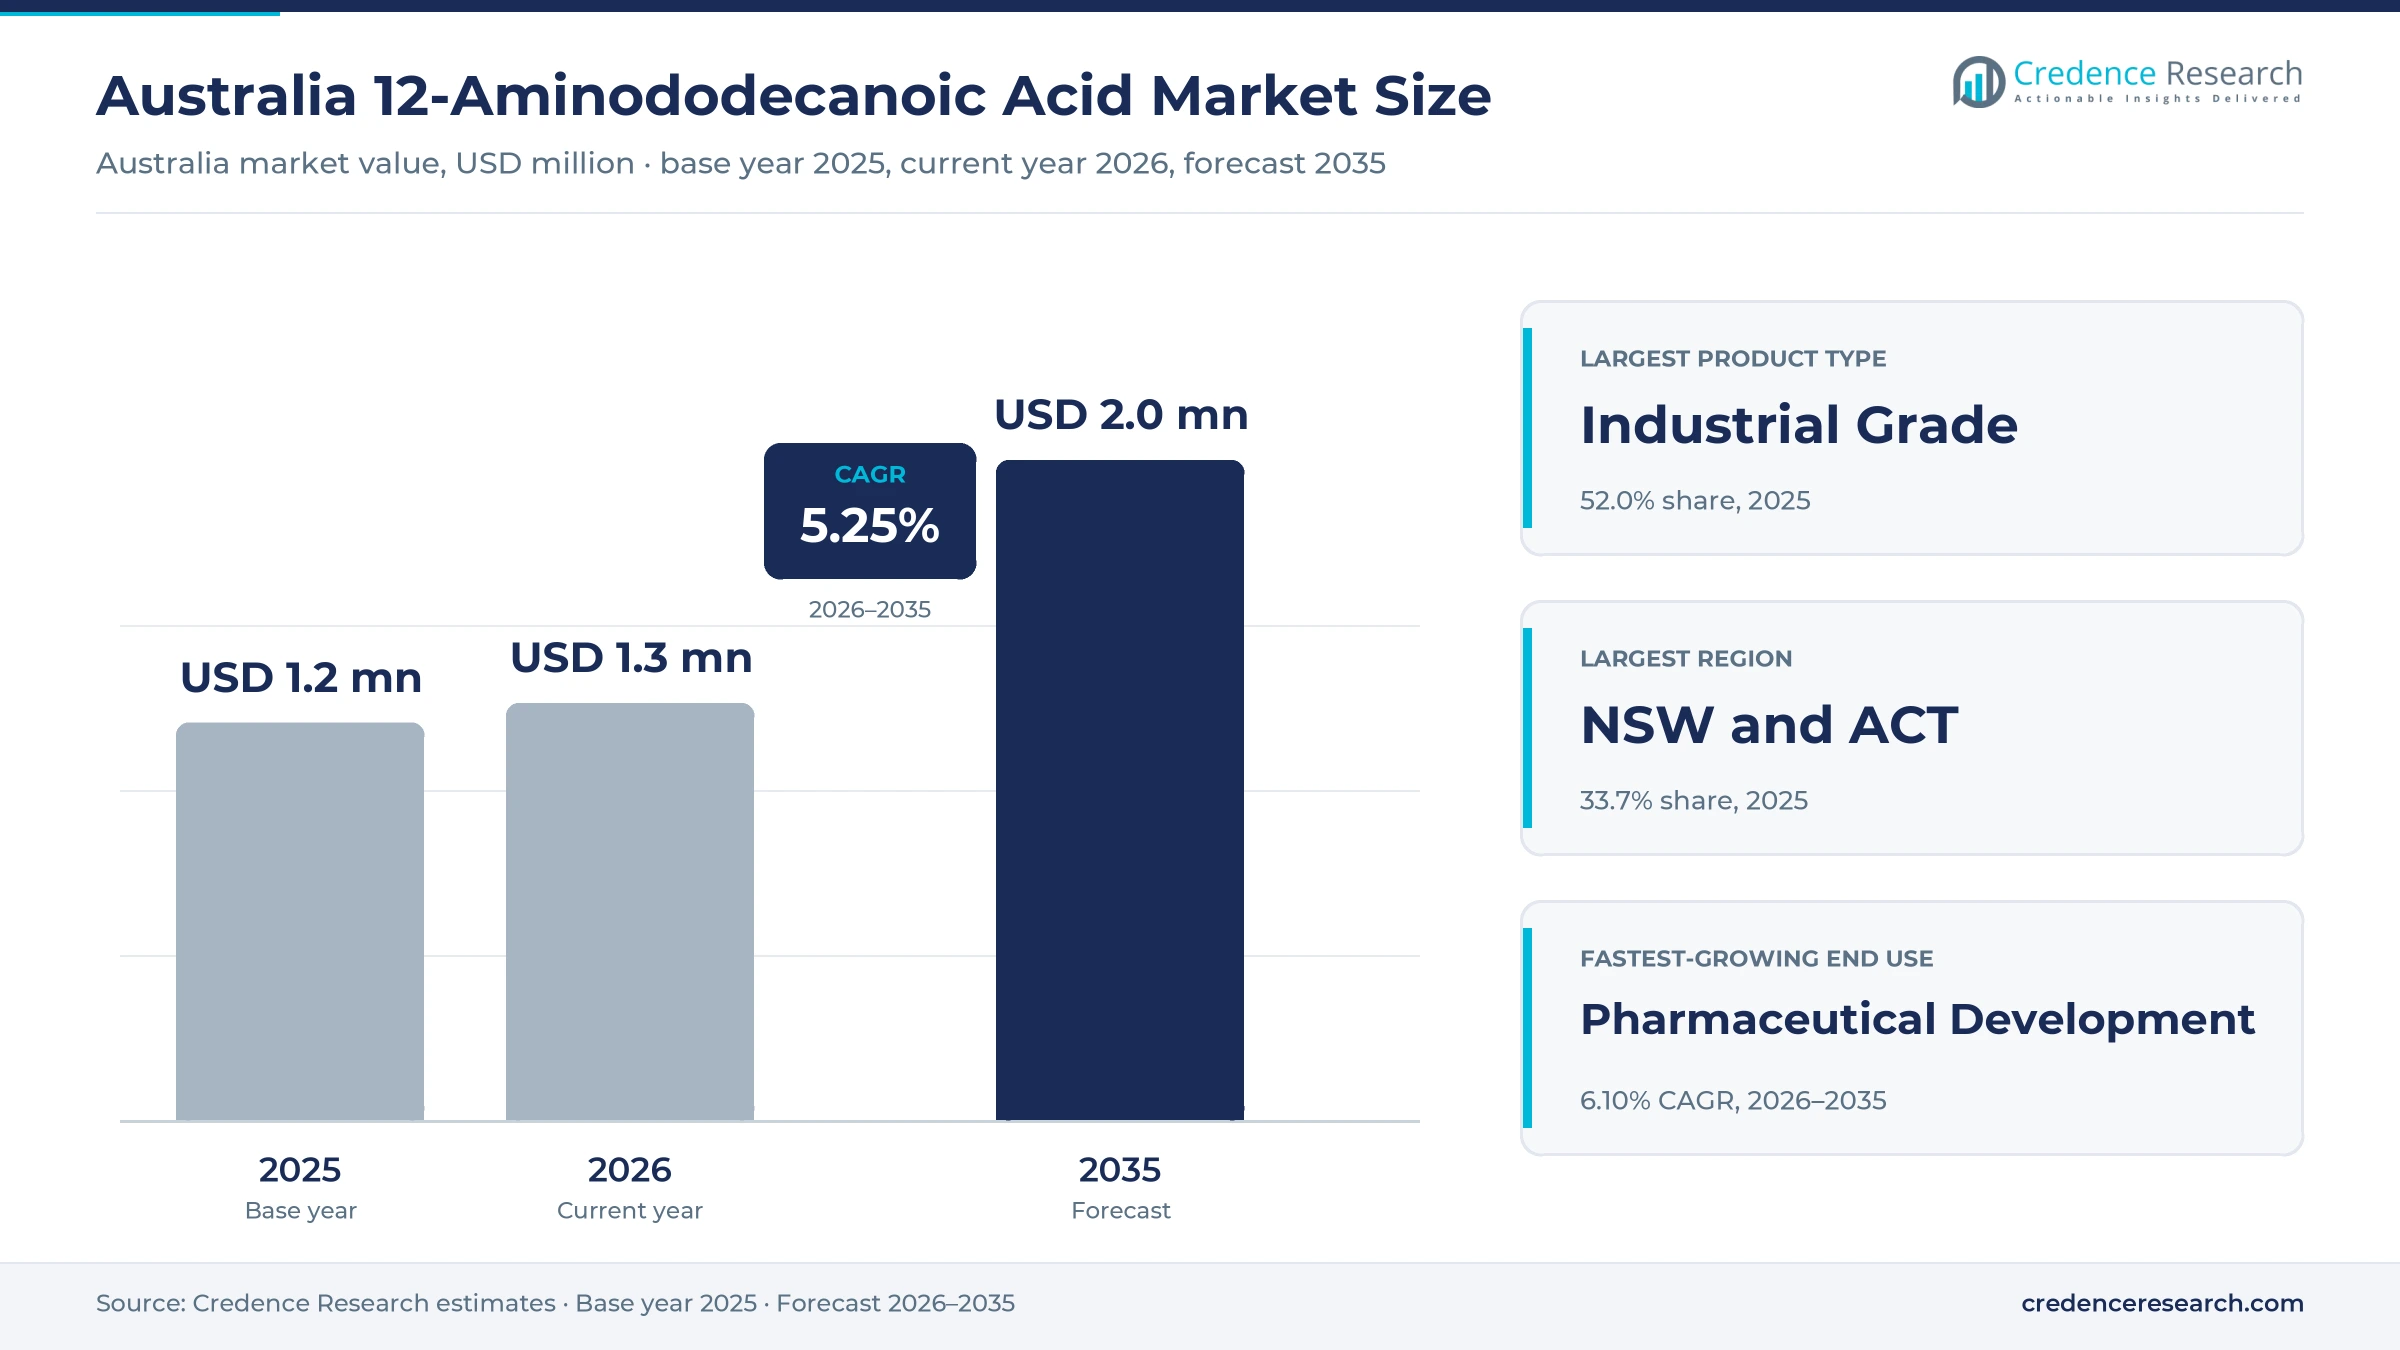
The Australia 12-aminododecanoic acid market was valued at USD 1.21 million in 2025 and is projected to increase from USD 1.27 million in 2026 to USD 2.01 million by 2035, registering a CAGR of 5.25% during 2026–2035. Demand comes from specialty polymer and adhesive formulators that use the compound as a C12 building block, and from pharmaceutical developers and university laboratories that buy small packs for synthesis. New South Wales and Australian Capital Territory held the largest regional share, 33.7% in 2025, because the zone carries the largest business research spending in the country. New South Wales and Australian Capital Territory is also the fastest-growing zone at 5.39% a year. Meanwhile, the industrial chemicals regulator AICIS closed consultation in January 2026 on revised categorization guidelines that add 294 chemicals to its high-hazard list in September 2026. As a result, buyers keep relying on imported stock and on distributors that handle chemical compliance on their behalf.
What does the Australian estimate count and exclude?
Sales of 12-aminododecanoic acid, also called 12-aminolauric acid, to users in Australia form the measured value, across industrial, synthesis and research grades. It covers powder supplied in bulk bags for polymer and formulation work as well as gram and kilogram packs sold through laboratory catalogues and specialty chemical distributors.
The estimate excludes finished polyamide 12 resin and powder, laurolactam, other omega-amino acids such as 11-aminoundecanoic acid, and compounded parts made from these polymers. The value chain runs from producers in Asia and Europe through global catalogue houses and local distributors to polymer makers, formulators, contract developers and research laboratories.
Australia 12-Aminododecanoic Acid Market Insights
- The market was valued at USD 1.21 million in 2025 and is projected to reach USD 2.01 million by 2035, registering a CAGR of 5.25% during 2026–2035.
- New South Wales and Australian Capital Territory held 33.7% of 2025 value, as New South Wales alone recorded A$9,630 million of business R&D in 2023-24.
- Industrial grade material led with 52.0% of 2025 value, because polymer and adhesive users buy in larger lots than laboratories.
- Australia imported USD 38.8 million of the wider HS 292249 amino-acid group in 2024, and China supplied about USD 27.4 million of it, according to UN Comtrade.
- AICIS will add 294 chemicals to its high-hazard list in September 2026, which raises the compliance work that distributors carry for small importers.
Industrial grade leads while drug development grows fastest
Why does industrial grade hold the largest share?
Based on product type, the market is categorized into industrial grade, synthesis grade and research grade. Industrial Grade led with a 52.0% share of 2025 value, because polymer and adhesive users order powder in kilogram lots at a lower price per gram. Synthesis Grade grows fastest at 5.81% a year, as drug developers need documented purity, such as the 98.0% minimum that Tokyo Chemical Industry lists, for repeatable synthesis.
Which industries account for most purchases?
Based on end-use industry, the market is categorized into specialty polymer manufacturing, adhesive and coating manufacturing, pharmaceutical development and academic and public research. Specialty Polymer Manufacturing led with a 41.0% share of 2025 value, because the compound is a monomer for polyamide 12 and related copolyamides. Pharmaceutical Development grows fastest at 6.10% a year, as health R&D spending by Australian businesses rose to A$3,673 million in 2023-24.
How do polymer and synthesis uses differ?
Based on application, the market is categorized into polymer synthesis, reactive formulation, organic synthesis and materials research. Polymer Synthesis led with a 40.0% share of 2025 value, because condensation into polyamide chains uses the largest quantities per batch. Organic Synthesis grows fastest at 5.99% a year, as chemists use the compound as a long spacer in peptide and linker chemistry, which Sigma-Aldrich lists as solution-phase peptide synthesis.
How do Australian buyers source the material?
Based on sales channel, the market is categorized into specialty chemical distribution, laboratory catalogue sales and direct overseas procurement. Specialty Chemical Distribution led with a 48.0% share of 2025 value, because local distributors hold stock and manage import paperwork for formulators. Direct Overseas Procurement grows fastest at 5.84% a year, as larger users order direct from Asian producers to cut cost on repeat volumes.
| Segment Group | Leading Sub-segment | Share, 2025 | Fastest-growing Sub-segment | CAGR, 2026–2035 |
|---|---|---|---|---|
| By Product Type | Industrial Grade | 52.0% | Synthesis Grade | 5.81% |
| By End-Use Industry | Specialty Polymer Manufacturing | 41.0% | Pharmaceutical Development | 6.10% |
| By Application | Polymer Synthesis | 40.0% | Organic Synthesis | 5.99% |
| By Sales Channel | Specialty Chemical Distribution | 48.0% | Direct Overseas Procurement | 5.84% |
Request a Free Sample
Fill in your details and we'll send you a free sample report.
- Sample data tables & charts
- Research methodology
Polymer work, lab synthesis and catalogue access lift demand
How does specialty polymer synthesis set the volume base?
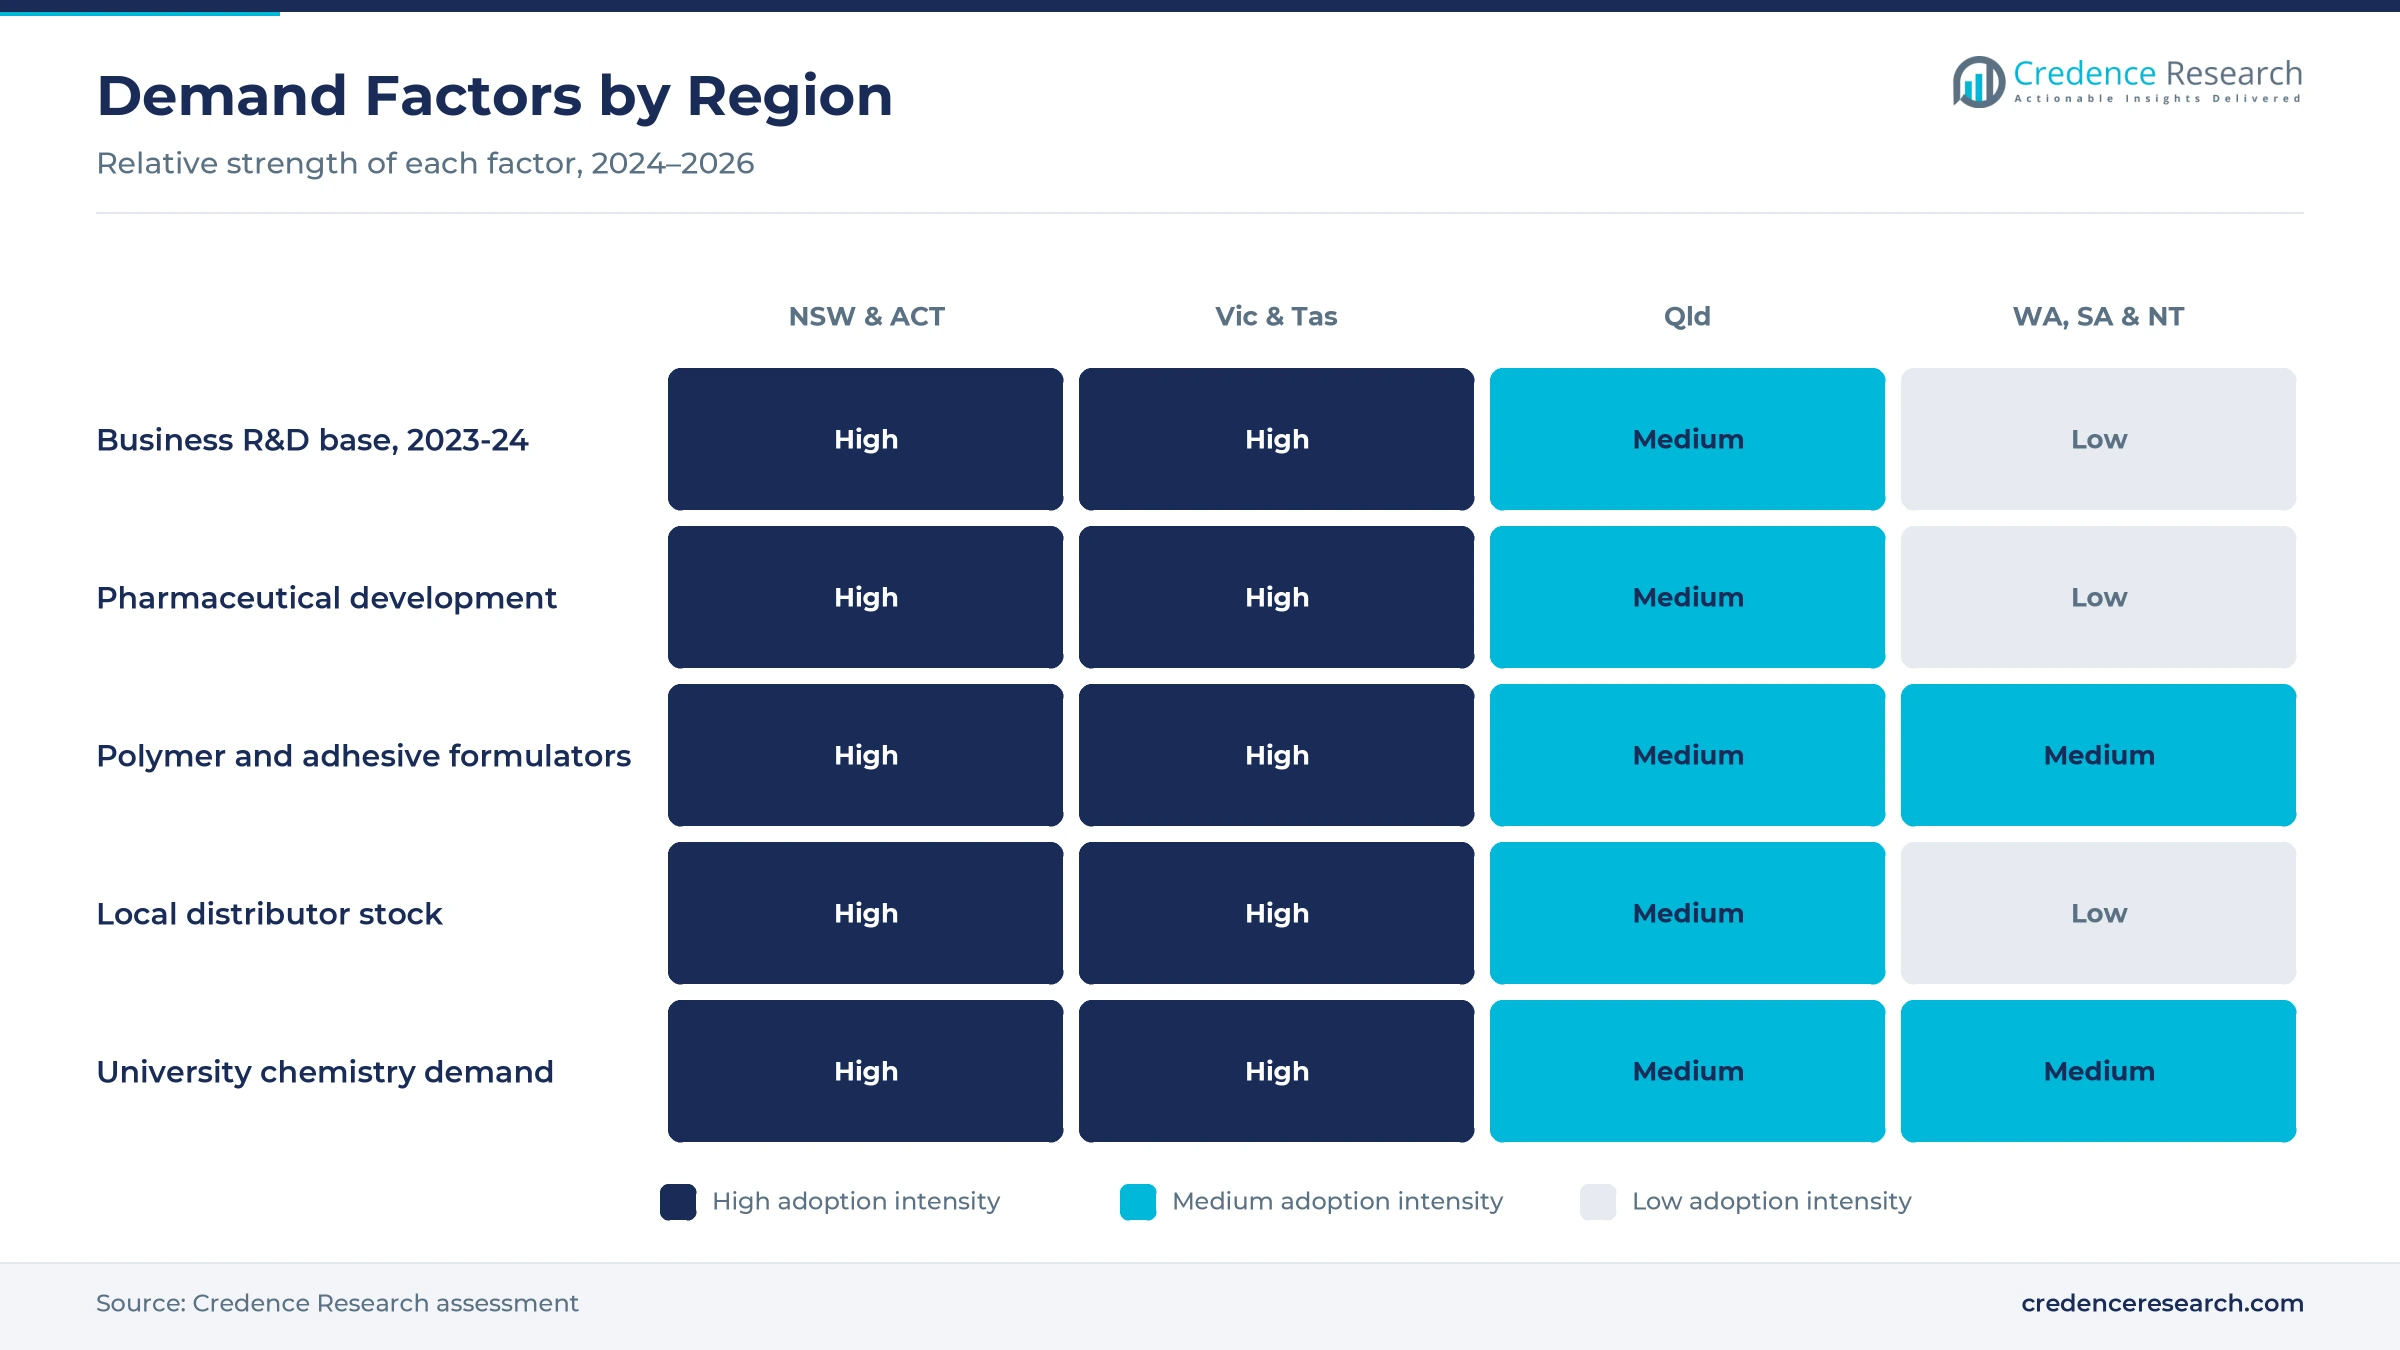
The compound is a direct monomer for polyamide 12 and related copolyamides, which makes polymer and formulation users the largest buyers by weight. The European Chemicals Agency lists 12-aminododecanoic acid in the 100 to 1,000 metric ton REACH band, and registrants describe its use as a monomer for polymers, adhesives and sealants and as a laboratory reagent. Evonik showed that omega-amino lauric acid made from palm kernel oil yields a polyamide 12 identical to the laurolactam route. Australia imported USD 24.9 million of primary polyamides under HS 390810 in 2024, according to UN Comtrade. As a result, specialty polymer manufacturing held a 41.0% share of 2025 value, the largest end-use group.
Why does research and synthesis spending widen demand?
Business R&D in Australia reached A$24,410 million in 2023-24, according to the Australian Bureau of Statistics, up from A$20,642 million in 2021-22, and laboratory orders follow that spending. Most laboratory buyers order 25 g to 500 g packs for repeat experiments rather than bulk lots. Manufacturing accounted for A$5,047 million of the 2023-24 total, and health-related research rose to A$3,673 million from A$2,871 million. Sigma-Aldrich lists its 95% grade for solution-phase peptide synthesis, which links the compound to drug discovery work. In turn, pharmaceutical development grows at 6.10% a year, the fastest end-use group, while academic laboratories keep a steady base of small orders.
How do distribution and import rules shape access?
No verified plant makes the compound in Australia at commercial scale, so every kilogram is introduced under the federal industrial chemicals scheme. AICIS lets a chemical used only for research enter as an exempted introduction of up to 250 kg a registration year when it is not a nanoscale material, or 10 kg otherwise. Tokyo Chemical Industry runs an Australian storefront but lists no office in Oceania, while Merck Life Science operates from Bayswater in Victoria. Thermo Fisher Scientific also supplies chemicals and reagents from Scoresby in Victoria. Therefore, specialty chemical distribution held a 48.0% share of 2025 value, because local stock and compliance support matter more than unit price.
Does import reliance on China tie demand to trade flows?
Australia imported USD 38.8 million of HS 292249 goods in 2024, according to UN Comtrade, a customs group that includes 12-aminododecanoic acid among many other amino acids. China supplied about USD 27.4 million of the 2024 total, the United States about USD 6.3 million and the Netherlands about USD 1.3 million. Because the code covers many amino acids, the figures show supply routes rather than the compound alone. Even so, the pattern shows how closely local buyers depend on Asian producers. As a result, direct overseas procurement grows at 5.84% a year, as repeat buyers place scheduled orders with Chinese producers.
Powder printing and peptide linkers widen the buyer base
Is powder bed printing raising interest in C12 polyamides?
Nylon 12 is the standard powder for HP Multi Jet Fusion machines, and the rise of these printers in Australian universities and bureaus is increasing interest in C12 chemistry. The University of Technology Sydney runs an HP Jet Fusion 5200 printing Nylon-12 in its ProtoSpace facility, which produces most of its printed parts. GoProto announced a Melbourne additive manufacturing site with an HP Jet Fusion 4210 in December 2018 and later doubled its nylon printing capacity. Evonik expanded its polyamide 12 powder capacity at Marl by 50% in February 2018, mainly for 3D printing. However, Australian printers buy finished powder, so the monomer gains mainly through materials research rather than direct powder sales.
Why is peptide and linker chemistry a rising use?
Chemists value the twelve-carbon chain as a long, flexible spacer between an amine and an acid group, and this shift toward linker designs is increasing laboratory orders. Sigma-Aldrich lists its 12-aminododecanoic acid for solution-phase peptide synthesis, and Tokyo Chemical Industry files the compound under peptide chemistry, cross-linkers and bioconjugation reagents. Tokyo Chemical Industry also lists it as a capping agent for colloidal quantum dot research, which extends use into materials laboratories. Because each project needs only grams, buyers value purity records and fast delivery over price. As a result, organic synthesis grows at 5.99% a year, the fastest application, while synthesis grade material grows at 5.81%.
Can contract developers open a scheduled supply niche?
Health-related business R&D in Australia rose 28% between 2021-22 and 2023-24, from A$2,871 million to A$3,673 million, according to the ABS, which is increasing the pool of contract development work. Professional, scientific and technical services, the industry that includes contract research, spent A$9,171 million on R&D in 2023-24. Contract developers repeat the same synthesis across client projects, so they prefer scheduled contract supply to one-off catalogue orders. Distributors that hold documented lots for contract pharmaceutical manufacturing clients can therefore win multi-year agreements under the scheduled contract supply model. This gives local suppliers their clearest volume upside outside polymer and adhesive work.
Will bio-based routes create a low-carbon sourcing option?
Evonik commissioned a pilot plant in Slovakia in early 2013 that converts palm kernel oil into omega-amino lauric acid, an emerging alternative to butadiene-based routes. Chemical Engineering reported in 2014 that the route uses 100% renewable raw materials and gives an identical polyamide 12. The European Chemicals Agency also lists the compound as an authorized substance for plastic food-contact materials in the EU, which supports use in regulated export goods. Buyers that report emissions are increasingly asking suppliers for the origin of their monomers. As a result, formulators of high-performance polyamides that supply export customers may pay more for documented bio-based lots.
Import lead times and thin local volumes limit growth
How do long import lead times affect small buyers?
Tokyo Chemical Industry ships listed packs within days but states that other orders take about two to four weeks, which hurts buyers with short projects. Most material ships from Japan, China or Europe rather than from local stock. Laboratories that run short projects may switch to a different spacer molecule when stock is not on hand. Distributors reduce this risk by holding common pack sizes, although that ties up working capital in a slow-moving product that may sit on shelves for months.
Why do thin local volumes keep prices high?
Each small order carries freight, customs and compliance costs that do not fall with order size, so landed prices stay high. Australia has no verified commercial producer of the compound, so buyers cannot draw on local scale or shared freight. Polymer users that need large volumes can import resin instead, which further limits monomer sales. As a result, suppliers serve a small, fragmented pool of laboratory and formulation buyers, and few can justify holding large safety stocks.
Do chemical compliance changes add cost for importers?
AICIS announced a consultation on its 2026 guideline revisions in November 2025, closed it on Jan. 28, 2026, and will add 294 chemicals to its high-hazard list in September 2026. Each revision means importers must recheck how their introductions are categorized. Small users that import directly must also keep records and report volumes. Many therefore buy through distributors that already manage these obligations, which concentrates trade in a few hands and raises the cost of switching suppliers.
Why does imported resin limit monomer volumes?
Most Australian part makers buy polyamide 12 pellets or powder rather than running their own polymerization. Australia imported USD 24.9 million of primary polyamides in 2024, compared with only a small monomer trade. Laurolactam also competes as the main global route to polyamide 12, and Evonik's Marl plant runs from butadiene through to the polymer. Therefore, monomer suppliers depend on niche copolyamide, adhesive and research users rather than on mass polymer volumes.
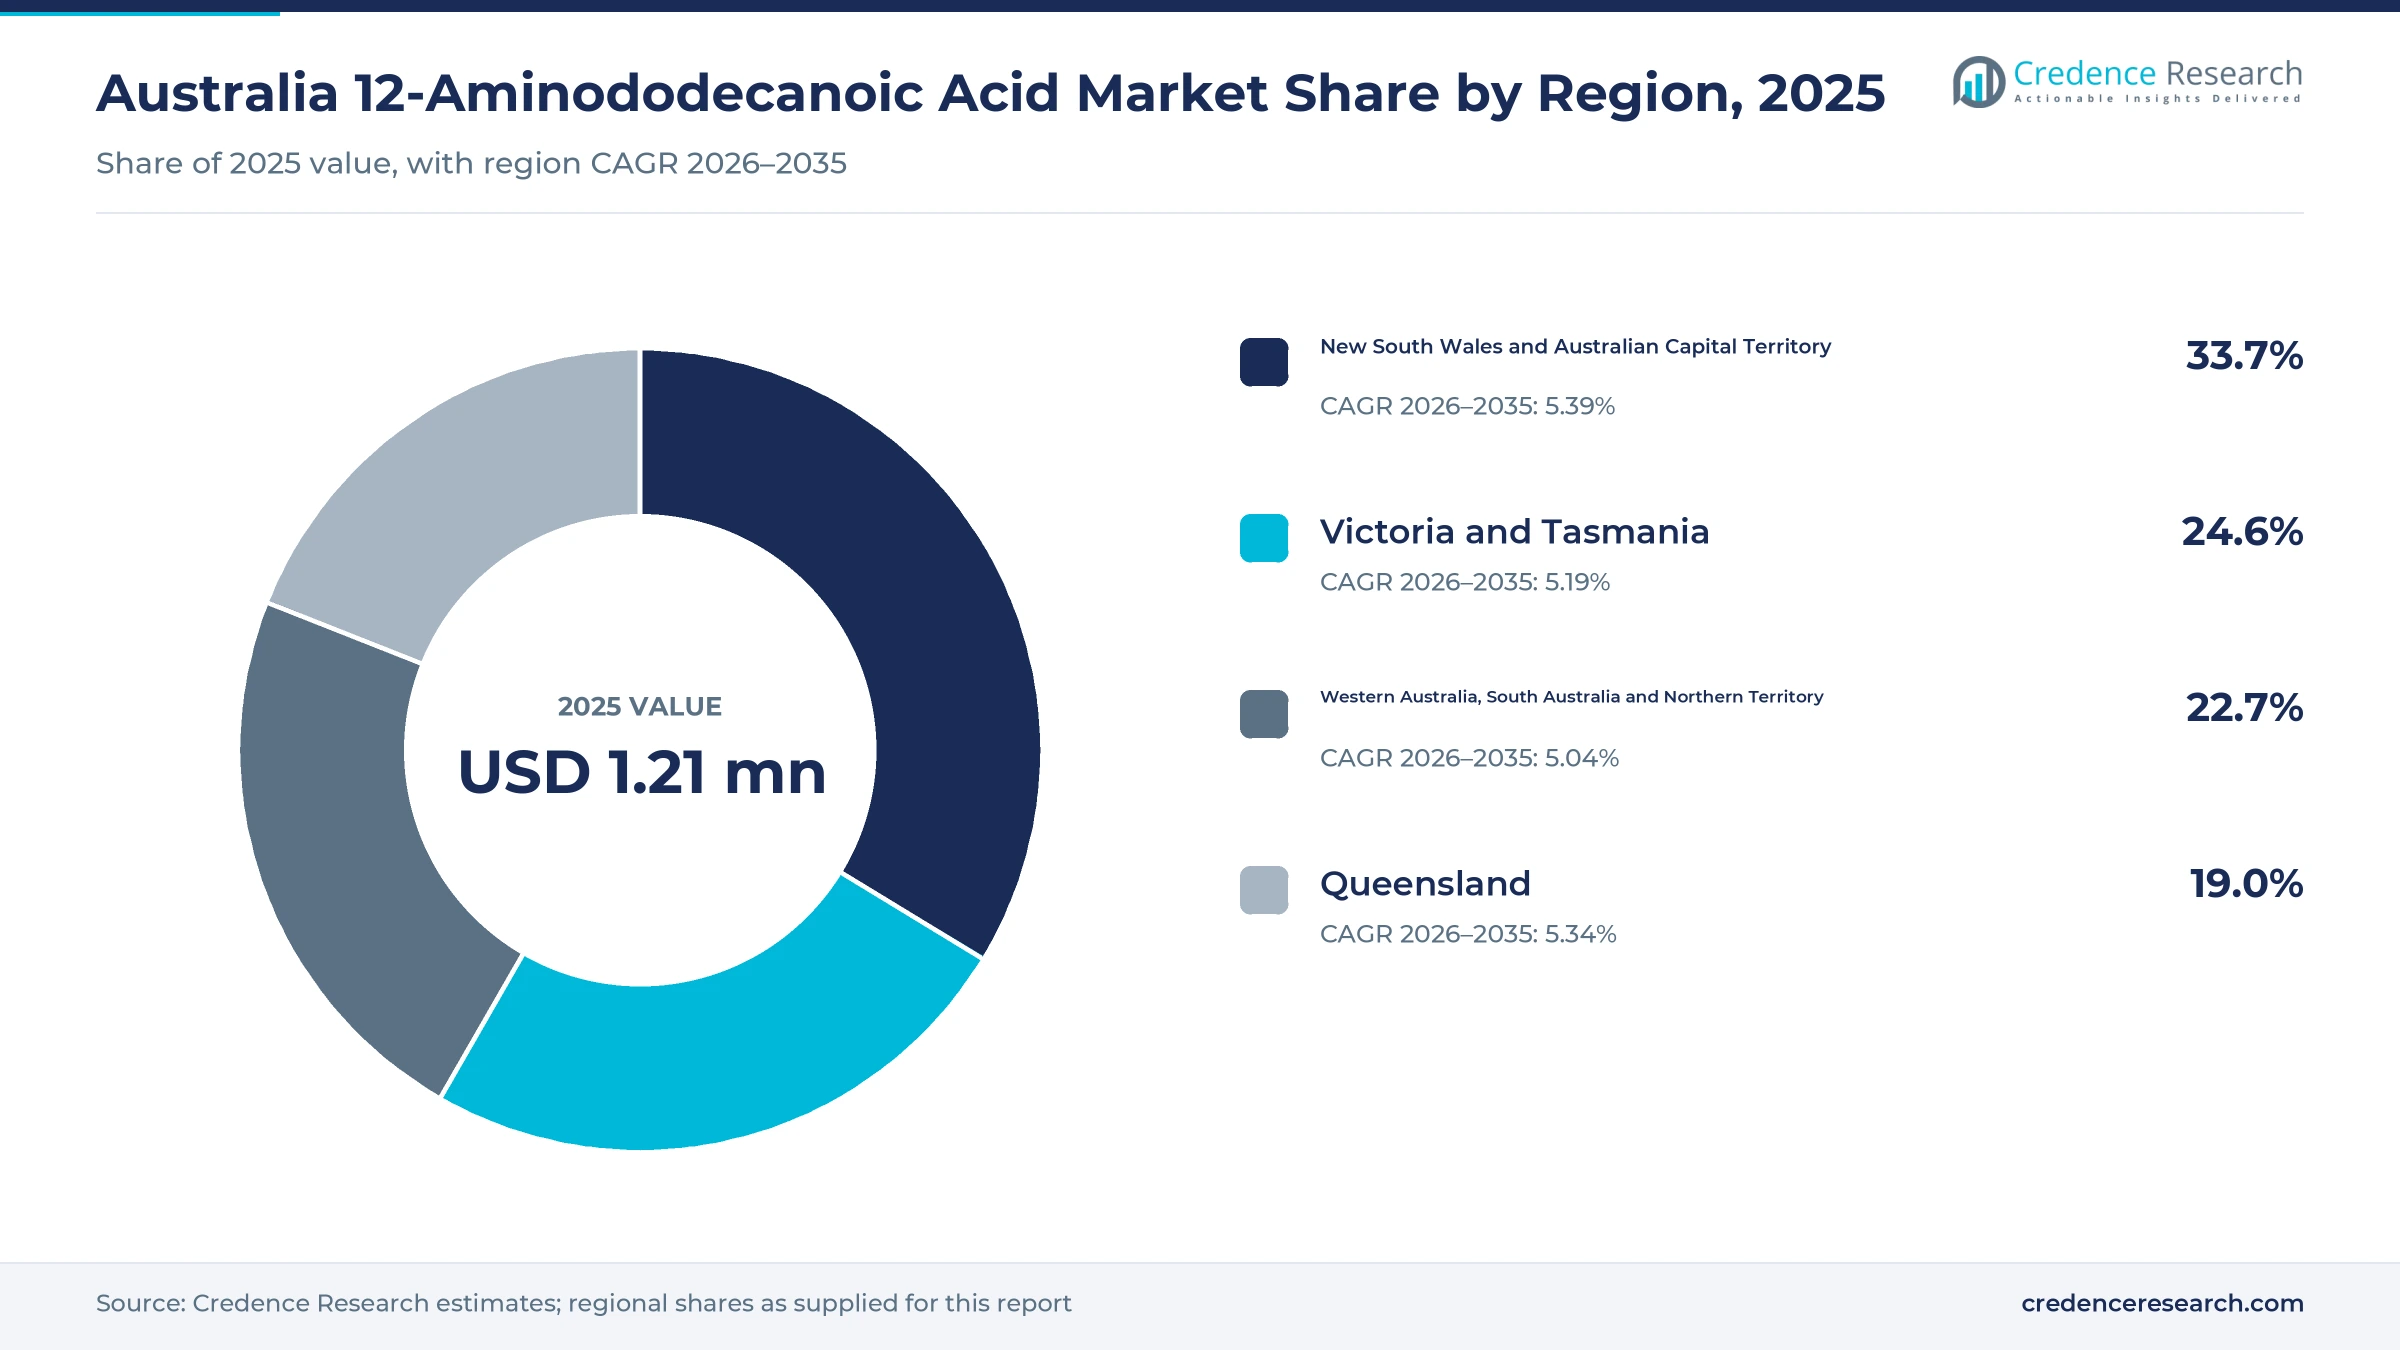
NSW and ACT lead on research spending and buyer density
| Region | Value, 2025 (USD million) | Share, 2025 | CAGR, 2026–2035 |
|---|---|---|---|
| New South Wales and Australian Capital Territory | 0.408 | 33.7% | 5.39% |
| Victoria and Tasmania | 0.298 | 24.6% | 5.19% |
| Western Australia, South Australia and Northern Territory | 0.275 | 22.7% | 5.04% |
| Queensland | 0.230 | 19.0% | 5.34% |
Why does the Sydney and Canberra zone lead demand?
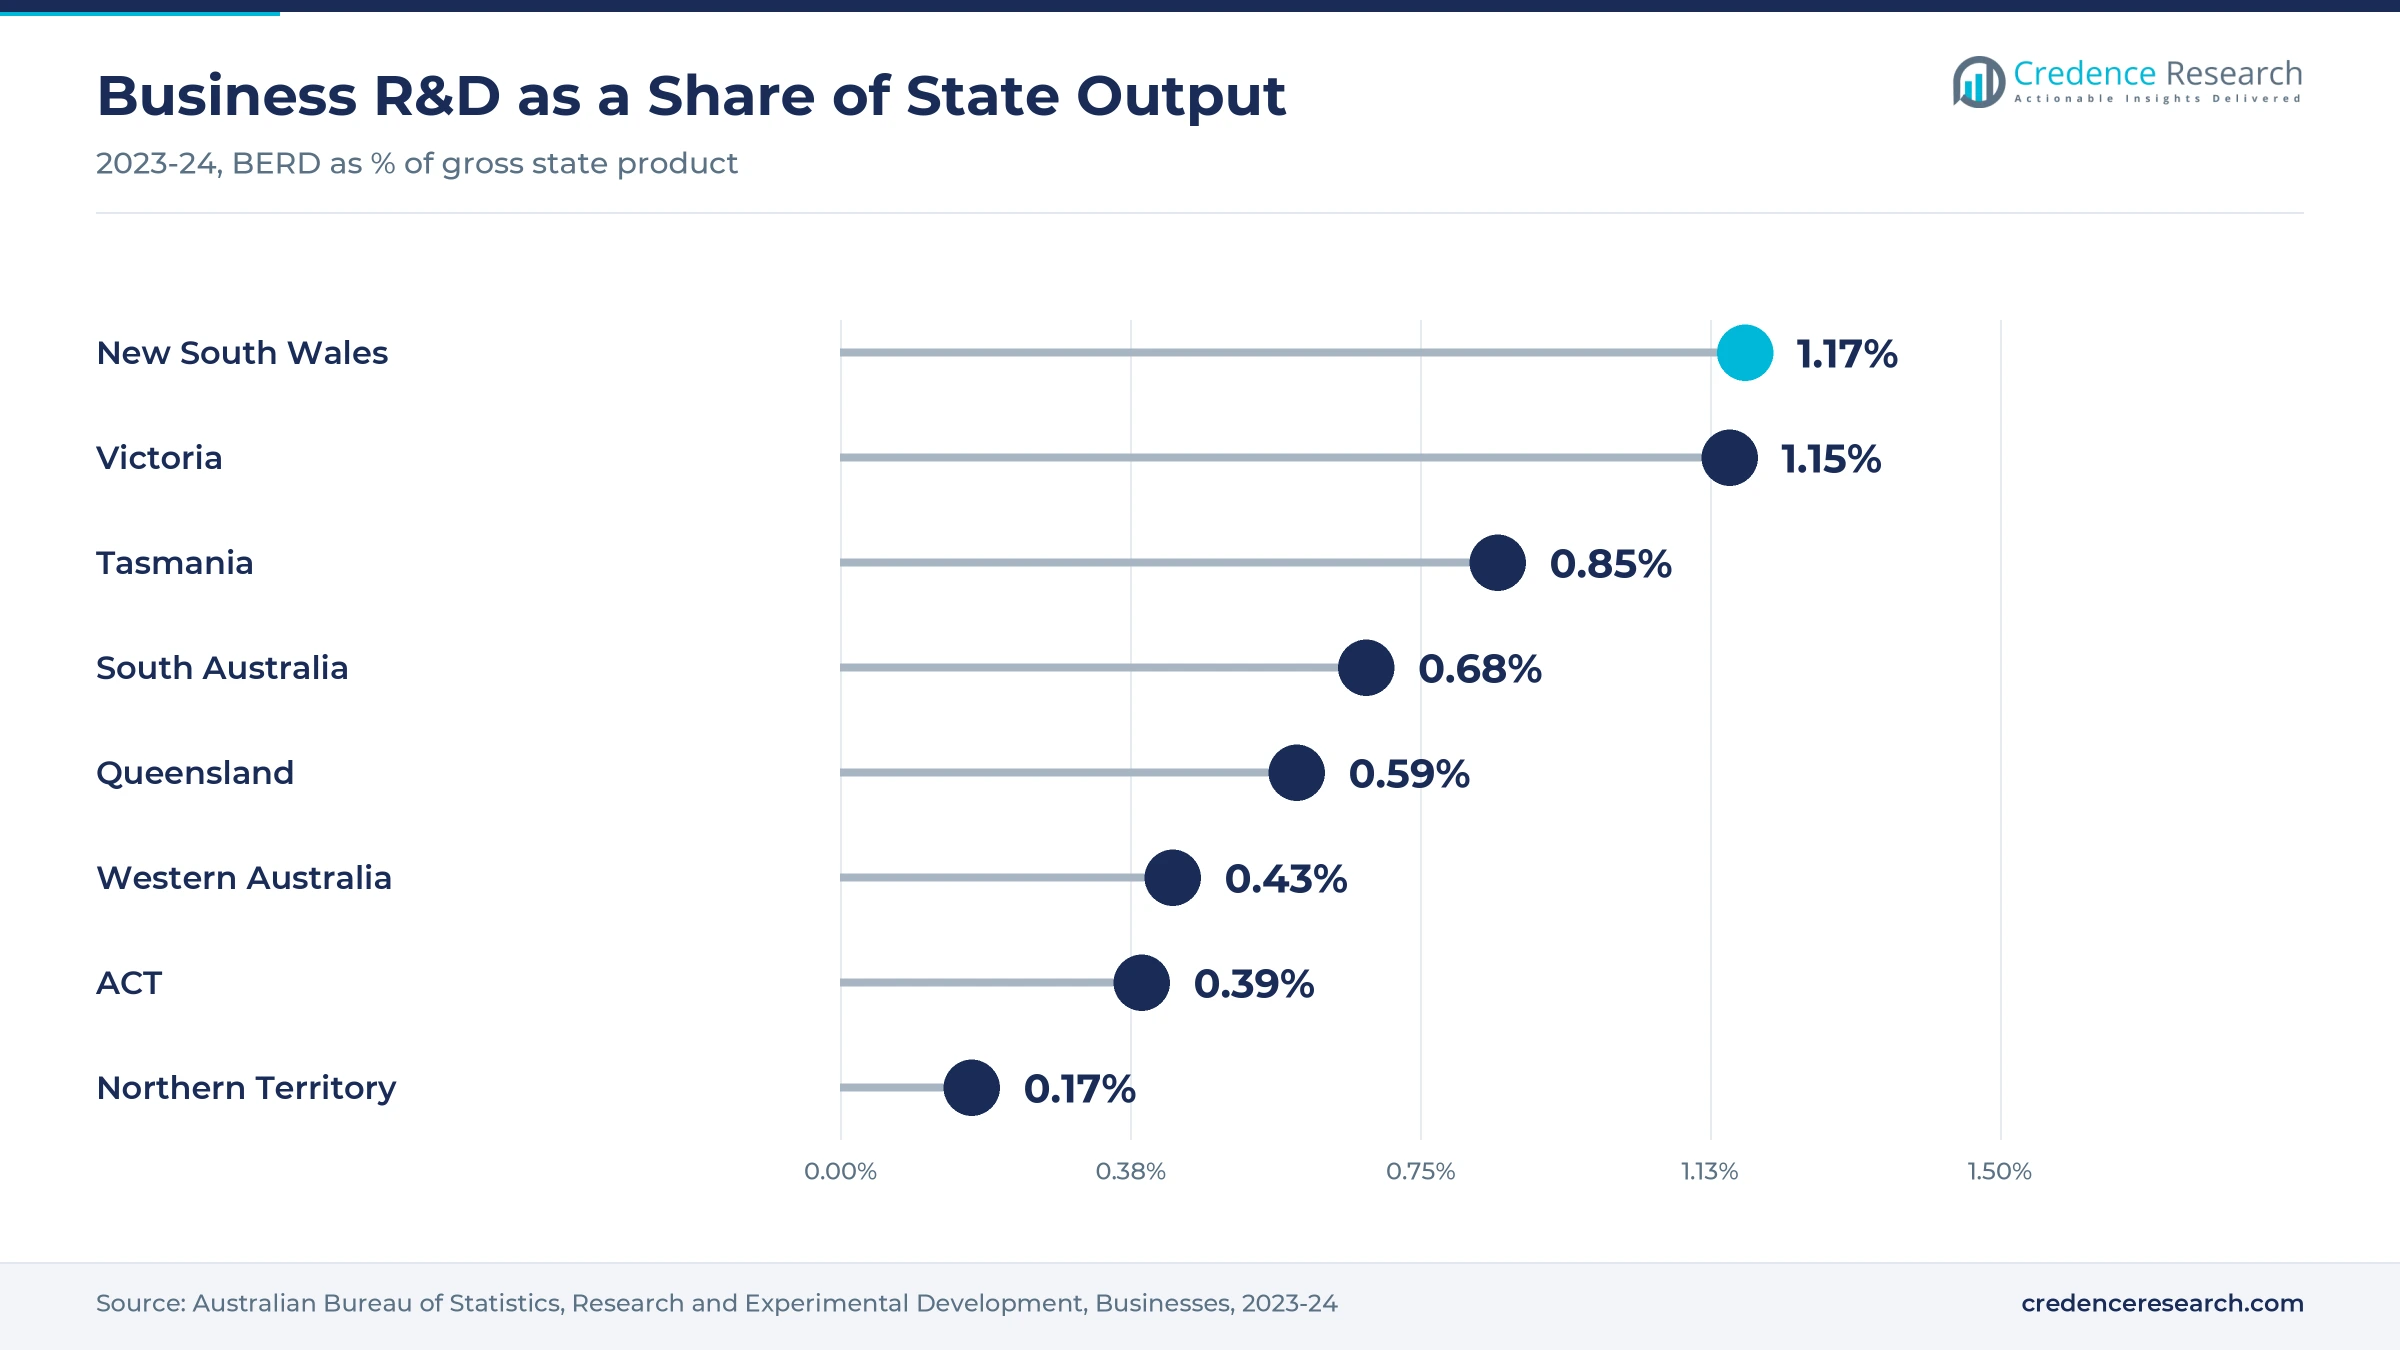
New South Wales and Australian Capital Territory held a 33.7% share of 2025 value and grows at 5.39% a year, the fastest zone. New South Wales recorded A$9,630 million of business R&D in 2023-24, or 39% of the national total, and the largest increase of any state, up A$2,130 million. Its business R&D equaled 1.17% of gross state product, the highest ratio in the country. Sydney and Canberra also host major universities, and UTS ProtoSpace in Sydney prints Nylon-12 parts.
Where do Melbourne laboratories fit in the picture?
Victoria and Tasmania held a 24.6% share of 2025 value and grows at 5.19% a year. Victoria recorded A$6,953 million of business R&D in 2023-24, or 28% of the national total, equal to 1.15% of gross state product. Merck Life Science and Thermo Fisher Scientific both operate from eastern Melbourne, which shortens delivery for local laboratories. Tasmania added research intensity, with its ratio rising 0.09 percentage points to 0.85%.
What supports orders from the northern state?
Queensland held a 19.0% share of 2025 value and grows at 5.34% a year. Business R&D in Queensland equaled 0.59% of gross state product in 2023-24, up from 0.56% in 2021-22, according to the ABS. Demand comes mainly from university chemistry groups and from formulators of structural adhesives and coatings, which buy small lots through distributors based in the southern states.
How do the western and central states add demand?
Western Australia, South Australia and Northern Territory held a 22.7% share of 2025 value and grows at 5.04% a year. South Australia recorded the largest rise in research intensity, with business R&D up 0.16 percentage points to 0.68% of gross state product in 2023-24. Western Australia stood at 0.43% and the Northern Territory at 0.17%, so the zone's share rests on three economies combined rather than on research intensity.
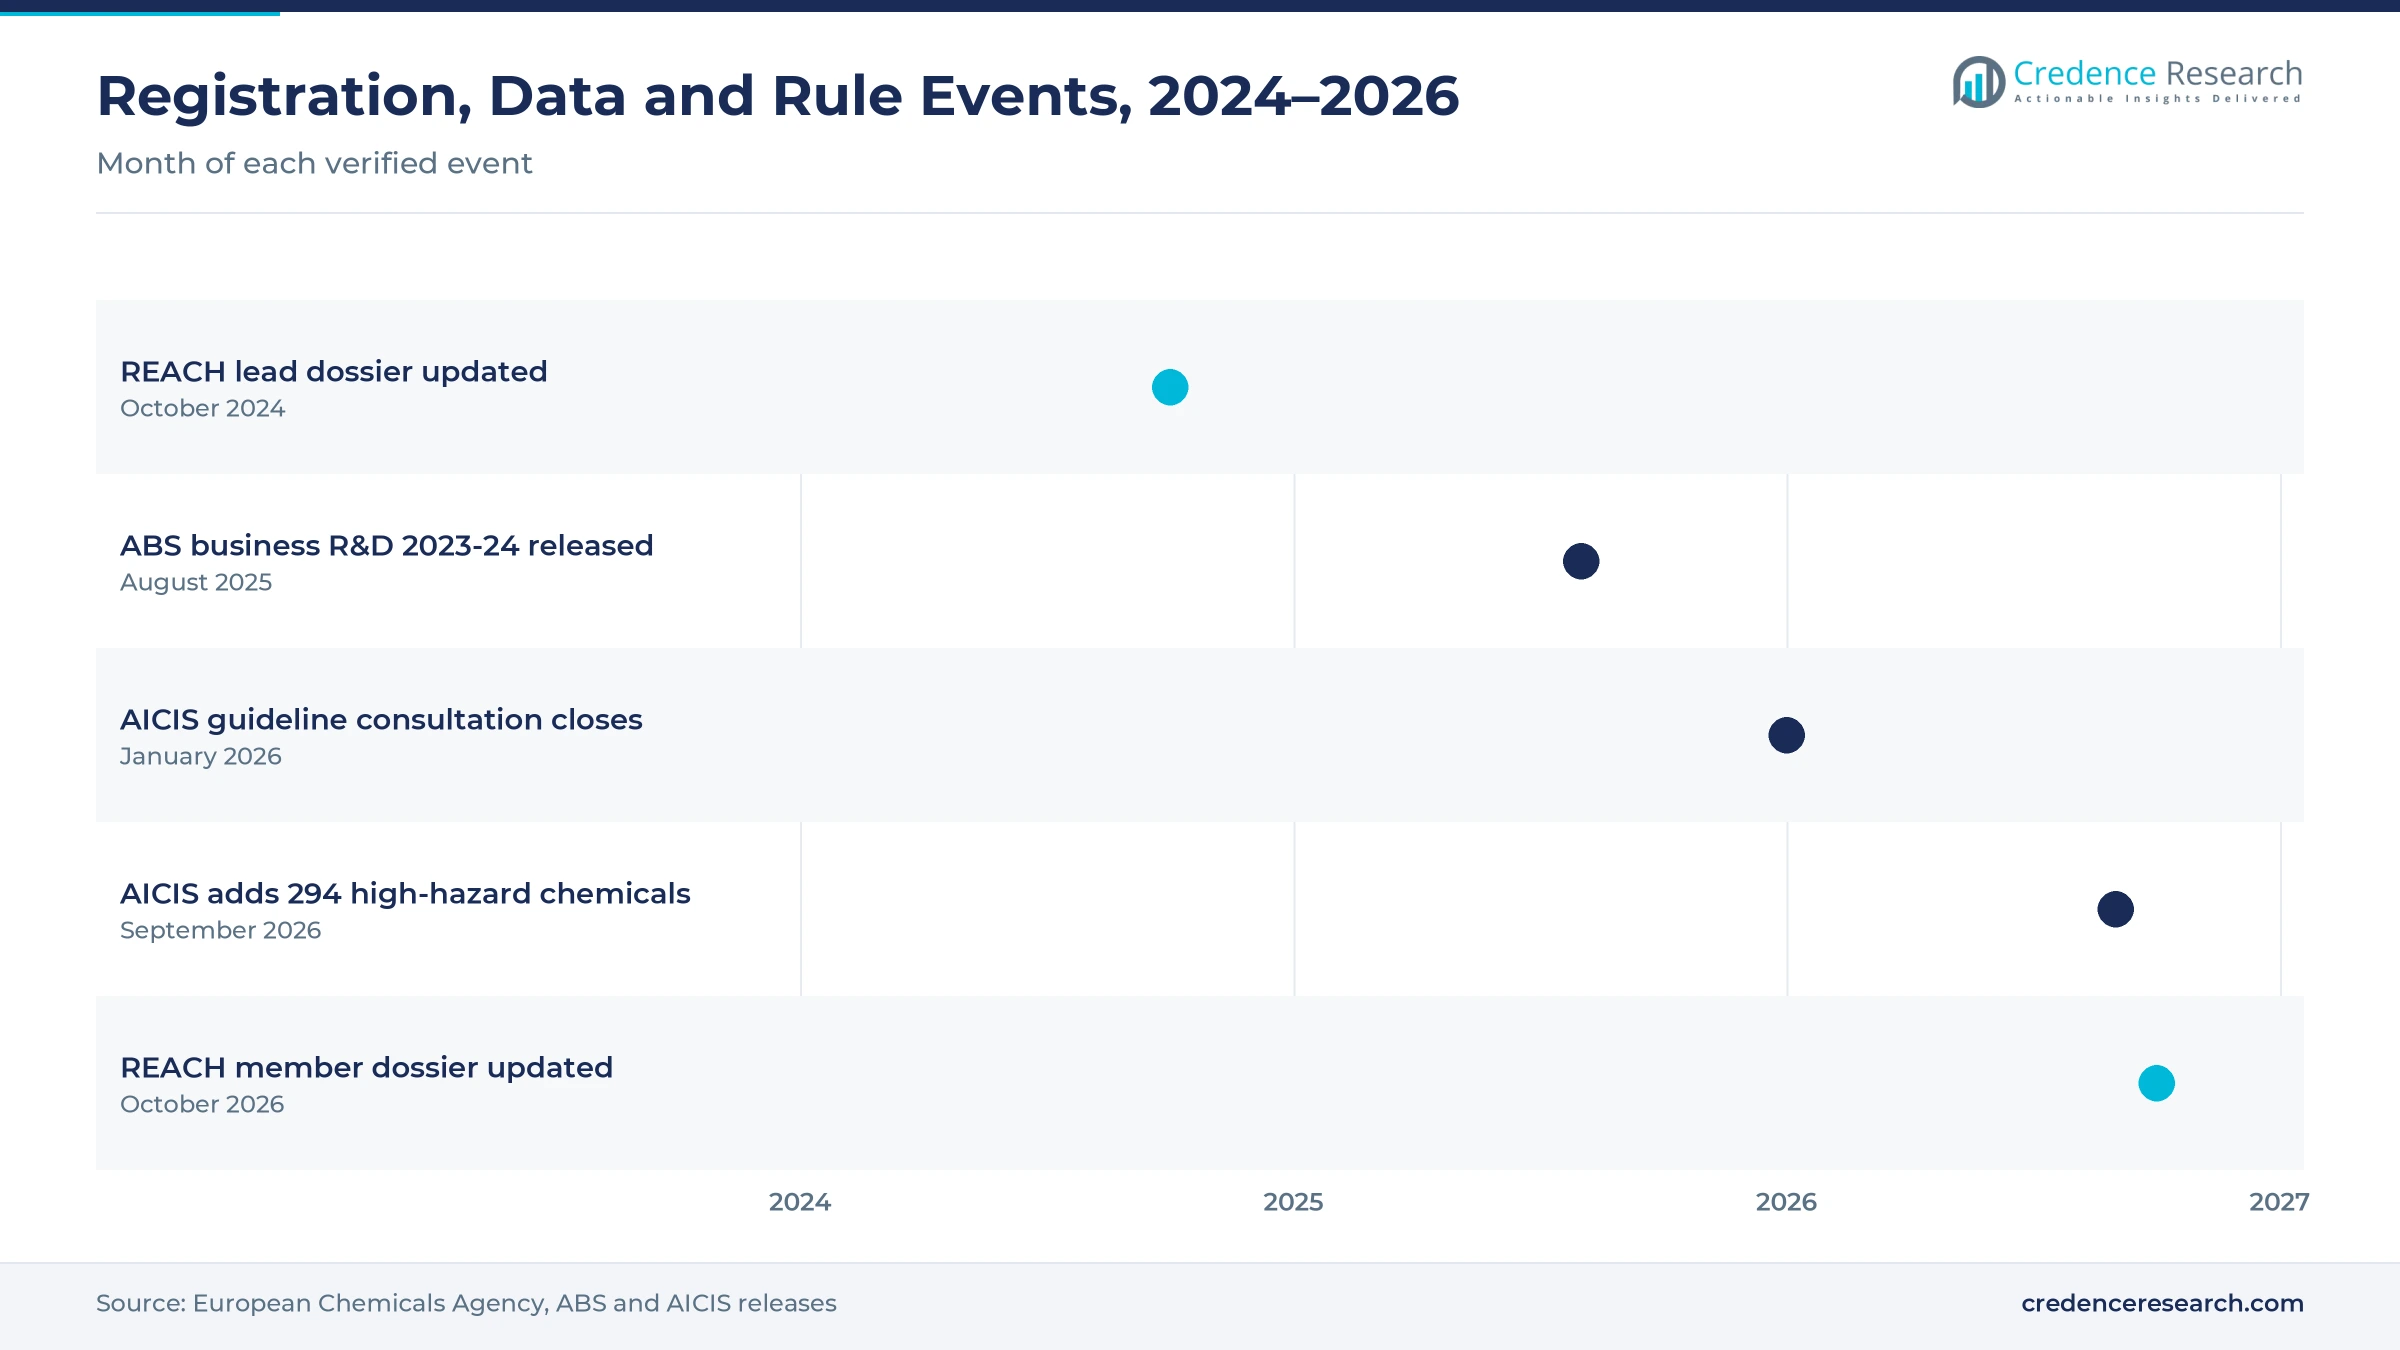
Registration, trade and rule updates, 2024–2026
| Development | Status and market relevance |
|---|---|
| In October 2024, the lead REACH registrant updated its joint dossier for 12-aminododecanoic acid with the European Chemicals Agency. | Keeps the compound registered for supply from EU producers |
| In August 2025, the ABS released business R&D data showing A$24,410 million of spending in 2023-24. | Confirms a larger research base for laboratory buyers |
| In January 2026, AICIS closed consultation on revisions to its industrial chemicals categorization guidelines. | Sets new compliance checks for importers from September 2026 |
| In September 2026, AICIS scheduled the addition of 294 chemicals to its list of chemicals with high hazard classifications. | Raises compliance work handled by distributors |
| In October 2026, a member registrant updated its REACH dossier for 12-aminododecanoic acid. | Maintains a third active EU registration for the monomer |
Bio-based routes and purity grades shape supply
- Bio-based routes convert palm kernel oil into omega-amino lauric acid by a biotechnological process, avoiding butadiene and cyclododecatriene.
- Purity grading separates industrial powder from synthesis lots with a 98.0% minimum by titration and research packs for analytical work.
- Powder bed printing relies on nylon 12 powder, which links monomer research to the wider 3D printing materials supply chain.
- Long-chain spacers use the twelve-carbon backbone to separate functional groups in peptides, linkers and quantum dot capping layers.
Need a Custom Version of This Report?
Tailor the scope, geography, or segments to your exact requirements.
- Custom geography or segment scope
- Direct access to our analyst team
Catalogue suppliers compete on stock, purity and delivery
Competition is led by global catalogue houses that sell into Australia through local subsidiaries, storefronts and distributors, because no verified local producer supplies the compound. Merck sells its Aldrich 95% grade through the Sigma-Aldrich storefront and operates Merck Life Science Pty Ltd from Bayswater in Victoria. Tokyo Chemical Industry offers a grade of at least 98.0% in 25 g and 500 g packs through its Australian site, with no office listed in Oceania. Thermo Fisher Scientific supplies chemicals and reagents from Scoresby in Victoria. Enamine and Biosynth serve global synthesis buyers, although no Australian activity for them was verified. Suppliers compete on purity documentation, local stock, delivery time and the ability to handle import compliance for customers.
Companies profiled and their roles in this market
| Company | Type | Role in the market |
|---|---|---|
| Merck / Sigma-Aldrich | Laboratory chemical supplier | Aldrich 95% grade for peptide synthesis; Merck Life Science Pty Ltd in Bayswater, Victoria |
| Tokyo Chemical Industry | Fine chemical producer | Grade of at least 98.0% in 25 g and 500 g packs through its Australian storefront |
| Thermo Fisher Scientific | Laboratory chemical supplier | Chemicals and reagents supplied from Scoresby, Victoria |
Credence Research view on a small import niche
Credence Research's view is that the Australian market will stay a small import niche that grows slightly faster than the national research base. Polymer and adhesive formulators provide the volume, while drug developers and universities add the growth through higher-purity packs. Suppliers that hold local stock and manage AICIS obligations for customers hold an advantage over direct importers. However, the absence of local production and the option to import finished resin will keep annual value in the low single-digit millions.
Trade data, R&D spending and catalogue checks behind it
The report uses 2025 as the base year for every value, share and growth rate. Market values come from the Credence Research model, and the 2025 value was set by Credence Research in line with the 2026 value and the forecast growth path. Zone shares were supplied for this report, and segment splits and growth rates are Credence Research estimates. Sources used are UN Comtrade import data, ABS business R&D statistics, AICIS guidance, European Chemicals Agency records and supplier catalogue listings, and no interviews or surveys were used.
Research and polymer users steer modest growth to 2035
Spending is expected to reach USD 2.01 million by 2035, a 5.25% CAGR during 2026–2035, as research and specialty polymer users keep ordering imported material. Growth should remain modest, because most buyers order kilograms or grams and part makers buy finished resin. Synthesis grades, contract developers and direct imports should add value at the margin, while prices follow trends in the worldwide engineering nylon trade. Tighter chemical rules would favor established distributors, whereas weaker research budgets would slow demand.
Frequently Asked Questions
How big is the Australia 12-aminododecanoic acid market?
Which region leads spending in Australia?
Which product type holds the largest share?
What is 12-aminododecanoic acid used for?
Is the compound made in Australia?
Which region grows fastest through 2035?
Which companies compete in this market?
What are the main risks for suppliers?
Table of Content
Chapter 1 Market Segmentation
- 1.1 Segmentation Framework
- 1.1.1 Product and Service Classification
- 1.1.2 Application and End-Use Classification
- 1.1.3 Technology and Solution Classification
- 1.1.4 Customer and Distribution Channel Classification
- 1.1.5 Geographic Segmentation
- 1.1.6 Market Segment Definitions and Boundaries
- 1.2 By Product Type
- 1.2.1 Industrial Grade
- 1.2.2 Synthesis Grade
- 1.2.3 Research Grade
- 1.3 By End-Use Industry
- 1.3.1 Specialty Polymer Manufacturing
- 1.3.2 Adhesive and Coating Manufacturing
- 1.3.3 Pharmaceutical Development
- 1.3.4 Academic and Public Research
- 1.4 By Application
- 1.4.1 Polymer Synthesis
- 1.4.2 Reactive Formulation
- 1.4.3 Organic Synthesis
- 1.4.4 Materials Research
- 1.5 By Sales Channel
- 1.5.1 Specialty Chemical Distribution
- 1.5.2 Laboratory Catalogue Sales
- 1.5.3 Direct Overseas Procurement
Chapter 2 Introduction
- 2.1 Report Objectives and Scope
- 2.2 Product Definition and Industry Terminology
- 2.3 Market Inclusions and Exclusions
- 2.4 Research Process
- 2.4.1 Primary Research and Expert Interviews
- 2.4.2 Secondary Research and Source Review
- 2.4.3 Top-Down and Bottom-Up Estimation
- 2.4.4 Data Triangulation and Verification
- 2.5 Market Size Measurement Basis
- 2.5.1 2025: USD 1.21 million → 2035: USD 2.01 million
- 2.6 Historical and Forecast Reference Periods
- 2.6.1 Historical Period: 2018-2025
- 2.6.2 Base Year: 2025
- 2.6.3 Forecast Period: 2025-2035
- 2.7 Research Assumptions and Limitations
Chapter 3 Executive Summary
- 3.1 Market Snapshot and Key Findings
- 3.2 Base-Year Market Size, 2025
- 3.3 Forecast Market Size, 2035
- 3.4 Revenue and Volume Growth Outlook
- 3.5 Key Demand and Supply Indicators
- 3.6 Leading Market Segments
- 3.7 Fastest-Growing Market Opportunities
- 3.8 Regional Performance Highlights
- 3.9 Technology and Industry Transformation
- 3.10 Competitive Landscape Summary
- 3.11 Analyst View and Strategic Implications
Chapter 4 Australia 12-Aminododecanoic Acid Market Trends and Developments
- 4.1 Historical Industry Development, 2018-2025
- 4.2 Recent Market Trends and Developments
- 4.3 Demand and Customer Behavior Trends
- 4.4 Technology and Product Innovation
- 4.5 Artificial Intelligence, Automation and Digitalization
- 4.6 Local Manufacturing and Supply Chain Realignment
- 4.7 Industry Partnerships, Mergers and Acquisitions
- 4.8 Sustainability and Circular Economy Developments
- 4.9 Government and Private Sector Investment Trends
- 4.10 Emerging Business Models and Commercialization
- 4.11 Industry Developments and Announcements
Chapter 5 Australia 12-Aminododecanoic Acid Market Production, Supply and Demand Analysis
- 5.1 Demand Trend and Consumption Analysis, 2018-2025
- 5.2 Demand Forecast, 2025-2035
- 5.3 Production and Output Trend, 2018-2025
- 5.4 Production and Output Forecast, 2025-2035
- 5.5 Installed Capacity and Capacity Utilization
- 5.6 Company-Wise Production Plants and Statistics
- 5.6.1 Installed Production Capacity
- 5.6.2 Actual Production
- 5.6.3 Planned Capacity and Expansion Targets
- 5.7 Supply Chain Structure and Procurement Trends
- 5.8 Supply-Demand Gap and Bottlenecks
- 5.9 Import Dependence and Sourcing Structure
- 5.10 Contract Manufacturing and Outsourcing
- 5.11 Regional Supply and Demand Concentration
Chapter 6 Australia 12-Aminododecanoic Acid Market Pricing Analysis
- 6.1 Pricing Structure and Measurement
- 6.2 Historical Pricing Trends, 2018-2025
- 6.3 Pricing Outlook, 2025-2035
- 6.4 Average Selling Price and Unit Economics
- 6.5 Pricing by Product and Market Segment
- 6.6 Geographic Pricing Differences
- 6.7 Key Input, Energy, Labor and Logistics Costs
- 6.8 Contract Pricing and Purchasing Models
- 6.9 Pricing Sensitivity and Competitive Positioning
- 6.10 Price, Margin and Profitability Implications
Chapter 7 Australia 12-Aminododecanoic Acid Market Dynamics
- 7.1 Market Growth Drivers
- 7.1.1 Demand-Side Drivers
- 7.1.2 Technology and Innovation Drivers
- 7.1.3 Infrastructure and Investment Drivers
- 7.1.4 Regulatory and Policy Drivers
- 7.2 Market Restraints
- 7.2.1 Cost and Affordability Constraints
- 7.2.2 Technology and Adoption Barriers
- 7.2.3 Supply Chain and Operational Constraints
- 7.3 Market Challenges
- 7.3.1 Competitive Pressure and Margin Erosion
- 7.3.2 Skills, Infrastructure and Implementation Gaps
- 7.4 Emerging Market Opportunities
- 7.5 Market Dynamics Impact and Time-Horizon Assessment
Chapter 8 Australia 12-Aminododecanoic Acid Value Chain Analysis
- 8.1 Industry Value Chain Overview
- 8.2 Upstream Suppliers and Critical Inputs
- 8.3 Technology and Component Providers
- 8.4 Manufacturing or Service Delivery
- 8.5 Distribution, Channel Partners and Integrators
- 8.6 Downstream Applications and End Users
- 8.7 Value Addition and Profit Pools
- 8.8 Vertical Integration and Outsourcing
- 8.9 Supplier Concentration and Risk
- 8.10 Supply Chain Localization and Resilience
Chapter 9 Australia 12-Aminododecanoic Acid Market Regulations and Policies
- 9.1 Relevant Laws, Standards and Compliance Frameworks
- 9.2 Product, Service, Safety and Quality Requirements
- 9.3 Government Policies, Incentives and Subsidies
- 9.4 Imports, Exports and Trade Barriers
- 9.5 Public Procurement and Local Content Requirements
- 9.6 Environmental and Sustainability Compliance
- 9.7 Upcoming Policy Changes and Market Implications
Chapter 10 Australia 12-Aminododecanoic Acid Market Hotspots and Opportunities
- 10.1 Market Opportunity Mapping and Growth Hotspots
- 10.2 High-Growth Applications and Customer Groups
- 10.3 Underserved Markets and White-Space Opportunities
- 10.4 Emerging Technology and Product Opportunities
- 10.5 New Capacity and Investment Hotspots
- 10.6 Market Entry and Expansion Opportunities
- 10.7 Distribution and Partnership Opportunities
- 10.8 Near-Term and Long-Term Commercial Potential
- 10.9 Opportunity Attractiveness and Execution Risks
Chapter 11 Australia 12-Aminododecanoic Acid Market Outlook, 2025-2035
- 11.1 Market Size and Analysis
- 11.1.1 Revenue (Market Measurement: 2025: USD 1.21 million → 2035: USD 2.01 million)
- 11.1.2 Market Volume and Quantity Sold
- 11.1.3 Historical Market Size, 2018-2025
- 11.1.4 Base-Year Market Size, 2025
- 11.2 Market Forecast, 2025-2035
- 11.2.1 Revenue Forecast to 2035
- 11.2.2 Volume Forecast to 2035
- 11.2.3 CAGR and Year-on-Year Growth
- 11.2.4 Incremental Revenue Opportunity
- 11.3 Forecast Assumptions and Scenario Analysis
- 11.3.1 Base-Case Forecast
- 11.3.2 Optimistic and Conservative Scenarios
- 11.3.3 Technology, Pricing and Policy Sensitivities
- 11.4 Market Attractiveness and Growth Outlook
Chapter 12 Australia 12-Aminododecanoic Acid Market Segmentation and Outlook
- 12.1 Segmentation Summary and Market Shares, 2025
- 12.2 Largest and Fastest-Growing Segments
- 12.3 By Product Type - Market Size and Forecast, 2025-2035
- 12.3.1 Segment Definition and Scope
- 12.3.2 Historical Market Size, 2018-2025
- 12.3.3 Revenue Forecast, 2025-2035
- 12.3.4 Volume Forecast, 2025-2035
- 12.3.5 Base-Year Market Share, 2025
- 12.3.6 Segment CAGR and Growth Drivers
- 12.3.7 Subsegment Market Size and Forecast
- 12.3.7.1 Industrial Grade
- 12.3.7.2 Synthesis Grade
- 12.3.7.3 Research Grade
- 12.3.8 Subsegment Pricing and Adoption Trends
- 12.3.9 Leading Suppliers and Competition
- 12.3.10 Regional Demand and Opportunities
- 12.4 By End-Use Industry - Market Size and Forecast, 2025-2035
- 12.4.1 Segment Definition and Scope
- 12.4.2 Historical Market Size, 2018-2025
- 12.4.3 Revenue Forecast, 2025-2035
- 12.4.4 Volume Forecast, 2025-2035
- 12.4.5 Base-Year Market Share, 2025
- 12.4.6 Segment CAGR and Growth Drivers
- 12.4.7 Subsegment Market Size and Forecast
- 12.4.7.1 Specialty Polymer Manufacturing
- 12.4.7.2 Adhesive and Coating Manufacturing
- 12.4.7.3 Pharmaceutical Development
- 12.4.7.4 Academic and Public Research
- 12.4.8 Subsegment Pricing and Adoption Trends
- 12.4.9 Leading Suppliers and Competition
- 12.4.10 Regional Demand and Opportunities
- 12.5 By Application - Market Size and Forecast, 2025-2035
- 12.5.1 Segment Definition and Scope
- 12.5.2 Historical Market Size, 2018-2025
- 12.5.3 Revenue Forecast, 2025-2035
- 12.5.4 Volume Forecast, 2025-2035
- 12.5.5 Base-Year Market Share, 2025
- 12.5.6 Segment CAGR and Growth Drivers
- 12.5.7 Subsegment Market Size and Forecast
- 12.5.7.1 Polymer Synthesis
- 12.5.7.2 Reactive Formulation
- 12.5.7.3 Organic Synthesis
- 12.5.7.4 Materials Research
- 12.5.8 Subsegment Pricing and Adoption Trends
- 12.5.9 Leading Suppliers and Competition
- 12.5.10 Regional Demand and Opportunities
- 12.6 By Sales Channel - Market Size and Forecast, 2025-2035
- 12.6.1 Segment Definition and Scope
- 12.6.2 Historical Market Size, 2018-2025
- 12.6.3 Revenue Forecast, 2025-2035
- 12.6.4 Volume Forecast, 2025-2035
- 12.6.5 Base-Year Market Share, 2025
- 12.6.6 Segment CAGR and Growth Drivers
- 12.6.7 Subsegment Market Size and Forecast
- 12.6.7.1 Specialty Chemical Distribution
- 12.6.7.2 Laboratory Catalogue Sales
- 12.6.7.3 Direct Overseas Procurement
- 12.6.8 Subsegment Pricing and Adoption Trends
- 12.6.9 Leading Suppliers and Competition
- 12.6.10 Regional Demand and Opportunities
- 12.7 Segment Growth Comparison
- 12.8 Segment Attractiveness and Priority Matrix
Chapter 13 Australia 12-Aminododecanoic Acid End-Use and Application Market Outlook
- 13.1 End-Use Industry and Customer Demand Structure
- 13.2 Leading Applications and Customer Groups
- 13.3 End-Use Market Size, Share and Forecast
- 13.4 Major End-Use Industry Deep Dives
- 13.4.1 Customer Requirements and Use Cases
- 13.4.2 Demand and Replacement Cycles
- 13.4.3 Technical and Regulatory Considerations
- 13.4.4 Purchasing and Procurement Models
- 13.4.5 Leading Vendors and Distribution Channels
- 13.4.6 Forecast and Commercial Opportunities
- 13.5 Emerging Applications and Cross-Segment Demand
- 13.6 End-Use Industry Investment Priorities
Chapter 14 Australia 12-Aminododecanoic Acid Geographic Market Outlook, 2025-2035
- 14.1 Domestic Market Distribution and Demand Clusters
- 14.2 State- or Province-Wise Market Size and Forecast, 2025-2035
- 14.3 City and Metropolitan Market Outlook
- 14.4 Industrial, Manufacturing and Commercial Clusters
- 14.5 Geographic Concentration of Key End Users
- 14.6 Local Pricing and Purchasing Differences
- 14.7 Domestic Production Facilities and Capacity Map
- 14.8 Local Infrastructure and Project Pipeline
- 14.9 State-Level Policy and Incentive Differences
- 14.10 Subnational Investment Hotspots and Opportunities
- 14.11 Distribution and Logistics Networks
- 14.12 Domestic Competitive Footprint
Chapter 15 Australia 12-Aminododecanoic Acid Technology, Innovation and Sustainability Outlook
- 15.1 Technology Landscape and Maturity
- 15.2 Product, Process and Service Innovation
- 15.3 AI, Automation and Digital Tools in the Industry
- 15.4 Technology Adoption and Performance Benchmarking
- 15.5 Innovation Pipeline and R&D Investment
- 15.6 Patent and Intellectual Property Trends
- 15.7 Energy Efficiency and Resource Management
- 15.8 Sustainability, Recycling and Circularity
- 15.9 Technology Roadmap, 2025-2035
- 15.10 Risks of Obsolescence and Technology Substitution
Chapter 16 Australia 12-Aminododecanoic Acid Market Key Strategic Imperatives
- 16.1 Growth and Market Entry Priorities
- 16.2 High-Return Products and Segments
- 16.3 Pricing, Profitability and Cost Optimization
- 16.4 Technology Investment and Product Differentiation
- 16.5 Supply Chain Localization and Resilience
- 16.6 Distribution and Customer Acquisition
- 16.7 Partnership, Acquisition and Capacity Strategy
- 16.8 Regional Expansion Priorities
- 16.9 Short-, Medium- and Long-Term Actions
Chapter 17 Competition Outlook
- 17.1 Industry Competition Characteristics
- 17.2 Market Structure and Concentration
- 17.3 Market Share and Competitive Positioning, 2025
- 17.4 Company-Wise Revenue and Product Benchmarking
- 17.5 Production and Service Capacity Benchmarking
- 17.6 Technology, Pricing and Differentiation
- 17.7 Regional Footprint and Distribution Strength
- 17.8 Mergers, Acquisitions and Strategic Alliances
- 17.9 New Entrants and Competitive Threats
- 17.10 Porter's Five Forces and Industry Attractiveness
- 17.11 Competitive Outlook, 2025-2035
Chapter 18 Company Profiles
- 18.1 Company Coverage and Selection Criteria
- 18.2 Merck / Sigma-Aldrich
- 18.2.1 Business Description
- 18.2.2 Company Ownership and Geographic Presence
- 18.2.3 Product and Service Portfolio
- 18.2.4 Manufacturing and Operating Footprint
- 18.2.5 Production Capacity and Expansion Plans
- 18.2.6 Financial Performance and Investment
- 18.2.7 Market Share and Competitive Position
- 18.2.8 Technology and Innovation Capabilities
- 18.2.9 Strategic Alliances or Partnerships
- 18.2.10 Recent Developments
- 18.2.11 Growth Strategy and Outlook
- 18.3 Tokyo Chemical Industry
- 18.4 Thermo Fisher Scientific
- 18.5 Enamine
- 18.6 Biosynth
- 18.7 Other Relevant Market Participants
Note: Every listed company is profiled on the structure shown under the first company. The company list is preliminary and may change based on research findings, market developments, data availability and client requirements.
Chapter 19 Disclaimer
- 19.1 Research and Forecast Disclaimer
- 19.2 Data Source and Estimation Limitations
Note: The depth of individual sections depends on data availability for this market. Volume, capacity, trade and other unit-based metrics are included where applicable.

