Market Overview
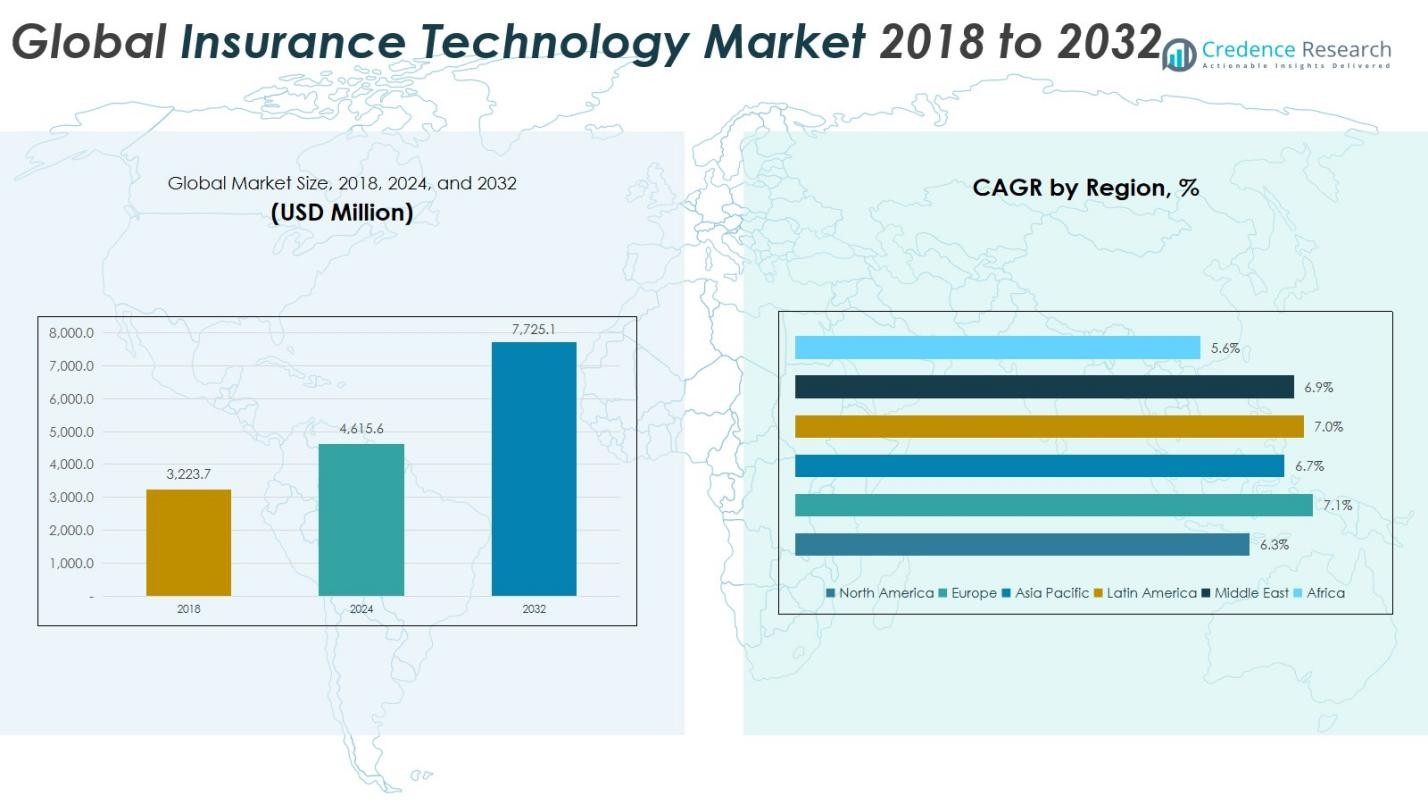
The Global Insurance Technology Market size was valued at USD 3,223.7 million in 2018, increasing to USD 4,615.6 million in 2024, and is anticipated to reach USD 7,725.1 million by 2032, growing at a CAGR of 6.70% during the forecast period.
| REPORT ATTRIBUTE |
DETAILS |
| Historical Period |
2020-2023 |
| Base Year |
2024 |
| Forecast Period |
2025-2032 |
| Insurance Technology Market Size 2024 |
USD 4,615.6 Million |
| Insurance Technology Market, CAGR |
6.70% |
| Insurance Technology Market Size 2032 |
USD 7,725.1 Million |
The Global Insurance Technology Market is highly competitive, with leading players such as Damco Group, DXC Technology Company, Majesco, Oscar Insurance, Shift Technology, Trōv Inc., Zhongan Insurance, and Hexaware Technologies driving innovation through advanced digital platforms and strategic collaborations. These companies focus on enhancing claims processing, risk assessment, and customer engagement using AI, blockchain, and cloud computing technologies. North America emerged as the leading region in 2024, accounting for 33.9% of the global market share, supported by strong technological infrastructure, early digital adoption, and a growing ecosystem of InsurTech startups that continue to transform traditional insurance models.
Access crucial information at unmatched prices!
Request your sample report today & start making informed decisions powered by Credence Research Inc.!
Download Sample
Market Insights
- The Global Insurance Technology Market reached USD 4.62 billion in 2024 and is projected to expand at a CAGR of 6.8% from 2025 to 2032, driven by digital transformation across insurance services and rising adoption of advanced analytics solutions.
- Growing demand for automation in claims processing, personalized insurance products, and improved customer experience acts as a primary driver boosting technology integration across insurers.
- The market is witnessing trends such as AI-driven underwriting, blockchain-based fraud detection, IoT-enabled telematics, and cloud-based policy management systems enhancing operational efficiency.
- Competitive analysis highlights key players like Damco Group, DXC Technology, Majesco, and Zhongan Insurance focusing on strategic partnerships, innovation, and regional expansion to strengthen their global presence.
- North America holds the largest regional share at 33.9%, followed by Europe at 30.1% and Asia Pacific at 25.7%, while the IoT and cloud computing segments dominate the technology landscape due to their scalability and efficiency benefits.
Market Segmentation Analysis:
By Technology:
The global insurance technology market by technology is dominated by cloud computing, accounting for 35% of the total market share in 2024. Cloud platforms enable insurers to streamline operations, enhance scalability, and reduce infrastructure costs while supporting real-time data processing. The rapid adoption of IoT and machine learning solutions, together contributing nearly 40% of market share, is further enhancing personalized risk assessment and claims automation. Growing emphasis on data security and operational efficiency continues to drive the integration of blockchain and AI-driven analytics across the insurance value chain.
For instance, AXA leverages connected car data from telematics devices to adjust motor insurance premiums based on driving behavior.
By Insurance Line:
Within the insurance line segment, health insurance leads the global insurance technology market with a market share of 38% in 2024. The dominance stems from the surge in digital health platforms, telemedicine integration, and demand for customized health plans supported by analytics and wearable IoT devices. Auto insurance follows with a substantial share of nearly 30%, driven by connected car technologies and usage-based policies. Meanwhile, property insurance and other specialized lines are adopting InsurTech solutions to optimize risk prediction and claim settlement processes.
For instance, Zurich Insurance adopted AI-powered damage assessment via drones for faster property claim settlement after severe storms in 2024.
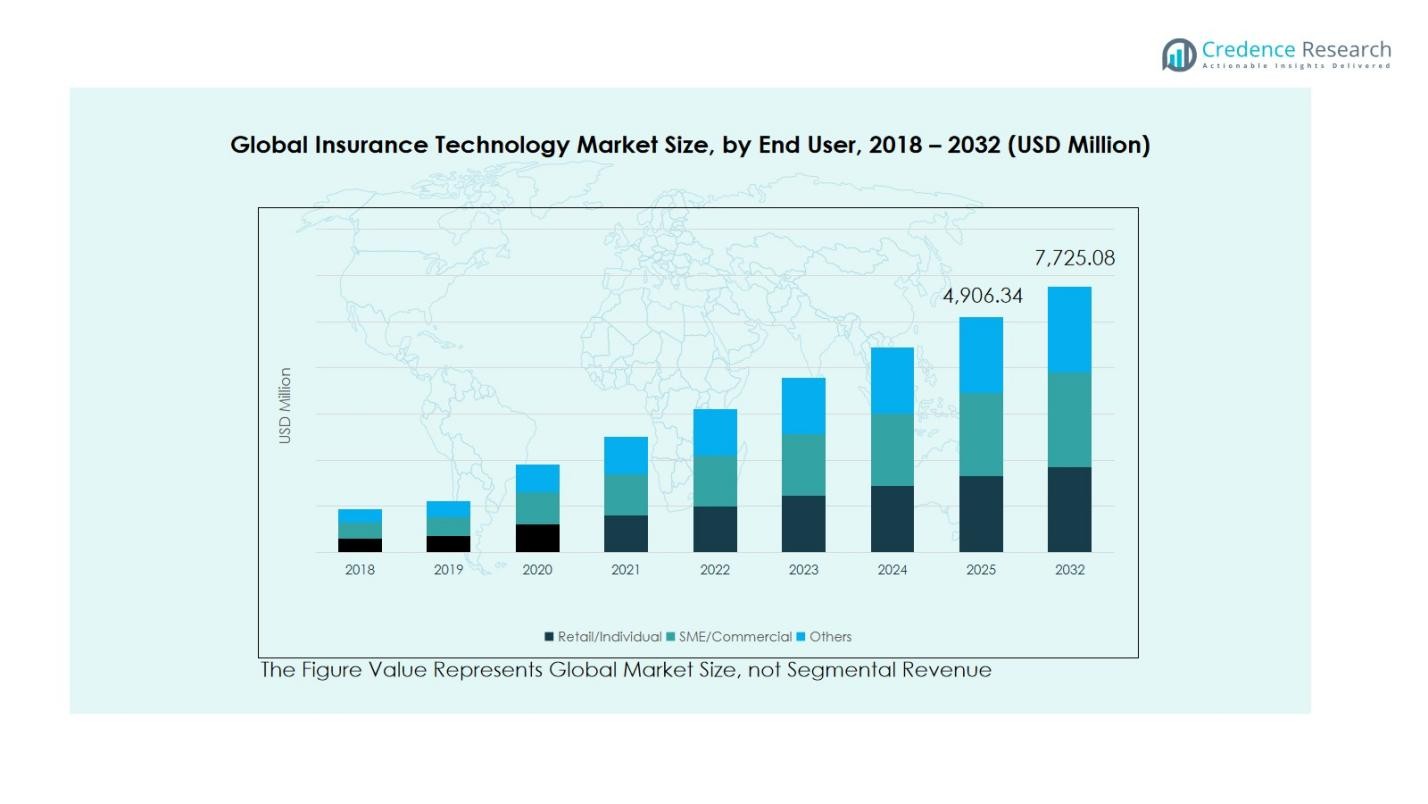
By End User:
Based on end users, the SME/commercial segment holds the largest share of the global insurance technology market, accounting for about 45% in 2024. The segment’s growth is attributed to rising demand among small and medium enterprises for digital policy management, fraud detection, and cost-effective underwriting tools. The retail/individual segment, representing nearly 40%, benefits from growing awareness of digital insurance platforms, mobile apps, and AI-enabled customer services. The others category includes institutional and government entities, which are increasingly exploring InsurTech solutions for operational modernization and data-driven policy design.
Key Growth Drivers
Digital Transformation and Automation in Insurance Operations
The global insurance technology market is witnessing strong growth driven by rapid digital transformation and automation initiatives. Insurers are adopting advanced analytics, AI, and robotic process automation (RPA) to streamline underwriting, claims management, and policy administration. Automation enhances efficiency, reduces operational costs, and improves accuracy in risk assessment. The rising customer demand for digital-first interactions and faster service delivery has further accelerated the deployment of InsurTech platforms, enabling insurers to modernize legacy systems and maintain a competitive edge in a rapidly evolving marketplace.
For instance, Fannie Mae uses an automated underwriting system called Desktop Underwriter that assists mortgage lenders in risk assessment and decision-making, streamlining the underwriting process while maintaining professional oversight.
Rising Adoption of Cloud and IoT Technologies
Cloud computing and IoT integration are major growth catalysts for the insurance technology market. Cloud-based solutions allow insurers to store and process large data volumes securely and cost-effectively, ensuring real-time data access and scalability. Simultaneously, IoT-enabled devices provide insurers with valuable behavioral and usage data, improving personalization and risk modeling. These technologies enhance operational flexibility, enable dynamic pricing, and support innovative insurance models such as pay-as-you-drive and wellness-based policies, thus driving substantial market expansion across health, auto, and property insurance segments.
For instance, Liberty Mutual’s partnership with Ford, offering discounted insurance prices to customers driving Ford connected vehicles, leveraging real-time vehicle data for usage-based insurance.
Growing Consumer Demand for Personalized Insurance Solutions
Consumers increasingly prefer personalized and on-demand insurance plans tailored to their unique needs, fueling demand for digital platforms and data-driven services. InsurTech companies leverage AI, machine learning, and big data analytics to design customized products based on lifestyle, usage, and behavioral data. This shift toward hyper-personalization not only improves customer satisfaction but also enhances retention rates and brand loyalty. The growing adoption of mobile applications and self-service portals further strengthens customer engagement, positioning personalization as a key driver of long-term market growth.
Key Trends and Opportunities
Expansion of Blockchain and AI-Driven Ecosystems
The integration of blockchain and artificial intelligence is transforming the insurance ecosystem, enhancing transparency, security, and efficiency. Blockchain enables smart contracts and tamper-proof record-keeping, while AI automates claim processing and fraud detection. Together, these technologies promote operational reliability and trust among insurers and policyholders. The rising collaboration between InsurTech startups and established insurers presents significant opportunities for blockchain-based underwriting, predictive analytics, and decentralized insurance platforms, shaping the next generation of digital insurance solutions.
For instance, Chainlink uses blockchain smart contracts to automate insurance payouts based on real-time weather data, enabling swift, tamper-proof claims processing during catastrophic events.
Emergence of Embedded and Usage-Based Insurance Models
A notable trend in the insurance technology market is the rise of embedded and usage-based insurance (UBI) offerings. These models integrate insurance products seamlessly into consumer ecosystems, such as retail purchases, travel bookings, and automotive platforms. UBI leverages telematics and IoT to calculate premiums based on actual usage and behavior, providing flexibility and cost advantages to customers. The growing consumer preference for pay-per-use and subscription-based models creates lucrative opportunities for insurers to innovate and expand their service portfolios.
For instance, Tesla Insurance uses IoT sensors in its vehicles to monitor driver behavior and road conditions, allowing dynamic, risk-based premium adjustments.
Key Challenges
Data Privacy and Cybersecurity Concerns
As the insurance sector becomes increasingly digitalized, data privacy and cybersecurity emerge as significant challenges. Insurers handle vast amounts of sensitive customer data, making them prime targets for cyberattacks and data breaches. Ensuring compliance with global data protection regulations such as GDPR and CCPA adds further complexity. Maintaining robust encryption, secure cloud environments, and transparent data management practices is crucial. Failure to address these challenges can lead to reputational damage, legal liabilities, and erosion of consumer trust in InsurTech platforms.
Integration with Legacy Systems and Regulatory Complexity
Many insurers struggle to integrate modern InsurTech solutions with outdated legacy systems, limiting scalability and innovation potential. The coexistence of traditional IT frameworks with advanced digital technologies often results in operational inefficiencies and high implementation costs. Additionally, navigating diverse regulatory environments across regions poses a challenge for global insurers adopting new digital models. Addressing interoperability issues, ensuring compliance, and modernizing infrastructure remain essential for achieving seamless integration and unlocking the full potential of insurance technology.
Regional Analysis
North America
North America dominates the global insurance technology market, accounting for 33.9% of the global share in 2024. The market grew from USD 1,092.5 million in 2018 to USD 1,526.83 million in 2024 and is projected to reach USD 2,472.03 million by 2032, expanding at a CAGR of 6.3%. Growth is driven by the rapid digital transformation of insurers, strong adoption of cloud-based solutions, and increasing investment in artificial intelligence and data analytics. The U.S. leads regional development, supported by a mature insurance ecosystem, advanced technology infrastructure, and a rising number of InsurTech startups.
Europe
Europe holds a significant position in the global insurance technology market, contributing 29.3% of the global share in 2024. The market increased from USD 920.68 million in 2018 to USD 1,351.44 million in 2024 and is forecasted to reach USD 2,336.06 million by 2032, registering a CAGR of 7.1%. The region’s growth is fueled by stringent regulatory frameworks such as GDPR, encouraging digital transparency and data-driven operations. Key markets like the UK, Germany, and France are driving innovations in blockchain-based insurance platforms, personalized products, and risk management solutions.
Asia Pacific
Asia Pacific is emerging as the fastest-expanding region in the global insurance technology market, with a CAGR of 6.7% and a 22.0% share in 2024. The market expanded from USD 705.66 million in 2018 to USD 1,012.72 million in 2024, projected to reach USD 1,700.29 million by 2032. Growth is propelled by rising digital penetration, expanding insurance coverage, and rapid adoption of mobile-based policy platforms in countries like China, India, and Japan. Increasing government support for fintech innovation and growing investments in AI-driven risk assessment tools further accelerate market development.
Latin America
The Latin America insurance technology market is witnessing consistent growth, representing 7.4% of the global share in 2024. Valued at USD 235.97 million in 2018, it reached USD 343.79 million in 2024 and is expected to attain USD 588.65 million by 2032, advancing at a CAGR of 7.0%. The region’s growth is supported by the rising digitalization of insurance operations, expansion of mobile-based policy distribution, and growing focus on financial inclusion. Brazil and Mexico lead in InsurTech adoption, with increasing partnerships between insurers and technology providers driving new customer engagement models.
Middle East
The Middle East insurance technology market accounts for 5.9% of the global share in 2024, growing from USD 186.33 million in 2018 to USD 269.35 million in 2024, and expected to reach USD 456.55 million by 2032, at a CAGR of 6.9%. The region’s expansion is fueled by government-led digital transformation initiatives, the rise of fintech hubs in GCC countries, and growing demand for Sharia-compliant digital insurance products. The adoption of AI and blockchain technologies is improving transparency and operational efficiency, particularly across health and property insurance segments.
Africa
Africa holds a smaller yet steadily expanding portion of the global insurance technology market, contributing 3.5% of the global share in 2024. The market increased from USD 82.53 million in 2018 to USD 111.43 million in 2024, and is projected to reach USD 171.50 million by 2032, growing at a CAGR of 5.6%. Growth is driven by the increasing penetration of mobile-based microinsurance and digital payment solutions, particularly in South Africa, Kenya, and Nigeria. Despite infrastructural challenges, expanding internet connectivity and insurtech-focused startups are fostering innovation in affordable and inclusive insurance offerings.
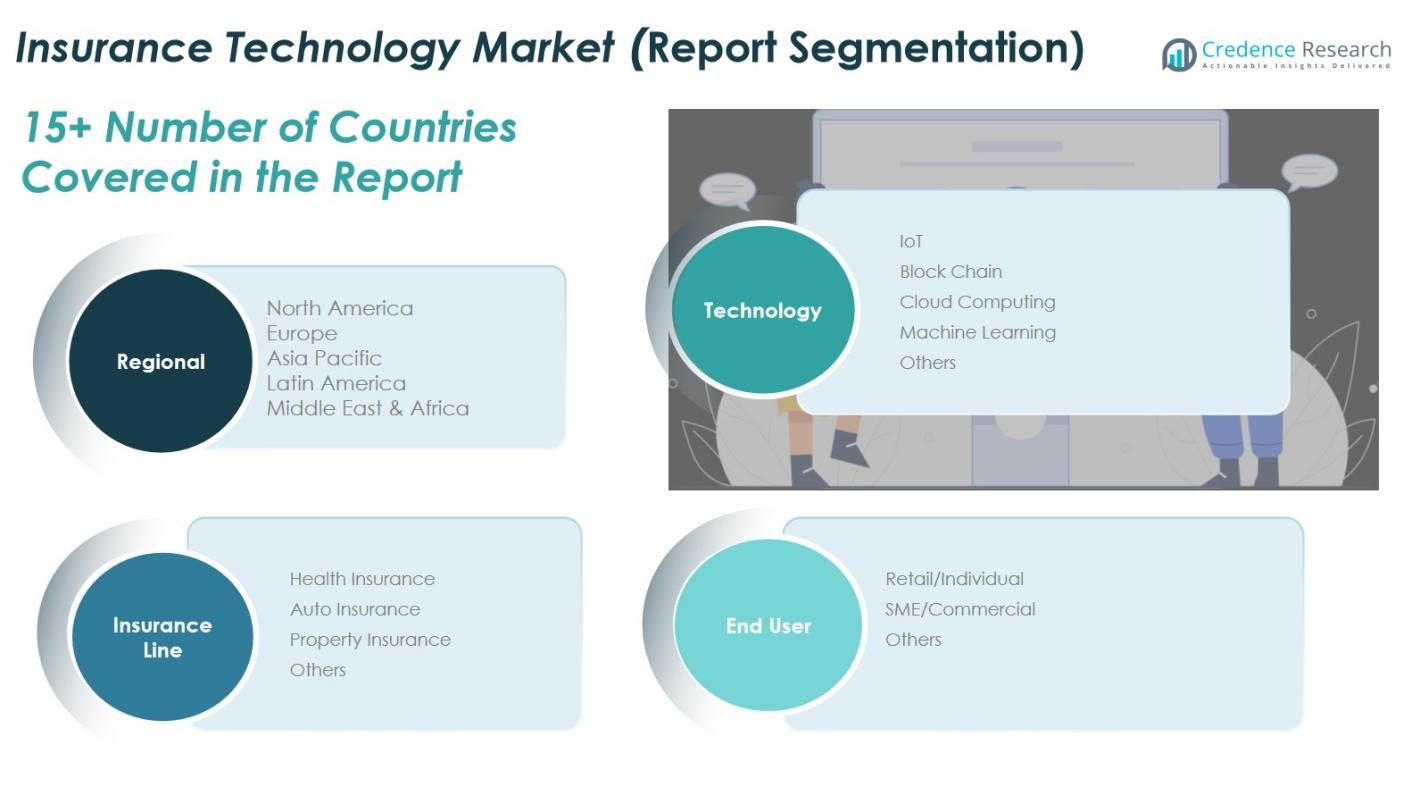
Market Segmentations:
By Technology:
- Internet of Things (IoT)
- Blockchain
- Cloud Computing
- Machine Learning
- Others
By Insurance Line:
- Health Insurance
- Auto Insurance
- Property Insurance
- Others
By End User:
- Retail / Individual
- SME / Commercial
- Others
By Region:
- North America
- Europe
- Germany
- France
- U.K.
- Italy
- Spain
- Rest of Europe
- Asia Pacific
- China
- Japan
- India
- South Korea
- South-east Asia
- Rest of Asia Pacific
- Latin America
- Brazil
- Argentina
- Rest of Latin America
- Middle East & Africa
- GCC Countries
- South Africa
- Rest of the Middle East and Africa
Competitive Landscape
The competitive landscape of the global insurance technology market is characterized by the strong presence of key players such as Damco Group, DXC Technology Company, Insurance Technology Services, Majesco, Oscar Insurance, Shift Technology, Trōv Inc., Zhongan Insurance, and Hexaware Technologies. These companies focus on technological innovation, strategic partnerships, and digital transformation to strengthen their market positions. Industry leaders are actively investing in cloud-based platforms, artificial intelligence, machine learning, and blockchain to enhance operational efficiency and customer experience. Emerging InsurTech startups are introducing niche, data-driven solutions that challenge traditional insurance models and foster healthy competition. Mergers, acquisitions, and collaborations between insurance providers and technology firms are further reshaping the competitive dynamics. The market’s competitiveness is intensifying as global insurers prioritize agility, data security, and personalized offerings to meet evolving customer expectations, while new entrants leverage innovative digital ecosystems to gain traction in both developed and emerging markets.
Key Player Analysis
- Damco Group
- DXC Technology Company
- Insurance Technology Services
- Majesco
- Oscar Insurance
- Shift Technology
- Trōv, Inc.
- Zhongan Insurance
- Hexaware Technologies
- Other Key Players
Recent Developments
- In October 2025, NTT DATA announced the acquisition of Alchemy Technology Services, a specialist insurance technology consultancy, to strengthen its global insurance ecosystem and enhance digital transformation capabilities.
- In October 2025, SoundHound AI expanded its partnership with Apivia Courtage to develop AI-powered insurance applications, driving automation and innovation within the InsurTech sector.
- In August 2025, Advent International acquired Sapiens International Corporation for US $2.5 billion, marking a significant move in the InsurTech software space and reinforcing investor confidence in insurance technology solutions.
- In September 2025, InsurTech Express launched IE Capital Connect, a new funding and advisory platform designed to accelerate growth for InsurTech startups and connect them with investors and strategic partners.
Shape Your Report to Specific Countries or Regions & Enjoy 30% Off!
Report Coverage
The research report offers an in-depth analysis based on Technology, Insurance Line, End User and Region. It details leading market players, providing an overview of their business, product offerings, investments, revenue streams, and key applications. Additionally, the report includes insights into the competitive environment, SWOT analysis, current market trends, as well as the primary drivers and constraints. Furthermore, it discusses various factors that have driven market expansion in recent years. The report also explores market dynamics, regulatory scenarios, and technological advancements that are shaping the industry. It assesses the impact of external factors and global economic changes on market growth. Lastly, it provides strategic recommendations for new entrants and established companies to navigate the complexities of the market.
Future Outlook
- The global insurance technology market will continue to expand, driven by accelerated digital adoption across insurance operations.
- Artificial intelligence and machine learning will play a central role in enhancing predictive analytics and claims automation.
- Cloud-based platforms will dominate technology deployment, supporting scalability and cost-efficient infrastructure.
- Internet of Things integration will strengthen real-time risk monitoring and usage-based insurance models.
- Blockchain technology will gain traction for improving data transparency and fraud prevention.
- Personalization of insurance products through data analytics will enhance customer retention and satisfaction.
- Strategic collaborations between insurers and InsurTech startups will drive innovation and market diversification
- Regulatory advancements will support the adoption of digital insurance solutions and open insurance frameworks.
- Emerging economies in Asia Pacific and Latin America will witness rapid growth due to increased digital penetration.
- Sustainable and inclusive insurance models will evolve, focusing on environmental, social, and governance (ESG) principles.


