
Adhesives sit at the center of tooth-colored repair work
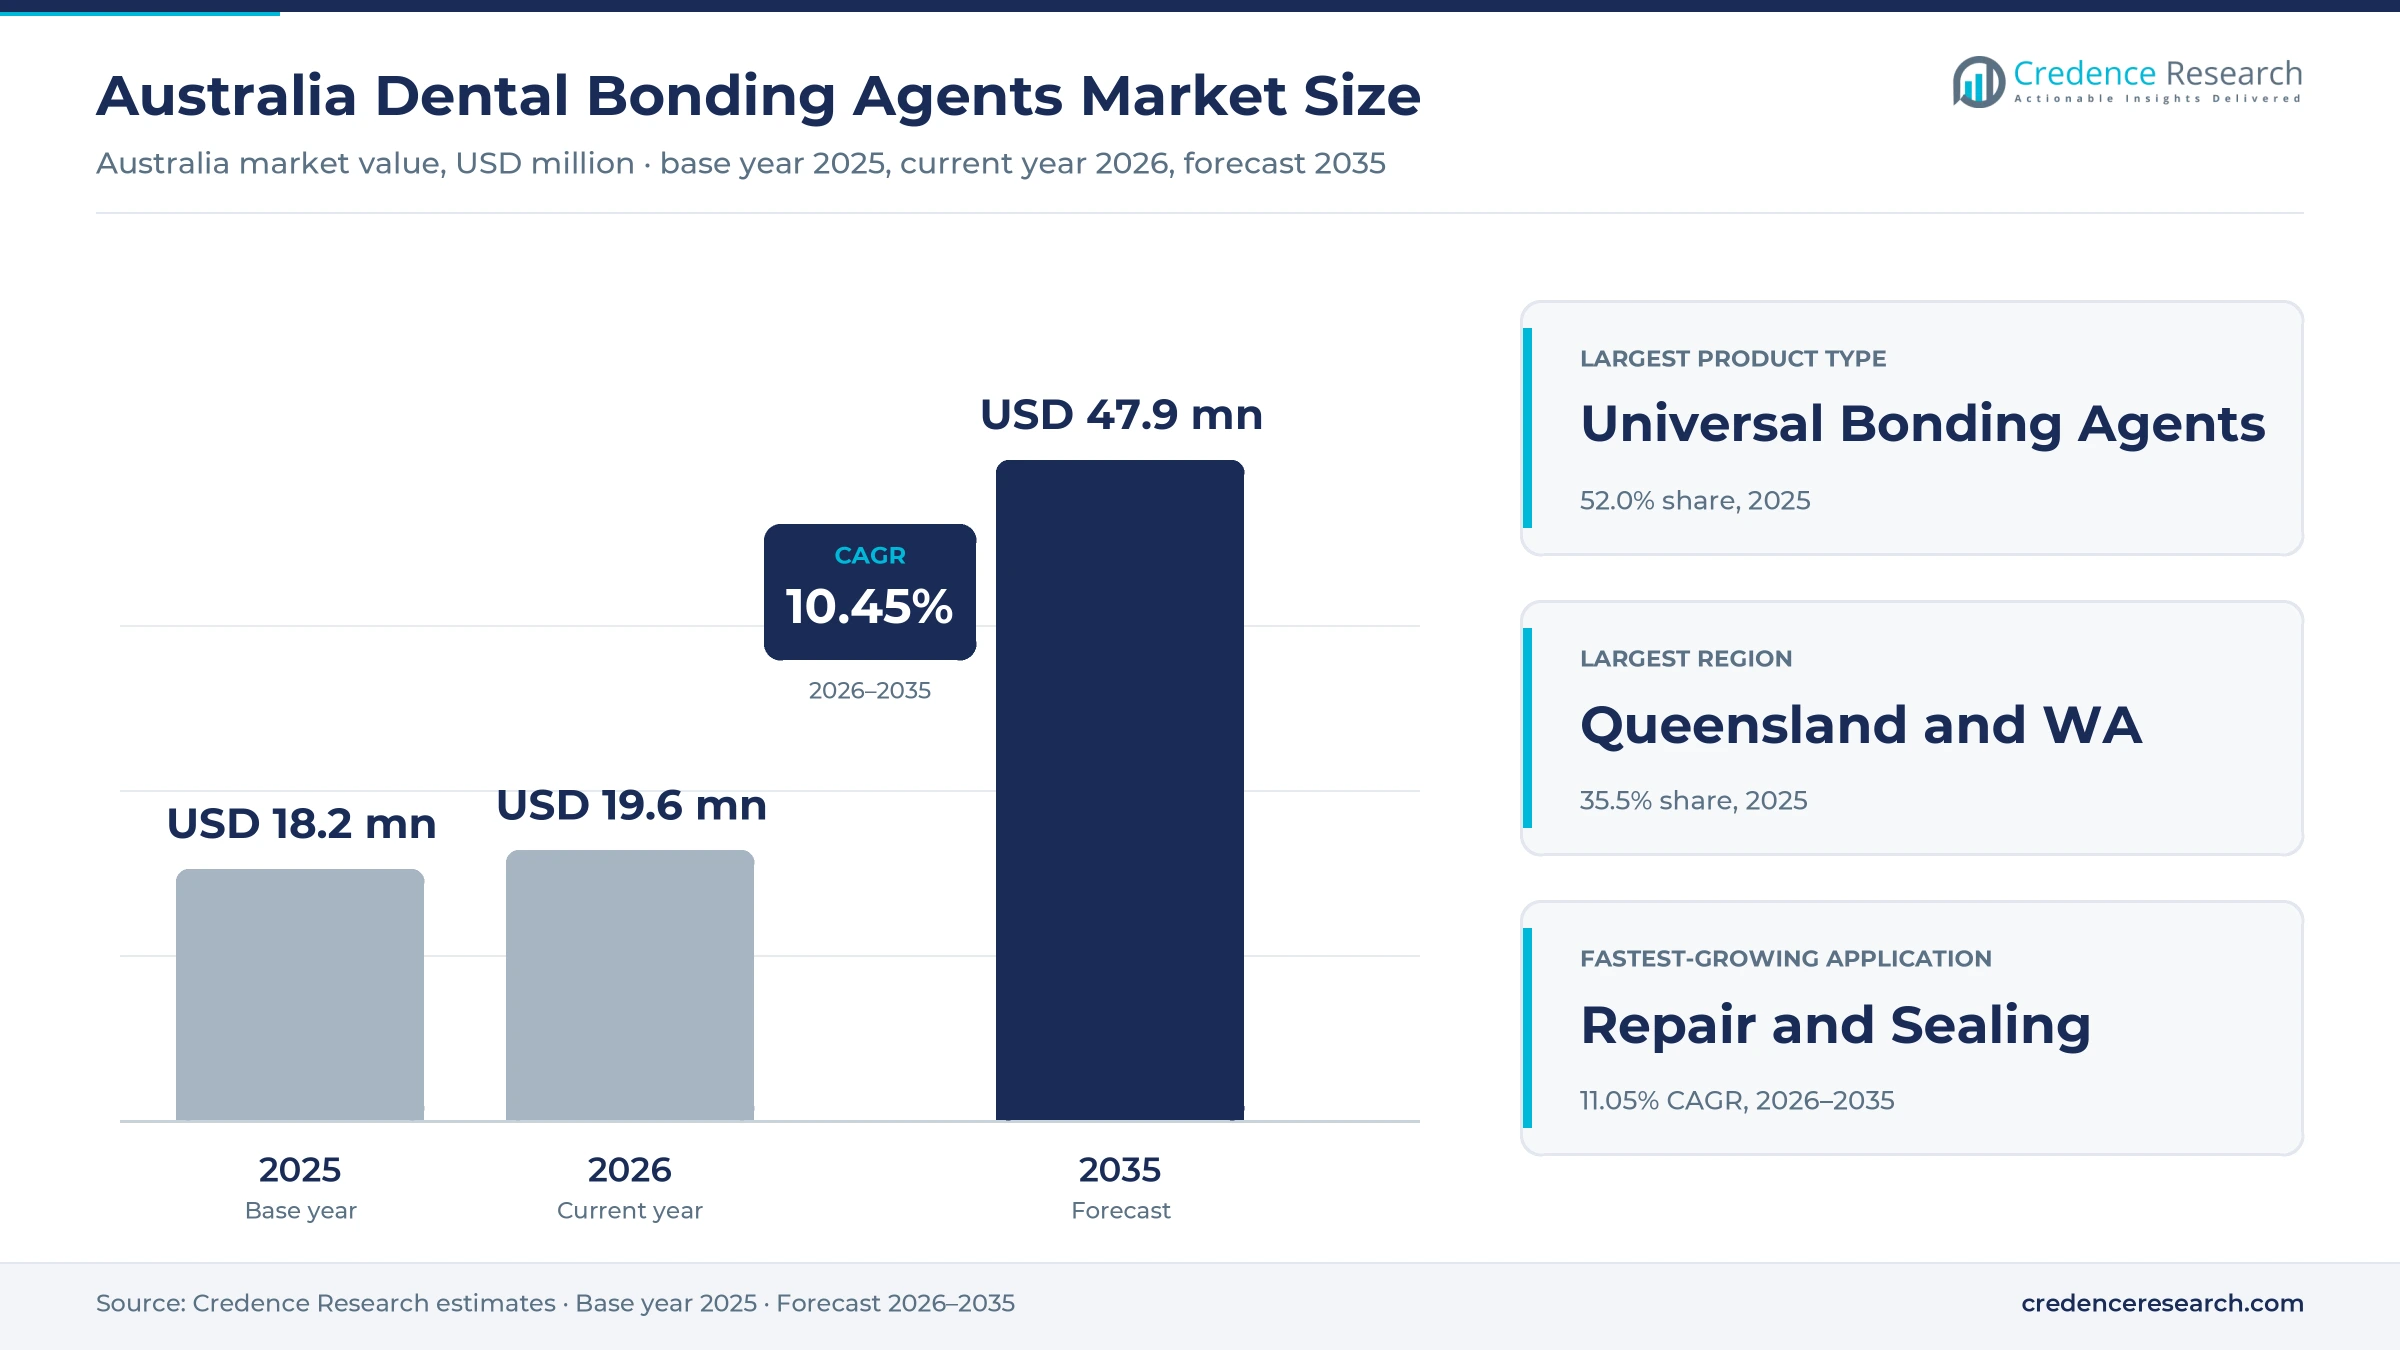
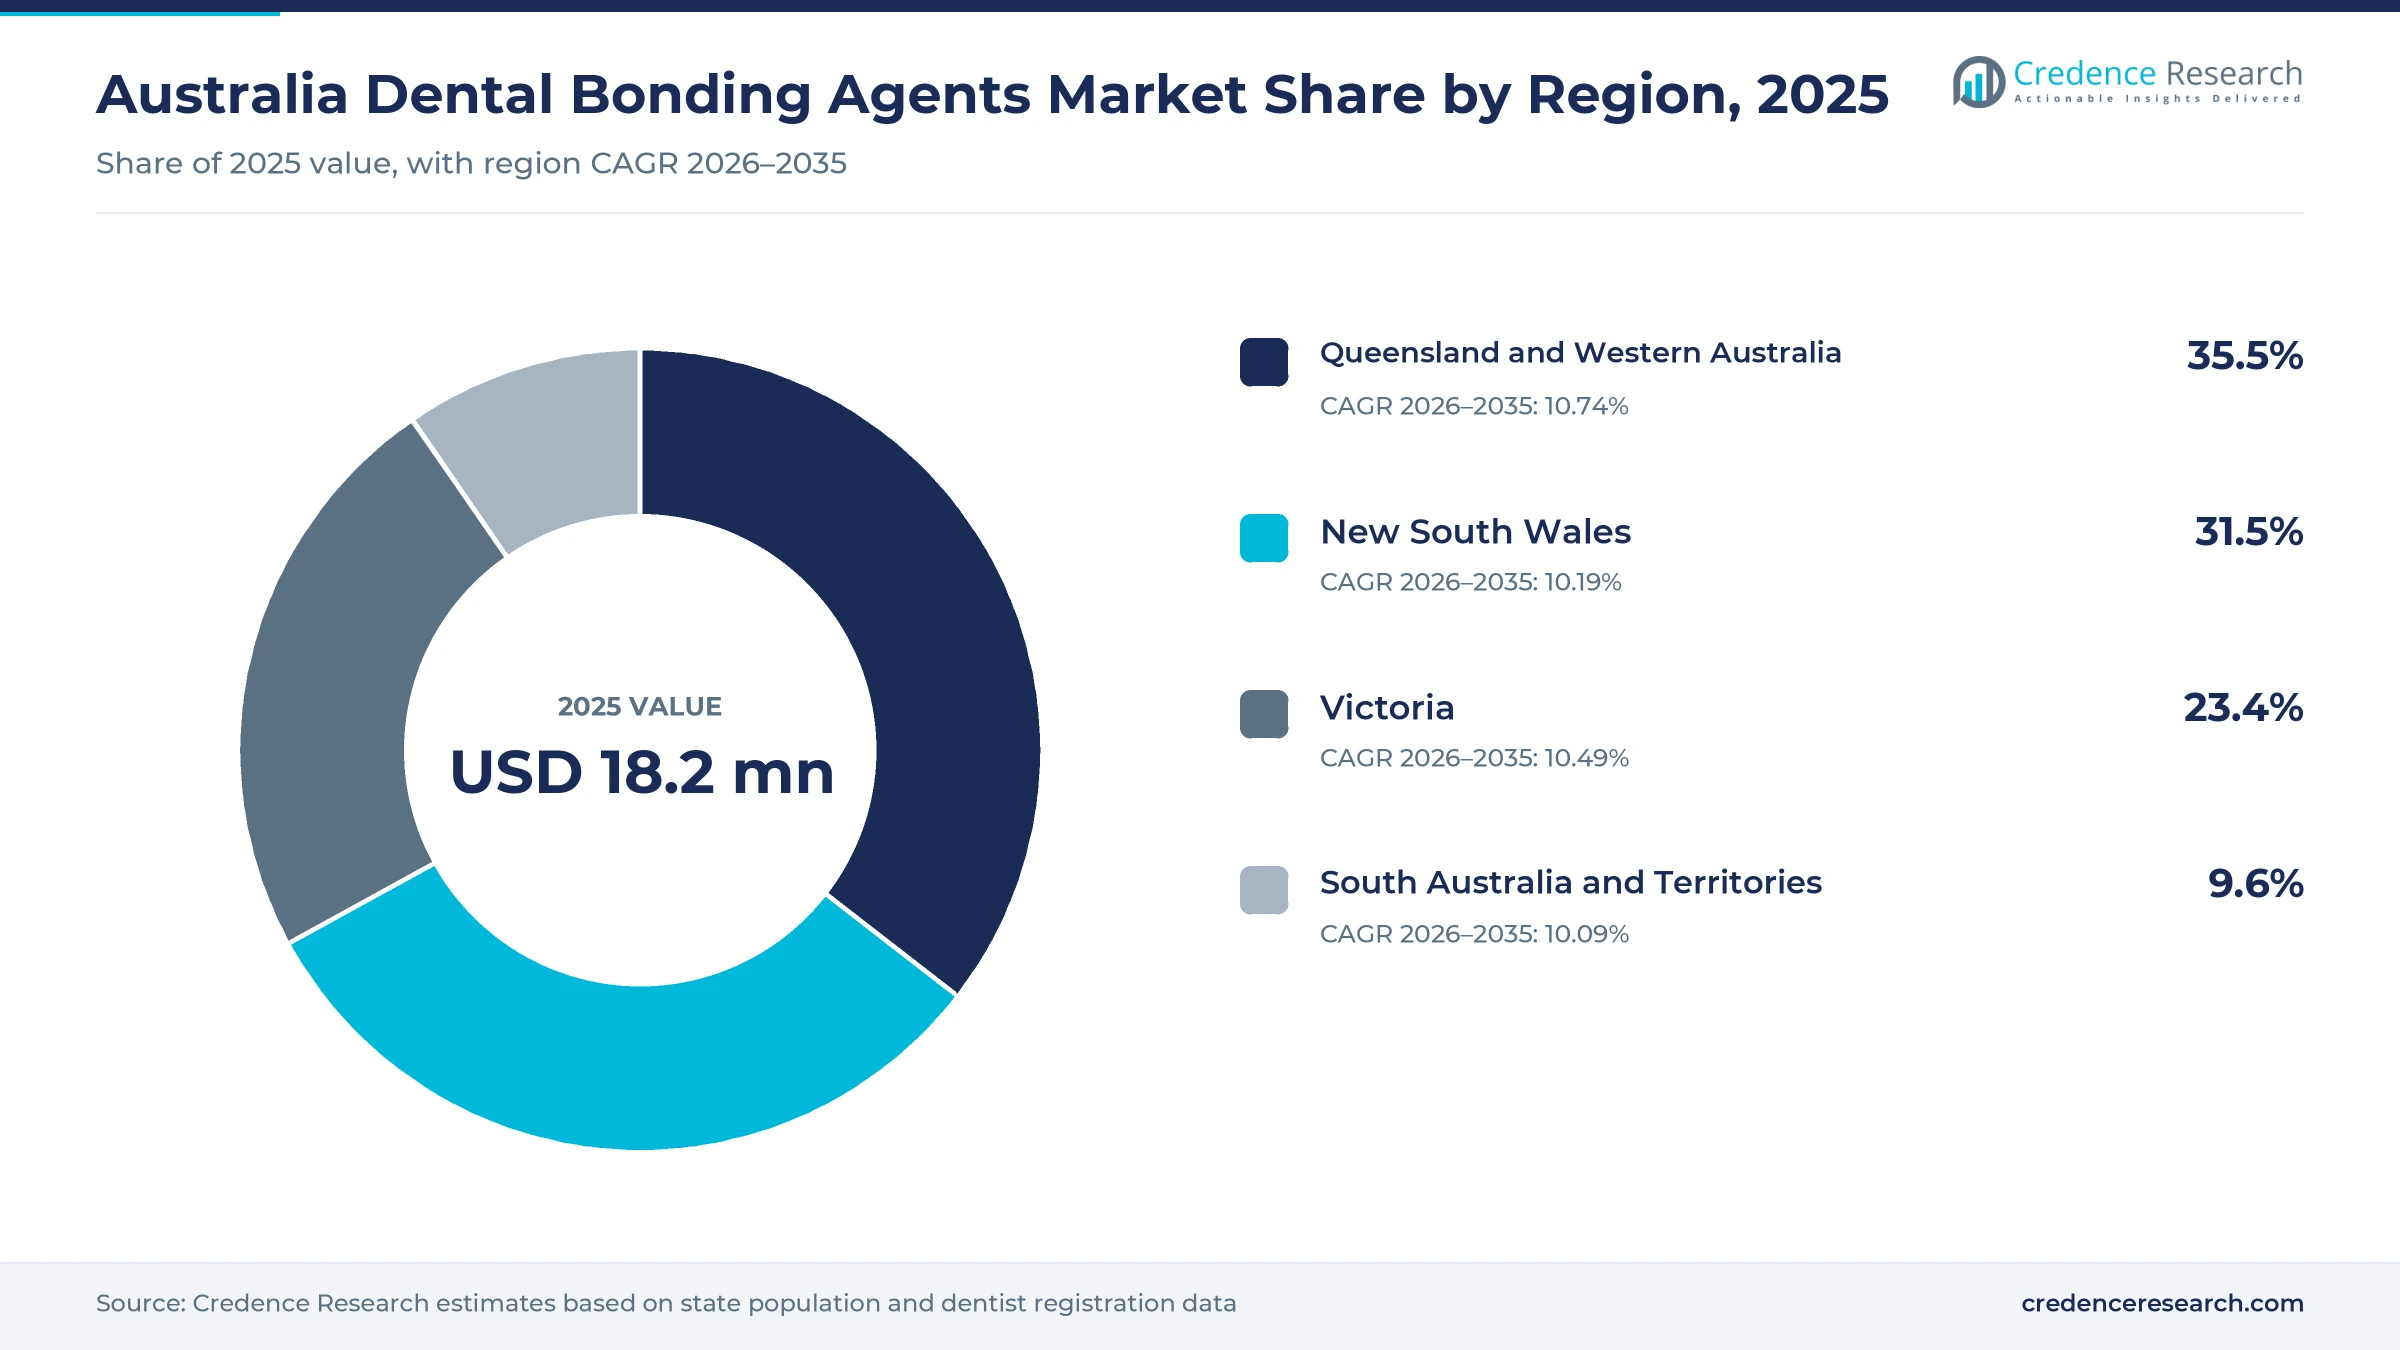
The Australia dental bonding agents market was valued at USD 18.2 million in 2025 and is projected to increase from USD 19.6 million in 2026 to USD 47.9 million by 2035, registering a CAGR of 10.45% during 2026–2035. Demand comes from general dentists and oral health therapists who place composite fillings, bond ceramic and composite indirect work, and repair or seal tooth surfaces in private and public clinics. Every resin restoration needs an adhesive layer, so the number of tooth-colored procedures sets the volume base, while the move toward single-bottle universal systems lifts the value of each procedure. Queensland and Western Australia held the largest regional share, 35.5% in 2025, and the zone is also the fastest-growing region at 10.74% a year because both states are adding residents quickly. In turn, the global decision to end amalgam manufacture, import and export from 2034 is pushing public and private clinics further toward bonded resin restorations.
Which adhesive products does the national estimate count?
The estimate measures the value of resin-based enamel and dentin adhesives bought by Australian dental clinics, hospitals and teaching schools. It counts universal, self-etch and etch-and-rinse systems in bottles, unit doses and pens, with any matching etchants and activators sold as part of the system, at prices paid by clinics.
The estimate excludes composite filling materials, resin cements sold on their own, glass ionomer restoratives, orthodontic bracket primers and laboratory bonding products. The value chain runs from overseas manufacturers and their local subsidiaries through national dental distributors to clinics, while corporate groups and state health services also negotiate supply directly.
Australia Dental Bonding Agents Market Insights
- The Australia dental bonding agents market was valued at USD 18.2 million in 2025 and is projected to reach USD 47.9 million by 2035, registering a CAGR of 10.45% during 2026–2035.
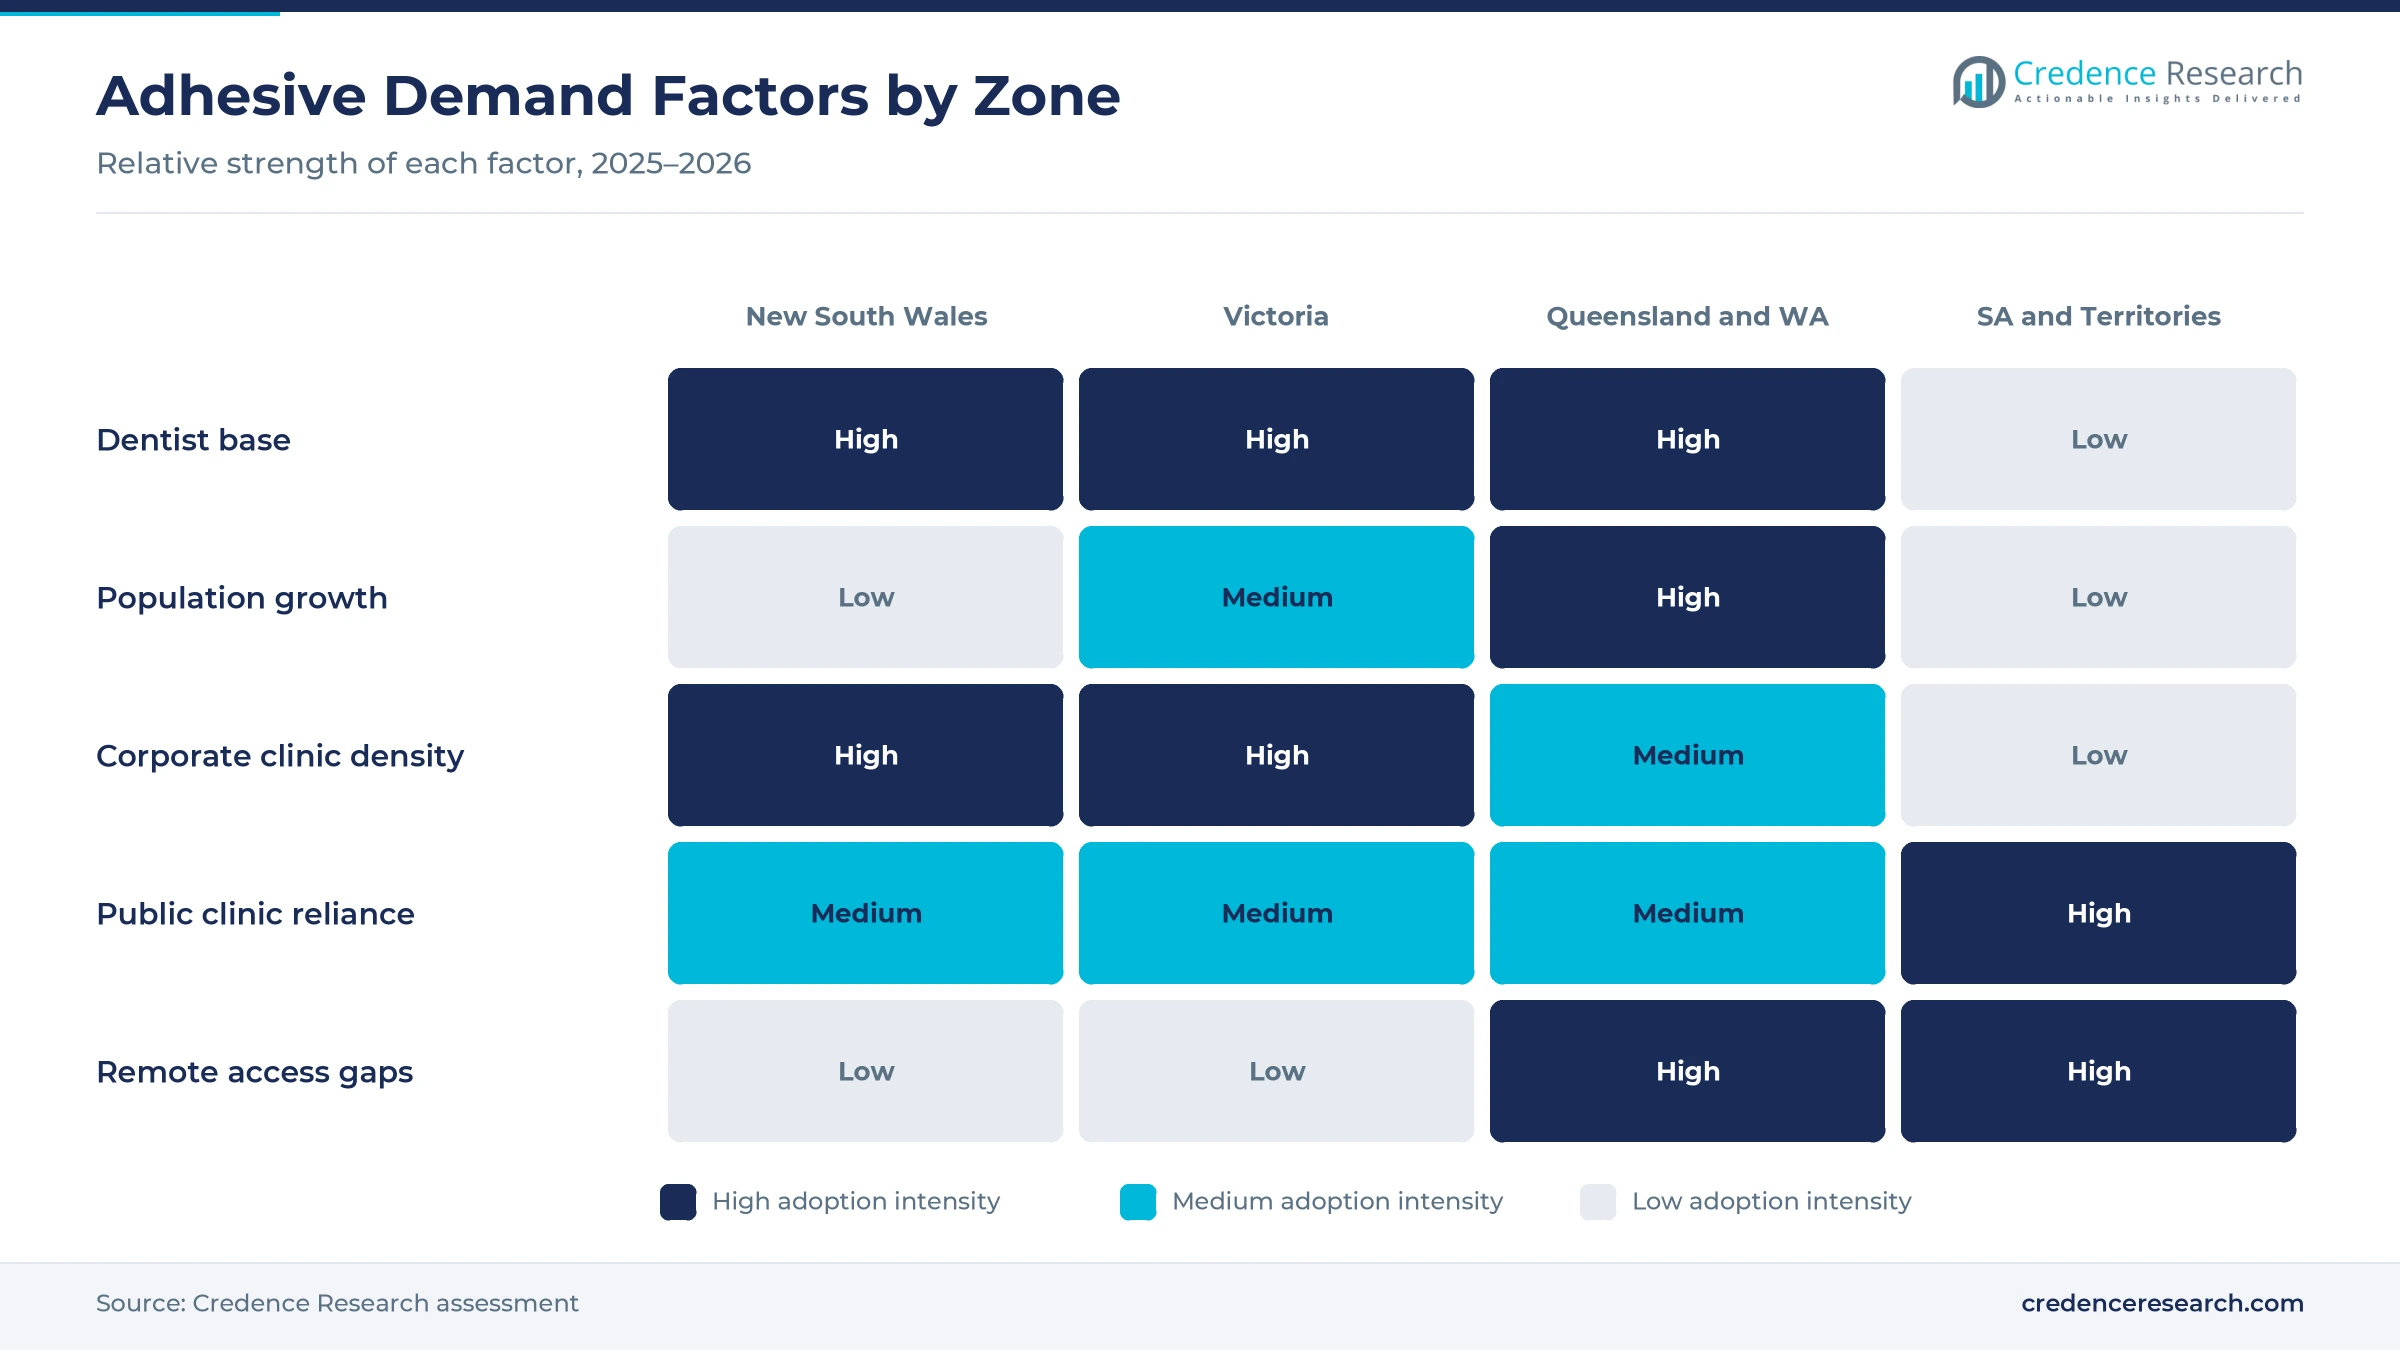
- Queensland and Western Australia held a 35.5% share of 2025 value, because the zone combines a large dentist base with the fastest population growth.
- Universal bonding agents led product types with a 52.0% share of 2025 value, because one bottle covers self-etch, selective-etch and etch-and-rinse techniques.
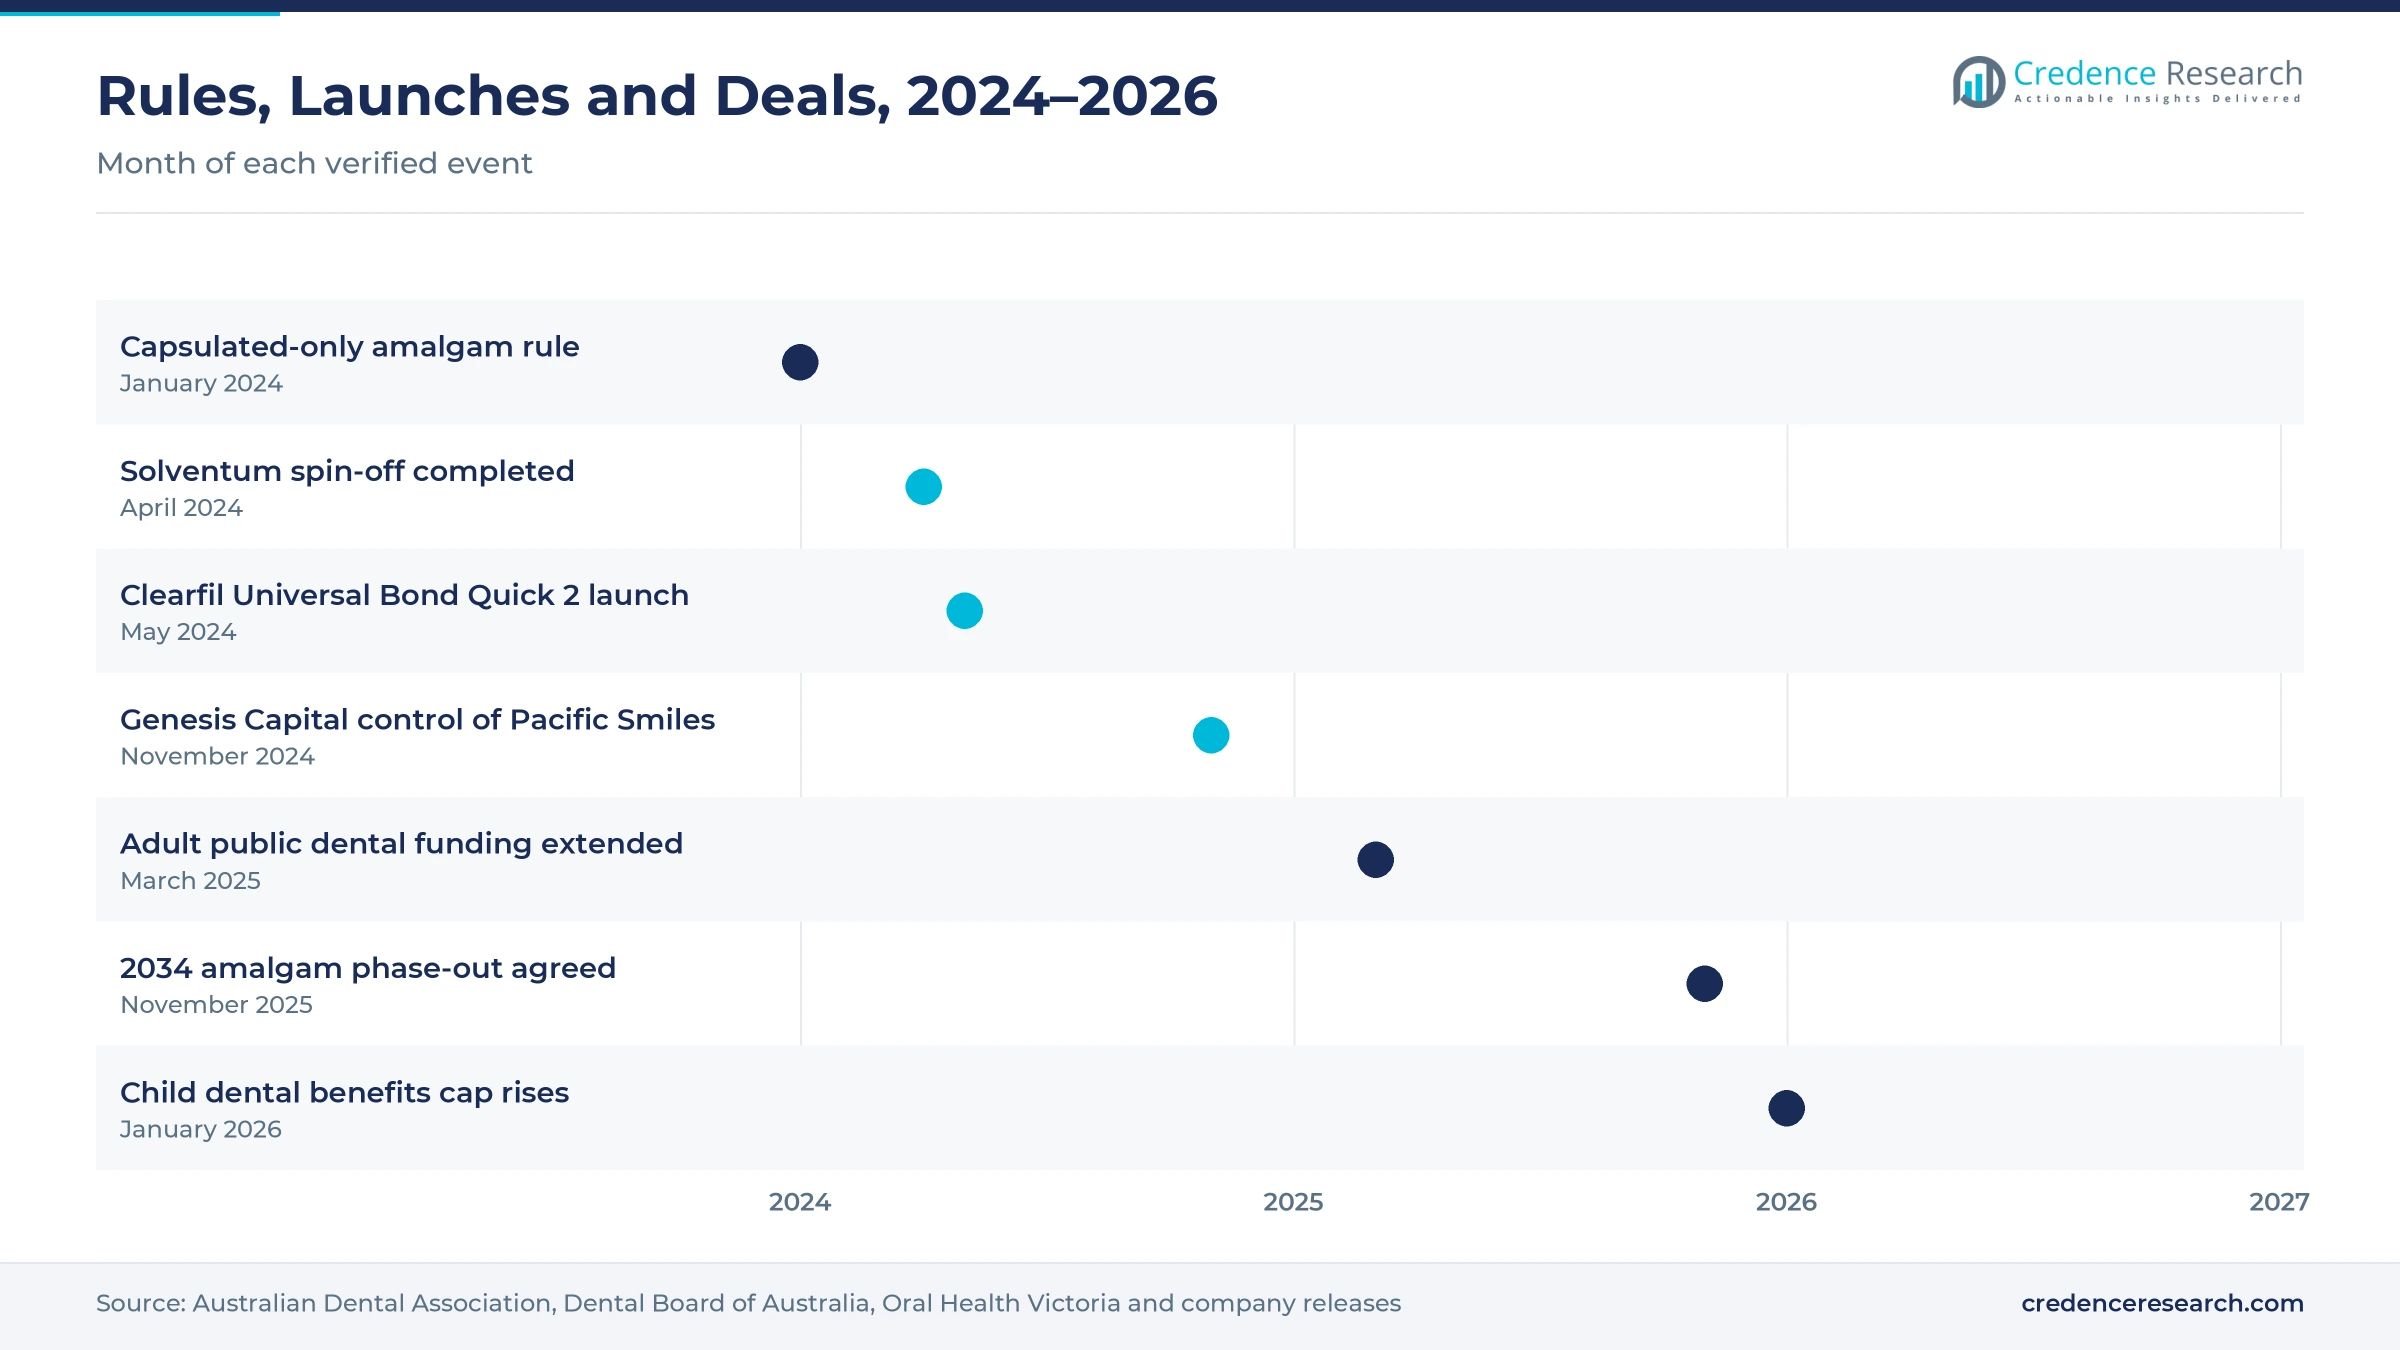
- At the Sixth Conference of the Parties to the Minamata Convention on Nov. 7, 2025, countries agreed that dental amalgam manufacture, import and export will end from 2034.
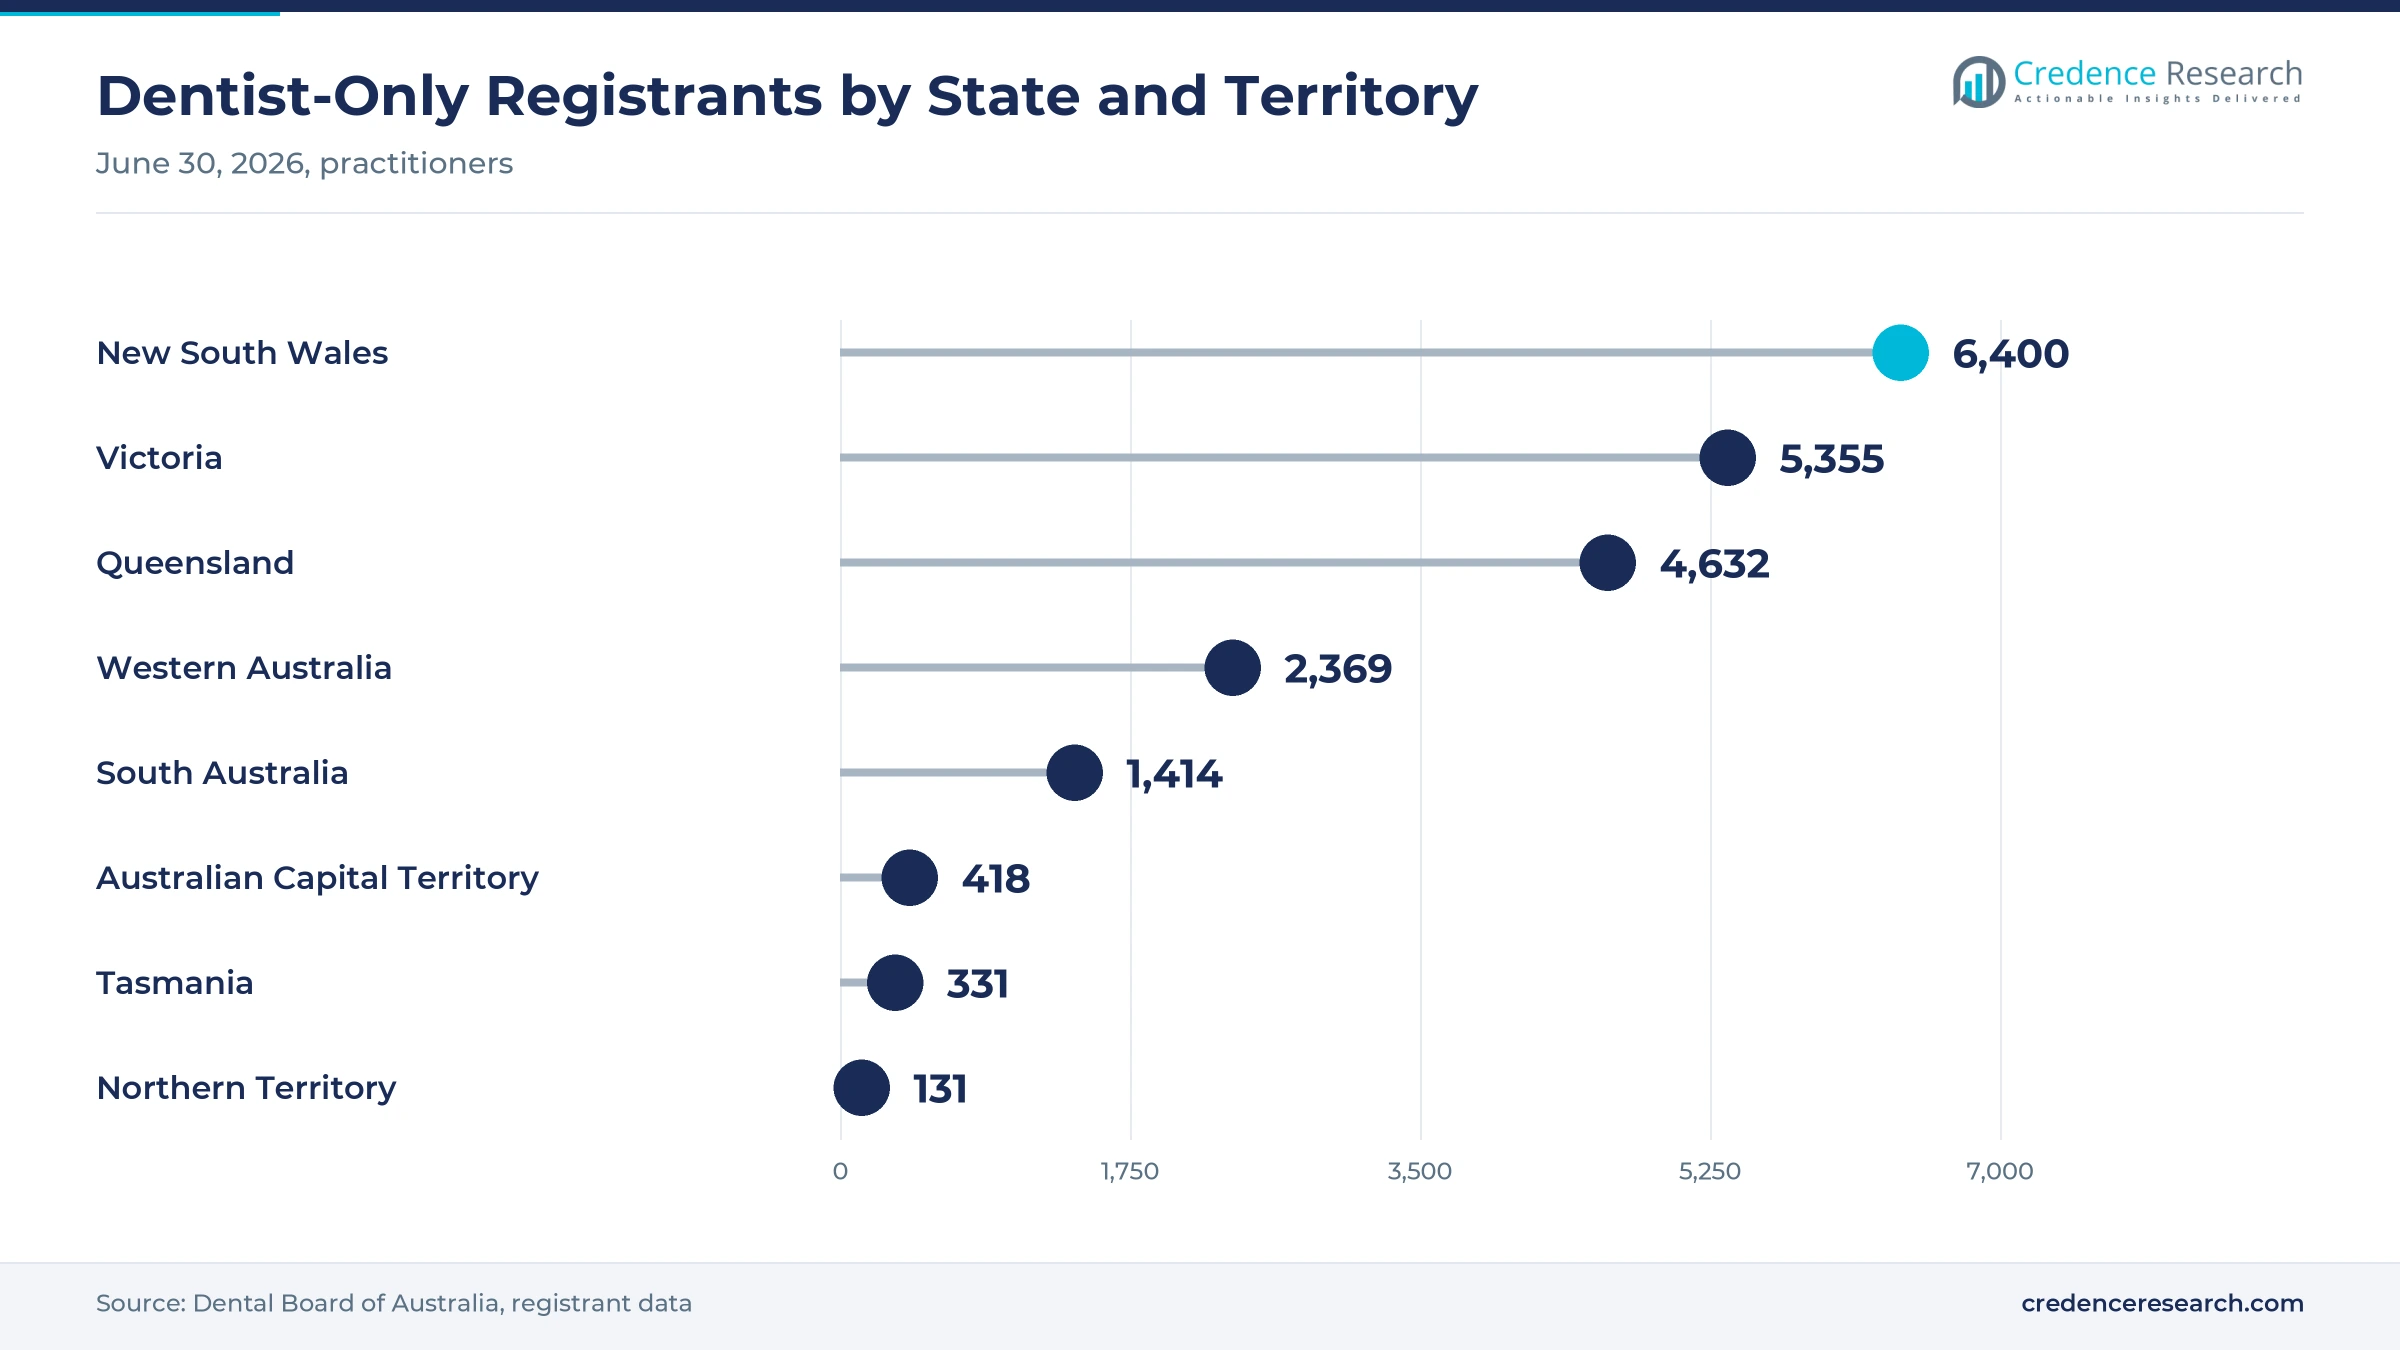
- The Dental Board of Australia counted 29,351 registered dental practitioners in the quarter to June 30, 2026, including 21,840 practitioners registered only in the dentist division.
Universal systems lead as indirect bonding gains ground
Why do universal systems carry most adhesive value?
Based on product type, the market is categorized into Universal Bonding Agents, Self-Etch Bonding Agents and Etch-and-Rinse Bonding Agents. Universal Bonding Agents led with a 52.0% share of 2025 value, because one bottle supports every etching technique and reduces stock held in each surgery. Universal Bonding Agents also grow fastest at 11.29% a year, as clinics retire older multi-bottle systems when they standardize materials across chairs.
How does restorative work split adhesive demand?
Based on application, the market is categorized into Direct Restorations, Indirect Restorations and Repair and Tooth-Surface Sealing. Direct Restorations led with 68.0% of 2025 value, because composite fillings are the most frequent bonded procedure in general practice. Repair and Tooth-Surface Sealing grows fastest at 11.05% a year, as clinicians repair aging restorations instead of replacing them and seal exposed root and cervical surfaces in older patients.
Why do private practices still buy most adhesives?
Based on end user, the market is categorized into Independent Private Practices, Corporate Dental Groups, Public Dental Services and Dental Education and Research. Independent Private Practices led with a 54.0% share of 2025 value, because most Australian dentists still work in owner-run surgeries. Corporate Dental Groups grow fastest at 11.43% a year, as consolidators add clinics and standardize one adhesive range across their networks.
How do clinics source their bonding systems?
Based on sales channel, the market is categorized into Dental Distributor Accounts, Direct Manufacturer Accounts and Institutional Procurement Contracts. Dental Distributor Accounts led with a 66.0% share of 2025 value, because independent surgeries order adhesives alongside hundreds of other consumables. Direct Manufacturer Accounts grow fastest at 11.07% a year, as manufacturers sign group agreements with large practice networks.
| Segment Group | Leading Sub-segment | Share, 2025 | Fastest-growing Sub-segment | CAGR, 2026–2035 |
|---|---|---|---|---|
| By Product Type | Universal Bonding Agents | 52.0% | Universal Bonding Agents | 11.29% |
| By Application | Direct Restorations | 68.0% | Repair and Tooth-Surface Sealing | 11.05% |
| By End User | Independent Private Practices | 54.0% | Corporate Dental Groups | 11.43% |
| By Sales Channel | Dental Distributor Accounts | 66.0% | Direct Manufacturer Accounts | 11.07% |
Request a Free Sample
Fill in your details and we'll send you a free sample report.
- Sample data tables & charts
- Research methodology
Decay burden, universal workflows and the amalgam phase-out
How do decay rates and repeat visits sustain filling volume?
Untreated decay keeps restorative chairs busy, and each composite filling or repair consumes adhesive. Oral diseases affect nearly 3.7 billion people worldwide, and untreated decay in permanent teeth is the most common health condition in the Global Burden of Disease 2021 study, according to the World Health Organization. The same fact sheet links decay to a high intake of free sugars and low fluoride exposure, risks that persist through adulthood and bring patients back for further treatment. Repeat attendance matters because older composite fillings eventually need repair or replacement, and each visit uses a fresh dose of adhesive. Because most decayed teeth are now restored with resin, Direct Restorations held 68.0% of 2025 adhesive value.
Why are universal adhesive workflows winning surgeries?
Universal systems let one bottle cover self-etch, selective-etch and etch-and-rinse techniques, which simplifies stock and training for busy practices. Solventum states that Scotchbond Universal Plus is a one-bottle system that needs no separate primer or silane and bonds to caries-affected dentin as strongly as to sound dentin. Henry Schein Australia lists Clearfil Universal Bond Quick 2 from Kuraray Noritake, introduced in May 2024, as a one-step adhesive sold in 0.1 ml unit doses packed 50 to a box that needs no waiting time and is stored at room temperature. GC describes its G2-Bond Universal as a two-bottle system usable in all etching modes. As a result, Universal Bonding Agents held 52.0% of 2025 value across Australian clinics.
How does the mercury-free transition lift bonded fillings?
Australia's commitment to phase down mercury is moving more fillings from amalgam to bonded resin. The Australian Government ratified the Minamata Convention in December 2021, with implementation from March 2022, and only capsulated amalgam may be used after Jan. 1, 2024, according to the Australian Dental Association. Parties agreed on Nov. 7, 2025, that amalgam manufacture, import and export will end from 2034. The Convention also discourages amalgam in baby teeth, in patients under 15 and in pregnant women unless a clinician judges it necessary. In turn, public clinics that relied on amalgam fillings must shift toward bonded composites and other mercury-free materials.
How does a larger dental workforce widen the user base?
More registered clinicians mean more chairs that buy adhesives every month. The Dental Board of Australia counted 29,351 registered dental practitioners in the quarter to June 30, 2026, including 21,840 in the dentist division only and 3,648 oral health therapists. Oral health therapists place fillings in children and young adults, which spreads adhesive use beyond dentists. The national population reached 27.9 million on March 31, 2026, after adding 392,700 people in a year, according to the Australian Bureau of Statistics. As a result, demand grows with both workforce and population, and Independent Private Practices held 54.0% of 2025 value.
HEMA-free chemistry, group buying and public funding shifts
Why are HEMA-free and BPA-free formulations on the rise?
Manufacturers are reformulating adhesives to remove ingredients that raise water uptake or sensitivity concerns, which gives clinics a reason to switch brands. GC states that G2-Bond Universal is HEMA-free and combines the functional monomers 4-MET, MDP and MDTP to cut water sorption. Solventum, which became independent from 3M on April 1, 2024, states that Scotchbond Universal Plus is free of BPA derivatives such as BisGMA when paired with its Filtek composites and RelyX Universal cement. Kuraray Noritake added amide and urethane tetramethacrylate monomers to its MDP chemistry in Clearfil Universal Bond Quick 2, launched in May 2024. In turn, premium systems with new chemistry lift the value of each bonded procedure performed in Australian surgeries.
How is corporate group buying reshaping supply?
Consolidation of private clinics is shifting adhesive purchasing from single surgeries to group contracts. National Dental Care states that it grew from four Brisbane practices in 2013 to more than 100 clinics, including Western Australian-based DB Dental. Business News Australia reported on Nov. 29, 2024, that Genesis Capital lifted its stake in Pacific Smiles to 59.2% after an AUD 311 million bid was recommended by the board. Larger groups can fix one adhesive range across all chairs, which favors suppliers with strong training and service teams. As a result, Corporate Dental Groups grow fastest at 11.43% a year, and corporate practice networks gain buying power.
Can child dental benefits open more restorative volume?
Public benefit schedules that fund fillings create a steady opening for adhesive suppliers in pediatric and family dentistry. The Australian Dental Association reported that the Child Dental Benefits Schedule cap rose to AUD 1,132 for treatment periods starting in 2025 and to AUD 1,158 for periods starting in 2026. The schedule covers examinations, X-rays, fillings and root canals for children aged 0 to 17 whose families receive Family Tax Benefit Part A. Because amalgam is discouraged in baby teeth and in patients under 15, these funded fillings rely mostly on bonded resin or glass ionomer. In turn, suppliers of fast universal systems suited to young patients are well placed in restorative and endodontic care.
Is public dental funding an opening for tender suppliers?
State public dental services buy adhesives through tenders, and federal funding decisions shape how many adult fillings they can deliver. Oral Health Victoria announced on March 26, 2025, that the federal budget extended AUD 107.8 million in funding for adult public dental services for 12 months. The same statement noted that the funding is not indexed for inflation or population growth. The Australian Dental Association also notes that public dental programs rely on amalgam for its durability and cost, so the 2034 phase-out will force tender specifications toward bonded materials. Suppliers that offer cost-effective universal systems with training support can therefore win Dental Distributor Accounts share and institutional contracts.
Technique sensitivity, price pressure and access gaps
Why does technique sensitivity limit adhesive performance?
Bond quality depends on moisture control, etching time, air thinning and curing light output, so errors at the chair can cause sensitivity, leakage or early failure. These risks are higher in children, older patients and remote clinics with limited isolation equipment. As a result, clinics may prefer products they already know and delay trials of new systems. Suppliers reduce this barrier through hands-on courses, simplified one-step protocols and unit-dose packs.
How does price pressure constrain premium systems?
Universal adhesives cost more per milliliter than older self-etch or etch-and-rinse bottles, and clinic owners face rising wages, rents and materials costs. Large groups use their volume to negotiate lower prices, which narrows supplier margins. In turn, value systems gain share in cost-sensitive public clinics. Manufacturers respond with pen and unit-dose formats that waste less adhesive per procedure and lower the effective cost of each filling.
Why do cost barriers delay restorative treatment?
Many adults delay dental visits because of cost, which postpones fillings and pushes some cases toward extractions or emergency care. Adult public dental services depend on federal funding that Oral Health Victoria says is not indexed for inflation or population growth, so waiting lists can lengthen when budgets stay flat. Because most adult care is paid privately, economic downturns slow restorative volume. Wider public funding and private insurance cover would ease this barrier over time.
How do remote access gaps narrow the customer base?
Dentists cluster in capital cities, so remote towns in Western Australia, Queensland and the Northern Territory have fewer chairs per person. The Northern Territory had only 131 practitioners in the dentist division in June 2026, compared with 6,400 in New South Wales. As a result, adhesive demand in remote areas depends on visiting services and public clinics with limited budgets. Tele-dentistry triage, visiting dentists and mobile clinics can widen remote access gradually over time.
Queensland and Western Australia lead and grow fastest
| Region | Value, 2025 (USD million) | Share, 2025 | CAGR, 2026–2035 |
|---|---|---|---|
| Queensland and Western Australia | 6.5 | 35.5% | 10.74% |
| New South Wales | 5.7 | 31.5% | 10.19% |
| Victoria | 4.3 | 23.4% | 10.49% |
| South Australia and Territories | 1.7 | 9.6% | 10.09% |
Why do Queensland and Western Australia grow fastest?
Queensland and Western Australia held 35.5% of 2025 value and grow fastest at 10.74% a year, because both states are adding residents quickly. Western Australia grew 2.1% to 3,096,200 residents in the year to March 31, 2026, the fastest rate nationally, while Queensland grew 1.6% to 5,739,500. The two states had 4,632 and 2,369 practitioners registered only as dentists in June 2026. In turn, new clinics in fast-growing suburbs and mining regions add adhesive demand.
New South Wales remains a large buyer of adhesives
New South Wales held 31.5% of 2025 value and grows at 10.19% a year, because it has the largest population and dentist base of any single state. The state had 8,670,100 residents on March 31, 2026, and 6,400 practitioners registered only as dentists in June 2026. Sydney hosts dense networks of private and corporate clinics that adopt universal systems early. However, slower population growth of 1.1% holds the state below the national pace.
How does Victoria support steady adhesive demand?
Victoria held 23.4% of 2025 value and grows at 10.49% a year, as population growth of 1.6% in the year to March 2026 adds patients across Melbourne and regional cities. The state had 5,355 practitioners registered only as dentists and 995 oral health therapists in June 2026. Oral Health Victoria runs the state public dental system, so public tenders shape part of adhesive demand. In turn, the zone tracks close to the national growth rate.
Why does South Australia and Territories grow slowest?
South Australia and Territories held 9.6% of 2025 value and grows at 10.09% a year, the slowest rate among the zones. South Australia grew only 1.0% to 1,916,800 residents in the year to March 31, 2026, and Tasmania grew 0.6%. The zone had 1,414 dentist-only registrants in South Australia, 418 in the Australian Capital Territory, 331 in Tasmania and 131 in the Northern Territory. As a result, public clinics and visiting services shape remote demand.
Spin-offs, launches and mercury rules, 2024–2026
| Development | Status and market relevance |
|---|---|
| In April 2024, 3M completed the spin-off of its health care business as Solventum, which now owns the Scotchbond adhesive brand. | Created a stand-alone health care supplier for dental adhesives |
| In May 2024, Kuraray Noritake Dental introduced Clearfil Universal Bond Quick 2, combining MDP, amide and urethane tetramethacrylate monomers. | Added a no-wait universal adhesive now stocked by Australian distributors |
| In November 2024, Genesis Capital lifted its stake in Pacific Smiles to 59.2% after the board recommended its takeover bid. | Strengthened group purchasing in corporate dentistry |
| In November 2025, the Sixth Conference of the Parties to the Minamata Convention set 2034 as the global phase-out date for dental amalgam. | Supports a long-term shift to bonded resin fillings |
| In June 2026, the Dental Board of Australia counted 29,351 registered dental practitioners in its quarterly registrant data. | Confirms a growing clinical user base for adhesives |
Monomer chemistry and curing mode define each system
- Functional monomers such as MDP and 4-MET bond chemically to calcium in tooth tissue, and GC combines 4-MET, MDP and MDTP in its HEMA-free G2-Bond Universal.
- Light-cure adhesives set quickly under curing lights, and Ivoclar states that Adhese Universal cures in about five seconds at 2,000 mW per square centimeter.
- Dual-cure and self-cure adhesives set without full light access under crowns and posts, which supports cementation of indirect work and deep restorations.
- Pen and unit-dose delivery reduces waste, and Ivoclar states that its VivaPen gives up to three times more applications per milliliter than conventional bottles.
Need a Custom Version of This Report?
Tailor the scope, geography, or segments to your exact requirements.
- Custom geography or segment scope
- Direct access to our analyst team
Five global adhesive brands compete through distributors
Competition among suppliers of dental bonding agents in Australia centers on five global adhesive brands that reach clinics through national distributors and direct sales teams. Kuraray Noritake Dental supplies the Clearfil range, and Henry Schein Australia lists Clearfil Universal Bond Quick 2 in bottle and unit-dose formats. Solventum, spun off from 3M on April 1, 2024, sells Scotchbond Universal Plus through its Australian site. Dentsply Sirona lists Prime&Bond active and Prime&Bond elect for Australian clinics, while GC Corporation supplies G2-Bond Universal. Ivoclar introduced a new-generation Adhese Universal VivaPen in September 2021 with a click dosing mechanism. Rivals compete on bond durability, chair time, compatibility with their own composites and cements, training and group pricing for restorative supplies. Because adhesives are bought with composites, a brand that wins the composite order often wins the bonding agent too.
Which manufacturers supply Australian dental clinics?
| Company | Type | Role in the market |
|---|---|---|
| Kuraray Noritake Dental | Manufacturer | Supplies Clearfil Universal Bond Quick 2, stocked by Henry Schein Australia |
| Solventum | Manufacturer | Sells Scotchbond Universal Plus and RelyX Universal cement in Australia |
| Dentsply Sirona | Manufacturer | Lists Prime&Bond active and Prime&Bond elect for Australian clinics |
| GC Corporation | Manufacturer | Supplies HEMA-free G2-Bond Universal through Australian distributors |
| Ivoclar | Manufacturer | Markets Adhese Universal in the VivaPen delivery format |
Credence Research view on adhesive demand to 2035
Credence Research's view is that Australian adhesive demand will grow faster than overall dental spending because bonded resin is replacing amalgam and universal systems carry higher prices. Universal bonding agents remain the largest and fastest-growing product pool, while indirect work and repair add value per procedure. Corporate groups will concentrate purchasing and push suppliers toward network contracts. Public dental funding and the pace of the amalgam phase-out in public clinics are the main swing factors, because they decide how quickly tender volumes move to bonded materials.
How the national adhesive estimate was built
The report uses 2025 as the base year on a calendar basis, and market values come from the Credence Research model. That model combines dental practitioner registration data, state population data, public dental program information and manufacturer product information. Segment splits and zone growth rates are Credence Research estimates, while zone shares follow the Credence Research regional split. Sources used are government agencies, official statistics, professional associations, trade publications and company publications, and no interviews or surveys were conducted.
Universal systems and mercury-free rules shape 2035
Value across Australian dental bonding agents is expected to reach USD 47.9 million by 2035, a 10.45% CAGR during 2026–2035, as universal systems, mercury-free rules and a growing workforce lift spending. Growth should be strongest in Queensland and Western Australia, where population growth is fastest. Corporate groups will push for network pricing, while new HEMA-free and BPA-free chemistries support premium prices. The pace of public clinic tenders and the 2034 amalgam phase-out will decide how quickly the last mercury fillings give way to bonded resin restorations.
Frequently Asked Questions
How big is the Australia dental bonding agents market?
Which product type leads adhesive sales in Australia?
Which region leads adhesive spending in Australia?
How does the Minamata Convention affect bonding agent demand?
Which application uses the most bonding agents?
How many dental practitioners are registered in Australia?
Which companies supply bonding agents in Australia?
What are the main challenges for adhesive suppliers?
Table of Content
Chapter 1 Market Segmentation
- 1.1 Segmentation Framework
- 1.1.1 Product and Service Classification
- 1.1.2 Application and End-Use Classification
- 1.1.3 Technology and Solution Classification
- 1.1.4 Customer and Distribution Channel Classification
- 1.1.5 Geographic Segmentation
- 1.1.6 Market Segment Definitions and Boundaries
- 1.2 By Product Type
- 1.2.1 Universal Bonding Agents
- 1.2.2 Self-Etch Bonding Agents
- 1.2.3 Etch-and-Rinse Bonding Agents
- 1.3 By Application
- 1.3.1 Direct Restorations
- 1.3.2 Indirect Restorations
- 1.3.3 Repair and Tooth-Surface Sealing
- 1.4 By End User
- 1.4.1 Independent Private Practices
- 1.4.2 Corporate Dental Groups
- 1.4.3 Public Dental Services
- 1.4.4 Dental Education and Research
- 1.5 By Sales Channel
- 1.5.1 Dental Distributor Accounts
- 1.5.2 Direct Manufacturer Accounts
- 1.5.3 Institutional Procurement Contracts
Chapter 2 Introduction
- 2.1 Report Objectives and Scope
- 2.2 Product Definition and Industry Terminology
- 2.3 Market Inclusions and Exclusions
- 2.4 Research Process
- 2.4.1 Primary Research and Expert Interviews
- 2.4.2 Secondary Research and Source Review
- 2.4.3 Top-Down and Bottom-Up Estimation
- 2.4.4 Data Triangulation and Verification
- 2.5 Market Size Measurement Basis
- 2.5.1 2025: USD 18.2 million → 2035: USD 47.9 million
- 2.6 Historical and Forecast Reference Periods
- 2.6.1 Historical Period: 2018-2025
- 2.6.2 Base Year: 2025
- 2.6.3 Forecast Period: 2025-2035
- 2.7 Research Assumptions and Limitations
Chapter 3 Executive Summary
- 3.1 Market Snapshot and Key Findings
- 3.2 Base-Year Market Size, 2025
- 3.3 Forecast Market Size, 2035
- 3.4 Revenue and Volume Growth Outlook
- 3.5 Key Demand and Supply Indicators
- 3.6 Leading Market Segments
- 3.7 Fastest-Growing Market Opportunities
- 3.8 Regional Performance Highlights
- 3.9 Technology and Industry Transformation
- 3.10 Competitive Landscape Summary
- 3.11 Analyst View and Strategic Implications
Chapter 4 Australia Dental Bonding Agents Market Trends and Developments
- 4.1 Historical Industry Development, 2018-2025
- 4.2 Recent Market Trends and Developments
- 4.3 Demand and Customer Behavior Trends
- 4.4 Technology and Product Innovation
- 4.5 Artificial Intelligence, Automation and Digitalization
- 4.6 Local Manufacturing and Supply Chain Realignment
- 4.7 Industry Partnerships, Mergers and Acquisitions
- 4.8 Sustainability and Circular Economy Developments
- 4.9 Government and Private Sector Investment Trends
- 4.10 Emerging Business Models and Commercialization
- 4.11 Industry Developments and Announcements
Chapter 5 Australia Dental Bonding Agents Market Production, Supply and Demand Analysis
- 5.1 Demand Trend and Consumption Analysis, 2018-2025
- 5.2 Demand Forecast, 2025-2035
- 5.3 Production and Output Trend, 2018-2025
- 5.4 Production and Output Forecast, 2025-2035
- 5.5 Installed Capacity and Capacity Utilization
- 5.6 Company-Wise Production Plants and Statistics
- 5.6.1 Installed Production Capacity
- 5.6.2 Actual Production
- 5.6.3 Planned Capacity and Expansion Targets
- 5.7 Supply Chain Structure and Procurement Trends
- 5.8 Supply-Demand Gap and Bottlenecks
- 5.9 Import Dependence and Sourcing Structure
- 5.10 Contract Manufacturing and Outsourcing
- 5.11 Regional Supply and Demand Concentration
Chapter 6 Australia Dental Bonding Agents Market Pricing Analysis
- 6.1 Pricing Structure and Measurement
- 6.2 Historical Pricing Trends, 2018-2025
- 6.3 Pricing Outlook, 2025-2035
- 6.4 Average Selling Price and Unit Economics
- 6.5 Pricing by Product and Market Segment
- 6.6 Geographic Pricing Differences
- 6.7 Key Input, Energy, Labor and Logistics Costs
- 6.8 Contract Pricing and Purchasing Models
- 6.9 Pricing Sensitivity and Competitive Positioning
- 6.10 Price, Margin and Profitability Implications
Chapter 7 Australia Dental Bonding Agents Market Dynamics
- 7.1 Market Growth Drivers
- 7.1.1 Demand-Side Drivers
- 7.1.2 Technology and Innovation Drivers
- 7.1.3 Infrastructure and Investment Drivers
- 7.1.4 Regulatory and Policy Drivers
- 7.2 Market Restraints
- 7.2.1 Cost and Affordability Constraints
- 7.2.2 Technology and Adoption Barriers
- 7.2.3 Supply Chain and Operational Constraints
- 7.3 Market Challenges
- 7.3.1 Competitive Pressure and Margin Erosion
- 7.3.2 Skills, Infrastructure and Implementation Gaps
- 7.4 Emerging Market Opportunities
- 7.5 Market Dynamics Impact and Time-Horizon Assessment
Chapter 8 Australia Dental Bonding Agents Value Chain Analysis
- 8.1 Industry Value Chain Overview
- 8.2 Upstream Suppliers and Critical Inputs
- 8.3 Technology and Component Providers
- 8.4 Manufacturing or Service Delivery
- 8.5 Distribution, Channel Partners and Integrators
- 8.6 Downstream Applications and End Users
- 8.7 Value Addition and Profit Pools
- 8.8 Vertical Integration and Outsourcing
- 8.9 Supplier Concentration and Risk
- 8.10 Supply Chain Localization and Resilience
Chapter 9 Australia Dental Bonding Agents Market Regulations and Policies
- 9.1 Relevant Laws, Standards and Compliance Frameworks
- 9.2 Product, Service, Safety and Quality Requirements
- 9.3 Government Policies, Incentives and Subsidies
- 9.4 Imports, Exports and Trade Barriers
- 9.5 Public Procurement and Local Content Requirements
- 9.6 Environmental and Sustainability Compliance
- 9.7 Upcoming Policy Changes and Market Implications
Chapter 10 Australia Dental Bonding Agents Market Hotspots and Opportunities
- 10.1 Market Opportunity Mapping and Growth Hotspots
- 10.2 High-Growth Applications and Customer Groups
- 10.3 Underserved Markets and White-Space Opportunities
- 10.4 Emerging Technology and Product Opportunities
- 10.5 New Capacity and Investment Hotspots
- 10.6 Market Entry and Expansion Opportunities
- 10.7 Distribution and Partnership Opportunities
- 10.8 Near-Term and Long-Term Commercial Potential
- 10.9 Opportunity Attractiveness and Execution Risks
Chapter 11 Australia Dental Bonding Agents Market Outlook, 2025-2035
- 11.1 Market Size and Analysis
- 11.1.1 Revenue (Market Measurement: 2025: USD 18.2 million → 2035: USD 47.9 million)
- 11.1.2 Market Volume and Quantity Sold
- 11.1.3 Historical Market Size, 2018-2025
- 11.1.4 Base-Year Market Size, 2025
- 11.2 Market Forecast, 2025-2035
- 11.2.1 Revenue Forecast to 2035
- 11.2.2 Volume Forecast to 2035
- 11.2.3 CAGR and Year-on-Year Growth
- 11.2.4 Incremental Revenue Opportunity
- 11.3 Forecast Assumptions and Scenario Analysis
- 11.3.1 Base-Case Forecast
- 11.3.2 Optimistic and Conservative Scenarios
- 11.3.3 Technology, Pricing and Policy Sensitivities
- 11.4 Market Attractiveness and Growth Outlook
Chapter 12 Australia Dental Bonding Agents Market Segmentation and Outlook
- 12.1 Segmentation Summary and Market Shares, 2025
- 12.2 Largest and Fastest-Growing Segments
- 12.3 By Product Type - Market Size and Forecast, 2025-2035
- 12.3.1 Segment Definition and Scope
- 12.3.2 Historical Market Size, 2018-2025
- 12.3.3 Revenue Forecast, 2025-2035
- 12.3.4 Volume Forecast, 2025-2035
- 12.3.5 Base-Year Market Share, 2025
- 12.3.6 Segment CAGR and Growth Drivers
- 12.3.7 Subsegment Market Size and Forecast
- 12.3.7.1 Universal Bonding Agents
- 12.3.7.2 Self-Etch Bonding Agents
- 12.3.7.3 Etch-and-Rinse Bonding Agents
- 12.3.8 Subsegment Pricing and Adoption Trends
- 12.3.9 Leading Suppliers and Competition
- 12.3.10 Regional Demand and Opportunities
- 12.4 By Application - Market Size and Forecast, 2025-2035
- 12.4.1 Segment Definition and Scope
- 12.4.2 Historical Market Size, 2018-2025
- 12.4.3 Revenue Forecast, 2025-2035
- 12.4.4 Volume Forecast, 2025-2035
- 12.4.5 Base-Year Market Share, 2025
- 12.4.6 Segment CAGR and Growth Drivers
- 12.4.7 Subsegment Market Size and Forecast
- 12.4.7.1 Direct Restorations
- 12.4.7.2 Indirect Restorations
- 12.4.7.3 Repair and Tooth-Surface Sealing
- 12.4.8 Subsegment Pricing and Adoption Trends
- 12.4.9 Leading Suppliers and Competition
- 12.4.10 Regional Demand and Opportunities
- 12.5 By End User - Market Size and Forecast, 2025-2035
- 12.5.1 Segment Definition and Scope
- 12.5.2 Historical Market Size, 2018-2025
- 12.5.3 Revenue Forecast, 2025-2035
- 12.5.4 Volume Forecast, 2025-2035
- 12.5.5 Base-Year Market Share, 2025
- 12.5.6 Segment CAGR and Growth Drivers
- 12.5.7 Subsegment Market Size and Forecast
- 12.5.7.1 Independent Private Practices
- 12.5.7.2 Corporate Dental Groups
- 12.5.7.3 Public Dental Services
- 12.5.7.4 Dental Education and Research
- 12.5.8 Subsegment Pricing and Adoption Trends
- 12.5.9 Leading Suppliers and Competition
- 12.5.10 Regional Demand and Opportunities
- 12.6 By Sales Channel - Market Size and Forecast, 2025-2035
- 12.6.1 Segment Definition and Scope
- 12.6.2 Historical Market Size, 2018-2025
- 12.6.3 Revenue Forecast, 2025-2035
- 12.6.4 Volume Forecast, 2025-2035
- 12.6.5 Base-Year Market Share, 2025
- 12.6.6 Segment CAGR and Growth Drivers
- 12.6.7 Subsegment Market Size and Forecast
- 12.6.7.1 Dental Distributor Accounts
- 12.6.7.2 Direct Manufacturer Accounts
- 12.6.7.3 Institutional Procurement Contracts
- 12.6.8 Subsegment Pricing and Adoption Trends
- 12.6.9 Leading Suppliers and Competition
- 12.6.10 Regional Demand and Opportunities
- 12.7 Segment Growth Comparison
- 12.8 Segment Attractiveness and Priority Matrix
Chapter 13 Australia Dental Bonding Agents End-Use and Application Market Outlook
- 13.1 End-Use Industry and Customer Demand Structure
- 13.2 Leading Applications and Customer Groups
- 13.3 End-Use Market Size, Share and Forecast
- 13.4 Major End-Use Industry Deep Dives
- 13.4.1 Customer Requirements and Use Cases
- 13.4.2 Demand and Replacement Cycles
- 13.4.3 Technical and Regulatory Considerations
- 13.4.4 Purchasing and Procurement Models
- 13.4.5 Leading Vendors and Distribution Channels
- 13.4.6 Forecast and Commercial Opportunities
- 13.5 Emerging Applications and Cross-Segment Demand
- 13.6 End-Use Industry Investment Priorities
Chapter 14 Australia Dental Bonding Agents Geographic Market Outlook, 2025-2035
- 14.1 Domestic Market Distribution and Demand Clusters
- 14.2 State- or Province-Wise Market Size and Forecast, 2025-2035
- 14.3 City and Metropolitan Market Outlook
- 14.4 Industrial, Manufacturing and Commercial Clusters
- 14.5 Geographic Concentration of Key End Users
- 14.6 Local Pricing and Purchasing Differences
- 14.7 Domestic Production Facilities and Capacity Map
- 14.8 Local Infrastructure and Project Pipeline
- 14.9 State-Level Policy and Incentive Differences
- 14.10 Subnational Investment Hotspots and Opportunities
- 14.11 Distribution and Logistics Networks
- 14.12 Domestic Competitive Footprint
Chapter 15 Australia Dental Bonding Agents Technology, Innovation and Sustainability Outlook
- 15.1 Technology Landscape and Maturity
- 15.2 Product, Process and Service Innovation
- 15.3 AI, Automation and Digital Tools in the Industry
- 15.4 Technology Adoption and Performance Benchmarking
- 15.5 Innovation Pipeline and R&D Investment
- 15.6 Patent and Intellectual Property Trends
- 15.7 Energy Efficiency and Resource Management
- 15.8 Sustainability, Recycling and Circularity
- 15.9 Technology Roadmap, 2025-2035
- 15.10 Risks of Obsolescence and Technology Substitution
Chapter 16 Australia Dental Bonding Agents Market Key Strategic Imperatives
- 16.1 Growth and Market Entry Priorities
- 16.2 High-Return Products and Segments
- 16.3 Pricing, Profitability and Cost Optimization
- 16.4 Technology Investment and Product Differentiation
- 16.5 Supply Chain Localization and Resilience
- 16.6 Distribution and Customer Acquisition
- 16.7 Partnership, Acquisition and Capacity Strategy
- 16.8 Regional Expansion Priorities
- 16.9 Short-, Medium- and Long-Term Actions
Chapter 17 Competition Outlook
- 17.1 Industry Competition Characteristics
- 17.2 Market Structure and Concentration
- 17.3 Market Share and Competitive Positioning, 2025
- 17.4 Company-Wise Revenue and Product Benchmarking
- 17.5 Production and Service Capacity Benchmarking
- 17.6 Technology, Pricing and Differentiation
- 17.7 Regional Footprint and Distribution Strength
- 17.8 Mergers, Acquisitions and Strategic Alliances
- 17.9 New Entrants and Competitive Threats
- 17.10 Porter's Five Forces and Industry Attractiveness
- 17.11 Competitive Outlook, 2025-2035
Chapter 18 Company Profiles
- 18.1 Company Coverage and Selection Criteria
- 18.2 Kuraray Noritake Dental
- 18.2.1 Business Description
- 18.2.2 Company Ownership and Geographic Presence
- 18.2.3 Product and Service Portfolio
- 18.2.4 Manufacturing and Operating Footprint
- 18.2.5 Production Capacity and Expansion Plans
- 18.2.6 Financial Performance and Investment
- 18.2.7 Market Share and Competitive Position
- 18.2.8 Technology and Innovation Capabilities
- 18.2.9 Strategic Alliances or Partnerships
- 18.2.10 Recent Developments
- 18.2.11 Growth Strategy and Outlook
- 18.3 Solventum
- 18.4 Dentsply Sirona
- 18.5 GC Corporation
- 18.6 Ivoclar
- 18.7 Other Relevant Market Participants
Note: Every listed company is profiled on the structure shown under the first company. The company list is preliminary and may change based on research findings, market developments, data availability and client requirements.
Chapter 19 Disclaimer
- 19.1 Research and Forecast Disclaimer
- 19.2 Data Source and Estimation Limitations
Note: The depth of individual sections depends on data availability for this market. Volume, capacity, trade and other unit-based metrics are included where applicable.

