
Health fund networks and practice buyouts reshape care
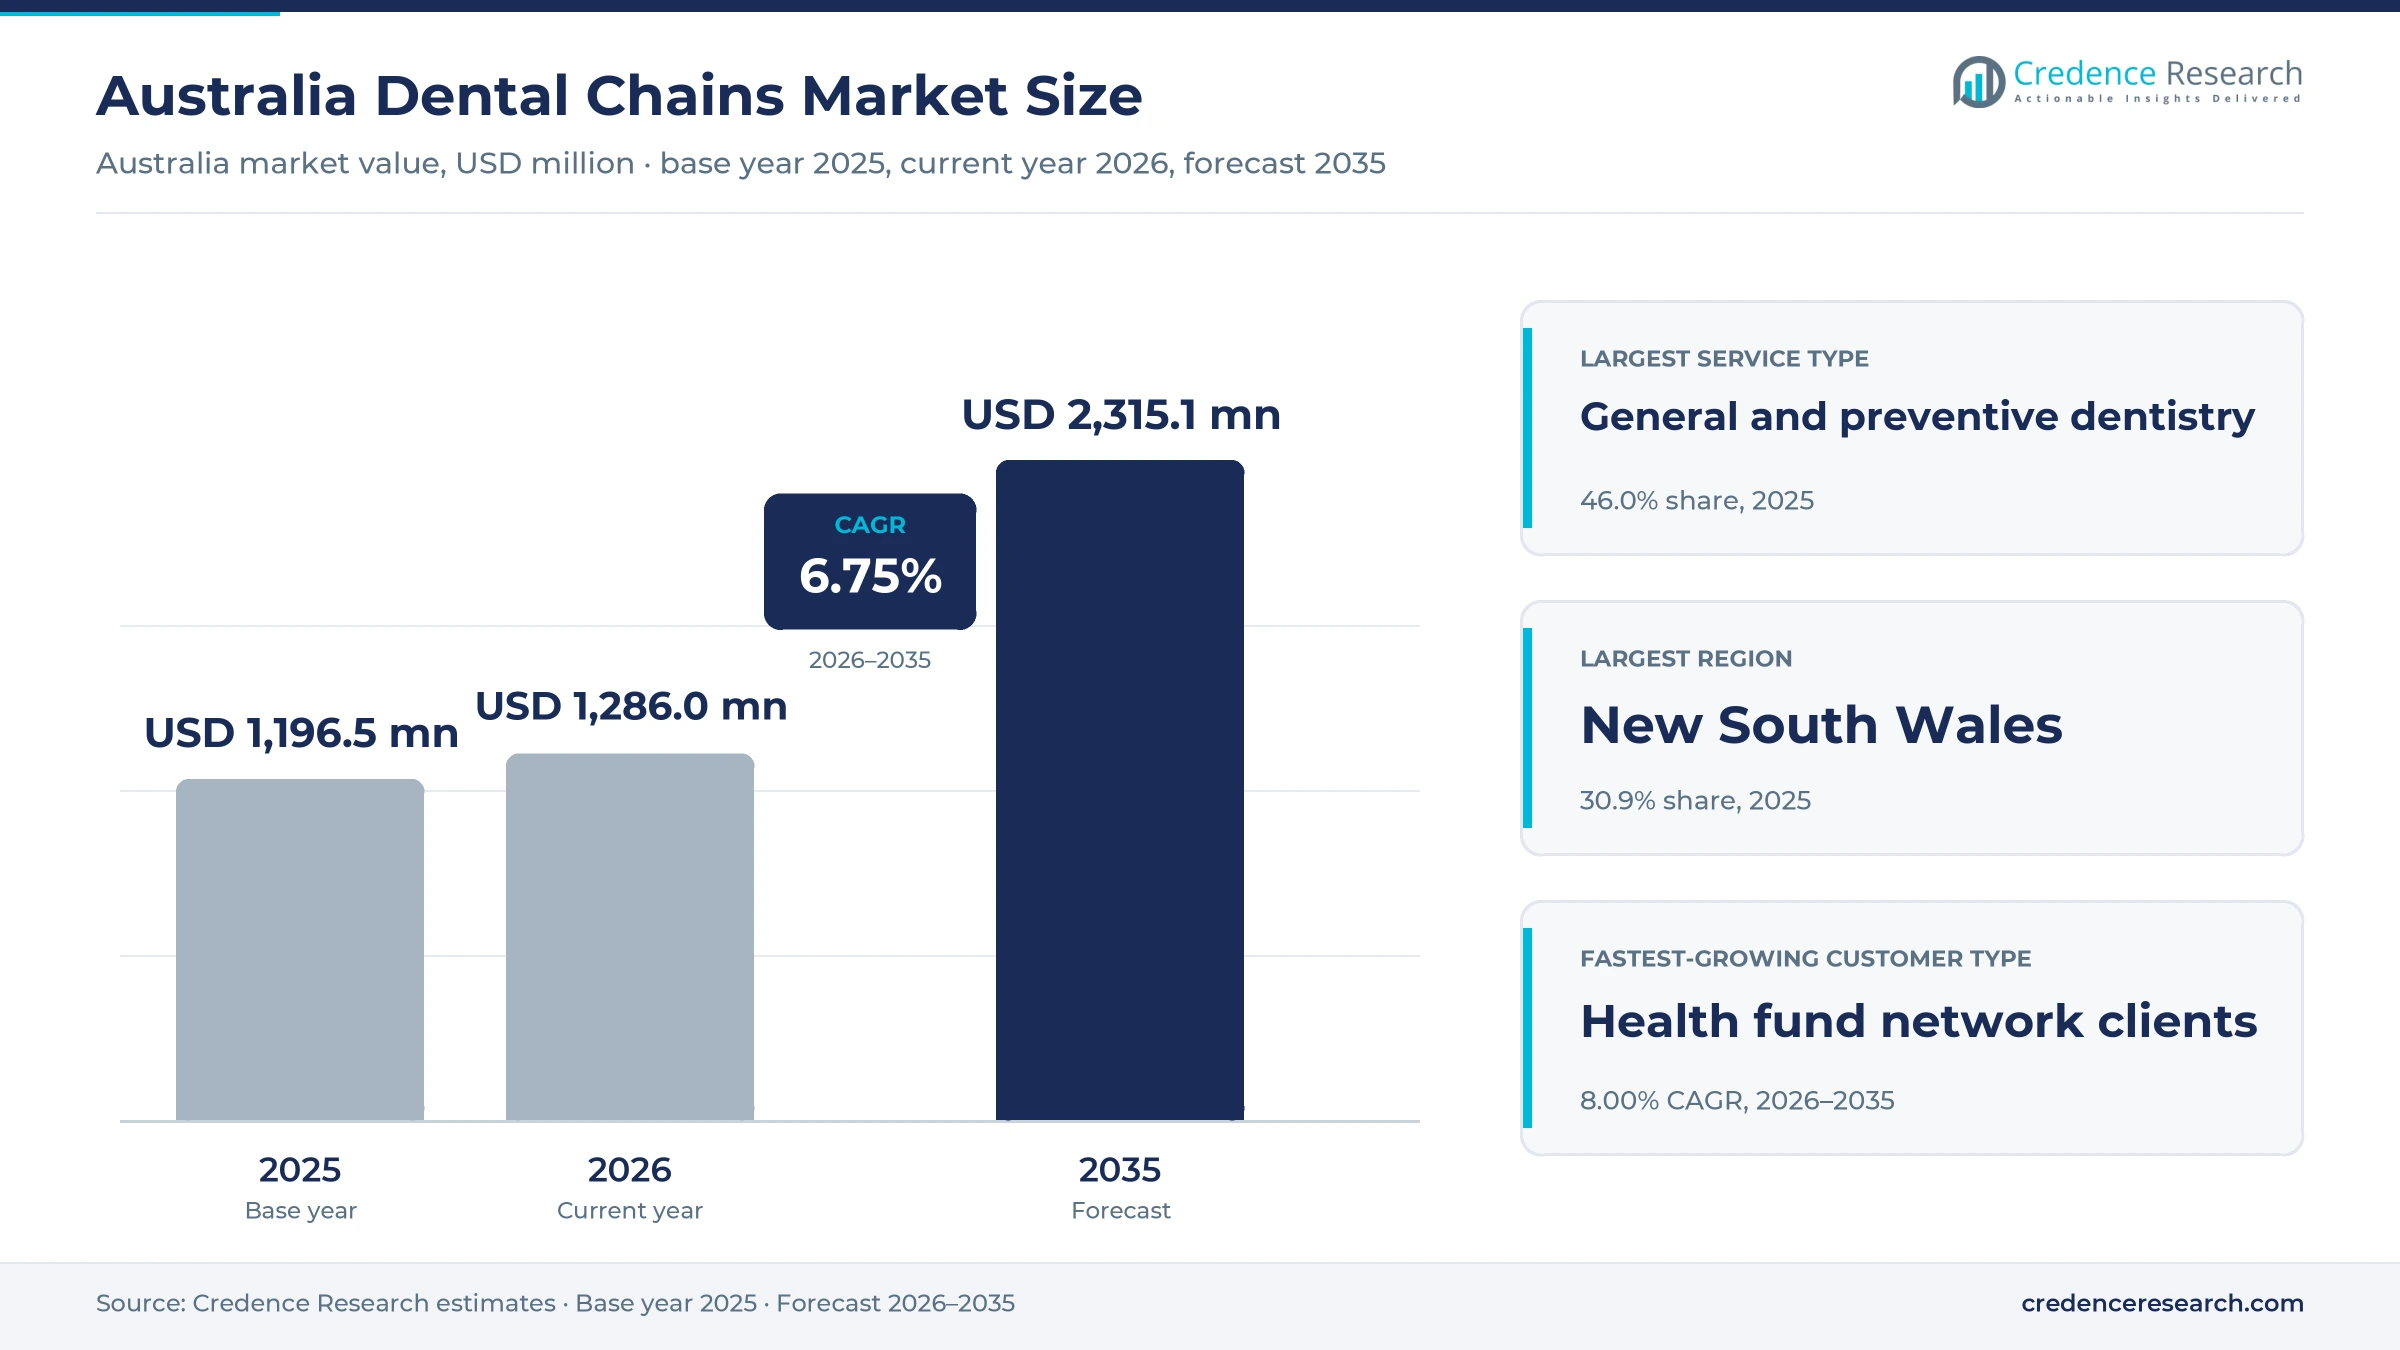
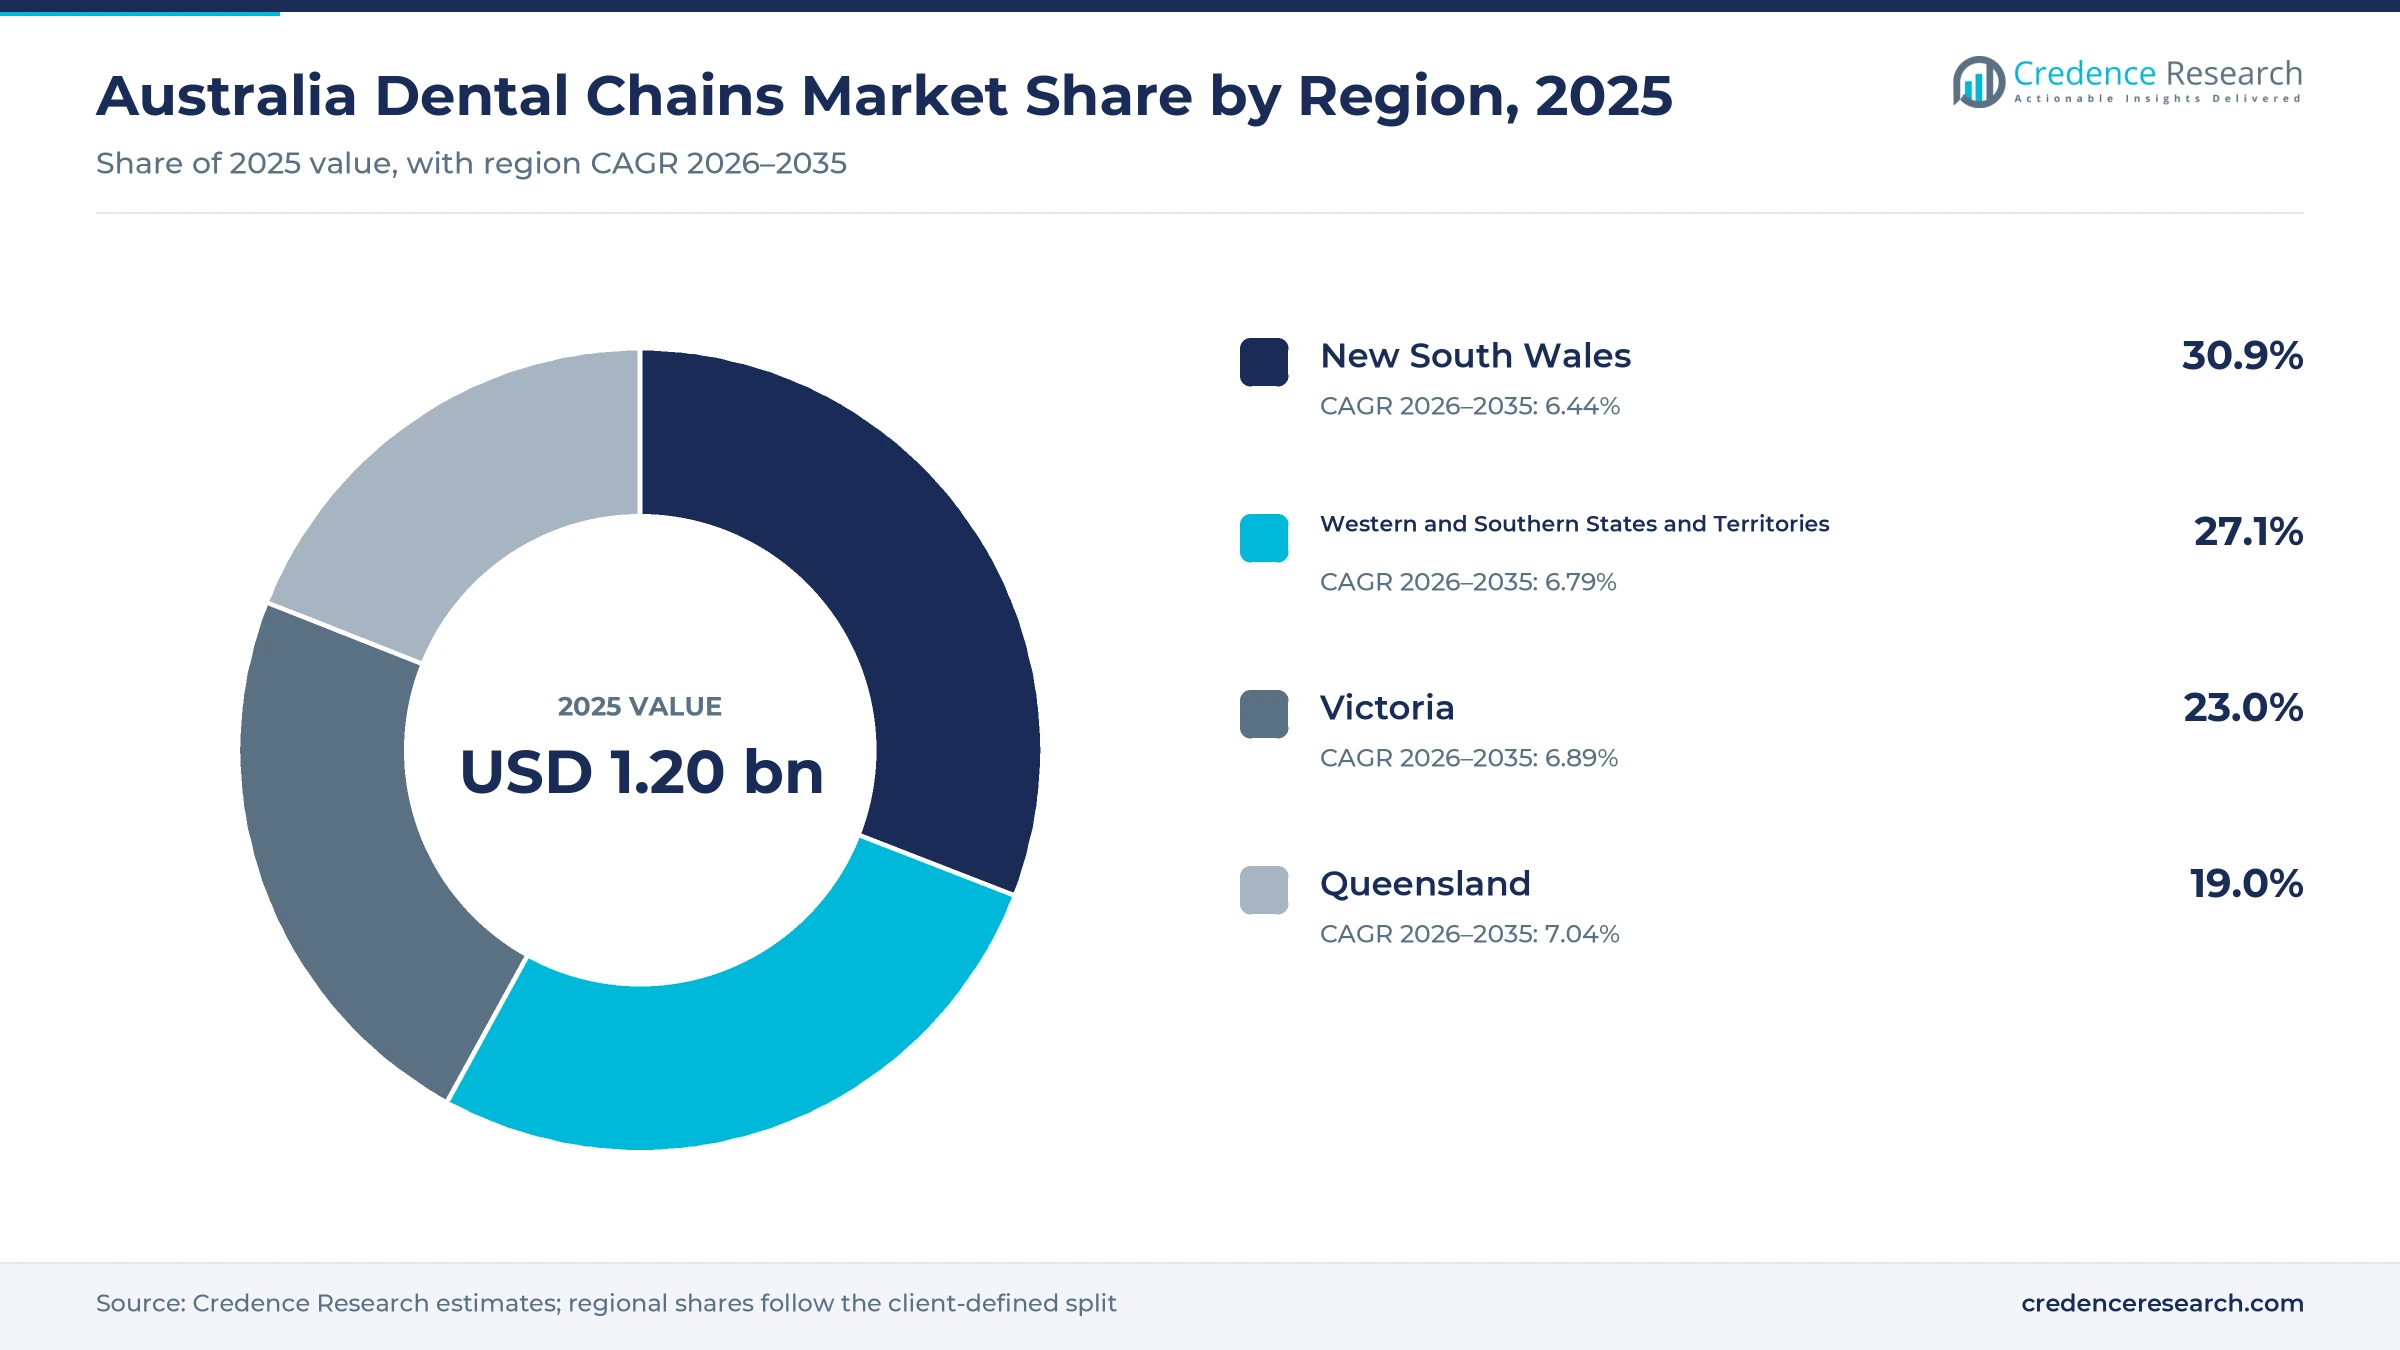
The Australia dental chains market was valued at USD 1.20 billion in 2025 and is projected to increase from USD 1.29 billion in 2026 to USD 2.32 billion by 2035, registering a CAGR of 6.75% during 2026–2035. Demand comes from insured households that use extras cover for twice-yearly checkups, from patients who need restorative or orthodontic work, and from health funds that steer members toward contracted clinics. New South Wales held the largest regional share, 30.9% in 2025, because it has the largest population and the densest network of group-run clinics in shopping and medical centers. Queensland is the fastest-growing region at 7.04% a year, as population growth adds new suburbs and clinics. In turn, ownership is shifting quickly, with an investor-backed bidder taking control of one of the largest listed operators in late 2024 and moving to full ownership in October 2025.
Which group-run clinics does the estimate cover?
The estimate measures the value of oral care delivered through groups that run several clinics under one brand, support office or health fund agreement. It counts patient fees, health fund benefits paid at group clinics, public scheme payments and the fees that groups charge dentists for rooms, staff and support services.
The estimate excludes single owner-run practices, public hospital dental units, dental laboratories and the sale of equipment and consumables. The value chain runs from health funds, investors and support offices through clinic networks to dentists, hygienists and oral health therapists who treat patients in every state and territory.
Australia Dental Chains Market Insights
- The Australia dental chains market was valued at USD 1.20 billion in 2025 and is projected to reach USD 2.32 billion by 2035, registering a CAGR of 6.75% during 2026–2035.
- New South Wales held a 30.9% share of 2025 value, because the state has the largest population and the most group-run clinics.
- General and preventive dentistry led with a 46.0% share of 2025 value, because checkups and cleans drive most visits to group clinics.
- An investor-backed bidder acquired a relevant interest in over 90% of Pacific Smiles Group in October 2025 and began compulsory acquisition.
- Health fund network clients grow fastest at 8.00% a year during 2026–2035, as insurers extend gap-free checkups to contracted clinics.
Preventive care leads as orthodontic services grow fastest
Why does preventive care dominate group clinic revenue?
Based on service type, the market is categorized into General and Preventive Dentistry, Restorative and Specialist Dentistry, Orthodontic and Cosmetic Dentistry, and Network Management Services. General and Preventive Dentistry led with a 46.0% share of 2025 value, because checkups, cleans and fillings make up most appointments. Network Management Services grow fastest at 7.87% a year, as groups sell support to dentists who keep their own patient lists.
How do insured and uninsured patients split spending?
Based on customer type, the market is categorized into Insured Households, Uninsured Households, Publicly Supported Patients and Health Fund Network Clients. Insured Households led with a 52.0% share of 2025 value, because extras cover pays part of most routine bills. Health Fund Network Clients grow fastest at 8.00% a year, as insurers route members to clinics that offer no-gap checkups.
How do patients reach group-run clinics?
Based on channel, the market is categorized into Direct Patient Booking, Health Fund Referral, Clinical Referral and Institutional Contracting. Direct Patient Booking led with a 55.0% share of 2025 value, because most patients book online or by phone with a clinic near home or work. Health Fund Referral grows fastest at 7.65% a year, as insurers promote preferred clinics inside their member apps and websites.
Which operating models do the largest groups use?
Based on operating model, the market is categorized into Direct Clinic Operation, Facilities-service Operation, Dentist Partnership Operation and Managed Network Operation. Direct Clinic Operation led with a 38.0% share of 2025 value, because fund-owned and listed groups employ or contract dentists inside their own clinics. Managed Network Operation grows fastest at 7.48% a year, as health funds and groups contract independent clinics into branded networks.
| Segment Group | Leading Sub-segment | Share, 2025 | Fastest-growing Sub-segment | CAGR, 2026–2035 |
|---|---|---|---|---|
| By Service Type | General and Preventive Dentistry | 46.0% | Network Management Services | 7.87% |
| By Customer Type | Insured Households | 52.0% | Health Fund Network Clients | 8.00% |
| By Channel | Direct Patient Booking | 55.0% | Health Fund Referral | 7.65% |
| By Operating Model | Direct Clinic Operation | 38.0% | Managed Network Operation | 7.48% |
Request a Free Sample
Fill in your details and we'll send you a free sample report.
- Sample data tables & charts
- Research methodology
Checkups, succession sales and workforce scale lift demand
How does recurring preventive care keep group chairs full?
Insured patients return every six months for checkups that their extras cover pays in full or in part, which gives Australian dental chains a steady base of booked appointments. Some 15,209,525 people, or 55.1% of the population, held general treatment cover on June 30, 2025, according to the Australian Prudential Regulation Authority. Funds paid AUD 950.93 million in dental benefits across 14,016,632 services in the June 2025 quarter alone, and dental was the largest extras category at AUD 273.15 per insured person over the year. Some 53.9% of people aged 15 years and over saw a dental professional in 2024-25, according to the ABS Patient Experiences survey. As a result, general and preventive dentistry holds 46.0% of 2025 value across group-run clinics.
Why do succession sales speed up practice consolidation?
Many owner dentists want to retire or reduce clinical hours without closing their practices, so they sell to larger groups that can keep patient lists and staff in place. About 90% of Australian clinics are still owner-operated, according to an advisory note from BDO Australia published in September 2025, which leaves a large pool of potential sellers. Corporate buyers usually pay 75% to 80% upfront and the rest through an earn-out over three to four years, which suits owners who plan a gradual exit. National Dental Care started with four practices in Queensland in 2013 and now runs over 100 practices, including Western Australia's DB Dental. In turn, dentist partnership operation grows faster than direct clinic operation, while Managed Network Operation grows fastest at 7.48% a year.
How do clinical workforce platforms help groups grow?
Large networks can recruit, train and roster dentists across many sites more easily than a single practice, which lets them open and staff new clinics faster. Pacific Smiles Group reported about 750,000 practitioner hours across 126 centers and 543 commissioned chairs in its annual report for fiscal 2025, with appointments up 5.1% to 1.1 million. Bupa states that over 900 dentists practise with its clinics, while National Dental Care describes a community of more than 750 dental professionals. Start-up costs for a new practice typically run from AUD 600,000 to AUD 650,000, which favors groups with central capital. As a result, direct clinic operation keeps 38.0% of 2025 value.
Why do health fund networks steer members to group clinics?
Insurers can offer no-gap checkups only where they own clinics or hold supply contracts, so they direct members toward group sites that accept fixed fees. Bupa states that more than 145 Bupa-owned Members First Ultimate practices operate across Australia for members with eligible extras cover. Pacific Smiles owns and operates 11 nib-branded centers and runs HBF clinics in Western Australia under a managed services agreement, where HBF Dental delivered about 72,000 appointments in fiscal 2025, up 21.7%. Australian Unity also signed a preferred provider agreement with National Dental Care in January 2023. In turn, health fund network clients grow at 8.00% a year, the fastest customer rate.
Fund-linked networks, partnerships and new payers emerge
How are fund-linked clinic networks changing access?
Insurers now compete on how many members can see a contracted dentist without a gap, which pushes them to sign exclusive deals with large operators. Pacific Smiles and nib signed a non-binding memorandum in June 2024 to extend the nib dental offer from 11 centers to all 117 centers then operating, with exclusivity for two years in the areas the group serves. Australian Unity sold its five Melbourne dental clinics to National Dental Care in mid-2023 as part of its member arrangement. Bupa also links more than 145 owned practices to its extras products. As a result, health fund referral grows at 7.65% a year, the fastest channel rate, as insurers route members through their own apps.
Why is the rise of dentist partnership models notable?
Sellers increasingly want to keep equity and clinical control after a sale, which has made partnership and support service models a standard offer among large operators. National Dental Care invites dentists to partner with it so they can realize the value of their business while it handles support services. Ekera Dental provides support services to its dentists in return for a service fee and lists 54 clinics across five states, up from eight Victorian practices in August 2015. National Dental Care operated more than 70 clinics in January 2023 and now lists over 100 practices. In turn, facilities-service operation and dentist partnership operation together hold more than half of 2025 value, while direct clinic operation grows at the slowest rate.
Can orthodontic and cosmetic care lift revenue per patient?
Group clinics already see large numbers of adults who ask about straighter or whiter teeth during checkups, which creates a ready pool for higher-value treatment plans. Groups that offer clear aligner treatment can convert routine visits into longer treatment plans with recurring appointments. People aged 65 to 74 years were more likely than those aged 25 to 34 years to see a dental professional in 2024-25, at 59.7% compared with 46.9% in the ABS Patient Experiences survey, which shows room to win younger adults. Corporate groups also add implant systems for older patients who need tooth replacement. As a result, orthodontic and cosmetic dentistry grows faster than general care, second only to Network Management Services at 7.87% a year.
Is there room to serve patients who delay care?
Many Australians still put off dental visits due to cost, which leaves a large group of patients that affordable clinic networks could reach. Some 25% of people delayed or did not see a dental professional when needed in 2024-25, according to the Australian Bureau of Statistics. Some 16% cited cost as a barrier, while only 42% of people in the most disadvantaged areas saw a dental professional, compared with 65% in the least disadvantaged areas. The World Health Organization notes that out-of-pocket costs for oral health care can be major barriers to accessing care, a pattern that matches the cost barrier reported by Australian patients. In turn, groups that offer payment plans and public scheme services can widen their patient base among households that now delay visits.
Costs, staffing gaps and patient affordability test groups
How do wage costs squeeze group clinic margins?
Dentists, nurses and reception staff make up the largest share of clinic spending, so every pay rise hits group margins directly. About two-thirds of practices name wages and fixed overheads as their biggest cost challenge, according to BDO Australia. As a result, many groups have raised pay or offered flexible hours to keep clinicians. Larger networks respond by sharing rosters, central purchasing and back-office services across sites, which spreads fixed costs over more chairs.
Why do regional staffing gaps limit expansion?
General dentists are hardest to find outside the capital cities, which makes regional clinics difficult to staff and grow. Rural Australians also have fewer dental practitioners per person and poorer oral health than people in major cities. In turn, groups that open regional clinics face empty chairs and longer patient waits. Operators respond with relocation support, graduate programs and sponsorship of overseas-trained dentists who agree to work in regional towns.
How do patient affordability limits cap visit volumes?
Most adult dental care in Australia is paid privately, so household budgets decide how often many patients book a visit. Some 16% of people cited cost as a barrier to seeing a dental professional in 2024-25. As a result, uninsured households grow more slowly than insured households, because many skip checkups until pain forces a visit. Clinics respond with payment plans, while public schemes cover children and some low-income adults through capped benefits.
Why do cyber risks and data rules worry multi-site groups?
A single breach can expose patient records from dozens of clinics at once, which makes data security a board-level issue for large operators. Nearly 29% of practices have experienced a cyber breach, according to BDO Australia. In turn, groups must invest in secure systems, staff training and incident plans before linking clinics on shared platforms. Larger operators respond with central security teams, while smaller groups rely on outside providers to protect patient data.
New South Wales leads as Queensland grows fastest
| Region | Value, 2025 (USD billion) | Share, 2025 | CAGR, 2026–2035 |
|---|---|---|---|
| New South Wales | 0.37 | 30.9% | 6.44% |
| Western and Southern States and Territories | 0.32 | 27.1% | 6.79% |
| Victoria | 0.28 | 23.0% | 6.89% |
| Queensland | 0.23 | 19.0% | 7.04% |
Why does New South Wales hold the top share?
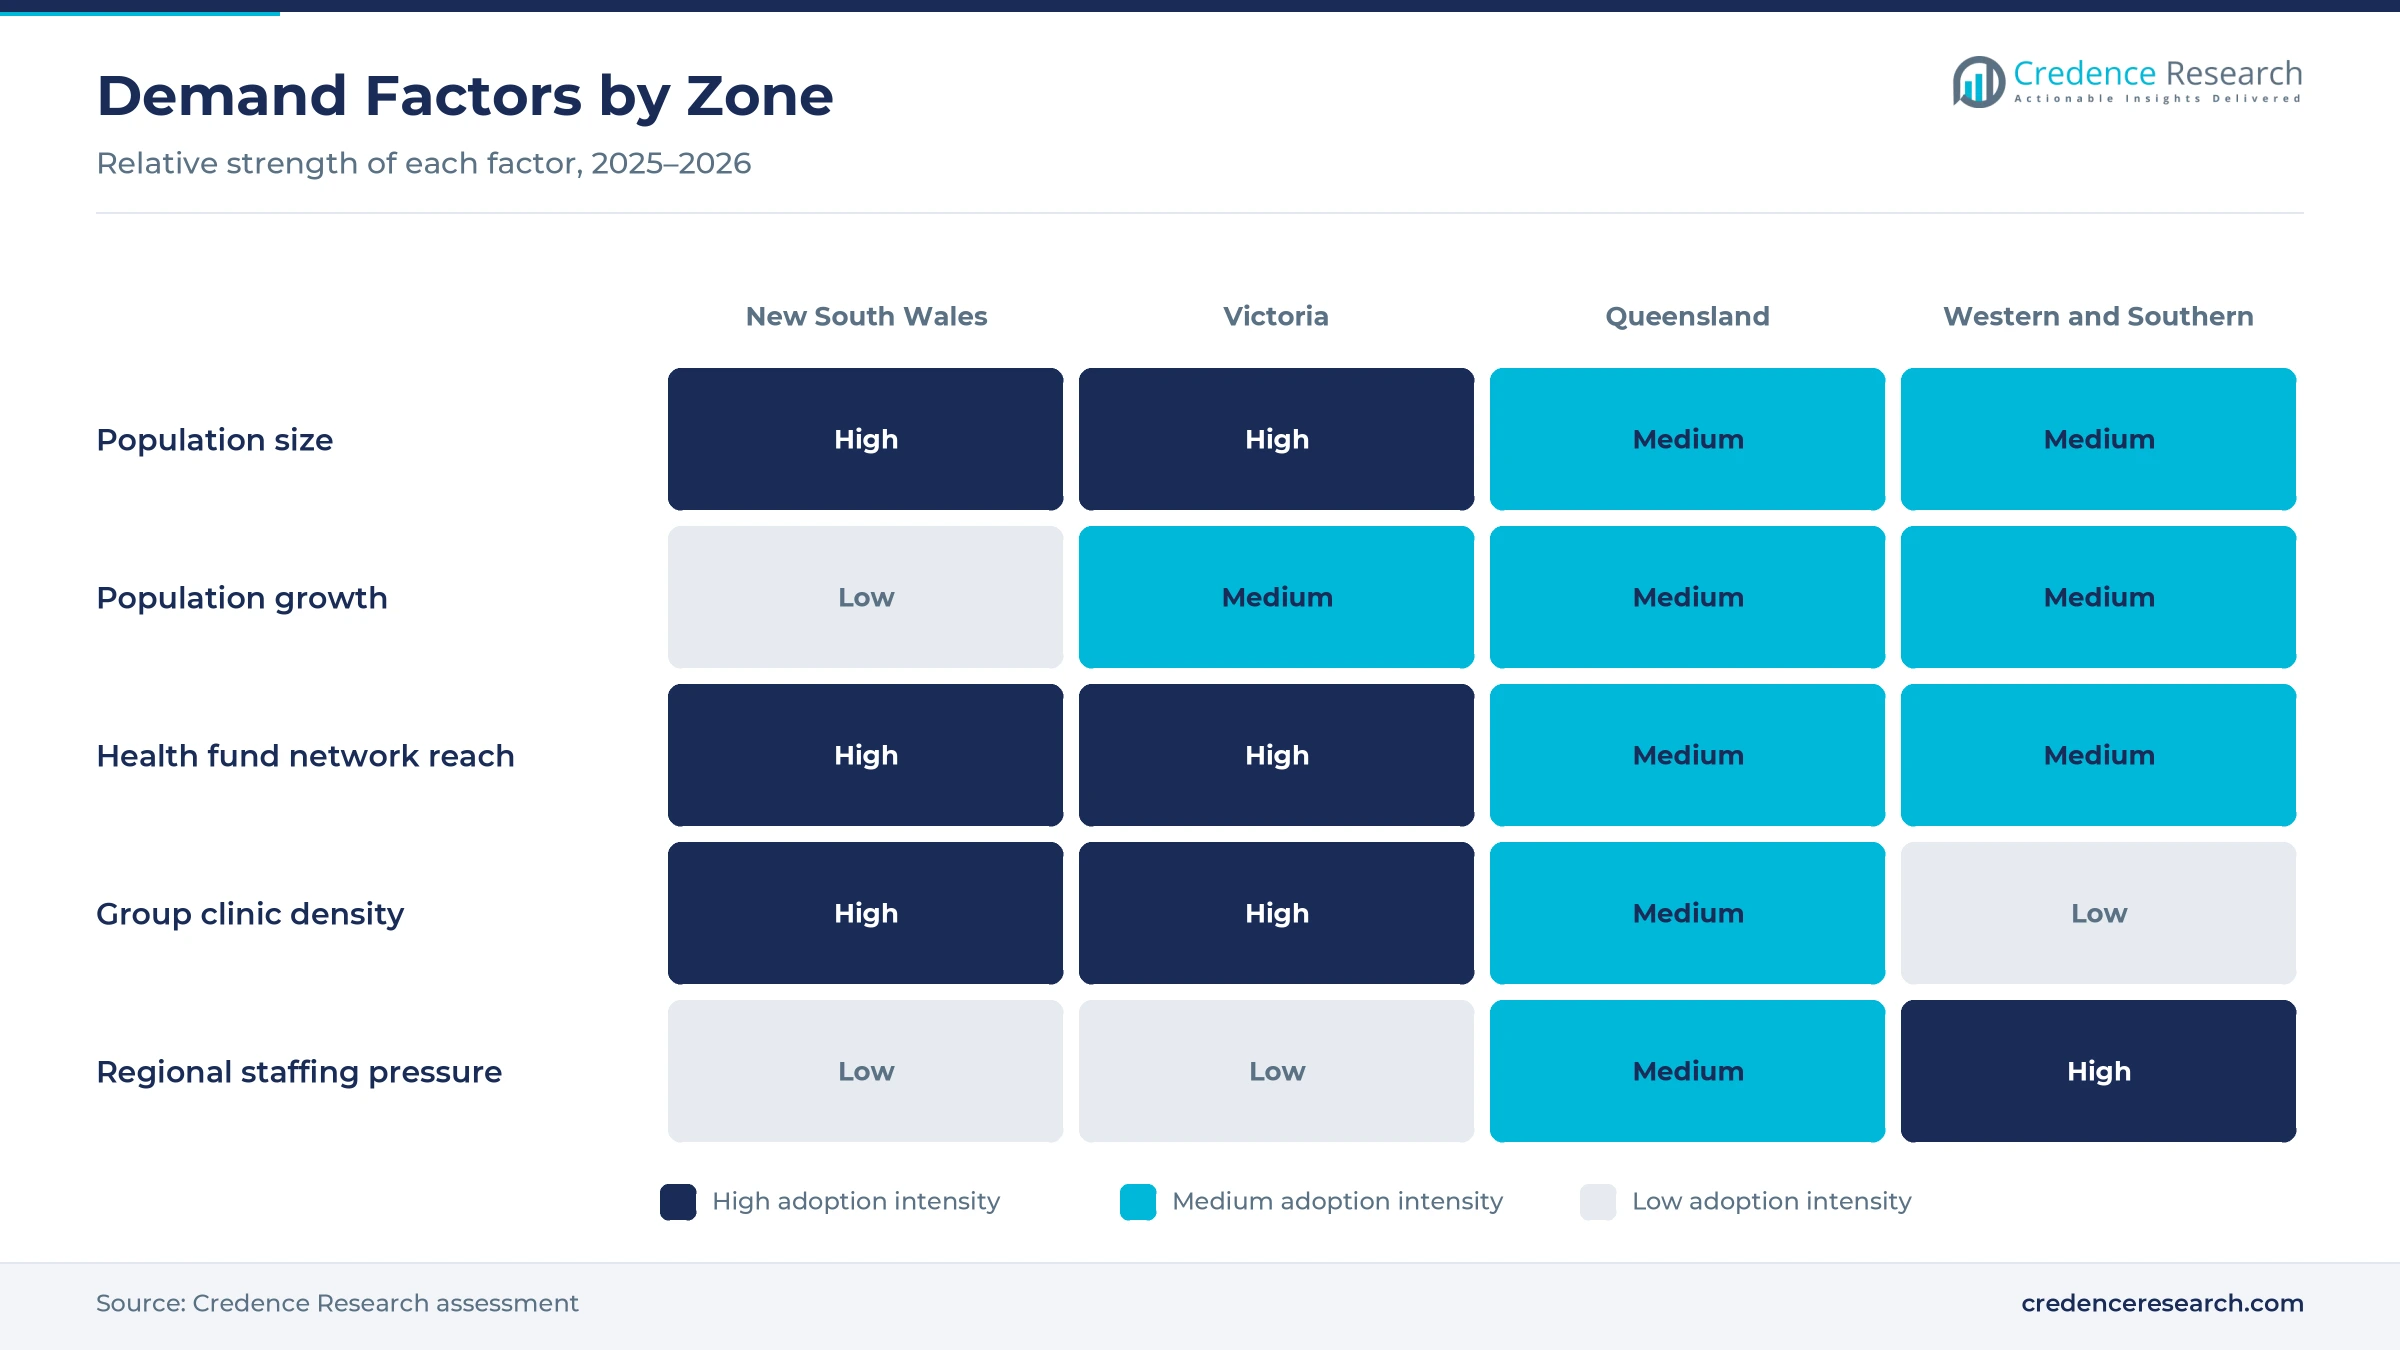
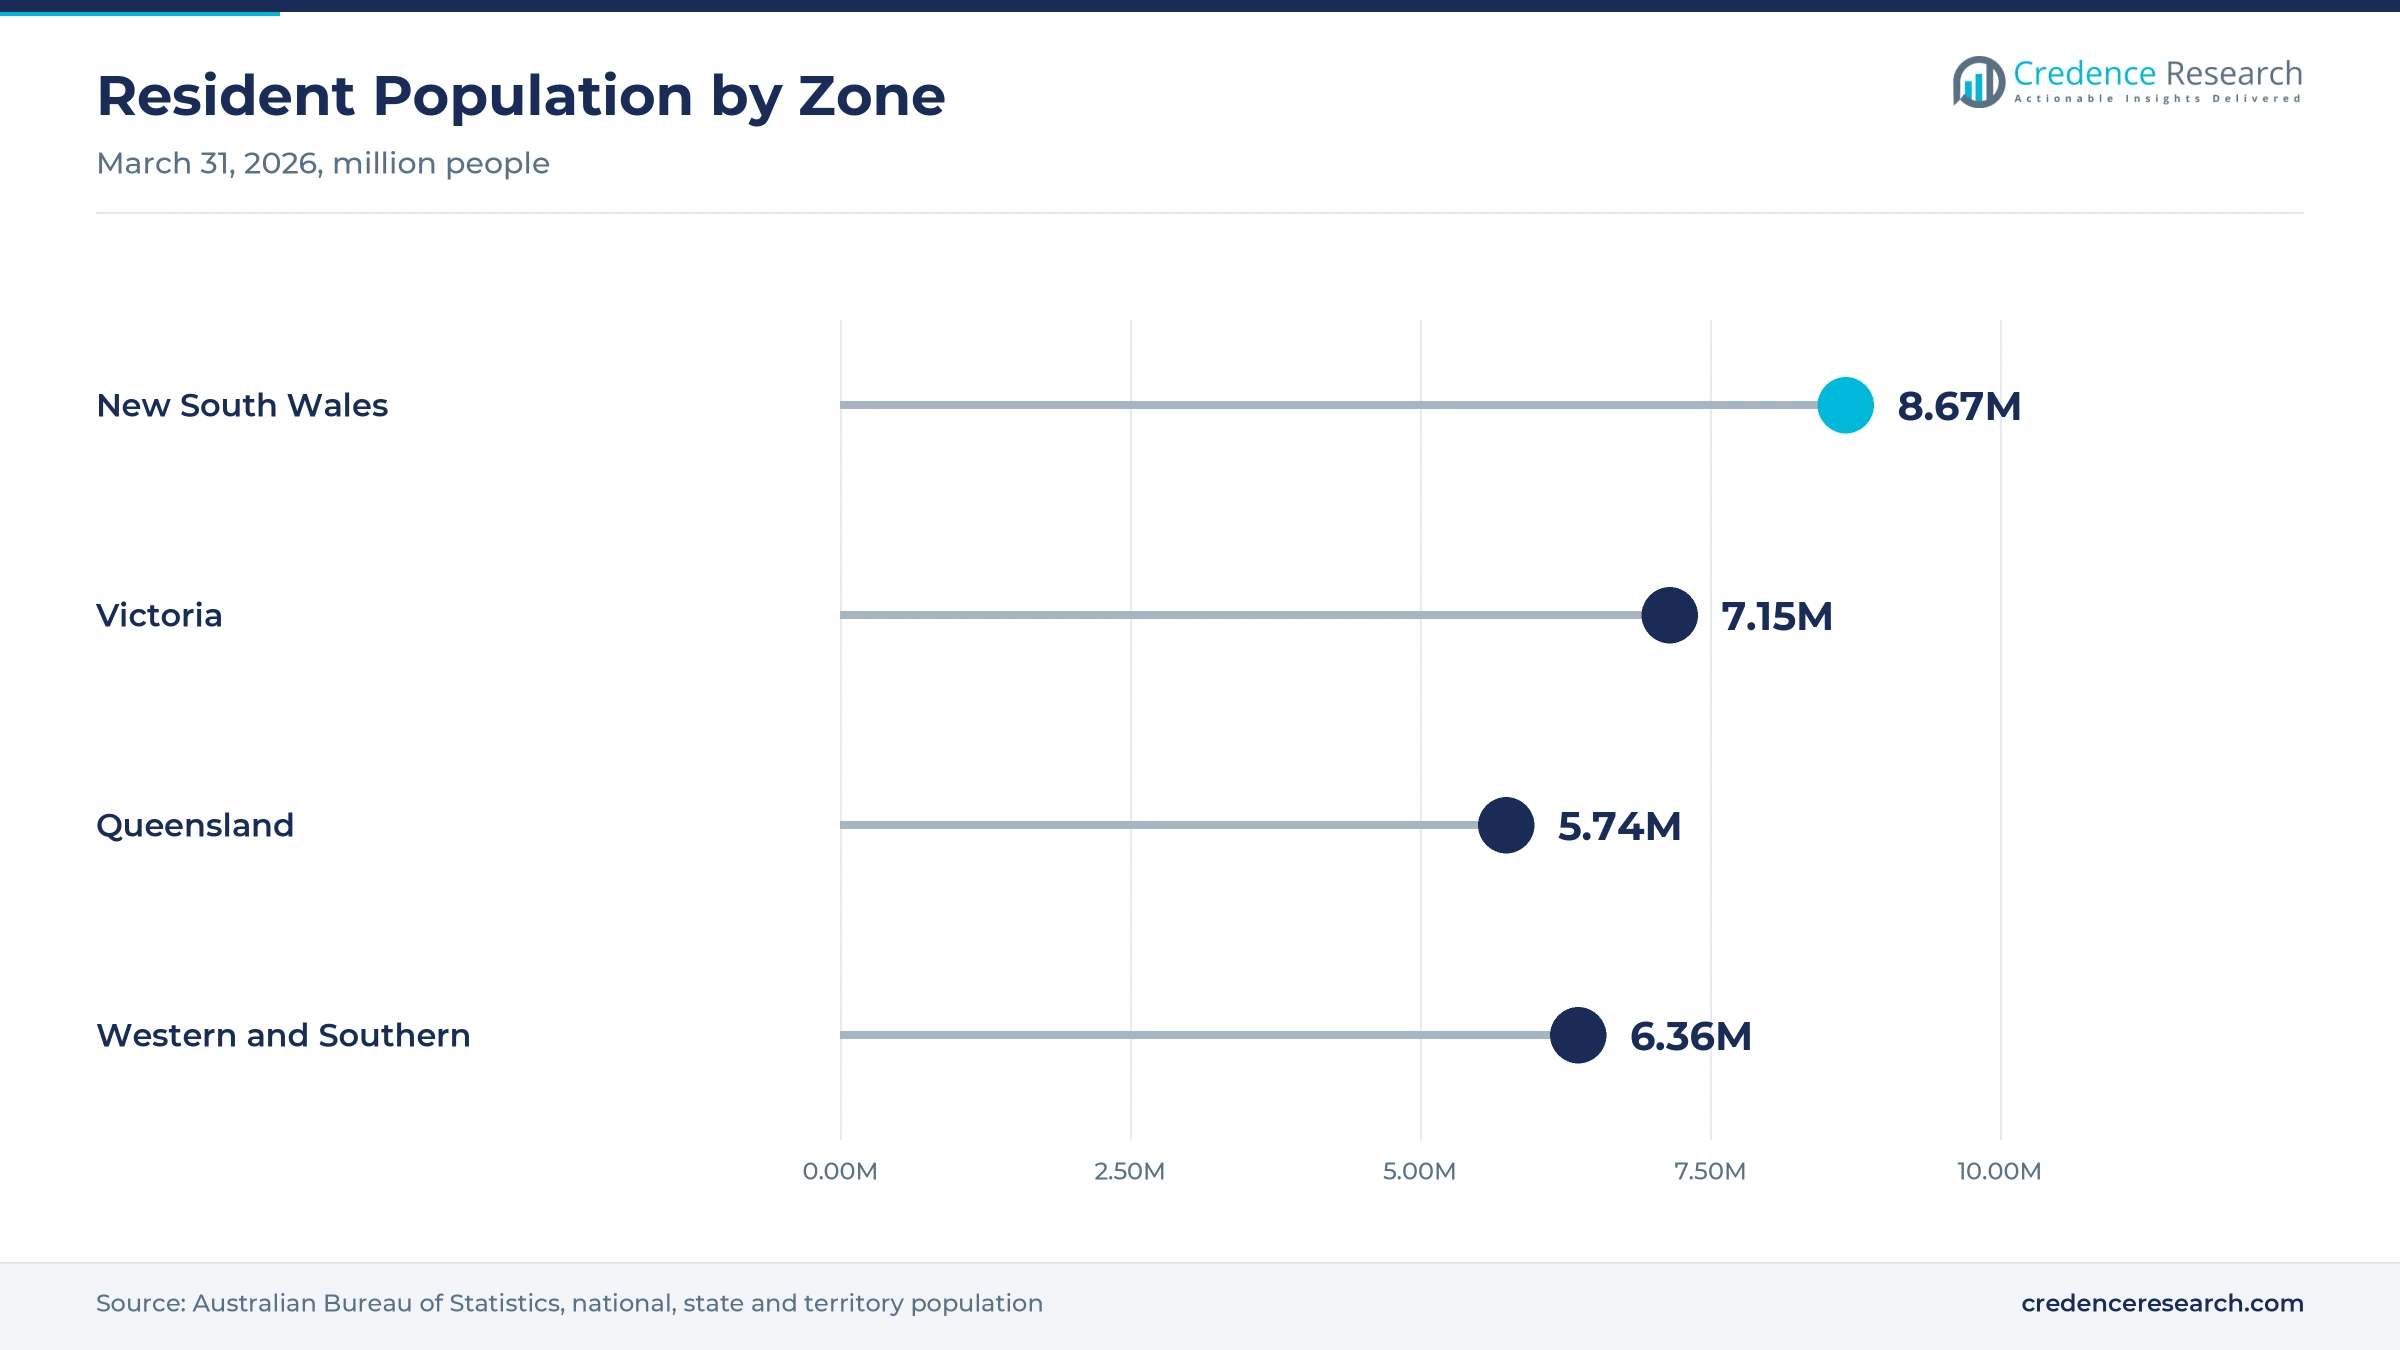
New South Wales held a 30.9% share of 2025 value and grows at 6.44% a year, because the state has the largest population and the densest network of group-run clinics. It had 8.67 million residents on March 31, 2026, and more than half of the original nib Dentalcare centers were in the state. As a result, New South Wales leads health fund network visits, while slower population growth of 1.1% keeps its rate below the national average.
How does Victoria support group clinic demand?
Victoria held a 23.0% share of 2025 value and grows at 6.89% a year, because Melbourne has a dense base of shopping center and medical center clinics. The state had 7.15 million residents on March 31, 2026, after growth of 1.6% over the year. Ekera Dental began in Melbourne and regional Victoria, while National Dental Care took over five Melbourne clinics from Australian Unity in 2023. In turn, Victoria remains the second-largest zone for group clinic value.
Why is Queensland growing fastest?
Queensland held a 19.0% share of 2025 value and grows fastest at 7.04% a year, because population growth in south-east Queensland keeps adding new suburbs and clinics. The state had 5.74 million residents on March 31, 2026, after growth of 1.6% over the year. National Dental Care began with four Brisbane practices, and 1300SMILES grew from its Townsville base. As a result, new group clinics often open in Queensland first.
What shapes demand in the western and southern zone?
Western and southern states and territories held a 27.1% share of 2025 value and grow at 6.79% a year, because the zone mixes fast-growing Perth with slower states. Western Australia grew 2.1% over the year to March 2026, the fastest rate nationally, while Tasmania grew 0.6%. As a result, Perth drives most new demand through HBF-linked clinics and local groups.
Takeovers, fund deals and funding caps, 2024–2026
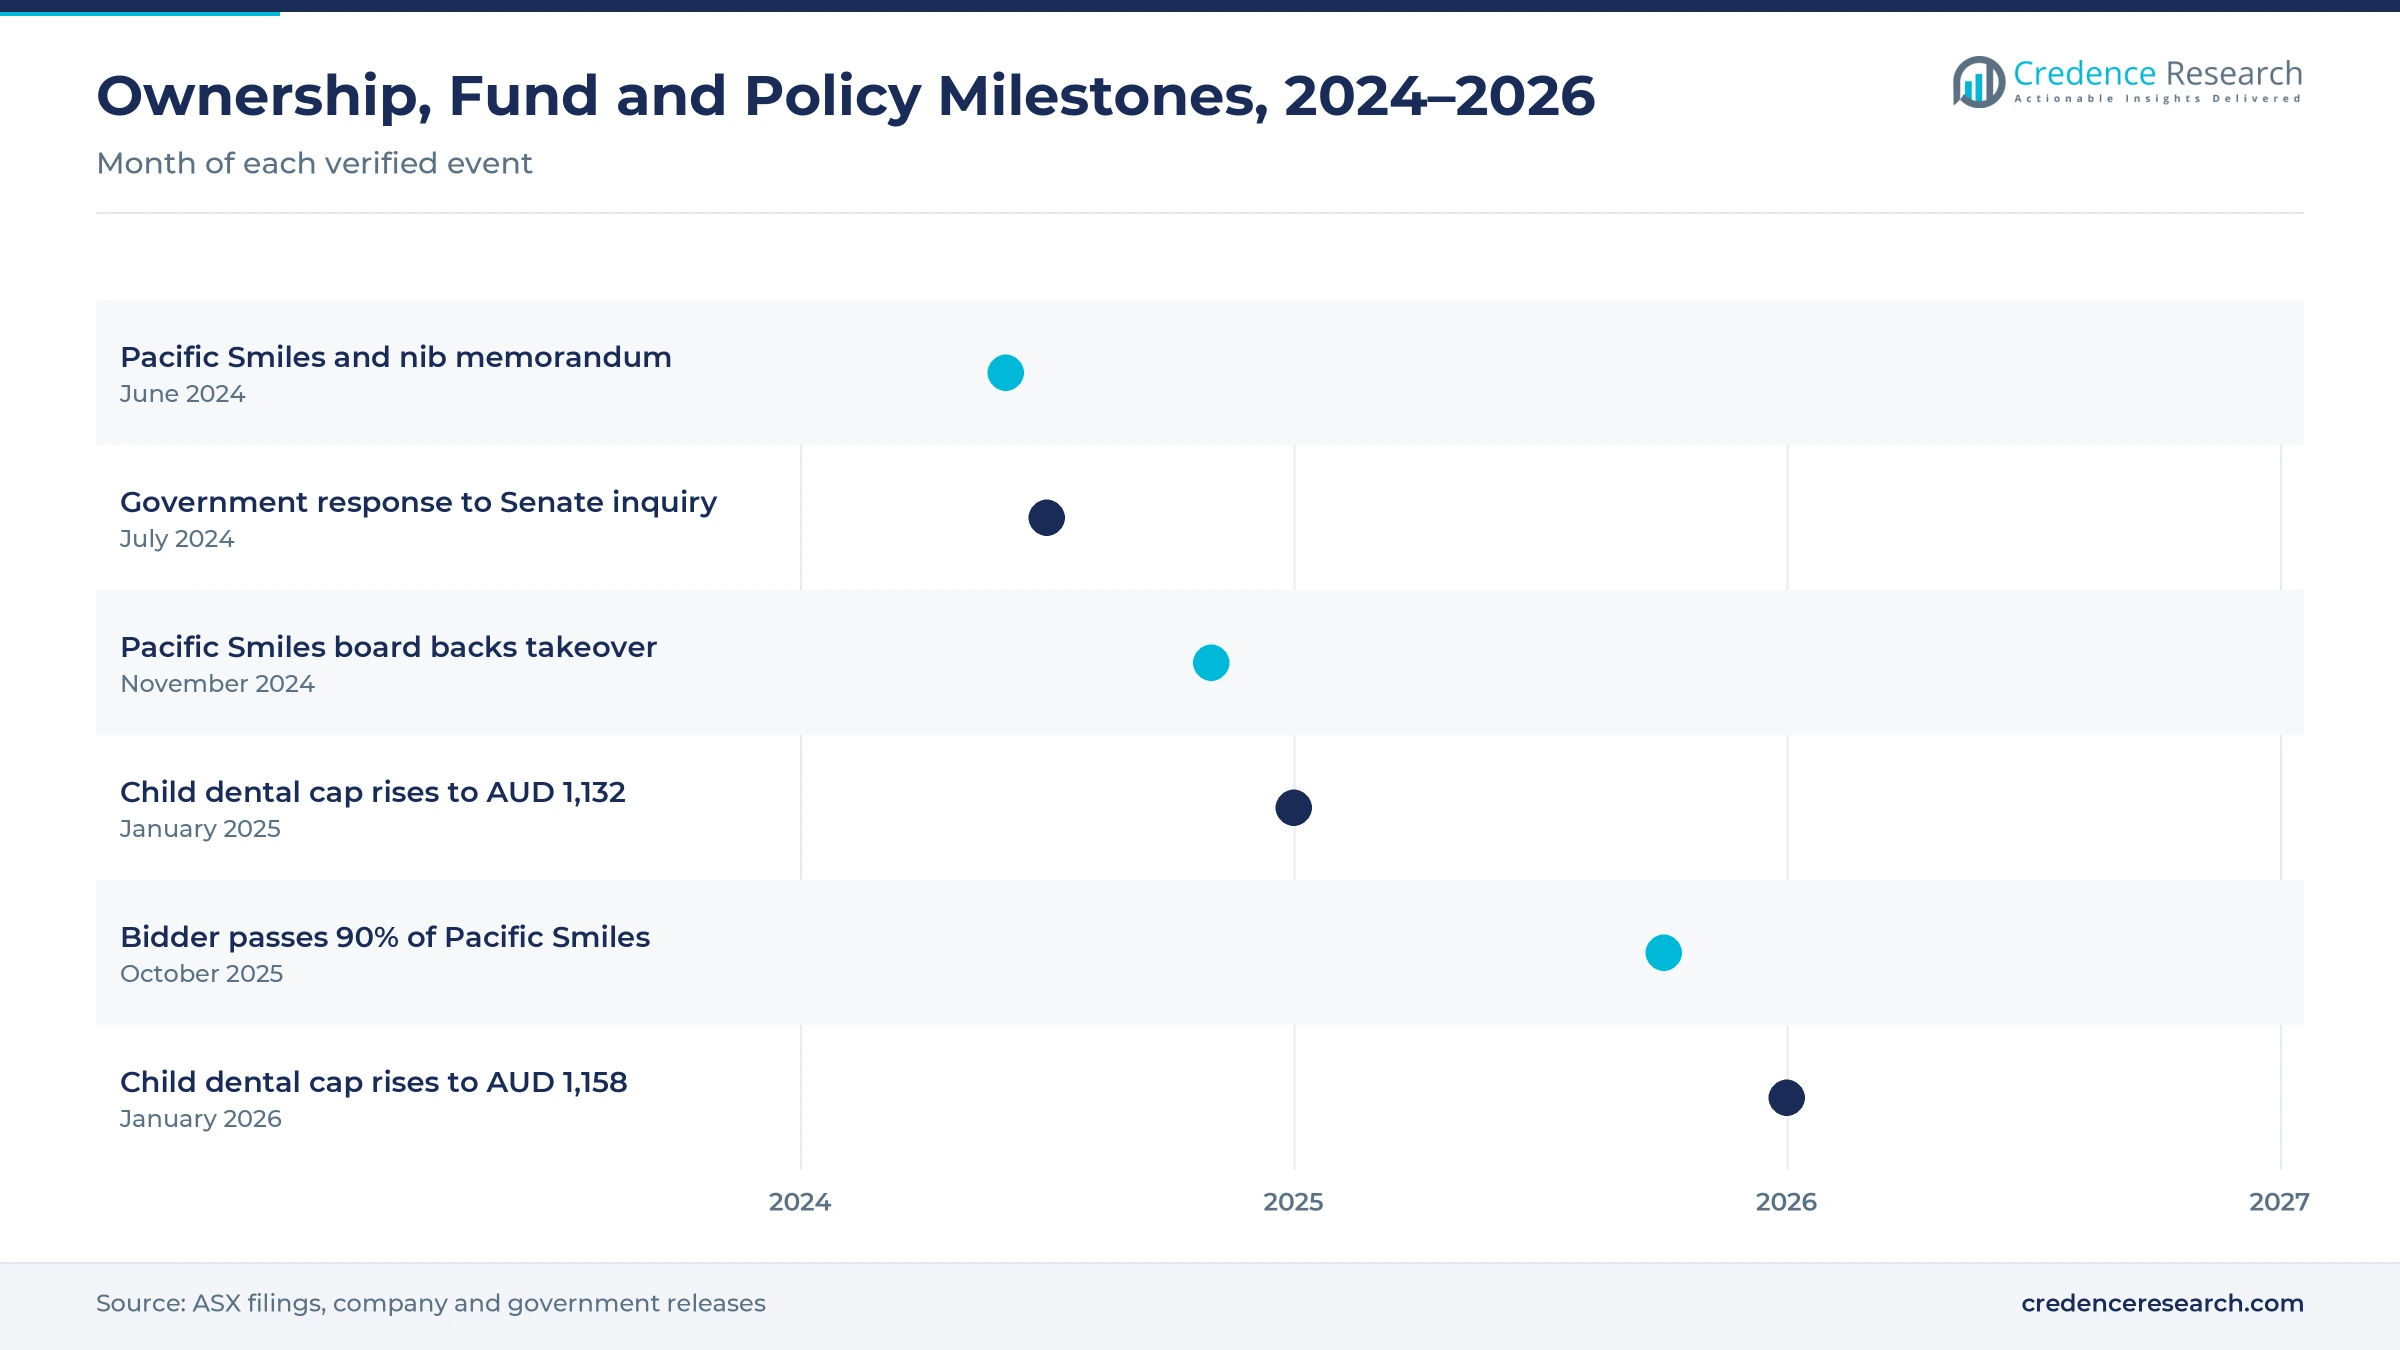
| Development | Status and market relevance |
|---|---|
| In June 2024, Pacific Smiles Group and nib signed a non-binding memorandum to extend the nib dental offer to all of its centers. | Would add two years of exclusivity in the areas the group serves |
| In July 2024, the federal government responded to the Senate dental services inquiry, supporting or supporting in principle 11 of 35 recommendations. | Keeps public dental reform on the policy agenda |
| In November 2024, the Pacific Smiles board recommended an investor-backed takeover offer after a contest of about 11 months. | Ends a rival approach from National Dental Care |
| In October 2025, Beam Dental Bidco acquired a relevant interest in over 90% of Pacific Smiles shares and began compulsory acquisition of the remaining shares. | Moves one of the largest listed groups into private ownership |
| In January 2026, the Child Dental Benefits Schedule cap rose to AUD 1,158 for treatment periods starting that year. | Supports funded checkups for eligible children at group clinics |
Booking platforms, digital records and AI change clinics
- Online booking and member apps let patients choose a clinic, see health fund gaps and book appointments, which lifts direct and fund-referred visits.
- Shared clinical records link patient histories across sites, which lets groups move dentists between clinics and use one practice management software platform.
- Digital imaging and AI review support faster diagnosis, which helps groups standardize care through shared oral radiography equipment and second-read tools, which BDO Australia estimates about 12% of practices already use.
Need a Custom Version of This Report?
Tailor the scope, geography, or segments to your exact requirements.
- Custom geography or segment scope
- Direct access to our analyst team
Fund-owned and investor-backed groups compete for clinics
Competition is split between health fund-owned networks, investor-backed groups and support organizations that serve independent dentists. Bupa runs more than 145 owned practices linked to its extras products and states that over 900 dentists practise with it. National Dental Care, backed by Crescent Capital Partners, has grown to over 100 practices through acquisitions and partnerships. Pacific Smiles Group runs 126 centers, including nib-branded clinics and HBF clinics in Western Australia, and moved into private ownership in 2025. Abano Healthcare operates the Maven Dental and 1300SMILES clinic brands in Australia, while Ekera Dental lists 54 clinics across five states. Rivals compete on health fund contracts, clinic locations, dentist terms and support services. Because sellers weigh earn-out terms and clinical freedom, groups with flexible partnership offers win more practices.
Which companies run multi-clinic groups in Australia?
| Company | Type | Role in the market |
|---|---|---|
| Bupa Dental Care Australia | Health fund-owned network | More than 145 owned Members First Ultimate practices |
| National Dental Care | Investor-backed group | Over 100 practices and a partnership model for dentists |
| Pacific Smiles Group | Investor-owned group | 126 centers including nib-branded and HBF-managed clinics |
| Abano Healthcare Australia | Dental support organization | Runs the Maven Dental and 1300SMILES clinic brands in Australia |
| Ekera Dental | Support services provider | 54 clinics across five states on a service fee model |
Credence Research view on multi-clinic oral care groups
Credence Research's view is that Australian dental chains will grow steadily because insured households keep returning for checkups and health funds keep widening their contracted networks. Preventive care remains the largest value pool, while orthodontic work and support services add the fastest growth. Ownership will keep shifting as owner dentists retire and investors buy clinics. Groups that combine strong fund contracts, flexible partnership terms and reliable recruitment should gain share fastest, while wage costs and regional staffing gaps will slow expansion outside the main cities.
How the national group practice estimate was built
The report uses 2025 as the base year on a calendar basis, and market values come from the Credence Research model. That model combines private health insurance statistics, national health service use surveys, population data, public dental funding schedules, listed company reports and company network disclosures. Segment splits and zone growth rates are Credence Research estimates, while zone shares follow the client-defined split. Sources used are official statistics, government releases, stock exchange filings, advisory publications and company releases, and no interviews or surveys were used.
Fund networks and partnerships carry growth to 2035
Value across Australian dental chains is expected to reach USD 2.32 billion by 2035, a 6.75% CAGR during 2026–2035, as health funds widen their networks and more owners sell into larger groups. Growth should stay strong through 2030 while investors complete takeovers and add clinics in growing suburbs. After that, orthodontic services and partnership fees will carry more of the value. Stronger public funding would lift visit volumes, while rising wages would slow new clinic openings. Groups with flexible dentist terms are expected to gain the most.
Frequently Asked Questions
How big is the Australia dental chains market?
Which service type leads group clinic value?
Which region leads the Australian market?
How many Australians hold general treatment cover?
What happened to Pacific Smiles Group?
Which customer type is growing fastest?
Who are the leading companies in the Australian market?
What are the main challenges for group operators?
Table of Content
Chapter 1 Market Segmentation
- 1.1 Segmentation Framework
- 1.1.1 Product and Service Classification
- 1.1.2 Application and End-Use Classification
- 1.1.3 Technology and Solution Classification
- 1.1.4 Customer and Distribution Channel Classification
- 1.1.5 Geographic Segmentation
- 1.1.6 Market Segment Definitions and Boundaries
- 1.2 By Service Type
- 1.2.1 General and Preventive Dentistry
- 1.2.2 Restorative and Specialist Dentistry
- 1.2.3 Orthodontic and Cosmetic Dentistry
- 1.2.4 Network Management Services
- 1.3 By Customer Type
- 1.3.1 Insured Households
- 1.3.2 Uninsured Households
- 1.3.3 Publicly Supported Patients
- 1.3.4 Health Fund Network Clients
- 1.4 By Channel
- 1.4.1 Direct Patient Booking
- 1.4.2 Health Fund Referral
- 1.4.3 Clinical Referral
- 1.4.4 Institutional Contracting
- 1.5 By Operating Model
- 1.5.1 Direct Clinic Operation
- 1.5.2 Facilities-service Operation
- 1.5.3 Dentist Partnership Operation
- 1.5.4 Managed Network Operation
Chapter 2 Introduction
- 2.1 Report Objectives and Scope
- 2.2 Product Definition and Industry Terminology
- 2.3 Market Inclusions and Exclusions
- 2.4 Research Process
- 2.4.1 Primary Research and Expert Interviews
- 2.4.2 Secondary Research and Source Review
- 2.4.3 Top-Down and Bottom-Up Estimation
- 2.4.4 Data Triangulation and Verification
- 2.5 Market Size Measurement Basis
- 2.5.1 2025: USD 1.20 billion → 2035: USD 2.32 billion
- 2.6 Historical and Forecast Reference Periods
- 2.6.1 Historical Period: 2018-2025
- 2.6.2 Base Year: 2025
- 2.6.3 Forecast Period: 2025-2035
- 2.7 Research Assumptions and Limitations
Chapter 3 Executive Summary
- 3.1 Market Snapshot and Key Findings
- 3.2 Base-Year Market Size, 2025
- 3.3 Forecast Market Size, 2035
- 3.4 Revenue and Volume Growth Outlook
- 3.5 Key Demand and Supply Indicators
- 3.6 Leading Market Segments
- 3.7 Fastest-Growing Market Opportunities
- 3.8 Regional Performance Highlights
- 3.9 Technology and Industry Transformation
- 3.10 Competitive Landscape Summary
- 3.11 Analyst View and Strategic Implications
Chapter 4 Australia Dental Chains Market Trends and Developments
- 4.1 Historical Industry Development, 2018-2025
- 4.2 Recent Market Trends and Developments
- 4.3 Demand and Customer Behavior Trends
- 4.4 Technology and Product Innovation
- 4.5 Artificial Intelligence, Automation and Digitalization
- 4.6 Local Manufacturing and Supply Chain Realignment
- 4.7 Industry Partnerships, Mergers and Acquisitions
- 4.8 Sustainability and Circular Economy Developments
- 4.9 Government and Private Sector Investment Trends
- 4.10 Emerging Business Models and Commercialization
- 4.11 Industry Developments and Announcements
Chapter 5 Australia Dental Chains Market Production, Supply and Demand Analysis
- 5.1 Demand Trend and Consumption Analysis, 2018-2025
- 5.2 Demand Forecast, 2025-2035
- 5.3 Production and Output Trend, 2018-2025
- 5.4 Production and Output Forecast, 2025-2035
- 5.5 Installed Capacity and Capacity Utilization
- 5.6 Company-Wise Production Plants and Statistics
- 5.6.1 Installed Production Capacity
- 5.6.2 Actual Production
- 5.6.3 Planned Capacity and Expansion Targets
- 5.7 Supply Chain Structure and Procurement Trends
- 5.8 Supply-Demand Gap and Bottlenecks
- 5.9 Import Dependence and Sourcing Structure
- 5.10 Contract Manufacturing and Outsourcing
- 5.11 Regional Supply and Demand Concentration
Chapter 6 Australia Dental Chains Market Pricing Analysis
- 6.1 Pricing Structure and Measurement
- 6.2 Historical Pricing Trends, 2018-2025
- 6.3 Pricing Outlook, 2025-2035
- 6.4 Average Selling Price and Unit Economics
- 6.5 Pricing by Product and Market Segment
- 6.6 Geographic Pricing Differences
- 6.7 Key Input, Energy, Labor and Logistics Costs
- 6.8 Contract Pricing and Purchasing Models
- 6.9 Pricing Sensitivity and Competitive Positioning
- 6.10 Price, Margin and Profitability Implications
Chapter 7 Australia Dental Chains Market Dynamics
- 7.1 Market Growth Drivers
- 7.1.1 Demand-Side Drivers
- 7.1.2 Technology and Innovation Drivers
- 7.1.3 Infrastructure and Investment Drivers
- 7.1.4 Regulatory and Policy Drivers
- 7.2 Market Restraints
- 7.2.1 Cost and Affordability Constraints
- 7.2.2 Technology and Adoption Barriers
- 7.2.3 Supply Chain and Operational Constraints
- 7.3 Market Challenges
- 7.3.1 Competitive Pressure and Margin Erosion
- 7.3.2 Skills, Infrastructure and Implementation Gaps
- 7.4 Emerging Market Opportunities
- 7.5 Market Dynamics Impact and Time-Horizon Assessment
Chapter 8 Australia Dental Chains Value Chain Analysis
- 8.1 Industry Value Chain Overview
- 8.2 Upstream Suppliers and Critical Inputs
- 8.3 Technology and Component Providers
- 8.4 Manufacturing or Service Delivery
- 8.5 Distribution, Channel Partners and Integrators
- 8.6 Downstream Applications and End Users
- 8.7 Value Addition and Profit Pools
- 8.8 Vertical Integration and Outsourcing
- 8.9 Supplier Concentration and Risk
- 8.10 Supply Chain Localization and Resilience
Chapter 9 Australia Dental Chains Market Regulations and Policies
- 9.1 Relevant Laws, Standards and Compliance Frameworks
- 9.2 Product, Service, Safety and Quality Requirements
- 9.3 Government Policies, Incentives and Subsidies
- 9.4 Imports, Exports and Trade Barriers
- 9.5 Public Procurement and Local Content Requirements
- 9.6 Environmental and Sustainability Compliance
- 9.7 Upcoming Policy Changes and Market Implications
Chapter 10 Australia Dental Chains Market Hotspots and Opportunities
- 10.1 Market Opportunity Mapping and Growth Hotspots
- 10.2 High-Growth Applications and Customer Groups
- 10.3 Underserved Markets and White-Space Opportunities
- 10.4 Emerging Technology and Product Opportunities
- 10.5 New Capacity and Investment Hotspots
- 10.6 Market Entry and Expansion Opportunities
- 10.7 Distribution and Partnership Opportunities
- 10.8 Near-Term and Long-Term Commercial Potential
- 10.9 Opportunity Attractiveness and Execution Risks
Chapter 11 Australia Dental Chains Market Outlook, 2025-2035
- 11.1 Market Size and Analysis
- 11.1.1 Revenue (Market Measurement: 2025: USD 1.20 billion → 2035: USD 2.32 billion)
- 11.1.2 Market Volume and Quantity Sold
- 11.1.3 Historical Market Size, 2018-2025
- 11.1.4 Base-Year Market Size, 2025
- 11.2 Market Forecast, 2025-2035
- 11.2.1 Revenue Forecast to 2035
- 11.2.2 Volume Forecast to 2035
- 11.2.3 CAGR and Year-on-Year Growth
- 11.2.4 Incremental Revenue Opportunity
- 11.3 Forecast Assumptions and Scenario Analysis
- 11.3.1 Base-Case Forecast
- 11.3.2 Optimistic and Conservative Scenarios
- 11.3.3 Technology, Pricing and Policy Sensitivities
- 11.4 Market Attractiveness and Growth Outlook
Chapter 12 Australia Dental Chains Market Segmentation and Outlook
- 12.1 Segmentation Summary and Market Shares, 2025
- 12.2 Largest and Fastest-Growing Segments
- 12.3 By Service Type - Market Size and Forecast, 2025-2035
- 12.3.1 Segment Definition and Scope
- 12.3.2 Historical Market Size, 2018-2025
- 12.3.3 Revenue Forecast, 2025-2035
- 12.3.4 Volume Forecast, 2025-2035
- 12.3.5 Base-Year Market Share, 2025
- 12.3.6 Segment CAGR and Growth Drivers
- 12.3.7 Subsegment Market Size and Forecast
- 12.3.7.1 General and Preventive Dentistry
- 12.3.7.2 Restorative and Specialist Dentistry
- 12.3.7.3 Orthodontic and Cosmetic Dentistry
- 12.3.7.4 Network Management Services
- 12.3.8 Subsegment Pricing and Adoption Trends
- 12.3.9 Leading Suppliers and Competition
- 12.3.10 Regional Demand and Opportunities
- 12.4 By Customer Type - Market Size and Forecast, 2025-2035
- 12.4.1 Segment Definition and Scope
- 12.4.2 Historical Market Size, 2018-2025
- 12.4.3 Revenue Forecast, 2025-2035
- 12.4.4 Volume Forecast, 2025-2035
- 12.4.5 Base-Year Market Share, 2025
- 12.4.6 Segment CAGR and Growth Drivers
- 12.4.7 Subsegment Market Size and Forecast
- 12.4.7.1 Insured Households
- 12.4.7.2 Uninsured Households
- 12.4.7.3 Publicly Supported Patients
- 12.4.7.4 Health Fund Network Clients
- 12.4.8 Subsegment Pricing and Adoption Trends
- 12.4.9 Leading Suppliers and Competition
- 12.4.10 Regional Demand and Opportunities
- 12.5 By Channel - Market Size and Forecast, 2025-2035
- 12.5.1 Segment Definition and Scope
- 12.5.2 Historical Market Size, 2018-2025
- 12.5.3 Revenue Forecast, 2025-2035
- 12.5.4 Volume Forecast, 2025-2035
- 12.5.5 Base-Year Market Share, 2025
- 12.5.6 Segment CAGR and Growth Drivers
- 12.5.7 Subsegment Market Size and Forecast
- 12.5.7.1 Direct Patient Booking
- 12.5.7.2 Health Fund Referral
- 12.5.7.3 Clinical Referral
- 12.5.7.4 Institutional Contracting
- 12.5.8 Subsegment Pricing and Adoption Trends
- 12.5.9 Leading Suppliers and Competition
- 12.5.10 Regional Demand and Opportunities
- 12.6 By Operating Model - Market Size and Forecast, 2025-2035
- 12.6.1 Segment Definition and Scope
- 12.6.2 Historical Market Size, 2018-2025
- 12.6.3 Revenue Forecast, 2025-2035
- 12.6.4 Volume Forecast, 2025-2035
- 12.6.5 Base-Year Market Share, 2025
- 12.6.6 Segment CAGR and Growth Drivers
- 12.6.7 Subsegment Market Size and Forecast
- 12.6.7.1 Direct Clinic Operation
- 12.6.7.2 Facilities-service Operation
- 12.6.7.3 Dentist Partnership Operation
- 12.6.7.4 Managed Network Operation
- 12.6.8 Subsegment Pricing and Adoption Trends
- 12.6.9 Leading Suppliers and Competition
- 12.6.10 Regional Demand and Opportunities
- 12.7 Segment Growth Comparison
- 12.8 Segment Attractiveness and Priority Matrix
Chapter 13 Australia Dental Chains End-Use and Application Market Outlook
- 13.1 End-Use Industry and Customer Demand Structure
- 13.2 Leading Applications and Customer Groups
- 13.3 End-Use Market Size, Share and Forecast
- 13.4 Major End-Use Industry Deep Dives
- 13.4.1 Customer Requirements and Use Cases
- 13.4.2 Demand and Replacement Cycles
- 13.4.3 Technical and Regulatory Considerations
- 13.4.4 Purchasing and Procurement Models
- 13.4.5 Leading Vendors and Distribution Channels
- 13.4.6 Forecast and Commercial Opportunities
- 13.5 Emerging Applications and Cross-Segment Demand
- 13.6 End-Use Industry Investment Priorities
Chapter 14 Australia Dental Chains Geographic Market Outlook, 2025-2035
- 14.1 Domestic Market Distribution and Demand Clusters
- 14.2 State- or Province-Wise Market Size and Forecast, 2025-2035
- 14.3 City and Metropolitan Market Outlook
- 14.4 Industrial, Manufacturing and Commercial Clusters
- 14.5 Geographic Concentration of Key End Users
- 14.6 Local Pricing and Purchasing Differences
- 14.7 Domestic Production Facilities and Capacity Map
- 14.8 Local Infrastructure and Project Pipeline
- 14.9 State-Level Policy and Incentive Differences
- 14.10 Subnational Investment Hotspots and Opportunities
- 14.11 Distribution and Logistics Networks
- 14.12 Domestic Competitive Footprint
Chapter 15 Australia Dental Chains Technology, Innovation and Sustainability Outlook
- 15.1 Technology Landscape and Maturity
- 15.2 Product, Process and Service Innovation
- 15.3 AI, Automation and Digital Tools in the Industry
- 15.4 Technology Adoption and Performance Benchmarking
- 15.5 Innovation Pipeline and R&D Investment
- 15.6 Patent and Intellectual Property Trends
- 15.7 Energy Efficiency and Resource Management
- 15.8 Sustainability, Recycling and Circularity
- 15.9 Technology Roadmap, 2025-2035
- 15.10 Risks of Obsolescence and Technology Substitution
Chapter 16 Australia Dental Chains Market Key Strategic Imperatives
- 16.1 Growth and Market Entry Priorities
- 16.2 High-Return Products and Segments
- 16.3 Pricing, Profitability and Cost Optimization
- 16.4 Technology Investment and Product Differentiation
- 16.5 Supply Chain Localization and Resilience
- 16.6 Distribution and Customer Acquisition
- 16.7 Partnership, Acquisition and Capacity Strategy
- 16.8 Regional Expansion Priorities
- 16.9 Short-, Medium- and Long-Term Actions
Chapter 17 Competition Outlook
- 17.1 Industry Competition Characteristics
- 17.2 Market Structure and Concentration
- 17.3 Market Share and Competitive Positioning, 2025
- 17.4 Company-Wise Revenue and Product Benchmarking
- 17.5 Production and Service Capacity Benchmarking
- 17.6 Technology, Pricing and Differentiation
- 17.7 Regional Footprint and Distribution Strength
- 17.8 Mergers, Acquisitions and Strategic Alliances
- 17.9 New Entrants and Competitive Threats
- 17.10 Porter's Five Forces and Industry Attractiveness
- 17.11 Competitive Outlook, 2025-2035
Chapter 18 Company Profiles
- 18.1 Company Coverage and Selection Criteria
- 18.2 Bupa Dental Care Australia
- 18.2.1 Business Description
- 18.2.2 Company Ownership and Geographic Presence
- 18.2.3 Product and Service Portfolio
- 18.2.4 Manufacturing and Operating Footprint
- 18.2.5 Production Capacity and Expansion Plans
- 18.2.6 Financial Performance and Investment
- 18.2.7 Market Share and Competitive Position
- 18.2.8 Technology and Innovation Capabilities
- 18.2.9 Strategic Alliances or Partnerships
- 18.2.10 Recent Developments
- 18.2.11 Growth Strategy and Outlook
- 18.3 National Dental Care
- 18.4 Pacific Smiles Group
- 18.5 Abano Healthcare Australia
- 18.6 Ekera Dental
- 18.7 Other Relevant Market Participants
Note: Every listed company is profiled on the structure shown under the first company. The company list is preliminary and may change based on research findings, market developments, data availability and client requirements.
Chapter 19 Disclaimer
- 19.1 Research and Forecast Disclaimer
- 19.2 Data Source and Estimation Limitations
Note: The depth of individual sections depends on data availability for this market. Volume, capacity, trade and other unit-based metrics are included where applicable.

