Glucose sensors and heart monitors move care into homes
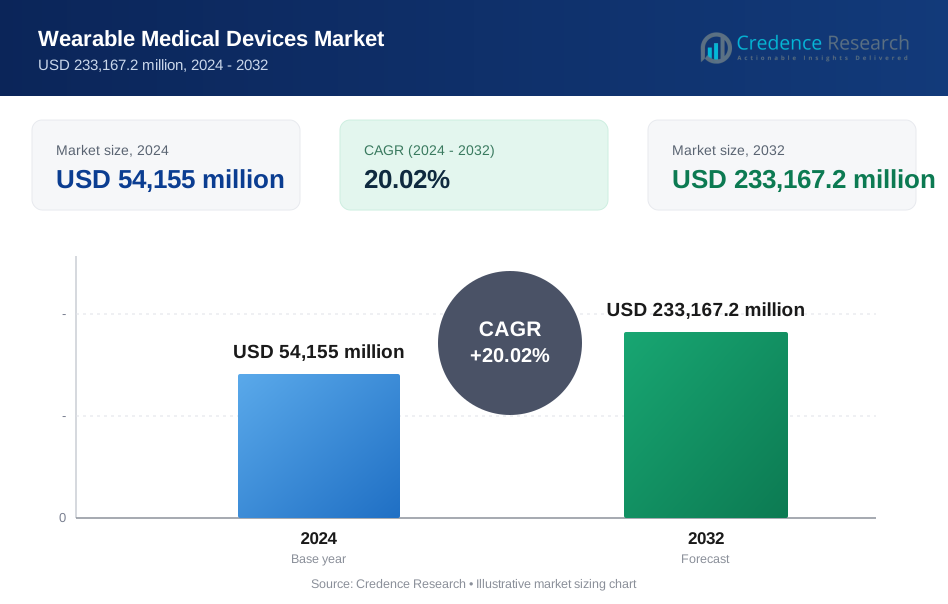
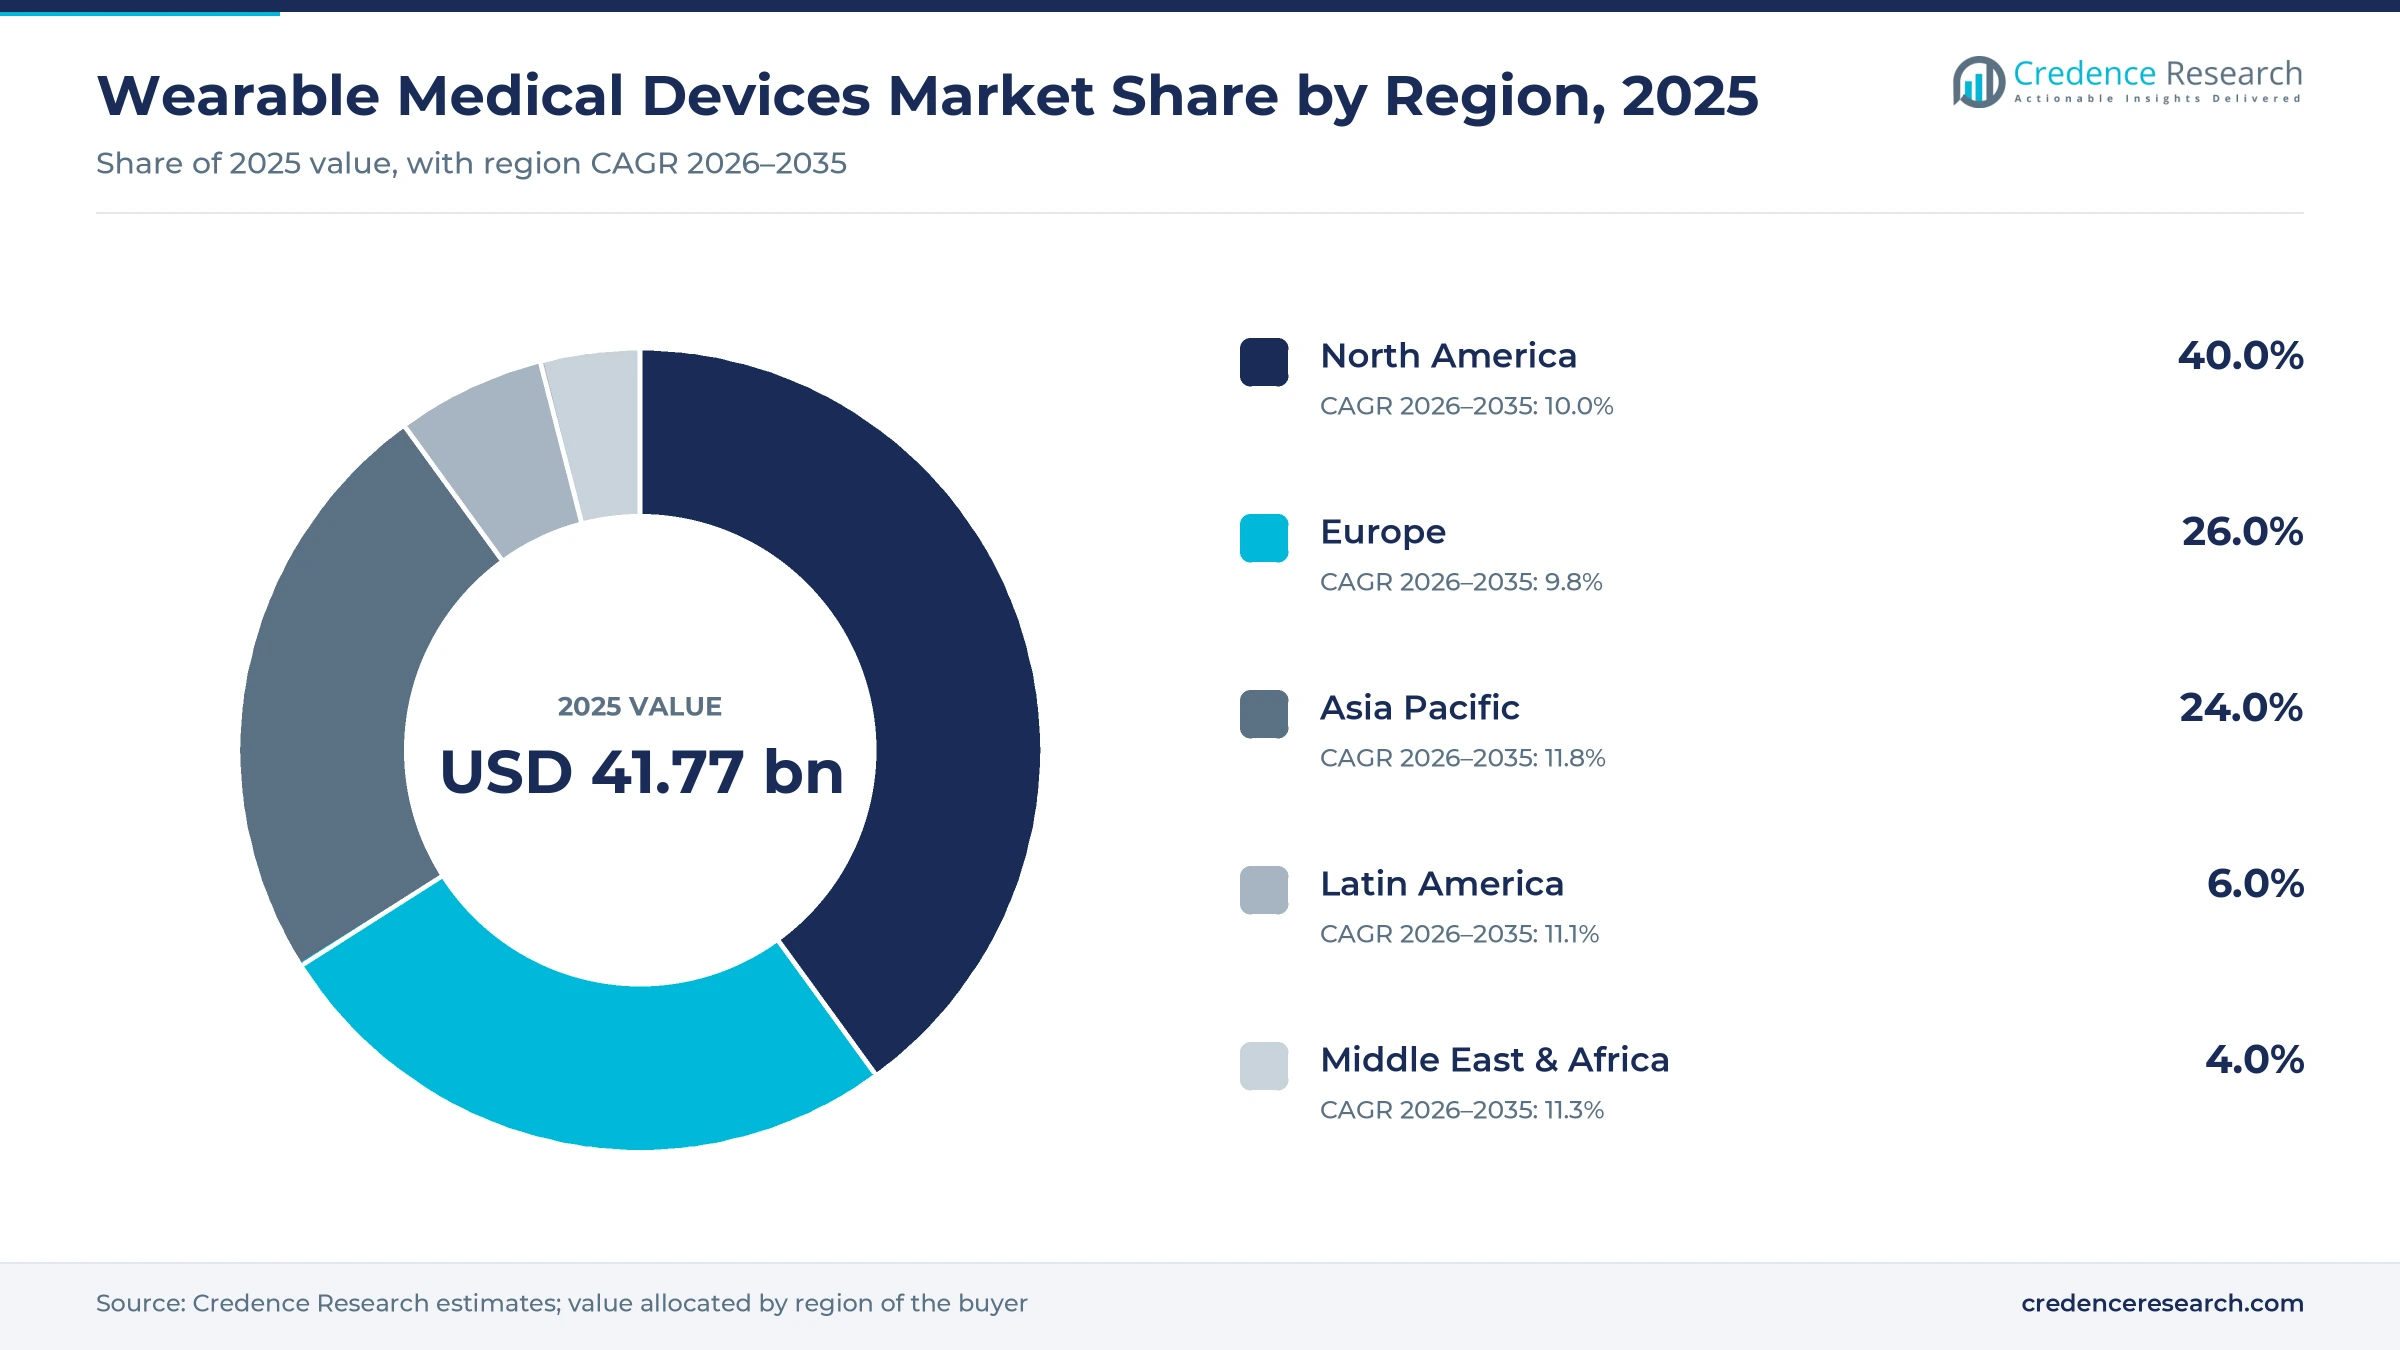
The global wearable medical devices market was valued at USD 41.77 billion in 2025 and is projected to increase from USD 46.16 billion in 2026 to USD 113.37 billion by 2035, registering a CAGR of 10.50% during 2026–2035. Demand comes from the rising number of people with diabetes, high blood pressure and heart rhythm disorders who need monitoring between clinic visits, together with health systems that want to shift follow-up care into homes. North America held the largest regional share, 40.0% in 2025, because the United States combines broad sensor coverage, high diabetes technology use and Medicare payment for remote monitoring. Asia Pacific is the fastest-growing region at 11.8% a year, as China, India and Japan expand diabetes care and digital health programs. The commercial picture changed in March 2024, when the U.S. regulator cleared the first glucose sensor sold without a prescription. As a result, consumer and pharmacy channels now reach adults who never used a prescription sensor.
What sits inside and outside the scope of this study?
Regulated body-worn products are counted here when they measure, record or treat a health condition, including vital sign monitors, sleep monitors, electrocardiographs, fetal monitors, neuromonitoring units, pain relief units, glucose sensors and insulin pumps, and respiratory therapy units. Values are based on manufacturer selling prices, including sensors and patches that patients replace on a regular schedule.
General fitness trackers without a cleared health function, software subscriptions sold separately and clinical monitoring services sit outside the scope of this analysis. The value chain runs from sensor, battery and chip suppliers through product makers and distributors to pharmacies, online stores, retail chains, hospitals and clinics that prescribe or dispense them.
Wearable Medical Devices Market Insights
- The wearable medical devices market grows from USD 41.77 billion in 2025 to USD 113.37 billion by 2035, a 10.50% CAGR, as chronic disease care moves into homes.
- North America held 40.0% of global wearable medical devices value in 2025, supported by sensor coverage and remote monitoring payment.
- Insulin and glucose monitoring products led with 32.0% of 2025 product value, while sleep monitors grow fastest at 11.2% a year.
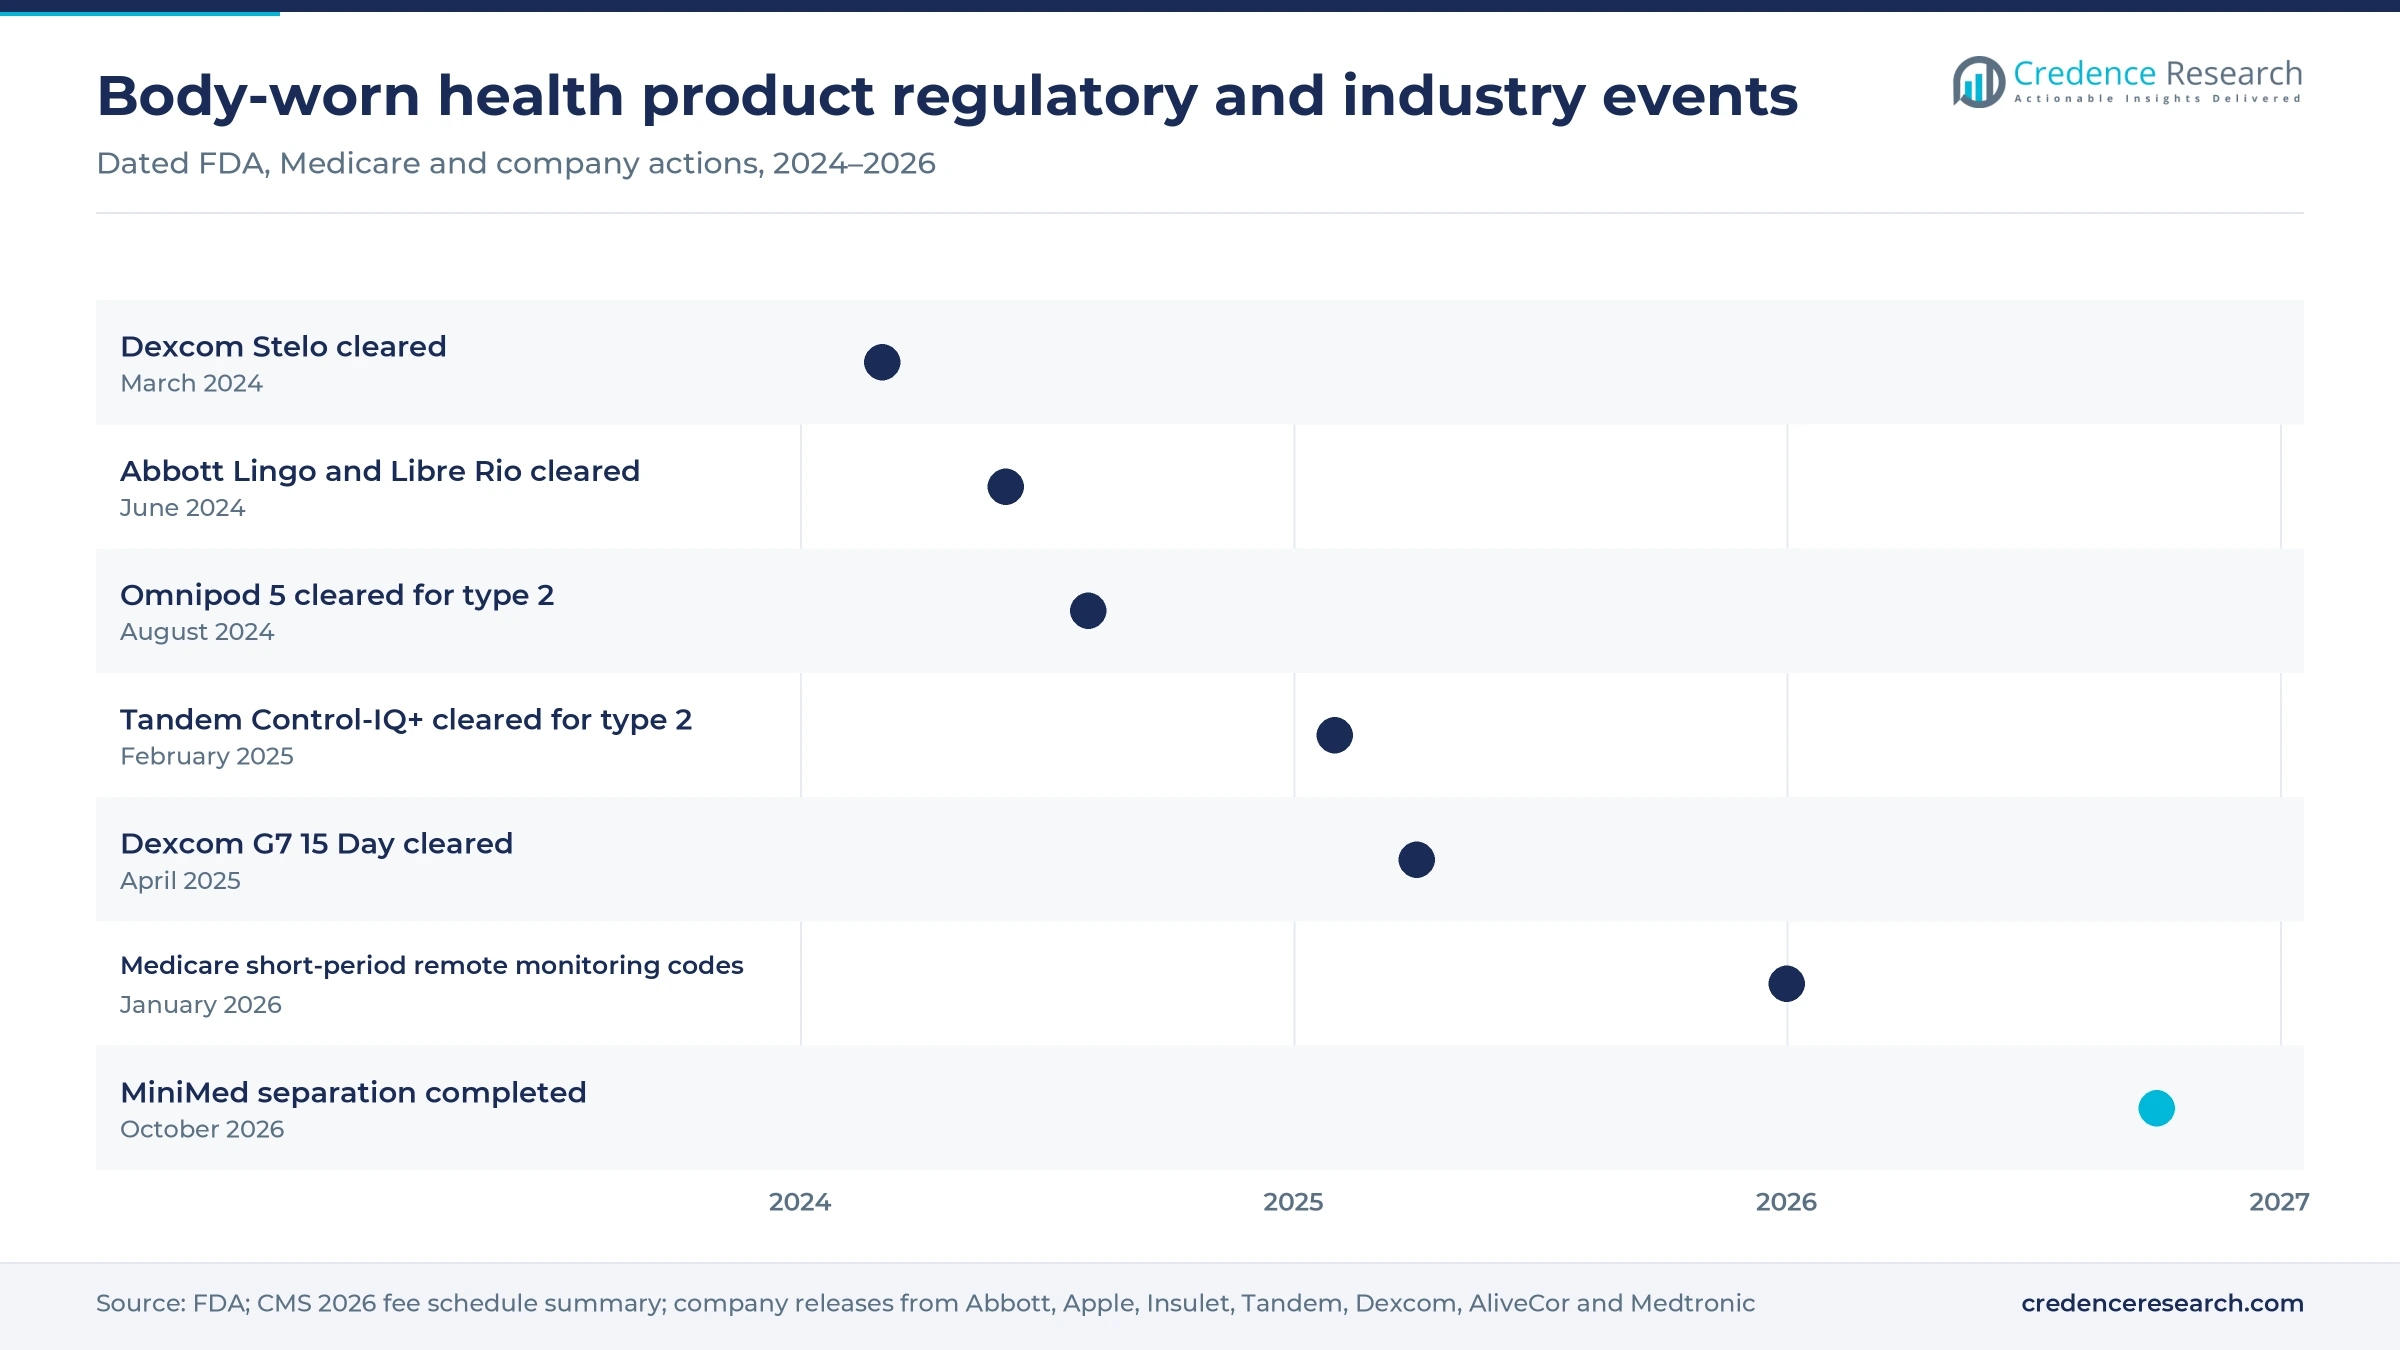
- In March 2024, the U.S. regulator cleared the Dexcom Stelo, the first glucose sensor that adults can buy without a prescription.
- In October 2026, Medtronic completed the separation of MiniMed Group, which now competes as an independent diabetes technology company.
Glucose sensors lead while sleep monitors grow fastest
Why do glucose sensors and insulin pumps lead product spending?
Based on product, the market is categorized into vital sign monitoring, sleep monitoring, electrocardiographs, fetal and obstetric, neuromonitoring, pain management, insulin and glucose monitoring, respiratory therapy and others. Insulin/Glucose Monitoring Devices led with 32.0% of 2025 value, because users replace sensors every two weeks and pumps need regular supplies. Sleep Monitoring Devices grow fastest at 11.2% a year, as watches and rings now flag possible sleep apnea.
Why do home care settings account for most use?
Based on end user, the market is categorized into hospitals, ambulatory surgical centers, specialty clinics, home care settings and others. Home Care Settings led with 44.0% of 2025 value, because people with diabetes and heart conditions wear these products during daily life. Home Care Settings also grow fastest at 11.2% a year, as Medicare payment for shorter monitoring periods widens home programs.
How do pharmacies and online stores share sales?
Based on distribution channel, the market is categorized into pharmacies, online channel and hypermarkets. Pharmacies led with 52.0% of 2025 value, because insured patients collect prescription sensors and pump supplies at the counter. Online Channel grows fastest at 11.5% a year, as over-the-counter sensors and heart monitors sell through company websites and large online retailers.
Why does diagnostic use lead application spending?
Based on application, the market is categorized into diagnostic and therapeutics. Diagnostic use led with 58.0% of 2025 value and grows fastest at 10.8% a year, because most products measure glucose, heart rhythm, blood pressure, oxygen or sleep for review by patients and clinicians. Therapeutic products such as insulin pumps and pain relief units hold the rest of the value.
| Segment Group | Leading Sub-segment | Share, 2025 | Fastest-growing Sub-segment | CAGR, 2026–2035 |
|---|---|---|---|---|
| By Product | Insulin/Glucose Monitoring Devices | 32.0% | Sleep Monitoring Devices | 11.2% |
| By End User | Home Care Settings | 44.0% | Home Care Settings | 11.2% |
| By Distribution Channel | Pharmacies | 52.0% | Online Channel | 11.5% |
| By Application | Diagnostic | 58.0% | Diagnostic | 10.8% |
Request a Free Sample
Fill in your details and we'll send you a free sample report.
- Sample data tables & charts
- Research methodology
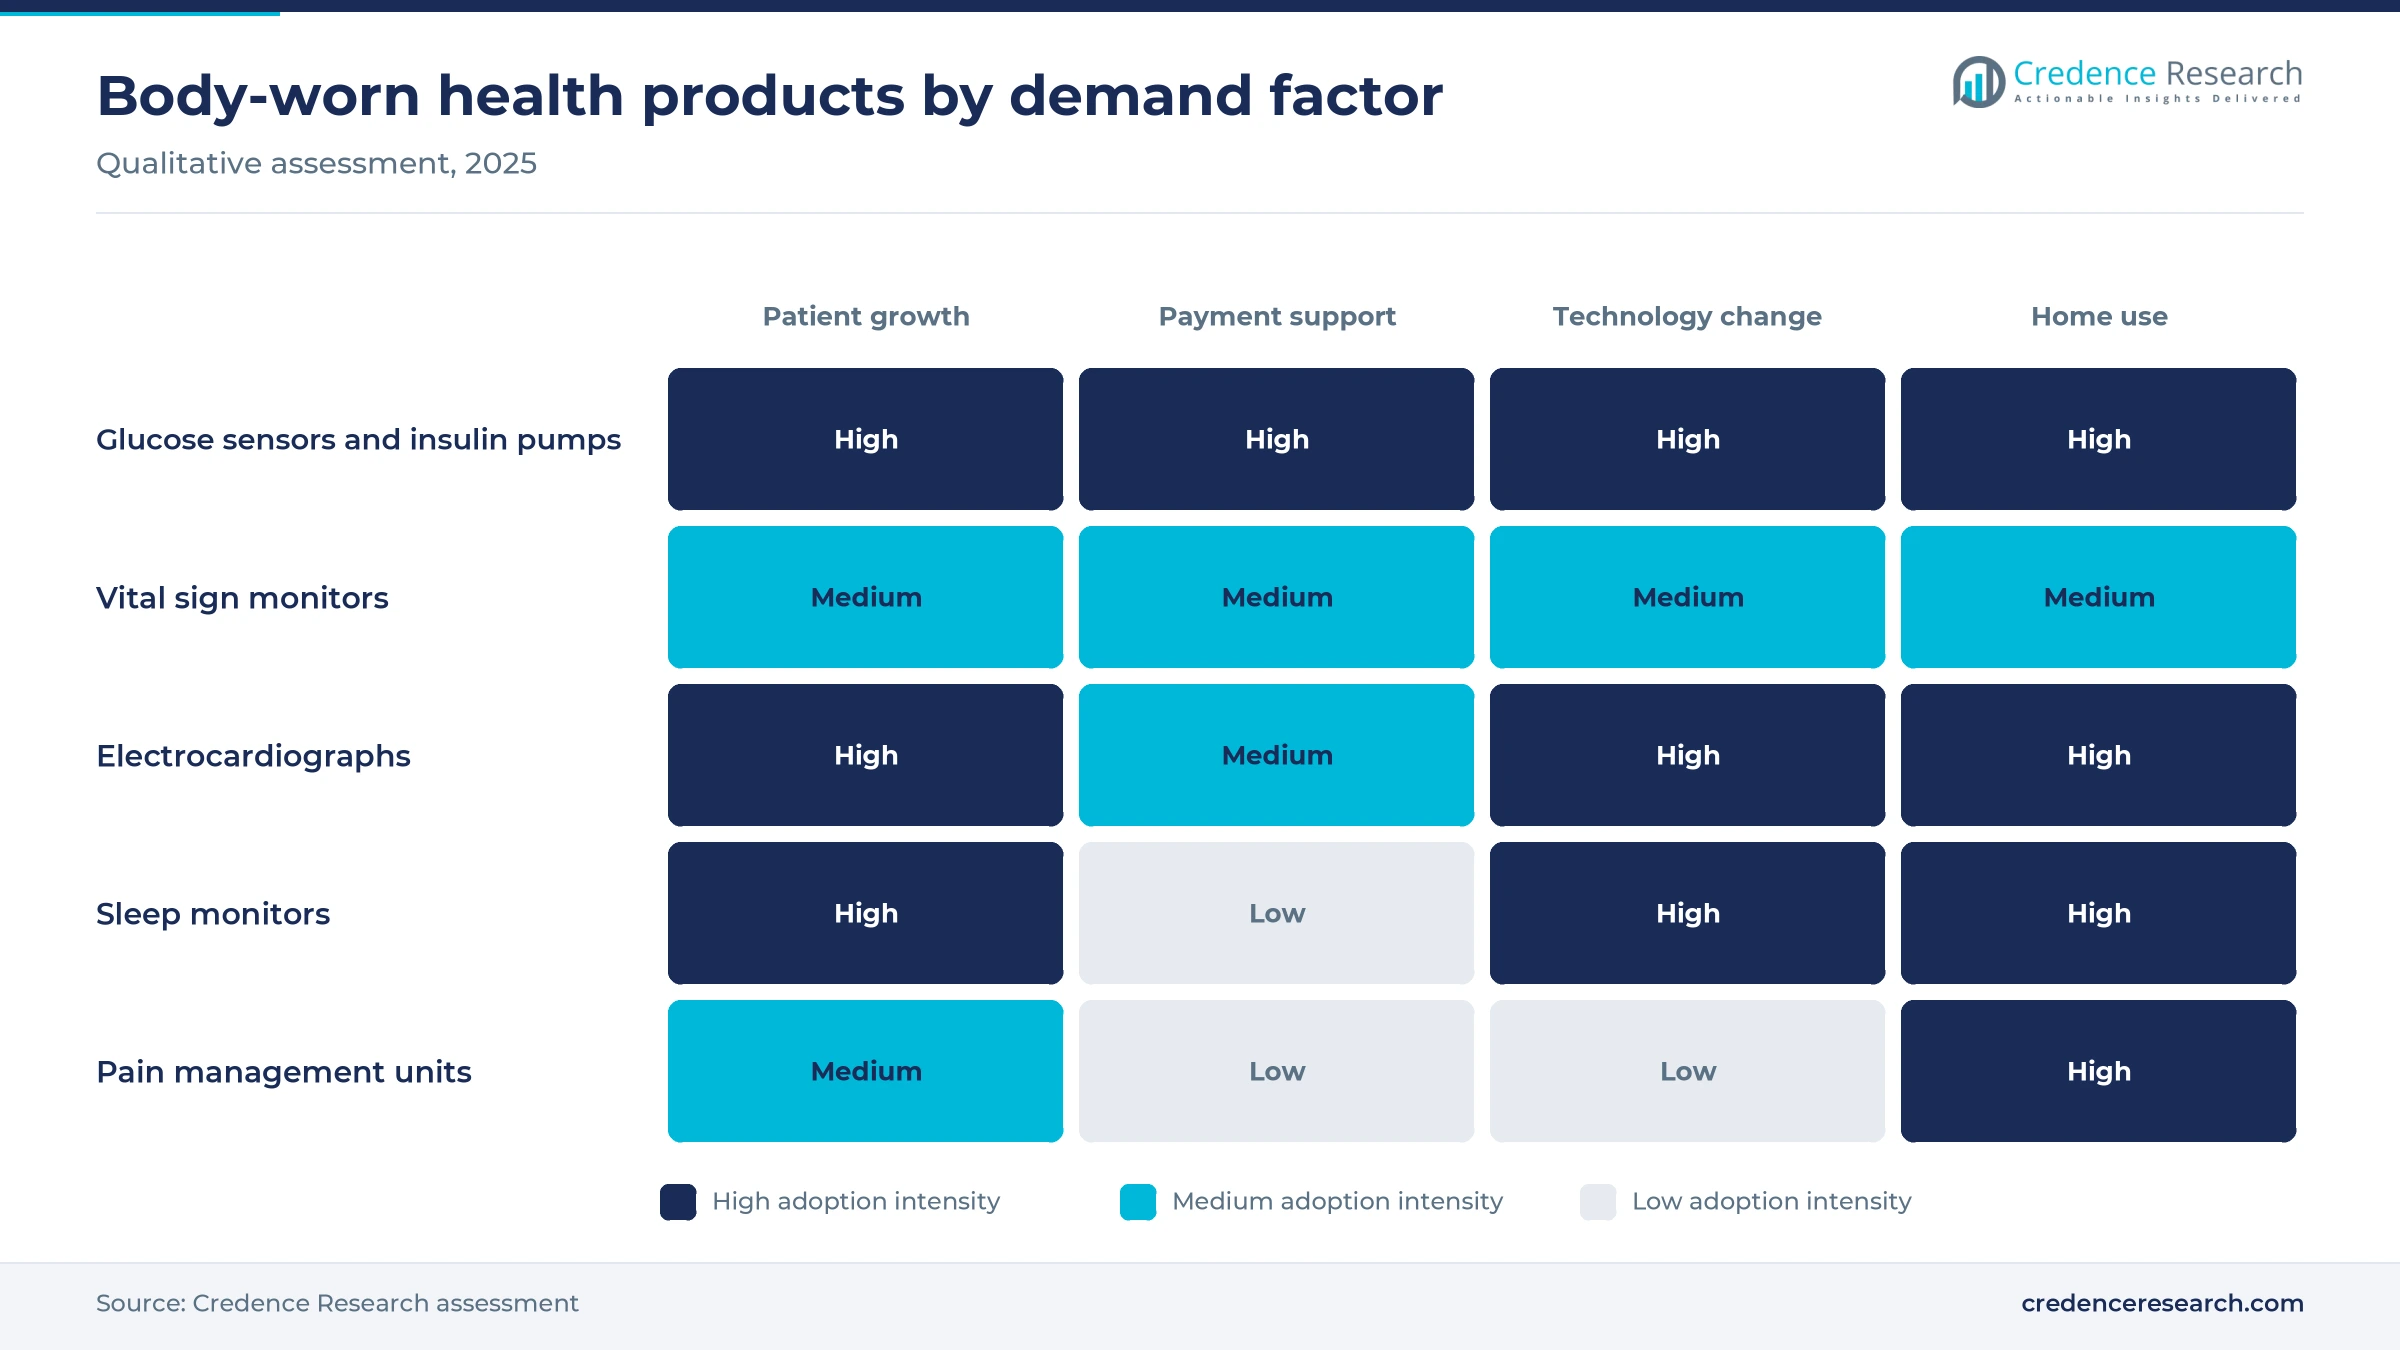
Diabetes, hypertension and heart disease lift demand
How does the rise in diabetes sustain sensor demand?
People who track glucose often need readings every few minutes, so each new diagnosis adds steady sensor demand. The World Health Organization reports that the number of people living with diabetes rose from 200 million in 1990 to 830 million in 2022. The same source states that more than half of people with diabetes did not take medication for their condition in 2022, which leaves a large group still to reach. Abbott states that its FreeStyle Libre technology is used by about 6 million people globally. As a result, insulin and glucose monitoring held 32.0% of 2025 product value, the largest share of any product group.
Why does undiagnosed hypertension create room for home monitors?
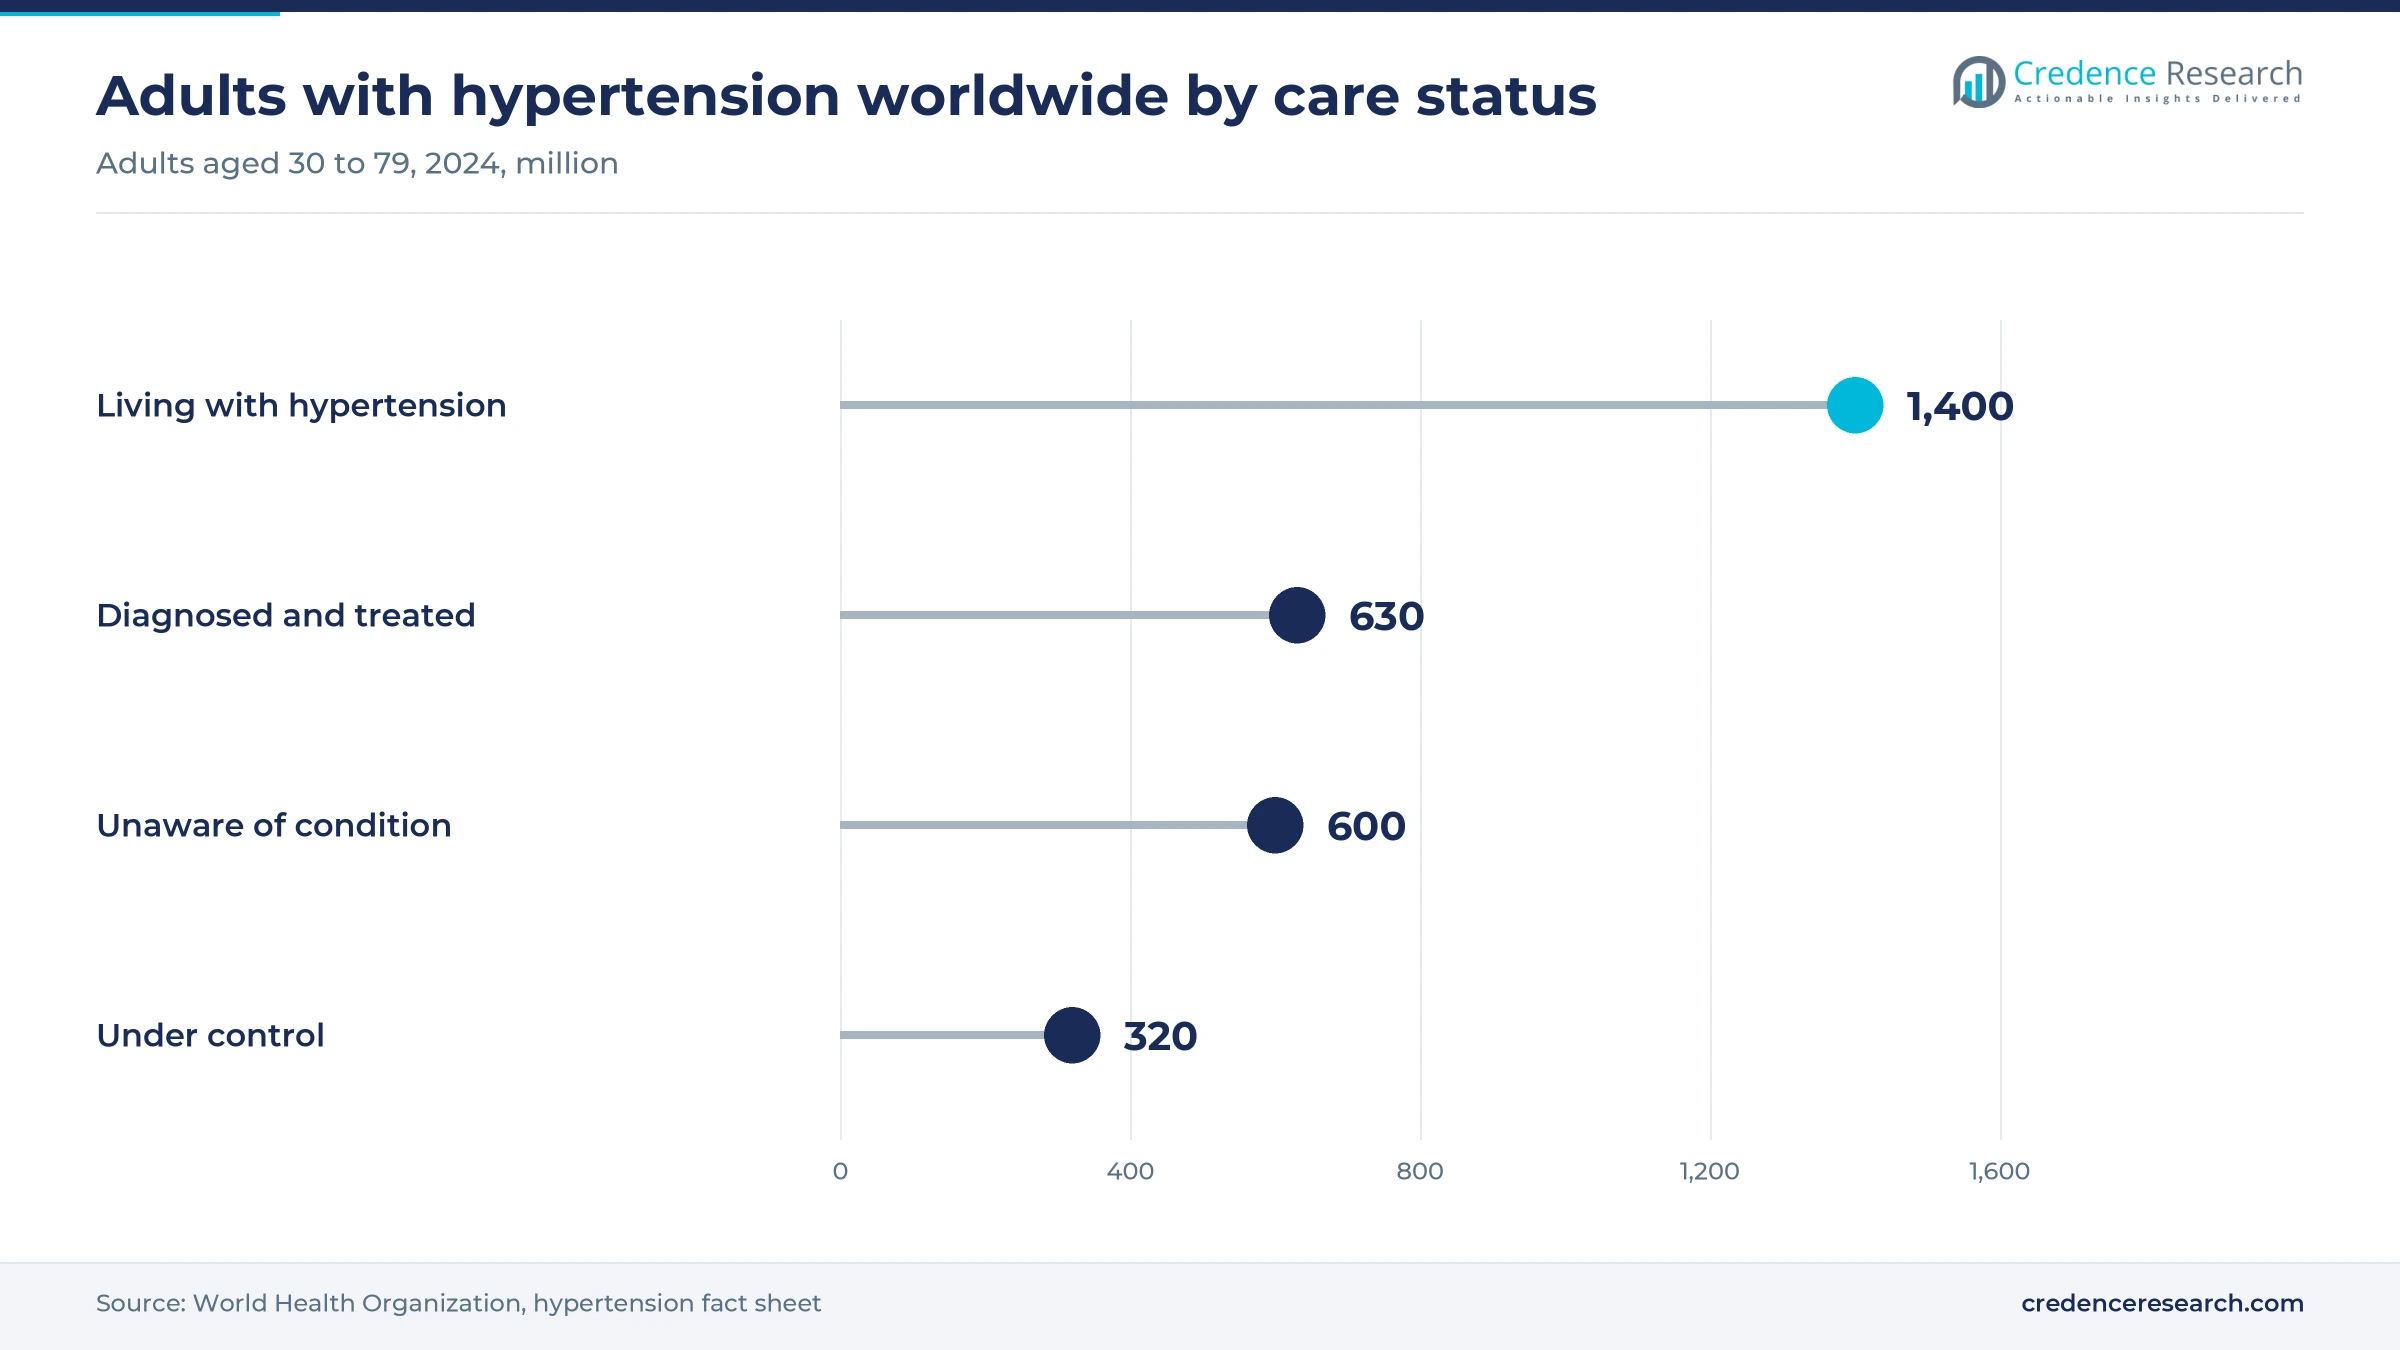
Many adults with high blood pressure do not know they have it, which leaves a large group that home monitors can reach. The World Health Organization estimates that 1.4 billion adults aged 30 to 79 had hypertension in 2024, or 33% of people in that age range. The same source estimates that 600 million of them, or 44%, are unaware of the condition, and only 320 million have it under control. In November 2024, OMRON Healthcare received U.S. De Novo authorization for blood pressure monitors with an AI-powered atrial fibrillation feature. As a result, vital sign monitors keep a large place in home care settings, which held 44.0% of 2025 end-user value.
How does heart disease raise the value of rhythm monitoring?
Irregular heart rhythms often appear only for short periods outside the clinic, so patients need monitoring at home and at work. The World Health Organization estimates that 19.8 million people died from cardiovascular diseases in 2022, about 32% of all deaths worldwide. In January 2026, AliveCor announced FDA clearance of five new determinations for its Kardia 12L handheld system, bringing the total to 39. Patients and doctors can now record a 12-lead reading at home or in a small clinic. As a result, demand for portable electrocardiograph systems grows in specialty clinics, and Europe, a large cardiology market, still grows at 9.8% a year.
Why does Medicare payment for remote care widen home programs?
Clinicians in the United States can now bill Medicare for shorter monitoring periods, which makes small home programs viable. The 2026 Medicare physician fee schedule allows payment when data is collected 2 to 15 days in a 30-day period, while earlier codes required at least 16 days. The same rule allows billing for 10 minutes of monthly management, compared with the earlier 20-minute threshold, starting Jan. 1, 2026. These changes make remote patient monitoring practical for short programs after surgery or a hospital stay. As a result, home care settings grow at 11.2% a year, the fastest pace of any end user.
Over-the-counter sensors and watch alerts gain pace
How is over-the-counter glucose sensing shifting purchases?
Adults who do not use insulin can now buy glucose sensors directly, which moves part of the spending away from pharmacy counters. On March 5, 2024, the U.S. Food and Drug Administration cleared the Dexcom Stelo, the first glucose sensor sold without a prescription, for adults aged 18 and older who do not use insulin. On June 10, 2024, Abbott announced clearance for two more over-the-counter systems, Lingo for general consumers and Libre Rio for adults with type 2 diabetes who do not use insulin. These products sell through company websites and retail stores rather than pharmacy counters. As a result, the online channel grows at 11.5% a year, faster than any other channel.
Why are watch-based health alerts rising in importance?
Smartwatches now flag possible health problems for millions of everyday users who never asked for a medical test. On Sept. 13, 2024, Apple received FDA 510(k) clearance for a sleep apnea notification feature that tracks breathing disturbances during sleep at night. In September 2025, Apple added FDA-cleared hypertension notifications, available in more than 150 countries and regions. These alerts send users to doctors for confirmation, which then supports demand for home monitors and sleep tracking equipment. As a result, sleep monitoring grows at 11.2% a year, the fastest rate among product groups, and diagnostic use holds 58.0% of 2025 value.
Can automated insulin delivery open the type 2 diabetes market?
Most people with diabetes have type 2 disease and few of them use pumps today, which gives pump makers a clear opening. In August 2024, the FDA cleared the Omnipod 5 system from Insulet Corporation for adults with type 2 diabetes, making it the first automated insulin delivery system cleared for both types. In February 2025, Tandem Diabetes Care received clearance for Control-IQ+ technology for people with type 2 diabetes. Each new user also buys sensors and pump supplies every month. As a result, demand for insulin pumps widens beyond type 1 care, and Asia Pacific, with 24.0% of 2025 value, holds a large untreated population.
Where can longer sensor wear add value for users?
Fewer sensor changes lower cost and effort for users, so suppliers that extend wear time can add value and win loyalty. In April 2025, the FDA cleared the Dexcom G7 15 Day sensor for adults with diabetes, with a mean absolute relative difference of 8% compared with 8.2% for the earlier G7. The longer wear time reduces waste and the number of pharmacy refills each year. Patients also need fewer insertions, which may improve use among older adults. In turn, continuous glucose monitoring remains the largest product area, and Latin America, growing at 11.1% a year, offers a large group of newer users.
Accuracy, payment and data rules slow adoption
How do accuracy concerns limit clinical use?
Readings taken during movement, sweat or poor skin contact can be wrong, which makes some doctors cautious about these products. Doctors often confirm watch and patch results with clinic tests before they change treatment, which adds steps and cost. Some health systems therefore limit which products they accept in care records. As a result, suppliers invest in clinical studies and regulatory clearances to prove that their readings are reliable in daily use.
Where does limited coverage hold back sensor sales?
Many health systems outside the United States cover glucose sensors only for people who use insulin, which slows uptake elsewhere. Patients in parts of Asia, Latin America and Africa often pay the full price of sensors and pump supplies. Hospital budgets in these regions also favor reusable monitors over single-use patches. In turn, volume growth in these regions trails the large number of people with diabetes and hypertension.
How do data privacy rules add cost for suppliers?
Body-worn products send health data to phones, cloud servers and clinic systems, so suppliers carry extra privacy and security costs. Companies must protect this data under different national rules and keep software secure through regular updates. Smaller makers find these requirements hard to meet across many countries. As a result, larger companies with security teams win more hospital and payer contracts, while smaller rivals often seek partners.
Why does skin irritation and alert fatigue reduce long-term use?
Some users stop wearing patches because of skin irritation, while others ignore frequent alarms, and both habits cut long-term use. Adhesives can irritate skin when users wear sensors for weeks at a time. Clinicians also face large volumes of data from home programs, which can hide important readings. However, better adhesives and AI-based alert filtering help reduce both problems over time, which supports longer wear.
North America leads as Asia Pacific expands fastest
| Region | Value, 2025 (USD billion) | Share, 2025 | CAGR, 2026–2035 |
|---|---|---|---|
| North America | 16.71 | 40.0% | 10.0% |
| Europe | 10.86 | 26.0% | 9.8% |
| Asia Pacific | 10.03 | 24.0% | 11.8% |
| Latin America | 2.51 | 6.0% | 11.1% |
| Middle East & Africa | 1.67 | 4.0% | 11.3% |
How do U.S. coverage and Medicare payment support leadership?
North America held a 40.0% share of 2025 value and grows at 10.0% a year through 2035. The United States drives this position, because private insurers and Medicare cover glucose sensors, insulin pumps and remote monitoring. Over-the-counter sensors cleared in 2024 add consumer sales on top of prescription demand. Dexcom, Abbott, Insulet and Tandem all compete strongly in the region.
Why do China, India and Japan drive Asia Pacific growth?
Asia Pacific held a 24.0% share of 2025 value and is the fastest-growing region at 11.8% a year. China and India have the largest numbers of adults with diabetes, and both countries are building digital health programs. Japan contributes demand for blood pressure and heart monitors, supported by domestic suppliers such as OMRON Healthcare. Sensor prices and coverage remain the main limits on faster uptake.
What shapes demand across Europe?
Europe held a 26.0% share of 2025 value and grows at 9.8% a year, the slowest pace of the five regions. Germany, France, the United Kingdom and the Nordic countries cover glucose sensors for many people with diabetes. National health systems buy through tenders that reward price and clinical evidence. However, strict data rules lengthen the time needed to launch new connected products.
Where is Latin America adding demand?
Latin America held a 6.0% share of 2025 value and grows at 11.1% a year through 2035. Brazil and Mexico lead regional demand, because both countries have large populations with diabetes and growing private health plans. However, most users still pay for sensors themselves, which keeps adoption concentrated in cities.
How do Gulf programs and African coverage gaps differ?
The Middle East and Africa held a 4.0% share of 2025 value and grows at 11.3% a year through 2035. Gulf states fund diabetes programs and digital hospitals, while much of Africa has limited coverage for sensors. Low-cost monitors and mobile health programs therefore offer the largest growth opening.
Clearances, launches and a spin-off since 2024
| Development | Status and market relevance |
|---|---|
| In March 2024, the U.S. Food and Drug Administration cleared the Dexcom Stelo, the first over-the-counter continuous glucose monitor. | Cleared; opens consumer and online sales to adults who do not use insulin |
| In August 2024, the FDA cleared the Omnipod 5 automated insulin delivery system from Insulet Corporation for adults with type 2 diabetes. | Cleared; first automated insulin delivery system for both diabetes types |
| In April 2025, the FDA cleared the Dexcom G7 15 Day continuous glucose monitor for adults with diabetes. | Cleared; longer wear with lower measured error than the earlier G7 |
| In January 2026, AliveCor announced FDA clearance of five new cardiac determinations for its Kardia 12L system, bringing the total to 39. | Cleared; widens handheld 12-lead heart testing |
| In October 2026, Medtronic completed the separation of MiniMed Group, Inc., its diabetes business, which trades on Nasdaq. | Completed; MiniMed now competes as an independent company |
Longer sensors, AI readings and automated insulin
- Extended-wear glucose sensors last up to 15 days on the body, which reduces sensor changes, waste and refill visits for users.
- Automated insulin delivery links a sensor and a pump through an algorithm, which adjusts insulin doses with less effort from patients.
- AI-based heart rhythm analysis reads electrocardiograms recorded at home and flags many conditions, which shortens the path to a cardiology review.
- Watch-based health notifications detect patterns linked to sleep apnea or high blood pressure, which prompts users to seek confirmation from a doctor.
- Wireless hospital vital sign patches track heart rate, breathing and oxygen on general wards, which helps nurses spot patient decline earlier.
Need a Custom Version of This Report?
Tailor the scope, geography, or segments to your exact requirements.
- Custom geography or segment scope
- Direct access to our analyst team
Diabetes and cardiac specialists compete on data
Competition splits into diabetes technology, cardiac and vital sign monitoring, and consumer health brands, with a few companies active in several areas. Abbott and Dexcom, Inc. lead glucose sensing, and both added over-the-counter sensors in 2024. Insulet Corporation, Tandem Diabetes Care, Inc. and MiniMed Group, Inc. compete in insulin pumps, and MiniMed became fully independent of Medtronic in October 2026. iRhythm Technologies, Inc. leads in wearable heart rhythm patches, AliveCor, Inc. and OMRON Healthcare, Inc. compete in home heart and blood pressure monitoring, and Koninklijke Philips N.V., GE HealthCare and Sotera, Inc. supply hospital monitoring. Garmin Ltd serves sport and health watch users with heart monitoring and sleep tracking features. As a result, buyers favor suppliers that combine accurate sensors, software and links to clinical records.
Companies profiled and their roles in this market
| Company | Type | Role in the market |
|---|---|---|
| Abbott | Diversified | FreeStyle Libre sensors and over-the-counter Lingo and Libre Rio systems |
| Dexcom, Inc. | Specialist | G7 15 Day prescription sensor and Stelo over-the-counter sensor |
| Insulet Corporation | Specialist | Omnipod 5 tubeless automated insulin delivery |
| Tandem Diabetes Care, Inc. | Specialist | Insulin pumps with Control-IQ+ technology |
| MiniMed Group, Inc. | Specialist | MiniMed 780G insulin pumps and Simplera sensors, independent of Medtronic since October 2026 |
| iRhythm Technologies, Inc. | Specialist | Zio wearable patch monitors for long-term heart rhythm recording |
| AliveCor, Inc. | Specialist | Kardia personal and 12-lead heart monitors with AI analysis |
| OMRON Healthcare, Inc. | Specialist | Home blood pressure monitors with atrial fibrillation detection |
| Koninklijke Philips N.V. | Diversified | Hospital and home patient monitoring |
| GE HealthCare | Diversified | Wireless hospital patient monitoring |
| Sotera, Inc. | Specialist | Wrist-worn continuous vital sign monitoring for hospitals |
| Garmin Ltd | Consumer | Health and sport watches with heart monitoring |
Home monitoring sets the growth pace to 2035
Credence Research's view is that home monitoring will set the pace of growth through 2035, because payers and health systems want more chronic care delivered outside hospitals. The overall market grows at 10.50% a year, supported by diabetes, hypertension and heart disease. Sleep monitors, online sales and home care settings grow faster than the market. Companies that pair accurate sensors with insulin delivery, software and clinical data links will win the most contracts, while accuracy and data security will stay under close review.
How Credence Research sized body-worn health products
The report uses 2025 as the base year and 2026 to 2035 as the forecast period. Market values come from the Credence Research model, which builds spending by product, end user, distribution channel, application and region. Regional and segment splits are Credence Research estimates informed by World Health Organization data, U.S. regulator records, Medicare payment rules, clinical and trade publications and company press releases. No primary interviews or surveys were used in preparing this edition of the report.
Body-worn health monitoring outlook to 2035
By 2035, the wearable medical devices market is projected to reach USD 113.37 billion, with growth led by glucose sensing, sleep monitoring and home heart monitoring. Insulin and glucose products will remain the largest product area, as more people with type 2 diabetes start sensors and automated insulin delivery. North America keeps the highest spending, while Asia Pacific adds the most new users. Online sales will take a larger share of value, because consumers now buy sensors directly. As a result, advantage will depend on accuracy, comfort and data links.
Frequently Asked Questions
How big is the global wearable medical devices market?
Which product leads wearable medical devices spending?
Which region leads spending on body-worn health products?
Which end user accounts for most use?
How did over-the-counter sensors change the market?
What recent clearances affect body-worn health products?
Who are the leading wearable medical devices companies?
What restrains growth in body-worn health products?
Table of Content
Chapter 1 Market Segmentation
- 1.1 Segmentation Framework
- 1.1.1 Product and Service Classification
- 1.1.2 Application and End-Use Classification
- 1.1.3 Technology and Solution Classification
- 1.1.4 Customer and Distribution Channel Classification
- 1.1.5 Geographic Segmentation
- 1.1.6 Market Segment Definitions and Boundaries
- 1.2 By Product
- 1.2.1 Vital Sign Monitoring Devices
- 1.2.2 Sleep Monitoring Devices
- 1.2.3 Electrocardiographs
- 1.2.4 Fetal And Obstetric Devices
- 1.2.5 Neuromonitoring Devices
- 1.2.6 Pain Management Devices
- 1.2.7 Insulin/Glucose Monitoring Devices
- 1.2.8 Respiratory Therapy Devices
- 1.2.9 Others
- 1.3 By End User
- 1.3.1 Hospitals
- 1.3.2 Ambulatory Surgical Centers
- 1.3.3 Specialty Clinics
- 1.3.4 Home Care Settings
- 1.3.5 Others
- 1.4 By Application
- 1.4.1 Diagnostic
- 1.4.2 Therapeutics
Chapter 2 Introduction
- 2.1 Report Objectives and Scope
- 2.2 Product Definition and Industry Terminology
- 2.3 Market Inclusions and Exclusions
- 2.4 Research Process
- 2.4.1 Primary Research and Expert Interviews
- 2.4.2 Secondary Research and Source Review
- 2.4.3 Top-Down and Bottom-Up Estimation
- 2.4.4 Data Triangulation and Verification
- 2.5 Market Size Measurement Basis
- 2.5.1 2025: USD 41.77 billion → 2035: USD 113.37 billion
- 2.6 Historical and Forecast Reference Periods
- 2.6.1 Historical Period: 2018-2025
- 2.6.2 Base Year: 2025
- 2.6.3 Forecast Period: 2025-2035
- 2.7 Research Assumptions and Limitations
Chapter 3 Executive Summary
- 3.1 Market Snapshot and Key Findings
- 3.2 Base-Year Market Size, 2025
- 3.3 Forecast Market Size, 2035
- 3.4 Revenue and Volume Growth Outlook
- 3.5 Key Demand and Supply Indicators
- 3.6 Leading Market Segments
- 3.7 Fastest-Growing Market Opportunities
- 3.8 Regional Performance Highlights
- 3.9 Technology and Industry Transformation
- 3.10 Competitive Landscape Summary
- 3.11 Analyst View and Strategic Implications
Chapter 4 Global Wearable Medical Devices Market Trends and Developments
- 4.1 Historical Industry Development, 2018-2025
- 4.2 Recent Market Trends and Developments
- 4.3 Demand and Customer Behavior Trends
- 4.4 Technology and Product Innovation
- 4.5 Artificial Intelligence, Automation and Digitalization
- 4.6 Local Manufacturing and Supply Chain Realignment
- 4.7 Industry Partnerships, Mergers and Acquisitions
- 4.8 Sustainability and Circular Economy Developments
- 4.9 Government and Private Sector Investment Trends
- 4.10 Emerging Business Models and Commercialization
- 4.11 Industry Developments and Announcements
Chapter 5 Global Wearable Medical Devices Market Production, Supply and Demand Analysis
- 5.1 Demand Trend and Consumption Analysis, 2018-2025
- 5.2 Demand Forecast, 2025-2035
- 5.3 Production and Output Trend, 2018-2025
- 5.4 Production and Output Forecast, 2025-2035
- 5.5 Installed Capacity and Capacity Utilization
- 5.6 Company-Wise Production Plants and Statistics
- 5.6.1 Installed Production Capacity
- 5.6.2 Actual Production
- 5.6.3 Planned Capacity and Expansion Targets
- 5.7 Supply Chain Structure and Procurement Trends
- 5.8 Supply-Demand Gap and Bottlenecks
- 5.9 Import Dependence and Sourcing Structure
- 5.10 Contract Manufacturing and Outsourcing
- 5.11 Regional Supply and Demand Concentration
Chapter 6 Global Wearable Medical Devices Market Pricing Analysis
- 6.1 Pricing Structure and Measurement
- 6.2 Historical Pricing Trends, 2018-2025
- 6.3 Pricing Outlook, 2025-2035
- 6.4 Average Selling Price and Unit Economics
- 6.5 Pricing by Product and Market Segment
- 6.6 Geographic Pricing Differences
- 6.7 Key Input, Energy, Labor and Logistics Costs
- 6.8 Contract Pricing and Purchasing Models
- 6.9 Pricing Sensitivity and Competitive Positioning
- 6.10 Price, Margin and Profitability Implications
Chapter 7 Global Wearable Medical Devices Market Dynamics
- 7.1 Market Growth Drivers
- 7.1.1 Demand-Side Drivers
- 7.1.2 Technology and Innovation Drivers
- 7.1.3 Infrastructure and Investment Drivers
- 7.1.4 Regulatory and Policy Drivers
- 7.2 Market Restraints
- 7.2.1 Cost and Affordability Constraints
- 7.2.2 Technology and Adoption Barriers
- 7.2.3 Supply Chain and Operational Constraints
- 7.3 Market Challenges
- 7.3.1 Competitive Pressure and Margin Erosion
- 7.3.2 Skills, Infrastructure and Implementation Gaps
- 7.4 Emerging Market Opportunities
- 7.5 Market Dynamics Impact and Time-Horizon Assessment
Chapter 8 Global Wearable Medical Devices Value Chain Analysis
- 8.1 Industry Value Chain Overview
- 8.2 Upstream Suppliers and Critical Inputs
- 8.3 Technology and Component Providers
- 8.4 Manufacturing or Service Delivery
- 8.5 Distribution, Channel Partners and Integrators
- 8.6 Downstream Applications and End Users
- 8.7 Value Addition and Profit Pools
- 8.8 Vertical Integration and Outsourcing
- 8.9 Supplier Concentration and Risk
- 8.10 Supply Chain Localization and Resilience
Chapter 9 Global Wearable Medical Devices Market Regulations and Policies
- 9.1 Relevant Laws, Standards and Compliance Frameworks
- 9.2 Product, Service, Safety and Quality Requirements
- 9.3 Government Policies, Incentives and Subsidies
- 9.4 Imports, Exports and Trade Barriers
- 9.5 Public Procurement and Local Content Requirements
- 9.6 Environmental and Sustainability Compliance
- 9.7 Upcoming Policy Changes and Market Implications
Chapter 10 Global Wearable Medical Devices Market Hotspots and Opportunities
- 10.1 Market Opportunity Mapping and Growth Hotspots
- 10.2 High-Growth Applications and Customer Groups
- 10.3 Underserved Markets and White-Space Opportunities
- 10.4 Emerging Technology and Product Opportunities
- 10.5 New Capacity and Investment Hotspots
- 10.6 Market Entry and Expansion Opportunities
- 10.7 Distribution and Partnership Opportunities
- 10.8 Near-Term and Long-Term Commercial Potential
- 10.9 Opportunity Attractiveness and Execution Risks
Chapter 11 Global Wearable Medical Devices Market Outlook, 2025-2035
- 11.1 Market Size and Analysis
- 11.1.1 Revenue (Market Measurement: 2025: USD 41.77 billion → 2035: USD 113.37 billion)
- 11.1.2 Market Volume and Quantity Sold
- 11.1.3 Historical Market Size, 2018-2025
- 11.1.4 Base-Year Market Size, 2025
- 11.2 Market Forecast, 2025-2035
- 11.2.1 Revenue Forecast to 2035
- 11.2.2 Volume Forecast to 2035
- 11.2.3 CAGR and Year-on-Year Growth
- 11.2.4 Incremental Revenue Opportunity
- 11.3 Forecast Assumptions and Scenario Analysis
- 11.3.1 Base-Case Forecast
- 11.3.2 Optimistic and Conservative Scenarios
- 11.3.3 Technology, Pricing and Policy Sensitivities
- 11.4 Market Attractiveness and Growth Outlook
Chapter 12 Global Wearable Medical Devices Market Segmentation and Outlook
- 12.1 Segmentation Summary and Market Shares, 2025
- 12.2 Largest and Fastest-Growing Segments
- 12.3 By Product - Market Size and Forecast, 2025-2035
- 12.3.1 Segment Definition and Scope
- 12.3.2 Historical Market Size, 2018-2025
- 12.3.3 Revenue Forecast, 2025-2035
- 12.3.4 Volume Forecast, 2025-2035
- 12.3.5 Base-Year Market Share, 2025
- 12.3.6 Segment CAGR and Growth Drivers
- 12.3.7 Subsegment Market Size and Forecast
- 12.3.7.1 Vital Sign Monitoring Devices
- 12.3.7.2 Sleep Monitoring Devices
- 12.3.7.3 Electrocardiographs
- 12.3.7.4 Fetal And Obstetric Devices
- 12.3.7.5 Neuromonitoring Devices
- 12.3.7.6 Pain Management Devices
- 12.3.7.7 Insulin/Glucose Monitoring Devices
- 12.3.7.8 Respiratory Therapy Devices
- 12.3.7.9 Others
- 12.3.8 Subsegment Pricing and Adoption Trends
- 12.3.9 Leading Suppliers and Competition
- 12.3.10 Regional Demand and Opportunities
- 12.4 By End User - Market Size and Forecast, 2025-2035
- 12.4.1 Segment Definition and Scope
- 12.4.2 Historical Market Size, 2018-2025
- 12.4.3 Revenue Forecast, 2025-2035
- 12.4.4 Volume Forecast, 2025-2035
- 12.4.5 Base-Year Market Share, 2025
- 12.4.6 Segment CAGR and Growth Drivers
- 12.4.7 Subsegment Market Size and Forecast
- 12.4.7.1 Hospitals
- 12.4.7.2 Ambulatory Surgical Centers
- 12.4.7.3 Specialty Clinics
- 12.4.7.4 Home Care Settings
- 12.4.7.5 Others
- 12.4.8 Subsegment Pricing and Adoption Trends
- 12.4.9 Leading Suppliers and Competition
- 12.4.10 Regional Demand and Opportunities
- 12.5 By Application - Market Size and Forecast, 2025-2035
- 12.5.1 Segment Definition and Scope
- 12.5.2 Historical Market Size, 2018-2025
- 12.5.3 Revenue Forecast, 2025-2035
- 12.5.4 Volume Forecast, 2025-2035
- 12.5.5 Base-Year Market Share, 2025
- 12.5.6 Segment CAGR and Growth Drivers
- 12.5.7 Subsegment Market Size and Forecast
- 12.5.7.1 Diagnostic
- 12.5.7.2 Therapeutics
- 12.5.8 Subsegment Pricing and Adoption Trends
- 12.5.9 Leading Suppliers and Competition
- 12.5.10 Regional Demand and Opportunities
- 12.6 Segment Growth Comparison
- 12.7 Segment Attractiveness and Priority Matrix
Chapter 13 Global Wearable Medical Devices End-Use and Application Market Outlook
- 13.1 End-Use Industry and Customer Demand Structure
- 13.2 Leading Applications and Customer Groups
- 13.3 End-Use Market Size, Share and Forecast
- 13.4 Major End-Use Industry Deep Dives
- 13.4.1 Customer Requirements and Use Cases
- 13.4.2 Demand and Replacement Cycles
- 13.4.3 Technical and Regulatory Considerations
- 13.4.4 Purchasing and Procurement Models
- 13.4.5 Leading Vendors and Distribution Channels
- 13.4.6 Forecast and Commercial Opportunities
- 13.5 Emerging Applications and Cross-Segment Demand
- 13.6 End-Use Industry Investment Priorities
Chapter 14 Global Wearable Medical Devices Geographic Market Outlook, 2025-2035
- 14.1 Regional Market Size and Share, 2025
- 14.2 Regional Market Forecast, 2025-2035
- 14.3 Regional Pricing, Production and Demand Differences
- 14.4 North America
- 14.4.1 United States
- 14.4.2 Canada
- 14.4.3 Mexico
- 14.5 Europe
- 14.5.1 Germany
- 14.5.2 France
- 14.5.3 Italy
- 14.5.4 United Kingdom
- 14.5.5 Spain
- 14.5.6 Poland
- 14.5.7 Russia
- 14.5.8 Netherlands
- 14.5.9 Belgium
- 14.5.10 Sweden
- 14.5.11 Denmark
- 14.5.12 Norway
- 14.5.13 Rest of Europe
- 14.6 Asia Pacific
- 14.6.1 China
- 14.6.2 India
- 14.6.3 Japan
- 14.6.4 South Korea
- 14.6.5 Thailand
- 14.6.6 Indonesia
- 14.6.7 Vietnam
- 14.6.8 Malaysia
- 14.6.9 Australia
- 14.6.10 Rest of Asia Pacific
- 14.7 Latin America
- 14.7.1 Brazil
- 14.7.2 Argentina
- 14.7.3 Colombia
- 14.7.4 Chile
- 14.7.5 Rest of Latin America
- 14.8 Middle East
- 14.8.1 Saudi Arabia
- 14.8.2 United Arab Emirates
- 14.8.3 Turkey
- 14.8.4 Israel
- 14.8.5 Iran
- 14.8.6 Rest of the Middle East
- 14.9 Africa
- 14.9.1 South Africa
- 14.9.2 Egypt
- 14.9.3 Nigeria
- 14.9.4 Morocco
- 14.9.5 Rest of Africa
- 14.10 Regional Investment, Policy and Supply Chain Differences
- 14.11 Regional Competitive Landscape
- 14.12 Geographic Growth Hotspots
Chapter 15 Global Wearable Medical Devices Technology, Innovation and Sustainability Outlook
- 15.1 Technology Landscape and Maturity
- 15.2 Product, Process and Service Innovation
- 15.3 AI, Automation and Digital Tools in the Industry
- 15.4 Technology Adoption and Performance Benchmarking
- 15.5 Innovation Pipeline and R&D Investment
- 15.6 Patent and Intellectual Property Trends
- 15.7 Energy Efficiency and Resource Management
- 15.8 Sustainability, Recycling and Circularity
- 15.9 Technology Roadmap, 2025-2035
- 15.10 Risks of Obsolescence and Technology Substitution
Chapter 16 Global Wearable Medical Devices Market Key Strategic Imperatives
- 16.1 Growth and Market Entry Priorities
- 16.2 High-Return Products and Segments
- 16.3 Pricing, Profitability and Cost Optimization
- 16.4 Technology Investment and Product Differentiation
- 16.5 Supply Chain Localization and Resilience
- 16.6 Distribution and Customer Acquisition
- 16.7 Partnership, Acquisition and Capacity Strategy
- 16.8 Regional Expansion Priorities
- 16.9 Short-, Medium- and Long-Term Actions
Chapter 17 Competition Outlook
- 17.1 Industry Competition Characteristics
- 17.2 Market Structure and Concentration
- 17.3 Market Share and Competitive Positioning, 2025
- 17.4 Company-Wise Revenue and Product Benchmarking
- 17.5 Production and Service Capacity Benchmarking
- 17.6 Technology, Pricing and Differentiation
- 17.7 Regional Footprint and Distribution Strength
- 17.8 Mergers, Acquisitions and Strategic Alliances
- 17.9 New Entrants and Competitive Threats
- 17.10 Porter's Five Forces and Industry Attractiveness
- 17.11 Competitive Outlook, 2025-2035
Chapter 18 Company Profiles
- 18.1 Company Coverage and Selection Criteria
- 18.2 Abbott
- 18.2.1 Business Description
- 18.2.2 Company Ownership and Geographic Presence
- 18.2.3 Product and Service Portfolio
- 18.2.4 Manufacturing and Operating Footprint
- 18.2.5 Production Capacity and Expansion Plans
- 18.2.6 Financial Performance and Investment
- 18.2.7 Market Share and Competitive Position
- 18.2.8 Technology and Innovation Capabilities
- 18.2.9 Strategic Alliances or Partnerships
- 18.2.10 Recent Developments
- 18.2.11 Growth Strategy and Outlook
- 18.3 Dexcom, Inc.
- 18.4 Insulet Corporation
- 18.5 Tandem Diabetes Care, Inc.
- 18.6 MiniMed Group, Inc.
- 18.7 iRhythm Technologies, Inc.
- 18.8 AliveCor, Inc.
- 18.9 OMRON Healthcare, Inc.
- 18.10 Koninklijke Philips N.V.
- 18.11 GE HealthCare
- 18.12 Sotera, Inc.
- 18.13 Garmin Ltd
- 18.14 Other Relevant Market Participants
Note: Every listed company is profiled on the structure shown under the first company. The company list is preliminary and may change based on research findings, market developments, data availability and client requirements.
Chapter 19 Disclaimer
- 19.1 Research and Forecast Disclaimer
- 19.2 Data Source and Estimation Limitations
Note: The depth of individual sections depends on data availability for this market. Volume, capacity, trade and other unit-based metrics are included where applicable.