
Market Overview
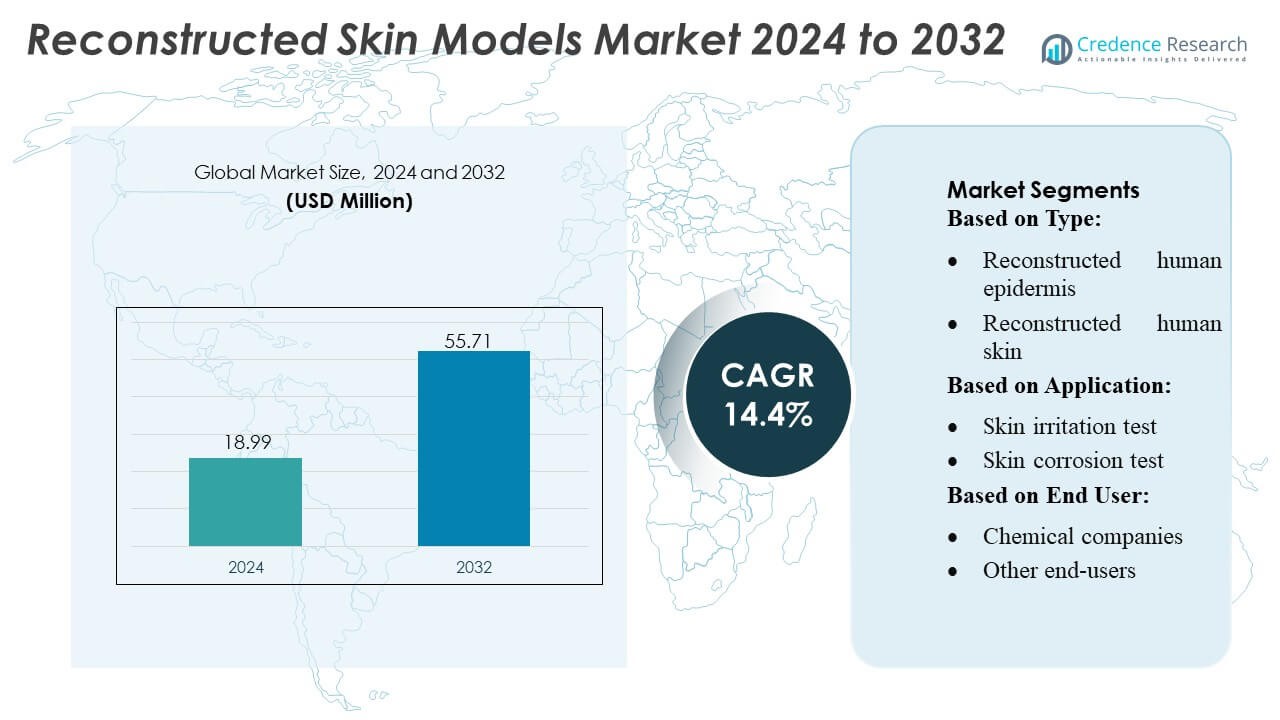
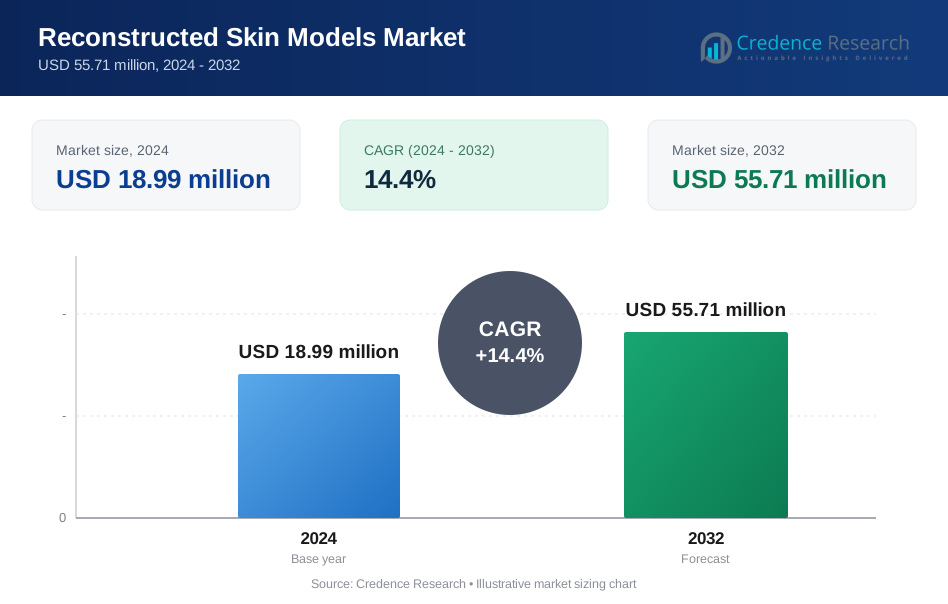
Reconstructed Skin Models Market size was valued USD 18.99 million in 2024 and is anticipated to reach USD 55.71 million by 2032, at a CAGR of 14.4% during the forecast period.
| REPORT ATTRIBUTE | DETAILS |
|---|---|
| Historical Period | 2020-2023 |
| Base Year | 2024 |
| Forecast Period | 2025-2032 |
| Reconstructed Skin Models Market Size 2024 | USD 18.99 Million |
| Reconstructed Skin Models Market , CAGR | 14.4% |
| Reconstructed Skin Models Market Size 2032 | USD 55.71 Million |
The reconstructed skin models market is shaped by a mix of advanced tissue-engineering innovators and providers of high-precision testing platforms that support regulatory-compliant irritation, corrosion, and sensitization assessments. Leading companies focus on developing full-thickness, immune-competent, and disease-specific models that enhance physiological relevance and improve predictive accuracy for pharmaceutical, cosmetics, and chemical applications. Strategic investments in automation, bioprinting, and high-content imaging strengthen their competitive positioning and expand adoption across global R&D pipelines. North America remains the leading region with an exact 38% market share, driven by strong regulatory alignment, extensive dermatology research, and high integration of non-animal testing technologies.
Market Insights
- The Reconstructed Skin Models Market was valued at USD 18.99 million in 2024 and is projected to reach USD 55.71 million by 2032, registering a 4% CAGR during the forecast period.
- Demand rises as tissue-engineered epidermis and full-thickness models support non-animal irritation, corrosion, and sensitization testing across cosmetics, chemicals, and pharmaceutical development.
- Market momentum strengthens with innovations in 3D bioprinting, immune-competent constructs, and high-content imaging, enabling more accurate disease modeling and product-efficacy studies.
- Competitive activity intensifies as companies invest in automated manufacturing and advanced analytical tools, though high production costs and limited scalability remain key restraints.
- North America leads with a 38% share, while reconstructed human epidermis holds the dominant segment share due to its broad regulatory acceptance and routine use in safety-assessment workflows.
Market Segmentation Analysis:
By Type
Reconstructed human epidermis dominates the reconstructed skin models market with an estimated 52–54% share, supported by its validated use in regulatory-approved irritation and corrosion assays. Its standardized architecture, high reproducibility, and cost-efficient culture protocols make it the preferred choice for routine safety testing across cosmetics, chemicals, and pharmaceuticals. Demand rises as manufacturers adopt epidermal models to eliminate animal testing and comply with evolving global regulatory frameworks. Reconstructed human skin, offering full-thickness structure and advanced physiological relevance, gains traction for complex mechanistic and penetration studies.
- For instance, Johnson & Johnson’s consumer health division revealed 16 new skincare research studies at the 2021 American Academy of Dermatology Virtual Meeting. The presentations, which included 3 oral publications and 13 poster presentations, highlighted targeted innovation in various aspects of skin health, including for women, cancer patients, and multicultural populations.
By Application
Skin irritation testing holds the leading position with an approximate 40–42% share, driven by stringent requirements from regulatory bodies and high testing frequency across consumer product categories. Its rapid turnaround time, validated OECD test guidelines, and predictable biological endpoints reinforce widespread industry reliance. Skin corrosion and sensitization tests also expand steadily as companies pursue non-animal, high-accuracy platforms to evaluate potentially hazardous compounds. Meanwhile, applications such as skin biopsy and pigmentation studies grow in specialized R&D environments, supporting advanced dermatology research, claim substantiation, and mechanistic pathway analysis.
- For instance, Coty employs over the same webpage confirms this detail 600+ people work in our R&D centers around the world across 25 technical disciplines.
By End-user
Cosmetics and cosmeceutical companies account for the largest share at 48–50%, propelled by global bans on animal testing and increasing demand for scientifically robust, reproducible, and ethically aligned safety evaluations. Their extensive use of reconstructed skin models in product development, claim validation, and regulatory submissions strengthens segment leadership. Chemical companies increasingly adopt these models to assess toxicological profiles of raw materials and industrial formulations, benefiting from improved predictive accuracy. Other end-users, including academic research centers and pharmaceutical developers, contribute to growth through advanced mechanistic and translational studies.
Key Growth Drivers
Rising Demand for Non-Animal Testing Alternatives
Demand for reconstructed skin models accelerates as regulatory bodies, ethical groups, and global industries shift away from animal-based testing. Regulatory bans on animal testing for cosmetics in regions such as the EU and rising pressure in North America and Asia reinforce adoption across R&D workflows. Companies value reconstructed human epidermis and full-thickness models for their reproducibility, scalability, and physiological relevance. These models enable precise assessment of irritation, corrosion, and sensitization while improving product-development timelines and reducing compliance risk.
- For instance, L’Oréal’s new North America Research & Innovation Center spans 250,000 sq ft and houses a 26,000 sq ft modular lab, on-site mini factory, and capacity for daily user testing with up to 400 consumers.
Advancements in Tissue Engineering and 3D Bioprinting Technologies
Technological progress in tissue engineering strengthens the performance and commercial viability of reconstructed skin models. Innovations in 3D bioprinting, scaffold materials, and growth-factor optimization enhance structural accuracy, barrier function, and cell differentiation. Improved vascularization strategies and reproducible culture systems allow researchers to mimic complex skin disorders more effectively. These advancements expand the models’ utility for drug screening, toxicity evaluation, and dermatological research. As suppliers integrate automation and standardized manufacturing, adoption increases across pharmaceutical, chemical, and cosmetics industries.
- For instance, Unilever has built one of the largest proprietary skin microbiome databases, analyzing over 30,000 skin samples and securing more than 100 patents in microbiome science.
Growing R&D Investments in Dermatology and Personalized Medicine
Dermatology research expands rapidly, driven by increasing prevalence of inflammatory skin disorders, rising demand for biologics, and interest in personalized treatment pathways. Reconstructed skin models enable detailed evaluation of disease mechanisms, drug interactions, and patient-specific responses that traditional in vitro tools cannot capture. Pharmaceutical companies and research institutes invest in advanced platforms that replicate pigmentation, aging, and pathological states. As clinical pipelines diversify, demand for reliable, human-relevant skin systems continues to grow, positioning these models as essential tools in translational research.
Key Trends & Opportunities
Expansion of Disease-Specific and Functionalized Skin Models
The market moves toward specialized skin constructs that replicate pathological states such as atopic dermatitis, psoriasis, and photoaged skin. Functional enhancements including immune-competent, melanocyte-rich, and microbiome-integrated models create new opportunities for precision testing and next-generation therapeutics. These differentiated platforms attract pharmaceutical, nutraceutical, and cosmeceutical players seeking high-predictive tools. As suppliers scale commercially viable versions of these complex systems, demand rises sharply for disease modeling, efficacy screening, and mechanism-of-action studies.
- For instance, Hanson Medical does hold FDA 510(k) clearance for its MONARCH Nasal Implant (K071018) as an internal nasal prosthesis, and their website confirms they manufacture "soft-solid silicone implants" that are generally in stock for immediate shipment, with custom orders built to exact specifications, including durometer (firmness) grade.
Integration of High-Content Imaging and AI-Enabled Analysis
A major opportunity emerges from the integration of high-content imaging, automated microscopy, and AI-driven analytics into reconstructed skin testing workflows. These tools generate quantifiable insights into cellular morphology, barrier integrity, and inflammatory responses. AI supports accelerated data interpretation, reduces variability, and enhances early-stage decision making for formulators and drug developers. Adoption of digital twins and predictive modeling further increases the efficiency of toxicology and dermatology studies, positioning advanced analytics as a transformative trend in the market.
- For instance, Sientra publishes long-term clinical data showing complication rates from its 10-year core study, which involved 1,788 patients (3,506 implants). The study reported a rupture-free rate of 91.4% by patient, while the capsular contracture (Baker Grade III/IV) incidence was 13.5%.
Commercialization of Scalable, Cost-Efficient Production Platforms
Producers increasingly pursue manufacturing innovations that reduce costs and improve throughput, making reconstructed skin models more accessible to routine testing environments. Automated bioprocessing systems, modular bioreactors, and standardized culture protocols support consistent, large-volume production. These improvements open new opportunities in high-volume cosmetics screening, chemical safety validation, and academic research. As scalability improves and unit costs decline, end-users can expand adoption across broader test portfolios, reinforcing market penetration in both developed and emerging regions.
Key Challenges
High Production Costs and Limited Scalability in Complex Models
Despite technological advances, production of high-fidelity reconstructed skin models remains expensive, requiring specialized biomaterials, controlled environments, and skilled labor. Complex full-thickness or disease-specific models are cost-intensive and difficult to scale without compromising reproducibility. These limitations restrict adoption among smaller laboratories and cost-sensitive industries. High pricing also slows penetration into routine QC workflows. Addressing cost structures through automation, standardized protocols, and optimized biomaterial sourcing remains essential for broader commercial adoption.
Variability and Lack of Standardized Validation Frameworks
The market faces challenges due to variability across platforms, culture conditions, and performance benchmarks. Lack of global standardization complicates regulatory acceptance, especially in pharmaceutical and chemical toxicity testing. End-users often compare models from different suppliers, yet inconsistencies in barrier properties, cell composition, or metabolic activity affect comparability of results. Without harmonized validation guidelines and universally accepted quality metrics, widespread adoption in risk-averse sectors remains limited. Strengthening regulatory alignment and inter-laboratory validation efforts is critical for market maturation.
Regional Analysis
North America
North America leads the reconstructed skin models market with a 38% share, supported by advanced dermatology research, strong regulatory emphasis on reducing animal testing, and high adoption of 3D tissue-engineered platforms across pharmaceutical and cosmetics companies. The U.S. drives demand through extensive clinical pipelines in oncology, immunology, and inflammatory skin disorders, while major academic and commercial laboratories rely on reconstructed models for toxicity and efficacy screening. Investment in bioprinting, high-content imaging, and AI-driven analysis further accelerates regional innovation. Canada strengthens growth through rising cosmetics certification needs and expanding biomanufacturing capabilities.
Europe
Europe holds a significant 32% share, driven by stringent regulatory bans on cosmetic animal testing, well-established toxicology frameworks, and strong participation from chemical, personal care, and pharmaceutical industries. Countries such as Germany, France, and the U.K. advance adoption through investment in 3D skin physiology modeling and disease-relevant in vitro platforms. Research institutions lead innovation in immune-competent and melanocyte-integrated models, supporting mechanistic studies and regulatory submissions. The region also benefits from harmonized validation programs under OECD guidelines, enabling broader acceptance of reconstructed skin systems for irritation, corrosion, and sensitization testing across industrial sectors.
Asia-Pacific
Asia-Pacific accounts for 24% of the market and demonstrates the fastest adoption of reconstructed skin models, propelled by expanding cosmetics manufacturing, rapid growth in dermatology research, and increasing alignment with global non-animal testing standards. China, Japan, and South Korea support demand through active investment in tissue engineering, biofabrication, and advanced toxicity screening platforms. Rising prevalence of pigmentation disorders, consumer interest in high-performance skincare, and pharmaceutical outsourcing trends strengthen market penetration. In addition, regional companies increasingly collaborate with global CROs and CDMOs to scale disease-specific and full-thickness skin models for local regulatory and product-development needs.
Latin America
Latin America captures a modest 4% share, though demand grows steadily as cosmetics and chemical regulatory bodies move toward animal-testing alternatives and multinational brands expand their local safety-assessment workflows. Brazil and Mexico drive the region through rising investment in dermatology research, penetration of global beauty companies, and increased interest in irritation and sensitization testing using reconstructed epidermis. Limited availability of advanced tissue-engineering infrastructure and higher import dependence constrain market expansion. However, partnerships with international laboratories and growing participation in global validation programs gradually improve regional capacity and support wider adoption of reconstructed skin models.
Middle East & Africa
The Middle East & Africa region holds a 2% market share, characterized by early-stage adoption and growing interest from emerging cosmetics, pharmaceutical, and academic research sectors. The UAE, Saudi Arabia, and South Africa show rising engagement in non-animal testing initiatives, driven by regulatory modernization and increasing awareness of safety-assessment best practices. Market growth remains constrained by limited tissue-engineering expertise and dependence on imported models. However, expansion of biotech incubators, investment in research infrastructure, and collaborations with international CROs gradually strengthen the region’s capability to use reconstructed skin systems for irritation, corrosion, and pigmentation studies.
Market Segmentations:
By Type:
- Reconstructed human epidermis
- Reconstructed human skin
By Application:
- Skin irritation test
- Skin corrosion test
By End User:
- Chemical companies
- Other end-users
By Geography
- North America
- U.S.
- Canada
- Mexico
- Europe
- Germany
- France
- U.K.
- Italy
- Spain
- Rest of Europe
- Asia Pacific
- China
- Japan
- India
- South Korea
- South-east Asia
- Rest of Asia Pacific
- Latin America
- Brazil
- Argentina
- Rest of Latin America
- Middle East & Africa
- GCC Countries
- South Africa
- Rest of the Middle East and Africa
Competitive Landscape
The competitive landscape of the reconstructed skin models market players such as BioVis3D, Reconstruct Me, Bentley Systems, Incorporated, Skyline Software Systems Inc., NavVis, ELCOVISION 10, 3DHISTECH Ltd., Pix4D SA, Autodesk Inc., and EOS imaging. the reconstructed skin models market reflects rapid innovation driven by advances in tissue engineering, 3D bioprinting, and high-content analytical platforms. Companies focus on developing robust, physiologically relevant skin constructs that replicate barrier function, immune responses, pigmentation, and disease-specific conditions to support regulatory-compliant testing. Competition intensifies as firms invest in automated bioprocessing, scalable manufacturing, and standardized quality frameworks to improve reproducibility and reduce cost barriers. Strategic partnerships with pharmaceutical developers, cosmetics brands, and academic institutions accelerate validation efforts and broaden application areas. As demand for non-animal testing and high-predictive in vitro systems rises globally, industry participants differentiate through enhanced model complexity, integrated imaging capabilities, and data-driven performance insights.
Key Player Analysis
- BioVis3D
- Reconstruct Me
- Bentley Systems, Incorporated
- Skyline Software Systems Inc.
- NavVis
- ELCOVISION 10
- 3DHISTECH Ltd.
- Pix4D SA
- Autodesk Inc.
- EOS imaging
Recent Developments
- In February 2025, SECQAI, a UK-based business specializing in ultra-secure hardware and software and part of the NATO DIANA initiative, announced the launch of what it calls the world's first hybrid Quantum Large Language Model (QLLM).
- In November 2024, NVIDIA was heavily promoting Small Language Models (SLMs) and optimization techniques like Hymba architecture (hybrid attention/SSMs, KV cache sharing), NIM microservices, and GPU features (like H200/GB200) for faster, cheaper enterprise AI.
- In April 2024, Microsoft Phi-3-mini is the first model in the Phi-3 family and is designed to perform advanced AI tasks efficiently on local devices. It is accessible through several platforms, including the Microsoft Azure AI Model Catalog, Hugging Face, Ollama, and NVIDIA NIM.
Report Coverage
The research report offers an in-depth analysis based on Type, Application, End-User and Geography. It details leading market players, providing an overview of their business, product offerings, investments, revenue streams, and key applications. Additionally, the report includes insights into the competitive environment, SWOT analysis, current market trends, as well as the primary drivers and constraints. Furthermore, it discusses various factors that have driven market expansion in recent years. The report also explores market dynamics, regulatory scenarios, and technological advancements that are shaping the industry. It assesses the impact of external factors and global economic changes on market growth. Lastly, it provides strategic recommendations for new entrants and established companies to navigate the complexities of the market.
Future Outlook
- The market will witness broader adoption of non-animal testing platforms as global regulatory frameworks strengthen ethical compliance requirements.
- Demand for disease-specific and immune-competent skin models will rise to support advanced dermatology and immunology research pipelines.
- 3D bioprinting innovations will enhance structural accuracy, vascularization potential, and scalability of reconstructed skin systems.
- AI-enabled image analytics and automated readout tools will improve predictive accuracy and reduce interpretation variability.
- Commercialization of cost-efficient, high-throughput manufacturing platforms will expand accessibility for routine toxicology testing.
- Pharmaceutical companies will increasingly integrate reconstructed skin models into early-stage screening for biologics and topical therapeutics.
- Cosmetics and personal care brands will rely more heavily on reconstructed epidermis and full-thickness models to validate new formulations.
- Microbiome-integrated skin models will emerge as a key opportunity for studying host–microbe interactions and product efficacy.
- Collaborative validation programs will enhance regulatory acceptance and harmonize global testing standards.
- Emerging markets will accelerate adoption as research infrastructure, biotechnology investments, and clinical dermatology capabilities expand.
Request a Free Sample
Fill in your details and we'll send you a free sample report.
- Sample data tables & charts
- Research methodology
Need a Custom Version of This Report?
Tailor the scope, geography, or segments to your exact requirements.
- Custom geography or segment scope
- Direct access to our analyst team
Frequently Asked Questions
What is the current market size for the Reconstructed Skin Models Market, and what is its projected size in 2032?
At what Compound Annual Growth Rate is the Reconstructed Skin Models Market projected to grow between 2024 and 2032?
Which Reconstructed Skin Models Market segment held the largest share in 2024?
What are the primary factors fueling the growth of the Reconstructed Skin Models Market?
Who are the leading companies in the Reconstructed Skin Models Market?
Which region commanded the largest share of the Reconstructed Skin Models Market in 2024?
Table of Content
Chapter 1. Report Introduction
- 1.1 Report Description & Purpose
- 1.1.1 Report Title & Market Definition
- 1.1.2 Unique Selling Propositions (USP) & Key Differentiators
- 1.1.3 Value Proposition for Stakeholders
- 1.2 Research Objectives
- 1.2.1 Market Sizing Objectives (Volume & Revenue)
- 1.2.2 Segmentation Objectives
- 1.2.3 Competitive Intelligence Objectives
- 1.2.4 Forecast & Scenario Objectives
- 1.3 Report Scope
- 1.3.1 Reconstructed Skin Models Scope – Types & Subtypes Covered
- 1.3.2 Geographic Scope – Regions & Countries Covered
- 1.3.3 Historical Period, Base Year & Forecast Period (2024; forecast to 2032)
- 1.3.4 Inclusions & Exclusions
- 1.4 HS Code & Classification Framework
- 1.5 Currency, Units & Pricing Basis
- 1.6 Target Stakeholders
- 1.7 Limitations & Assumptions
Chapter 2. Executive Summary
- 2.1 Global Reconstructed Skin Models Market Snapshot
- 2.1.1 Market Size – Historical (2024) & Forecast (2024-2032) (2024: USD 18.99 million → 2032: USD 55.71 million)
- 2.1.2 Volume & Revenue – Global Totals
- 2.1.3 Key Market Highlights – Top Five Facts
- 2.2 Reconstructed Skin Models Market Segmentation Snapshot
- 2.2.1 Market Split by Region – 2024 vs. 2032
- 2.3 Competitive Snapshot
- 2.3.1 Top 10 Players by Revenue Share – 2024
- 2.3.2 Top 10 Players by Volume Share – 2024
- 2.3.3 Recent Strategic Developments (18-Month Summary)
- 2.4 Key Investment Highlights & Strategic Conclusions
Chapter 3. Reconstructed Skin Models Market Dynamics & Industry Analysis
- 3.1 Market Overview & Context
- 3.1.1 Reconstructed Skin Models Market Position in the Broader Automotive Value Chain
- 3.1.2 OEM vs. Replacement Market Dynamics
- 3.1.3 Market Maturity & Development Stage by Region
- 3.2 Reconstructed Skin Models Market Drivers
- 3.3 Reconstructed Skin Models Market Restraints & Challenges
- 3.4 Reconstructed Skin Models Market Opportunities
- 3.5 Porter's Five Forces Analysis
- 3.5.1 Threat of New Entrants
- 3.5.2 Bargaining Power of Suppliers
- 3.5.3 Bargaining Power of Buyers
- 3.5.4 Threat of Substitutes
- 3.5.5 Competitive Rivalry – Intensity Assessment
- 3.6 Reconstructed Skin Models Value Chain Analysis
- 3.6.1 Upstream – Raw Material/Input Suppliers
- 3.6.1.1 Raw Material/Input 1
- 3.6.1.2 Raw Material/Input 2
- 3.6.1.3 Raw Material/Input 3
- 3.6.2 Midstream – Production/Manufacturing/Service Delivery
- 3.6.2.1 Production/Process Overview
- 3.6.2.2 Key Facility Locations & Capacity by Manufacturer
- 3.6.3 Downstream – Distribution & End Consumer
- 3.6.3.1 Primary Channel – B2B/OEM
- 3.6.3.2 Secondary Channels – Dealer, Retail, Online, Direct
- 3.6.4 Value Chain Profitability Analysis
- 3.6.1 Upstream – Raw Material/Input Suppliers
- 3.7 PESTEL Analysis
- 3.7.1 Political Factors
- 3.7.2 Economic Factors
- 3.7.3 Social Factors
- 3.7.4 Technological Factors
- 3.7.5 Environmental Factors
- 3.7.6 Legal Factors
- 3.8 Reconstructed Skin Models Supply Chain Analysis
- 3.8.1 Raw Material/Input Supply Risk Assessment
- 3.8.2 Manufacturing Concentration Risk (Geographic Exposure)
- 3.8.3 Trade Disruption Impact Analysis
- 3.9 Regulatory & Policy Landscape
Note: The regulatory and policy landscape section covers regulations based on their applicability to the market, Reconstructed Skin Models category, geography, and scope of the study. Only regulatory frameworks with a material impact on operations, compliance, trade, sustainability, or market access are analyzed in detail.
Chapter 4. Key Investment Pockets & Opportunity Analysis
- 4.1 Reconstructed Skin Models Market Attractiveness Analysis
- 4.1.1 By Region – Investment Attractiveness Matrix (Volume × CAGR)
- 4.2 Absolute Revenue Growth Opportunity
- 4.2.1 By Region – Absolute USD Growth Through 2032
- 4.3 Incremental Volume Opportunity
- 4.3.1 By Region – Incremental Volume Through 2032
- 4.3.2 Segment – Incremental Volume
- 4.4 Emerging Submarket Opportunity Deep Dive (Subject to Applicability)
- 4.5 Emerging Market Opportunity Scorecards
- 4.5.1 United States
- 4.5.2 Europe
- 4.5.3 Asia
- 4.5.4 Middle East & Africa
Note: Emerging Market Opportunity Scorecards will be included based on relevance and strategic importance. Regions listed are indicative and may vary depending on data availability and market dynamics.
Chapter 5. Reconstructed Skin Models Import-Export Analysis & Trade Flows
- 5.1 Global Trade Overview
- 5.1.1 Global Export Value by Country (2024)
- 5.1.2 Global Export Volume by Country (2024)
- 5.1.3 Global Import Value by Country (2024)
- 5.1.4 Global Import Volume by Country (2024)
- 5.1.5 Net Trade Balance by Country (2024)
- 5.2 Export Analysis – Segment
- 5.2.1 Type 1 (HS Code)
- 5.2.2 Type 2 (HS Code)
- 5.2.3 Type 3 (HS Code)
- 5.2.4 Type 4 (HS Code)
- 5.2.5 Type 5 (HS Code)
- 5.3 Import Analysis – Segment
- 5.3.1 Type 1 (HS Code)
- 5.3.2 Type 2 (HS Code)
- 5.3.3 Type 3 (HS Code)
- 5.3.4 Type 4 (HS Code)
- 5.3.5 Type 5 (HS Code)
- 5.4 Average Unit Trade Prices
- 5.4.1 Average Export Price – Segment & Country
- 5.4.2 Average Import Price – Segment & Source Country
- 5.4.3 Price Trends (2024)
- 5.5 Key Trade Route Analysis
- 5.5.1 Trade Route 1
- 5.5.2 Trade Route 2
- 5.5.3 Trade Route 3
- 5.5.4 Trade Route 4
- 5.5.5 Trade Route 5
- 5.6 Trade Policy Impact Assessment
- 5.6.1 US Anti-Dumping & Section 301 Tariffs
- 5.6.2 EU Customs Union Impact
- 5.6.3 Major Free Trade Agreements
- 5.6.4 USMCA Rules of Origin
Note: Trade policy analysis will be included only where relevant to the Reconstructed Skin Models market.
Chapter 6. Competitive Landscape & Company Benchmarking
- 6.1 Reconstructed Skin Models Market Concentration & Structure
- 6.1.1 Herfindahl-Hirschman Index (HHI) – vs. 2024
- 6.1.2 Tier 1, Tier 2 & Tier 3 Market Structure
- 6.1.3 Global, Regional & Local Player Dynamics
- 6.2 Reconstructed Skin Models Market Share Analysis – 2024
- 6.2.1 Global Revenue Share by Company
- 6.2.2 Global Volume Share by Company
- 6.2.3 Regional Revenue Share
- 6.2.4 Market Share Evolution ( vs. 2024)
- 6.2.5 OEM Segment Share by Company
- 6.2.6 Replacement Segment Share by Company
- 6.3 Production/Delivery Capacity & Facility Analysis
- 6.3.1 Global Installed Capacity
- 6.3.2 Capacity Utilization Rates
- 6.3.3 Production/Output Volume
- 6.3.4 Facility Locations & Capacity Map
- 6.3.5 Planned Capacity Additions
- 6.4 Reconstructed Skin Models Competitive Benchmarking Matrix
- 6.4.1 Revenue, Volume, CAGR & Profitability Comparison
- 6.4.2 Channel Revenue Mix
- 6.4.3 Geographic Revenue Exposure
- 6.4.4 R&D Intensity
- 6.4.5 Sustainability Maturity
- 6.5 Strategic Developments in Reconstructed Skin Models (Last 24 Months)
- 6.5.1 Mergers, Acquisitions & Divestments
- 6.5.2 New Reconstructed Skin Models Launches
- 6.5.3 Facility Expansions
- 6.5.4 Strategic Alliances, Joint Ventures & Partnerships
- 6.5.5 Distribution Expansion & Market Entry
- 6.5.6 Sustainability & ESG Initiatives
- 6.6 Competitive Strategy Mapping
- 6.6.1 Leader, Challenger, Follower & Niche Classification
- 6.6.2 Pricing Strategy Comparison
- 6.6.3 Channel Strategy Matrix
Note: Strategic developments are included based on their materiality and the availability of reliable information.
Chapter 7. Global Reconstructed Skin Models Market – By Distribution Channel
- 7.1 Segment Overview
- 7.1.1 Volume & Revenue Split by Channel (2024 & 2032)
- 7.1.2 Channel Mix Evolution (2024-2032)
Chapter 8. Regional Market Analysis – Global Overview
- 8.1 Global Regional Overview
- 8.1.1 Regional Volume Share
- 8.1.2 Regional Revenue Share
- 8.1.3 Regional Volume by Region
- 8.1.4 Regional Revenue by Region
- 8.1.5 Regional Forecast Through 2032
- 8.2 Cross-Regional Segment Analysis
- 8.2.1 By Distribution Channel
- 8.2.2 By Brand/Price Tier
Chapter 9. North America Reconstructed Skin Models Market
- 9.1 United States
- 9.2 Canada
- 9.3 Mexico
Chapter 10. Europe Reconstructed Skin Models Market
- 10.1 Germany
- 10.2 France
- 10.3 Italy
- 10.4 United Kingdom
- 10.5 Spain
- 10.6 Poland
- 10.7 Russia
- 10.8 Netherlands
- 10.9 Belgium
- 10.10 Sweden
- 10.11 Denmark
- 10.12 Norway
- 10.13 Rest of Europe
Chapter 11. Asia Pacific Reconstructed Skin Models Market
- 11.1 China
- 11.2 India
- 11.3 Japan
- 11.4 South Korea
- 11.5 Thailand
- 11.6 Indonesia
- 11.7 Vietnam
- 11.8 Malaysia
- 11.9 Australia
- 11.10 Rest of Asia Pacific
Chapter 12. Latin America Reconstructed Skin Models Market
- 12.1 Brazil
- 12.2 Argentina
- 12.3 Colombia
- 12.4 Chile
- 12.5 Rest of Latin America
Chapter 13. Middle East Reconstructed Skin Models Market
- 13.1 Saudi Arabia
- 13.2 United Arab Emirates
- 13.3 Turkey
- 13.4 Israel
- 13.5 Iran
- 13.6 Rest of the Middle East
Chapter 14. Africa Reconstructed Skin Models Market
- 14.1 South Africa
- 14.2 Egypt
- 14.3 Nigeria
- 14.4 Morocco
- 14.5 Rest of Africa
Chapter 15. Reconstructed Skin Models Company Profiles
- 15.1 [Company 01]
- 15.1.1 Company Overview
- 15.1.2 Key Management Personnel
- 15.1.3 Products & Services Portfolio
- 15.1.4 Financial Performance
- 15.1.5 Key Market Focus & Geographic Presence
- 15.1.6 Recent Developments & Strategic Initiatives
Note: The company profile list is preliminary and may change based on research findings, market developments, data availability, and client requirements.
Chapter 16. Appendices
- Appendix A – List of Abbreviations & Acronyms
- Appendix B – Industry Classification Code Reference – Full Series
- Appendix C – Production & Capacity Data Tables
- Appendix D – End-Use & Demand Base Tables
- Appendix E – Consumption & Replacement Rate Assumptions
- Appendix F – ASP Reference Tables
- Appendix G – Manufacturing & Facility Database
- Appendix H – Import-Export Data Tables
- Appendix I – Regulatory Summary Tables
- Appendix J – Primary Research Participant List (Anonymized)
- Appendix K – Primary Research Questionnaire Framework
- Appendix L – Data Sources & Bibliography
- Appendix M – Market Size Divergence & Source Comparison
Chapter 17. Research Methodology
- 17.1 Research Framework & Philosophy
- 17.2 Secondary Research – Sources, Hierarchy & Data Extraction
- 17.3 Data Modeling – Bottom-Up & Top-Down Market Sizing
- 17.4 Primary Research – Stakeholder Framework, LOI & Sample Sizes
- 17.5 Forecast Methodology – Regression, Scenario & Sensitivity Analysis
- 17.6 Quality Control – Four-Layer Validation Framework
- 17.7 Limitations & Standard Assumptions
- 17.8 Disclaimer
