Market Overview
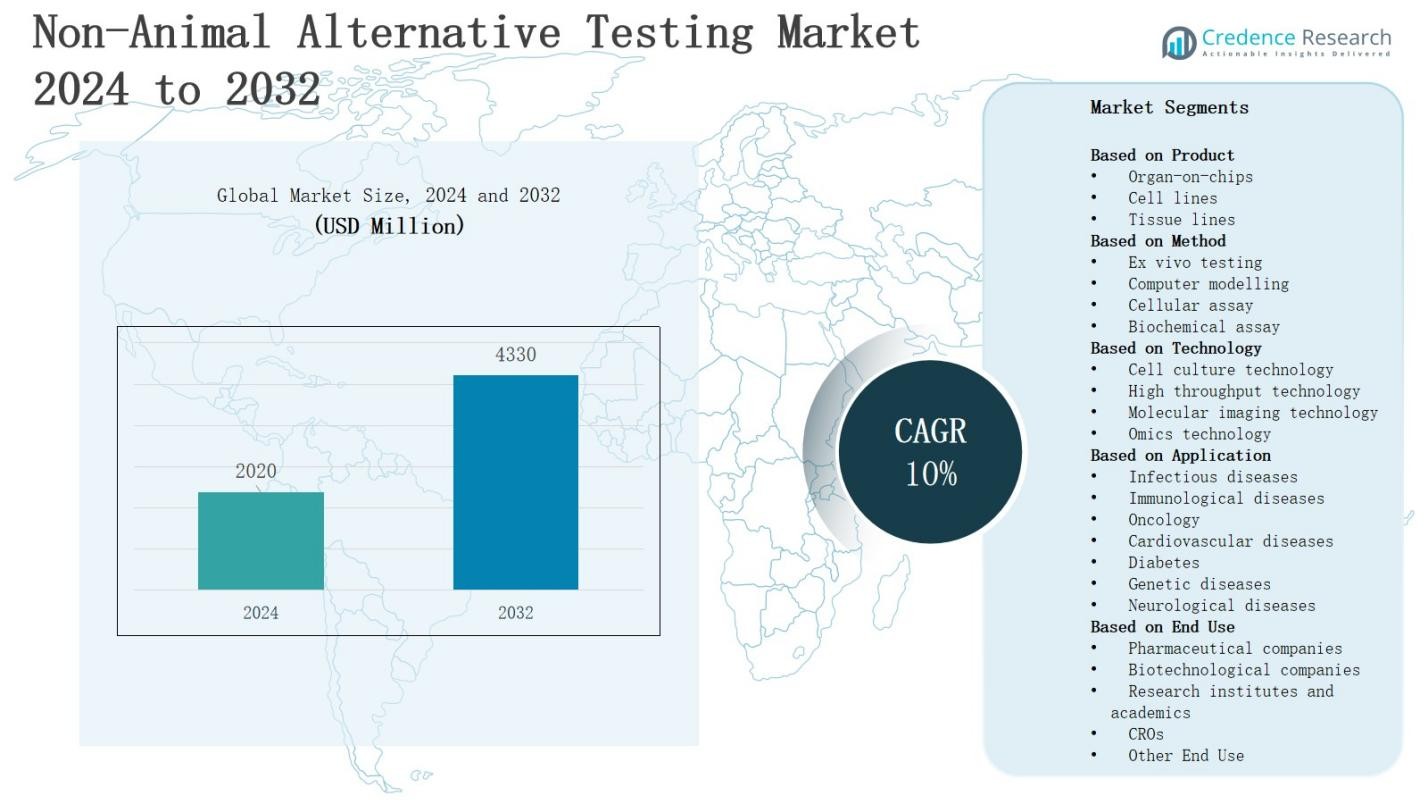
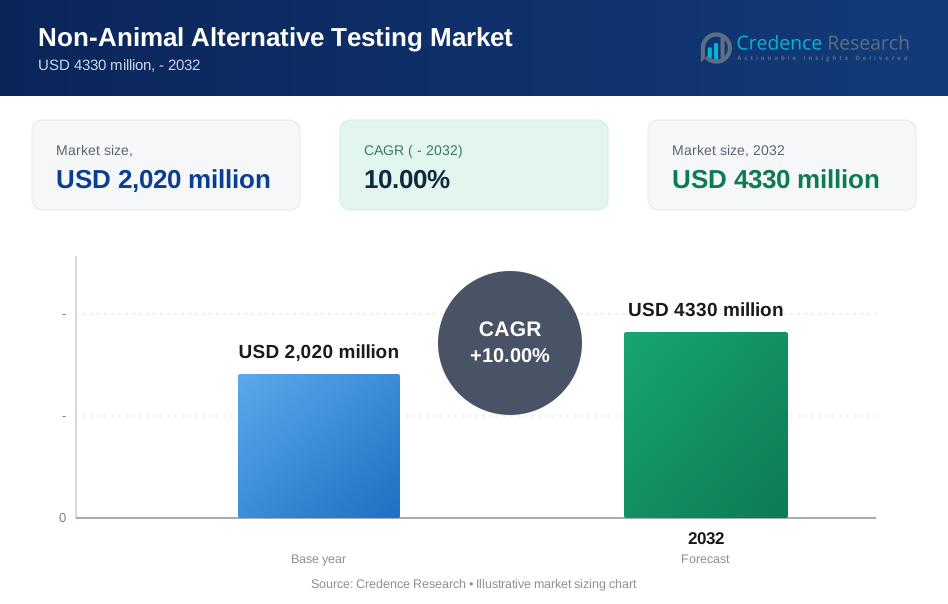
The Non-Animal Alternative Testing Market is projected to grow from USD 2020 million in 2024 to USD 4330 million by 2032, registering a 10% CAGR during the forecast period.
| REPORT ATTRIBUTE | DETAILS |
|---|---|
| Historical Period | 2020-2024 |
| Base Year | 2024 |
| Forecast Period | 2025-2032 |
| Non-Animal Alternative Testing Market Size 2024 | USD 2020 Million |
| Non-Animal Alternative Testing Market, CAGR | 10% |
| Non-Animal Alternative Testing Market Size 2032 | USD 4330 Million |
The non-animal alternative testing market is driven by rising ethical concerns, regulatory pressure, and demand for reliable, cost-effective testing solutions. Growing restrictions on animal-based experiments, particularly in cosmetics and pharmaceuticals, accelerate adoption of alternative methods. Advances in in-vitro testing, organ-on-chip models, and computational toxicology enhance accuracy and reduce testing time, supporting wider acceptance. Increasing R&D investments and collaborations between industry and research institutes strengthen innovation pipelines. Trends highlight a shift toward personalized medicine applications, integration of AI for predictive analysis, and expansion of 3D tissue culture models, positioning non-animal alternatives as sustainable solutions in global testing practices.
The non animal alternative testing market shows diverse regional dynamics, with North America leading growth, followed by Europe with strong regulatory frameworks. Asia-Pacific is emerging rapidly, supported by biotechnology investments and expanding healthcare infrastructure. Latin America is gaining traction through improving standards in Brazil and Mexico, while the Middle East & Africa show early adoption led by South Africa and Gulf nations. Key players include AlveoliX, BICO GROUP, CN Bio Innovations, Emulate, Hesperos, InSphero, Lonza Group, Merck, MIMETAS, Thermo Fisher Scientific, TissUse, and VITROCELL Systems.
Market Insights
- The non animal alternative testing market will grow from USD 2020 million in 2024 to USD 4330 million by 2032, registering a strong 10% CAGR during the forecast period.
- Organ-on-chips dominate with 38% share in 2024, supported by their ability to replicate human organ functions accurately. Cell lines hold 34%, while tissue lines account for 28% market share.
- By method, cellular assays lead with 36% share, followed by biochemical assays at 28%. Ex vivo testing holds 20% share, while computer modelling contributes 16% with rising AI integration.
- Cell culture technology leads with 40% share, supported by widespread adoption in clinical research. High throughput follows at 27%, while omics technology captures 19% and molecular imaging secures 14%.
- Regionally, North America holds 37% share, Europe 31%, Asia-Pacific 22%, Latin America 6%, and Middle East & Africa 4%, driven by regulatory push, biotechnology growth, and rising consumer demand.
Market Drivers
Regulatory Push and Ethical Concerns
The non animal alternative testing market is strongly driven by global regulations restricting animal use in research. Authorities in Europe, North America, and Asia enforce strict compliance with non-animal safety standards, especially in cosmetics and pharmaceuticals. It responds to consumer demand for cruelty-free products, which enhances brand credibility and market positioning. Governments fund research programs to accelerate method validation. This regulatory environment strengthens adoption and pushes industries to adopt safer, ethical testing frameworks.
- For instance, Japan’s Ministry of Health, Labour and Welfare approved Shiseido’s use of reconstructed human epidermis models for skin irritation testing, further advancing regulatory acceptance of non-animal methods.
Technological Advancements and Innovation
Continuous innovation in testing technologies is a central driver for the non animal alternative testing market. In-vitro models, organ-on-chip systems, and 3D cell cultures offer improved reliability and faster results. It allows companies to replicate human biology with greater accuracy than animal testing. Artificial intelligence integration supports predictive toxicology and enhances decision-making. Industry players invest heavily in advanced platforms to reduce timelines and costs. These innovations establish alternatives as efficient solutions for global testing needs.
- For instance, Emulate Inc. has developed organ-on-chip systems that simulate human liver and lung functions, and in 2020, the company partnered with the FDA to explore their application in assessing drug safety.
Rising Industry Demand and Consumer Awareness
Increasing awareness of ethical sourcing and sustainable development fuels demand for non-animal testing methods. The non animal alternative testing market benefits from consumers actively supporting cruelty-free labels across cosmetics, healthcare, and chemical industries. It enables companies to capture environmentally conscious and socially responsible customers. Corporate sustainability goals encourage adoption of validated non-animal techniques. Expanding e-commerce platforms amplify consumer voice and demand for transparency. This awareness ensures strong growth opportunities for non-animal testing providers worldwide.
Supportive Research Ecosystem and Funding
The non animal alternative testing market thrives on expanding collaborations between academic institutions, regulatory bodies, and industry stakeholders. Partnerships accelerate validation and standardization of alternative methods. It receives consistent funding from public and private organizations for research projects. Research clusters create strong ecosystems to advance organoid models and computational simulations. Start-ups and established players benefit from shared resources and data networks. These collaborative efforts create a favorable environment for continuous adoption and innovation.
Market Trends
Adoption of Advanced In-Vitro Technologies
The non animal alternative testing market is witnessing rapid adoption of in-vitro technologies for toxicology and drug development. 3D tissue cultures, organoid systems, and microfluidic devices provide high accuracy and replicate human physiological responses better than animal models. It enables faster drug discovery while reducing safety risks. Pharmaceutical and cosmetic companies use these solutions to meet regulatory requirements. Growing investments in lab automation support scalability. These innovations continue to transform research and strengthen industry confidence in alternative methods.
- For instance, Organovo developed 3D bioprinted human liver tissues that can model drug-induced liver injury, offering a more predictive platform than animal testing.
Integration of Artificial Intelligence and Computational Models
The use of artificial intelligence and computational toxicology is a major trend in the non animal alternative testing market. AI-powered platforms analyze complex datasets, predict toxicity outcomes, and enhance accuracy in early-stage testing. It reduces time and costs by simulating human responses digitally. Machine learning models improve risk assessment and support personalized medicine research. Companies rely on predictive analytics to design safer products. This integration strengthens decision-making and expands applications across healthcare, chemicals, and consumer industries.
- For instance, Quris Technologies Ltd., an Israeli pharmaceutical AI startup, which raised significant funding to advance AI-driven predictive toxicology for drug safety assessments.
Shift Toward Personalized and Precision Medicine
The non animal alternative testing market is influenced by growing emphasis on precision medicine and tailored healthcare solutions. Alternative testing models offer patient-specific insights, using stem cells and genetic profiling for accurate disease modeling. It supports pharmaceutical companies in developing therapies aligned with individual biological responses. Personalized toxicology studies also reduce clinical trial risks. Healthcare providers adopt these approaches to improve treatment safety. This trend aligns with industry goals for improved outcomes and reduced reliance on animal experiments.
Expansion of Collaborations and Global Standards
Collaborations across academia, government, and industry are shaping the non animal alternative testing market. Stakeholders work together to create global standards, validate alternative methods, and support regulatory acceptance. It ensures consistent results and accelerates market adoption. International organizations push for harmonized frameworks that enable cross-border compliance. Funding programs and joint research initiatives strengthen innovation. This growing network of partnerships establishes a unified ecosystem that promotes reliability, scalability, and widespread acceptance of non-animal testing technologies.
Market Challenges Analysis
High Development Costs and Limited Validation
The non animal alternative testing market faces significant challenges related to the high cost of developing and validating new technologies. Advanced models such as organ-on-chip and 3D tissue cultures require extensive research investment, which limits adoption by smaller companies. It often takes years to gain regulatory approval for these methods, slowing market expansion. The absence of universally accepted validation standards creates uncertainty for stakeholders. Limited availability of skilled professionals further restricts efficient deployment. These financial and technical barriers continue to hinder large-scale adoption across industries.
Regulatory Barriers and Slow Adoption in Emerging Markets
The non animal alternative testing market also struggles with uneven regulatory frameworks across regions. While Europe and North America lead adoption, many emerging economies still lack strong policies supporting non-animal testing. It creates inconsistent acceptance of results, limiting international harmonization. Industries in cost-sensitive markets hesitate to transition due to perceived risks and infrastructure gaps. Regulatory delays in approving alternative methods reduce confidence among companies. This lack of global uniformity hampers innovation diffusion and slows the industry’s overall growth trajectory.
Market Opportunities
Growing Demand for Cruelty-Free and Sustainable Products
The non animal alternative testing market holds strong opportunities due to rising consumer demand for cruelty-free and sustainable products. Ethical concerns continue to influence purchasing decisions across cosmetics, personal care, and pharmaceuticals. It enables companies to differentiate their brands by adopting transparent and humane testing practices. Expanding awareness of environmental impact also drives preference for sustainable solutions. This shift presents opportunities for businesses to expand into new customer segments. Companies that invest early in validated alternatives can secure long-term competitive advantages in global markets.
Expansion into Emerging Economies and Healthcare Applications
The non animal alternative testing market is positioned to benefit from growing adoption in emerging economies and advanced healthcare research. Governments in Asia-Pacific and Latin America are strengthening policies to encourage non-animal methods, opening new business avenues. It supports opportunities in drug discovery, regenerative medicine, and precision healthcare where accuracy is critical. Rising investments in biotechnology and academic research further accelerate acceptance. Companies that form partnerships with local institutions can gain access to untapped markets. These opportunities create pathways for broader global adoption and revenue growth.
Market Segmentation Analysis:
By Product
Organ-on-chips dominate the non animal alternative testing market with around 38% share in 2024, driven by their ability to closely replicate human organ functions and provide accurate disease modeling. Cell lines hold nearly 34% share, supported by their established use in drug screening and toxicology. Tissue lines account for about 28% share, gaining traction in regenerative medicine and precision healthcare. Organ-on-chips lead growth due to rising pharmaceutical adoption and regulatory acceptance for advanced preclinical testing.
- For instance, Emulate Inc. launched its Brain-Chip model in 2023 to study neuroinflammation and blood–brain barrier permeability, enabling researchers to evaluate neurological drug candidates without relying on animal experiments.
By Method
Cellular assays lead the non animal alternative testing market with an estimated 36% share in 2024, attributed to their broad application in drug discovery, toxicity assessment, and biomedical research. Biochemical assays follow with 28% share, widely used for enzyme activity and molecular interaction studies. Ex vivo testing accounts for about 20%, while computer modelling represents 16%, growing steadily with AI integration. Cellular assays remain dominant due to cost efficiency, scalability, and strong industry adoption.
- For instance, Thermo Fisher Scientific’s Pierce Biochemical Assays are routinely applied to measure enzyme kinetics and protein–ligand binding in pharmaceutical pipelines.
By Technology
Cell culture technology holds the largest share of the non animal alternative testing market at 40% in 2024, supported by its reliability and widespread use in research and clinical applications. High throughput technology captures 27% share, driven by automation and rapid screening capabilities. Omics technology represents 19%, expanding due to its role in genomics and proteomics studies. Molecular imaging technology accounts for 14%, primarily used in visualization and diagnostics. Cell culture technology remains the key driver, enabling innovation across multiple industries.
Segments:
Based on Product
- Organ-on-chips
- Cell lines
- Tissue lines
Based on Method
- Ex vivo testing
- Computer modelling
- Cellular assay
- Biochemical assay
Based on Technology
- Cell culture technology
- High throughput technology
- Molecular imaging technology
- Omics technology
Based on Application
- Infectious diseases
- Immunological diseases
- Oncology
- Cardiovascular diseases
- Diabetes
- Genetic diseases
- Neurological diseases
Based on End Use
- Pharmaceutical companies
- Biotechnological companies
- Research institutes and academics
- CROs
- Other End Use
Based on the Geography:
- North America
- U.S.
- Canada
- Mexico
- Europe
- Germany
- France
- U.K.
- Italy
- Spain
- Rest of Europe
- Asia Pacific
- China
- Japan
- India
- South Korea
- South-east Asia
- Rest of Asia Pacific
- Latin America
- Brazil
- Argentina
- Rest of Latin America
- Middle East & Africa
- GCC Countries
- South Africa
- Rest of the Middle East and Africa
Regional Analysis
North America
North America leads the non animal alternative testing market with 37% share in 2024, driven by strong regulatory enforcement, advanced research infrastructure, and rising ethical awareness. It benefits from government initiatives promoting alternatives to animal use, especially in pharmaceuticals and cosmetics. Major biotechnology hubs in the United States support rapid adoption of organ-on-chip systems and AI-powered toxicology tools. Growing collaborations between research institutes and private companies strengthen market penetration. Increasing consumer demand for cruelty-free products also pushes industries to adopt validated non-animal methods at scale.
Europe
Europe holds 31% share of the non animal alternative testing market, supported by the region’s strict regulatory framework under REACH and the EU Cosmetics Directive. It emphasizes the replacement of animal testing through government-backed funding programs and harmonized guidelines. Leading countries such as Germany, France, and the United Kingdom drive adoption across healthcare and personal care industries. The presence of established research organizations enhances innovation in 3D tissue models and in-vitro assays. Rising public demand for sustainable solutions further ensures consistent market growth.
Asia-Pacific
Asia-Pacific accounts for 22% share of the non animal alternative testing market, fueled by growing investments in biotechnology and expanding healthcare infrastructure. Countries such as China, Japan, and India are implementing supportive regulations to reduce animal testing in pharmaceuticals and consumer goods. It benefits from a large pool of research talent and increasing collaborations with global organizations. Rising demand for cruelty-free cosmetics across urban populations also boosts adoption. Expanding R&D expenditure and government initiatives are positioning the region for strong long-term growth.
Latin America
Latin America captures 6% share of the non animal alternative testing market, with growth supported by improving regulatory standards and expanding pharmaceutical manufacturing. Brazil and Mexico lead regional adoption, focusing on ethical practices and compliance with international testing standards. It gains momentum through partnerships between universities and industry stakeholders. Multinational companies are introducing validated non-animal methods to meet consumer expectations. Growing demand for cruelty-free personal care products further strengthens opportunities in the regional market.
Middle East & Africa
The Middle East & Africa represent 4% share of the non animal alternative testing market, with growth driven by early-stage adoption and increasing regulatory awareness. South Africa and Gulf countries are gradually shifting toward alternative methods, influenced by global best practices. It faces infrastructure and funding challenges, but rising international collaborations support gradual progress. Expanding pharmaceutical imports and consumer preference for ethical products encourage investment. Efforts to build local research capabilities are expected to support long-term regional development.
Key Player Analysis
- TissUse
- CN Bio Innovations
- Emulate
- Thermo Fisher Scientific
- Hesperos
- Lonza Group
- BICO GROUP
- VITROCELL Systems
- AlveoliX
- MIMETAS
- InSphero
- Merck
Competitive Analysis
The non animal alternative testing market is highly competitive, shaped by innovation, regulatory alignment, and strategic collaborations. Key players include AlveoliX, BICO GROUP, CN Bio Innovations, Emulate, Hesperos, InSphero, Lonza Group, Merck, MIMETAS, Thermo Fisher Scientific, TissUse, and VITROCELL Systems. It focuses on developing advanced solutions such as organ-on-chip platforms, 3D tissue cultures, and AI-powered toxicology models to meet growing demand for reliable, ethical, and cost-effective testing. Leading companies invest in research partnerships with academic institutes and pharmaceutical firms to accelerate validation of technologies. Market leaders expand portfolios through acquisitions, global distribution, and integration of high-throughput platforms to strengthen commercial presence. Companies compete by improving scalability, reproducibility, and accuracy of models to secure regulatory acceptance. It benefits from rising adoption in pharmaceuticals, biotechnology, and consumer goods industries, creating opportunities for both established firms and emerging innovators. Competitive strategies emphasize sustainability, reduced development time, and tailored solutions, positioning these players to capture strong growth across global markets.
Recent Developments
- On February 19, 2025, organ-on-chip specialist Dynamic42, in collaboration with ESQlabs, Bayer’s Consumer Health Division, and Jena University Hospital, introduced an innovative three‑organ platform using organ-on-chip and computational software to reduce animal testing.
- On April 10, 2025, the U.S. Food and Drug Administration began a pilot initiative allowing select developers of monoclonal antibody therapies to use primarily non-animal-based testing strategies, including AI models and human‑relevant methods.
- On April 14, 2025, Certara launched its Non‑Animal Navigator™ solution. Equipped with AI‑enabled biosimulation and regulatory guidance, it helps drug developers reduce reliance on animal testing.
- On June 10, 2025, Emulate introduced the AVA™ Emulation System, a high‑throughput, self‑contained Organ‑Chip platform that cultures, incubates, and images up to 96 samples per run. It slashes consumable costs by four‑fold and cuts lab labor by half.
Report Coverage
The research report offers an in-depth analysis based on Product, Method, Technology, Application, End-Use and Geography. It details leading market players, providing an overview of their business, product offerings, investments, revenue streams, and key applications. Additionally, the report includes insights into the competitive environment, SWOT analysis, current market trends, as well as the primary drivers and constraints. Furthermore, it discusses various factors that have driven market expansion in recent years. The report also explores market dynamics, regulatory scenarios, and technological advancements that are shaping the industry. It assesses the impact of external factors and global economic changes on market growth. Lastly, it provides strategic recommendations for new entrants and established companies to navigate the complexities of the market.
Future Outlook
- Regulatory authorities will expand acceptance of validated non-animal methods across cosmetics, pharmaceuticals, and chemicals.
- Organ-on-chip platforms will gain stronger adoption due to accurate human physiology modeling and improved reliability.
- Artificial intelligence integration will enhance predictive toxicology and reduce timelines for drug discovery and safety testing.
- Personalized medicine applications will expand with patient-specific cell models improving treatment safety and clinical outcomes.
- Research collaborations between industry, academia, and regulators will accelerate validation and global standardization of methods.
- Investment in biotechnology infrastructure will increase adoption of advanced in-vitro and 3D tissue culture technologies.
- Consumer demand for cruelty-free and sustainable products will drive faster replacement of traditional animal testing practices.
- Emerging economies will adopt non-animal methods rapidly with supportive policies and expanding healthcare research ecosystems.
- High-throughput screening technologies will strengthen scalability, enabling faster testing of chemicals, drugs, and consumer products.
- Global players will diversify portfolios through acquisitions and partnerships to capture opportunities in expanding markets.
Request a Free Sample
Fill in your details and we'll send you a free sample report.
- Sample data tables & charts
- Research methodology
Market Dynamics
Regulatory Push and Ethical Concerns
Stringent regulations in regions like Europe, North America, and Asia are restricting animal use in research, especially in cosmetics and pharmaceuticals, compelling companies to adopt non-animal alternative testing methods to ensure compliance and enhance brand credibility.
Technological Advancements and Innovation
Continuous innovation in in-vitro models, organ-on-chip systems, and AI-powered toxicology tools is improving the accuracy, speed, and cost-effectiveness of testing, making non-animal alternatives more attractive and reliable for industry adoption.
Rising Industry Demand and Consumer Awareness
Growing consumer preference for cruelty-free and sustainable products is driving companies in cosmetics, healthcare, and chemicals to shift toward non-animal testing, leveraging these methods to capture environmentally conscious and ethically driven market segments.
Supportive Research Ecosystem and Funding
Expanding collaborations between academia, regulatory bodies, and industry, along with increased funding for research and validation of alternative methods, are accelerating the development and acceptance of non-animal testing technologies.
Expansion into Emerging Economies
Supportive policies, rising investments in biotechnology, and expanding healthcare infrastructure in emerging markets such as Asia-Pacific and Latin America are opening new avenues for the adoption and growth of non-animal alternative testing.
Need a Custom Version of This Report?
Tailor the scope, geography, or segments to your exact requirements.
- Custom geography or segment scope
- Direct access to our analyst team
Frequently Asked Questions
What is the current market size for non animal alternative testing market, and what is its projected size in 2032?
At what Compound Annual Growth Rate is the non animal alternative testing market projected to grow between 2025 and 2032?
Which non animal alternative testing market segment held the largest share in 2024?
What are the primary factors fueling the growth of the non animal alternative testing market?
Who are the leading companies in the non animal alternative testing market?
Which region commanded the largest share of the non animal alternative testing market in 2024?
Table of Content
Chapter 1 Market Segmentation
- 1.1 Segmentation Framework
- 1.1.1 Product and Service Classification
- 1.1.2 Application and End-Use Classification
- 1.1.3 Technology and Solution Classification
- 1.1.4 Customer and Distribution Channel Classification
- 1.1.5 Geographic Segmentation
- 1.1.6 Market Segment Definitions and Boundaries
- 1.2 By Method
- 1.2.1 Cellular assay
- 1.2.2 Biochemical assay
- 1.2.3 Ex vivo testing
- 1.2.4 Computer modelling
- 1.3 By Product
- 1.3.1 Organ-on-chips
- 1.3.2 Cell lines
- 1.3.3 Tissue lines
- 1.4 By Technology
- 1.4.1 Cell culture technology
- 1.4.2 High throughput technology
- 1.4.3 Omics technology
- 1.4.4 Molecular imaging technology
- 1.5 By Application
- 1.5.1 Oncology
- 1.5.2 Infectious diseases
- 1.5.3 Immunological diseases
- 1.5.4 Cardiovascular diseases
- 1.5.5 Diabetes
- 1.5.6 Genetic diseases
- 1.5.7 Neurological diseases
Chapter 2 Introduction
- 2.1 Report Objectives and Scope
- 2.2 Product Definition and Industry Terminology
- 2.3 Market Inclusions and Exclusions
- 2.4 Research Process
- 2.4.1 Primary Research and Expert Interviews
- 2.4.2 Secondary Research and Source Review
- 2.4.3 Top-Down and Bottom-Up Estimation
- 2.4.4 Data Triangulation and Verification
- 2.5 Market Size Measurement Basis
- 2.5.1 2024: USD 2,020 million → 2032: USD 4330 million
- 2.6 Historical and Forecast Reference Periods
- 2.6.1 Base Year: 2024
- 2.6.2 Forecast Period: 2024-2032
- 2.7 Research Assumptions and Limitations
Chapter 3 Executive Summary
- 3.1 Market Snapshot and Key Findings
- 3.2 Base-Year Market Size, 2024
- 3.3 Forecast Market Size, 2032
- 3.4 Revenue and Volume Growth Outlook
- 3.5 Key Demand and Supply Indicators
- 3.6 Leading Market Segments
- 3.7 Fastest-Growing Market Opportunities
- 3.8 Regional Performance Highlights
- 3.9 Technology and Industry Transformation
- 3.10 Competitive Landscape Summary
- 3.11 Analyst View and Strategic Implications
Chapter 4 Global Non-Animal Alternative Testing Market Trends and Developments
- 4.1 Historical Industry Development
- 4.2 Recent Market Trends and Developments
- 4.3 Demand and Customer Behavior Trends
- 4.4 Technology and Product Innovation
- 4.5 Artificial Intelligence, Automation and Digitalization
- 4.6 Local Manufacturing and Supply Chain Realignment
- 4.7 Industry Partnerships, Mergers and Acquisitions
- 4.8 Sustainability and Circular Economy Developments
- 4.9 Government and Private Sector Investment Trends
- 4.10 Emerging Business Models and Commercialization
- 4.11 Industry Developments and Announcements
Chapter 5 Global Non-Animal Alternative Testing Market Production, Supply and Demand Analysis
- 5.1 Demand Trend and Consumption Analysis
- 5.2 Demand Forecast, 2024-2032
- 5.3 Production and Output Trend
- 5.4 Production and Output Forecast, 2024-2032
- 5.5 Installed Capacity and Capacity Utilization
- 5.6 Company-Wise Production Plants and Statistics
- 5.6.1 Installed Production Capacity
- 5.6.2 Actual Production
- 5.6.3 Planned Capacity and Expansion Targets
- 5.7 Supply Chain Structure and Procurement Trends
- 5.8 Supply-Demand Gap and Bottlenecks
- 5.9 Import Dependence and Sourcing Structure
- 5.10 Contract Manufacturing and Outsourcing
- 5.11 Regional Supply and Demand Concentration
Chapter 6 Global Non-Animal Alternative Testing Market Pricing Analysis
- 6.1 Pricing Structure and Measurement
- 6.2 Historical Pricing Trends
- 6.3 Pricing Outlook, 2024-2032
- 6.4 Average Selling Price and Unit Economics
- 6.5 Pricing by Product and Market Segment
- 6.6 Geographic Pricing Differences
- 6.7 Key Input, Energy, Labor and Logistics Costs
- 6.8 Contract Pricing and Purchasing Models
- 6.9 Pricing Sensitivity and Competitive Positioning
- 6.10 Price, Margin and Profitability Implications
Chapter 7 Global Non-Animal Alternative Testing Market Dynamics
- 7.1 Market Growth Drivers
- 7.1.1 Demand-Side Drivers
- 7.1.2 Technology and Innovation Drivers
- 7.1.3 Infrastructure and Investment Drivers
- 7.1.4 Regulatory and Policy Drivers
- 7.2 Market Restraints
- 7.2.1 Cost and Affordability Constraints
- 7.2.2 Technology and Adoption Barriers
- 7.2.3 Supply Chain and Operational Constraints
- 7.3 Market Challenges
- 7.3.1 Competitive Pressure and Margin Erosion
- 7.3.2 Skills, Infrastructure and Implementation Gaps
- 7.4 Emerging Market Opportunities
- 7.5 Market Dynamics Impact and Time-Horizon Assessment
Chapter 8 Global Non-Animal Alternative Testing Value Chain Analysis
- 8.1 Industry Value Chain Overview
- 8.2 Upstream Suppliers and Critical Inputs
- 8.3 Technology and Component Providers
- 8.4 Manufacturing or Service Delivery
- 8.5 Distribution, Channel Partners and Integrators
- 8.6 Downstream Applications and End Users
- 8.7 Value Addition and Profit Pools
- 8.8 Vertical Integration and Outsourcing
- 8.9 Supplier Concentration and Risk
- 8.10 Supply Chain Localization and Resilience
Chapter 9 Global Non-Animal Alternative Testing Market Regulations and Policies
- 9.1 Relevant Laws, Standards and Compliance Frameworks
- 9.2 Product, Service, Safety and Quality Requirements
- 9.3 Government Policies, Incentives and Subsidies
- 9.4 Imports, Exports and Trade Barriers
- 9.5 Public Procurement and Local Content Requirements
- 9.6 Environmental and Sustainability Compliance
- 9.7 Upcoming Policy Changes and Market Implications
Chapter 10 Global Non-Animal Alternative Testing Market Hotspots and Opportunities
- 10.1 Market Opportunity Mapping and Growth Hotspots
- 10.2 High-Growth Applications and Customer Groups
- 10.3 Underserved Markets and White-Space Opportunities
- 10.4 Emerging Technology and Product Opportunities
- 10.5 New Capacity and Investment Hotspots
- 10.6 Market Entry and Expansion Opportunities
- 10.7 Distribution and Partnership Opportunities
- 10.8 Near-Term and Long-Term Commercial Potential
- 10.9 Opportunity Attractiveness and Execution Risks
Chapter 11 Global Non-Animal Alternative Testing Market Outlook, 2024-2032
- 11.1 Market Size and Analysis
- 11.1.1 Revenue (Market Measurement: 2024: USD 2,020 million → 2032: USD 4330 million)
- 11.1.2 Market Volume and Quantity Sold
- 11.1.3 Historical Market Size
- 11.1.4 Base-Year Market Size, 2024
- 11.2 Market Forecast, 2024-2032
- 11.2.1 Revenue Forecast to 2032
- 11.2.2 Volume Forecast to 2032
- 11.2.3 CAGR and Year-on-Year Growth
- 11.2.4 Incremental Revenue Opportunity
- 11.3 Forecast Assumptions and Scenario Analysis
- 11.3.1 Base-Case Forecast
- 11.3.2 Optimistic and Conservative Scenarios
- 11.3.3 Technology, Pricing and Policy Sensitivities
- 11.4 Market Attractiveness and Growth Outlook
Chapter 12 Global Non-Animal Alternative Testing Market Segmentation and Outlook
- 12.1 Segmentation Summary and Market Shares, 2024
- 12.2 Largest and Fastest-Growing Segments
- 12.3 By Method - Market Size and Forecast, 2024-2032
- 12.3.1 Segment Definition and Scope
- 12.3.2 Historical Market Size
- 12.3.3 Revenue Forecast, 2024-2032
- 12.3.4 Volume Forecast, 2024-2032
- 12.3.5 Base-Year Market Share, 2024
- 12.3.6 Segment CAGR and Growth Drivers
- 12.3.7 Subsegment Market Size and Forecast
- 12.3.7.1 Cellular assay
- 12.3.7.2 Biochemical assay
- 12.3.7.3 Ex vivo testing
- 12.3.7.4 Computer modelling
- 12.3.8 Subsegment Pricing and Adoption Trends
- 12.3.9 Leading Suppliers and Competition
- 12.3.10 Regional Demand and Opportunities
- 12.4 By Product - Market Size and Forecast, 2024-2032
- 12.4.1 Segment Definition and Scope
- 12.4.2 Historical Market Size
- 12.4.3 Revenue Forecast, 2024-2032
- 12.4.4 Volume Forecast, 2024-2032
- 12.4.5 Base-Year Market Share, 2024
- 12.4.6 Segment CAGR and Growth Drivers
- 12.4.7 Subsegment Market Size and Forecast
- 12.4.7.1 Organ-on-chips
- 12.4.7.2 Cell lines
- 12.4.7.3 Tissue lines
- 12.4.8 Subsegment Pricing and Adoption Trends
- 12.4.9 Leading Suppliers and Competition
- 12.4.10 Regional Demand and Opportunities
- 12.5 By Technology - Market Size and Forecast, 2024-2032
- 12.5.1 Segment Definition and Scope
- 12.5.2 Historical Market Size
- 12.5.3 Revenue Forecast, 2024-2032
- 12.5.4 Volume Forecast, 2024-2032
- 12.5.5 Base-Year Market Share, 2024
- 12.5.6 Segment CAGR and Growth Drivers
- 12.5.7 Subsegment Market Size and Forecast
- 12.5.7.1 Cell culture technology
- 12.5.7.2 High throughput technology
- 12.5.7.3 Omics technology
- 12.5.7.4 Molecular imaging technology
- 12.5.8 Subsegment Pricing and Adoption Trends
- 12.5.9 Leading Suppliers and Competition
- 12.5.10 Regional Demand and Opportunities
- 12.6 By Application - Market Size and Forecast, 2024-2032
- 12.6.1 Segment Definition and Scope
- 12.6.2 Historical Market Size
- 12.6.3 Revenue Forecast, 2024-2032
- 12.6.4 Volume Forecast, 2024-2032
- 12.6.5 Base-Year Market Share, 2024
- 12.6.6 Segment CAGR and Growth Drivers
- 12.6.7 Subsegment Market Size and Forecast
- 12.6.7.1 Oncology
- 12.6.7.2 Infectious diseases
- 12.6.7.3 Immunological diseases
- 12.6.7.4 Cardiovascular diseases
- 12.6.7.5 Diabetes
- 12.6.7.6 Genetic diseases
- 12.6.7.7 Neurological diseases
- 12.6.8 Subsegment Pricing and Adoption Trends
- 12.6.9 Leading Suppliers and Competition
- 12.6.10 Regional Demand and Opportunities
- 12.7 Segment Growth Comparison
- 12.8 Segment Attractiveness and Priority Matrix
Chapter 13 Global Non-Animal Alternative Testing End-Use and Application Market Outlook
- 13.1 End-Use Industry and Customer Demand Structure
- 13.2 Leading Applications and Customer Groups
- 13.3 End-Use Market Size, Share and Forecast
- 13.4 Major End-Use Industry Deep Dives
- 13.4.1 Customer Requirements and Use Cases
- 13.4.2 Demand and Replacement Cycles
- 13.4.3 Technical and Regulatory Considerations
- 13.4.4 Purchasing and Procurement Models
- 13.4.5 Leading Vendors and Distribution Channels
- 13.4.6 Forecast and Commercial Opportunities
- 13.5 Emerging Applications and Cross-Segment Demand
- 13.6 End-Use Industry Investment Priorities
Chapter 14 Global Non-Animal Alternative Testing Geographic Market Outlook, 2024-2032
- 14.1 Regional Market Size and Share, 2024
- 14.2 Regional Market Forecast, 2024-2032
- 14.3 Regional Pricing, Production and Demand Differences
- 14.4 North America
- 14.4.1 United States
- 14.4.2 Canada
- 14.4.3 Mexico
- 14.5 Europe
- 14.5.1 Germany
- 14.5.2 France
- 14.5.3 Italy
- 14.5.4 United Kingdom
- 14.5.5 Spain
- 14.5.6 Poland
- 14.5.7 Russia
- 14.5.8 Netherlands
- 14.5.9 Belgium
- 14.5.10 Sweden
- 14.5.11 Denmark
- 14.5.12 Norway
- 14.5.13 Rest of Europe
- 14.6 Asia Pacific
- 14.6.1 China
- 14.6.2 India
- 14.6.3 Japan
- 14.6.4 South Korea
- 14.6.5 Thailand
- 14.6.6 Indonesia
- 14.6.7 Vietnam
- 14.6.8 Malaysia
- 14.6.9 Australia
- 14.6.10 Rest of Asia Pacific
- 14.7 Latin America
- 14.7.1 Brazil
- 14.7.2 Argentina
- 14.7.3 Colombia
- 14.7.4 Chile
- 14.7.5 Rest of Latin America
- 14.8 Middle East
- 14.8.1 Saudi Arabia
- 14.8.2 United Arab Emirates
- 14.8.3 Turkey
- 14.8.4 Israel
- 14.8.5 Iran
- 14.8.6 Rest of the Middle East
- 14.9 Africa
- 14.9.1 South Africa
- 14.9.2 Egypt
- 14.9.3 Nigeria
- 14.9.4 Morocco
- 14.9.5 Rest of Africa
- 14.10 Regional Investment, Policy and Supply Chain Differences
- 14.11 Regional Competitive Landscape
- 14.12 Geographic Growth Hotspots
Chapter 15 Global Non-Animal Alternative Testing Technology, Innovation and Sustainability Outlook
- 15.1 Technology Landscape and Maturity
- 15.2 Product, Process and Service Innovation
- 15.3 AI, Automation and Digital Tools in the Industry
- 15.4 Technology Adoption and Performance Benchmarking
- 15.5 Innovation Pipeline and R&D Investment
- 15.6 Patent and Intellectual Property Trends
- 15.7 Energy Efficiency and Resource Management
- 15.8 Sustainability, Recycling and Circularity
- 15.9 Technology Roadmap, 2024-2032
- 15.10 Risks of Obsolescence and Technology Substitution
Chapter 16 Global Non-Animal Alternative Testing Market Key Strategic Imperatives
- 16.1 Growth and Market Entry Priorities
- 16.2 High-Return Products and Segments
- 16.3 Pricing, Profitability and Cost Optimization
- 16.4 Technology Investment and Product Differentiation
- 16.5 Supply Chain Localization and Resilience
- 16.6 Distribution and Customer Acquisition
- 16.7 Partnership, Acquisition and Capacity Strategy
- 16.8 Regional Expansion Priorities
- 16.9 Short-, Medium- and Long-Term Actions
Chapter 17 Competition Outlook
- 17.1 Industry Competition Characteristics
- 17.2 Market Structure and Concentration
- 17.3 Market Share and Competitive Positioning, 2024
- 17.4 Company-Wise Revenue and Product Benchmarking
- 17.5 Production and Service Capacity Benchmarking
- 17.6 Technology, Pricing and Differentiation
- 17.7 Regional Footprint and Distribution Strength
- 17.8 Mergers, Acquisitions and Strategic Alliances
- 17.9 New Entrants and Competitive Threats
- 17.10 Porter's Five Forces and Industry Attractiveness
- 17.11 Competitive Outlook, 2024-2032
Chapter 18 Company Profiles
- 18.1 Company Coverage and Selection Criteria
- 18.2 Emulate
- 18.2.1 Business Description
- 18.2.2 Company Ownership and Geographic Presence
- 18.2.3 Product and Service Portfolio
- 18.2.4 Manufacturing and Operating Footprint
- 18.2.5 Production Capacity and Expansion Plans
- 18.2.6 Financial Performance and Investment
- 18.2.7 Market Share and Competitive Position
- 18.2.8 Technology and Innovation Capabilities
- 18.2.9 Strategic Alliances or Partnerships
- 18.2.10 Recent Developments
- 18.2.11 Growth Strategy and Outlook
- 18.3 Thermo Fisher Scientific
- 18.4 Lonza Group
- 18.5 Merck
- 18.6 BICO GROUP
- 18.7 TissUse
- 18.8 CN Bio Innovations
- 18.9 MIMETAS
- 18.10 InSphero
- 18.11 VITROCELL Systems
- 18.12 Other Relevant Market Participants
Note: Every listed company is profiled on the structure shown under the first company. The company list is preliminary and may change based on research findings, market developments, data availability and client requirements.
Chapter 19 Disclaimer
- 19.1 Research and Forecast Disclaimer
- 19.2 Data Source and Estimation Limitations
Note: The depth of individual sections depends on data availability for this market. Volume, capacity, trade and other unit-based metrics are included where applicable.