
Earbuds, headphones and speakers for streaming on the go
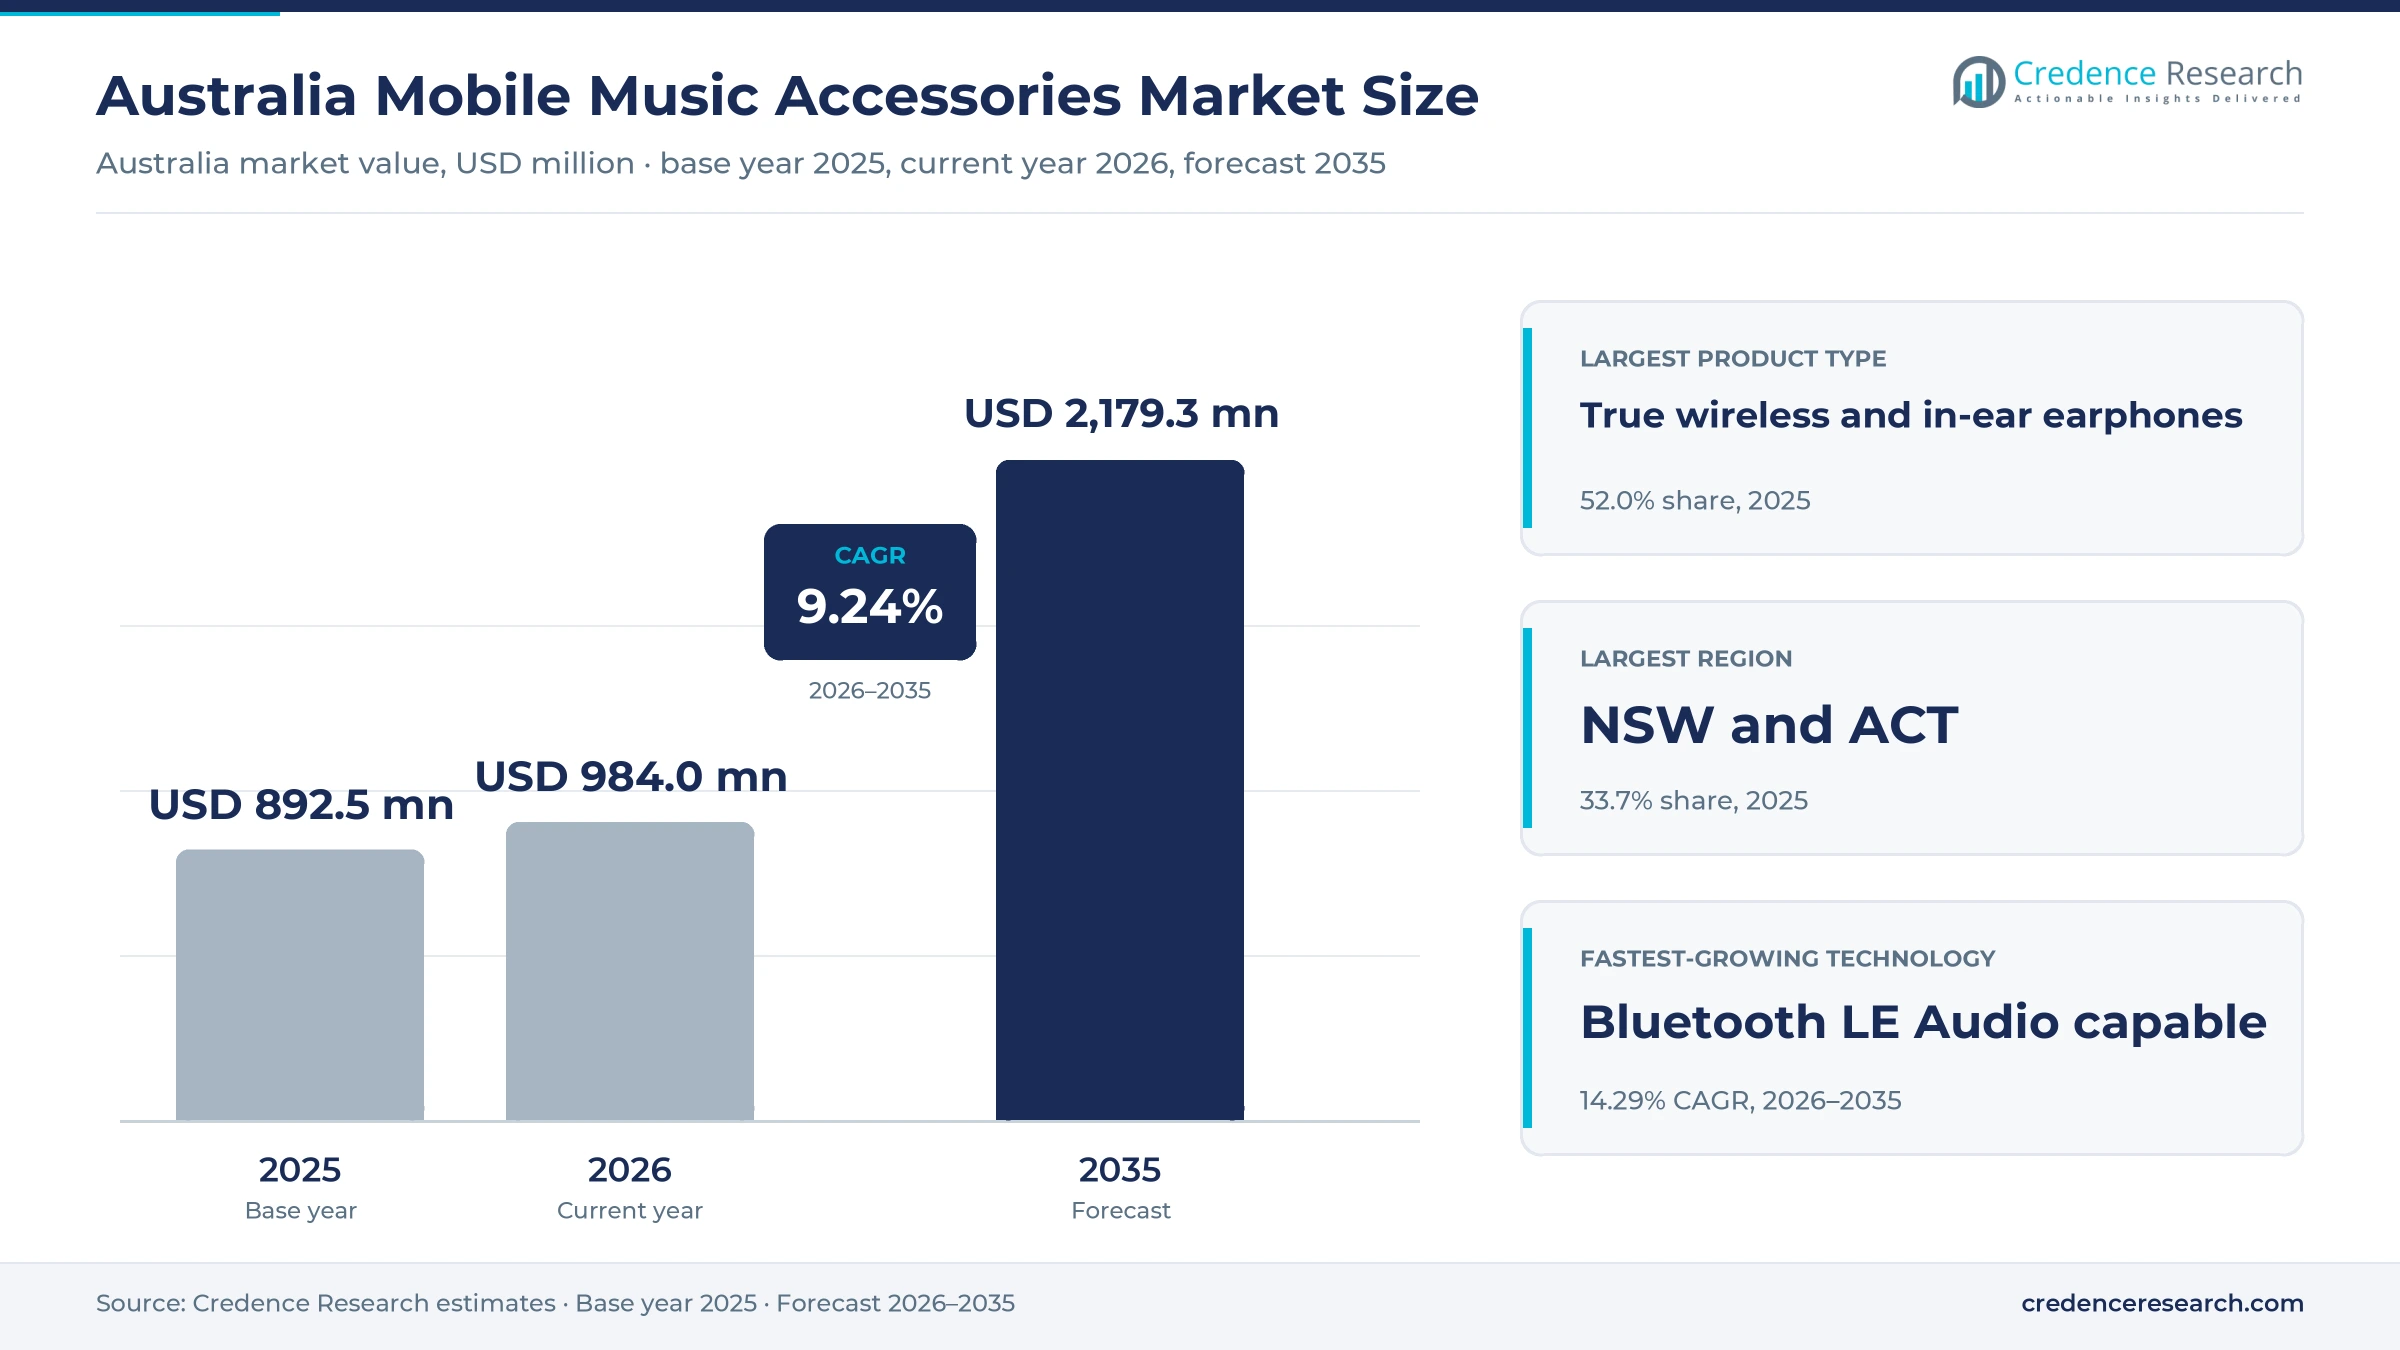
The Australia mobile music accessories market was valued at USD 892.5 million in 2025 and is projected to increase from USD 984.0 million in 2026 to USD 2.18 billion by 2035, registering a CAGR of 9.24% during 2026–2035. Demand comes from Australians who stream songs, podcasts and video on smartphones during commutes, workouts and travel, and who replace earbuds and headphones every few years as batteries age and new features arrive. New South Wales and Australian Capital Territory held the largest regional share, 33.7% in 2025, because Sydney and Canberra combine the largest population with dense electronics retail. Western Australia and South Australia is the fastest-growing region at 9.49% a year, as Western Australia adds residents faster than any other state. In turn, the product mix is changing, because new earbuds add heart rate sensing, hearing support and Bluetooth broadcast audio, while online channels widen access to entry and mid-market models.
Which personal audio products does the national estimate count?
Spending on true wireless and in-ear earphones, over-ear and on-ear headphones, and portable Bluetooth speakers bought by Australian households for listening from phones and tablets forms the base of this estimate. It counts the retail value of new units sold through electronics chains, online marketplaces, brand stores and other retailers across all price tiers.
The estimate excludes professional studio monitors, home theater and smart speakers that stay at home, hearing aids sold through clinics, and used or refurbished units. The value chain runs from overseas factories through brand subsidiaries and national distributors to retailers, who sell to buyers in stores and online.
Australia Mobile Music Accessories Market Insights
- The Australia mobile music accessories market was valued at USD 892.5 million in 2025 and is projected to reach USD 2.18 billion by 2035, registering a CAGR of 9.24% during 2026–2035.
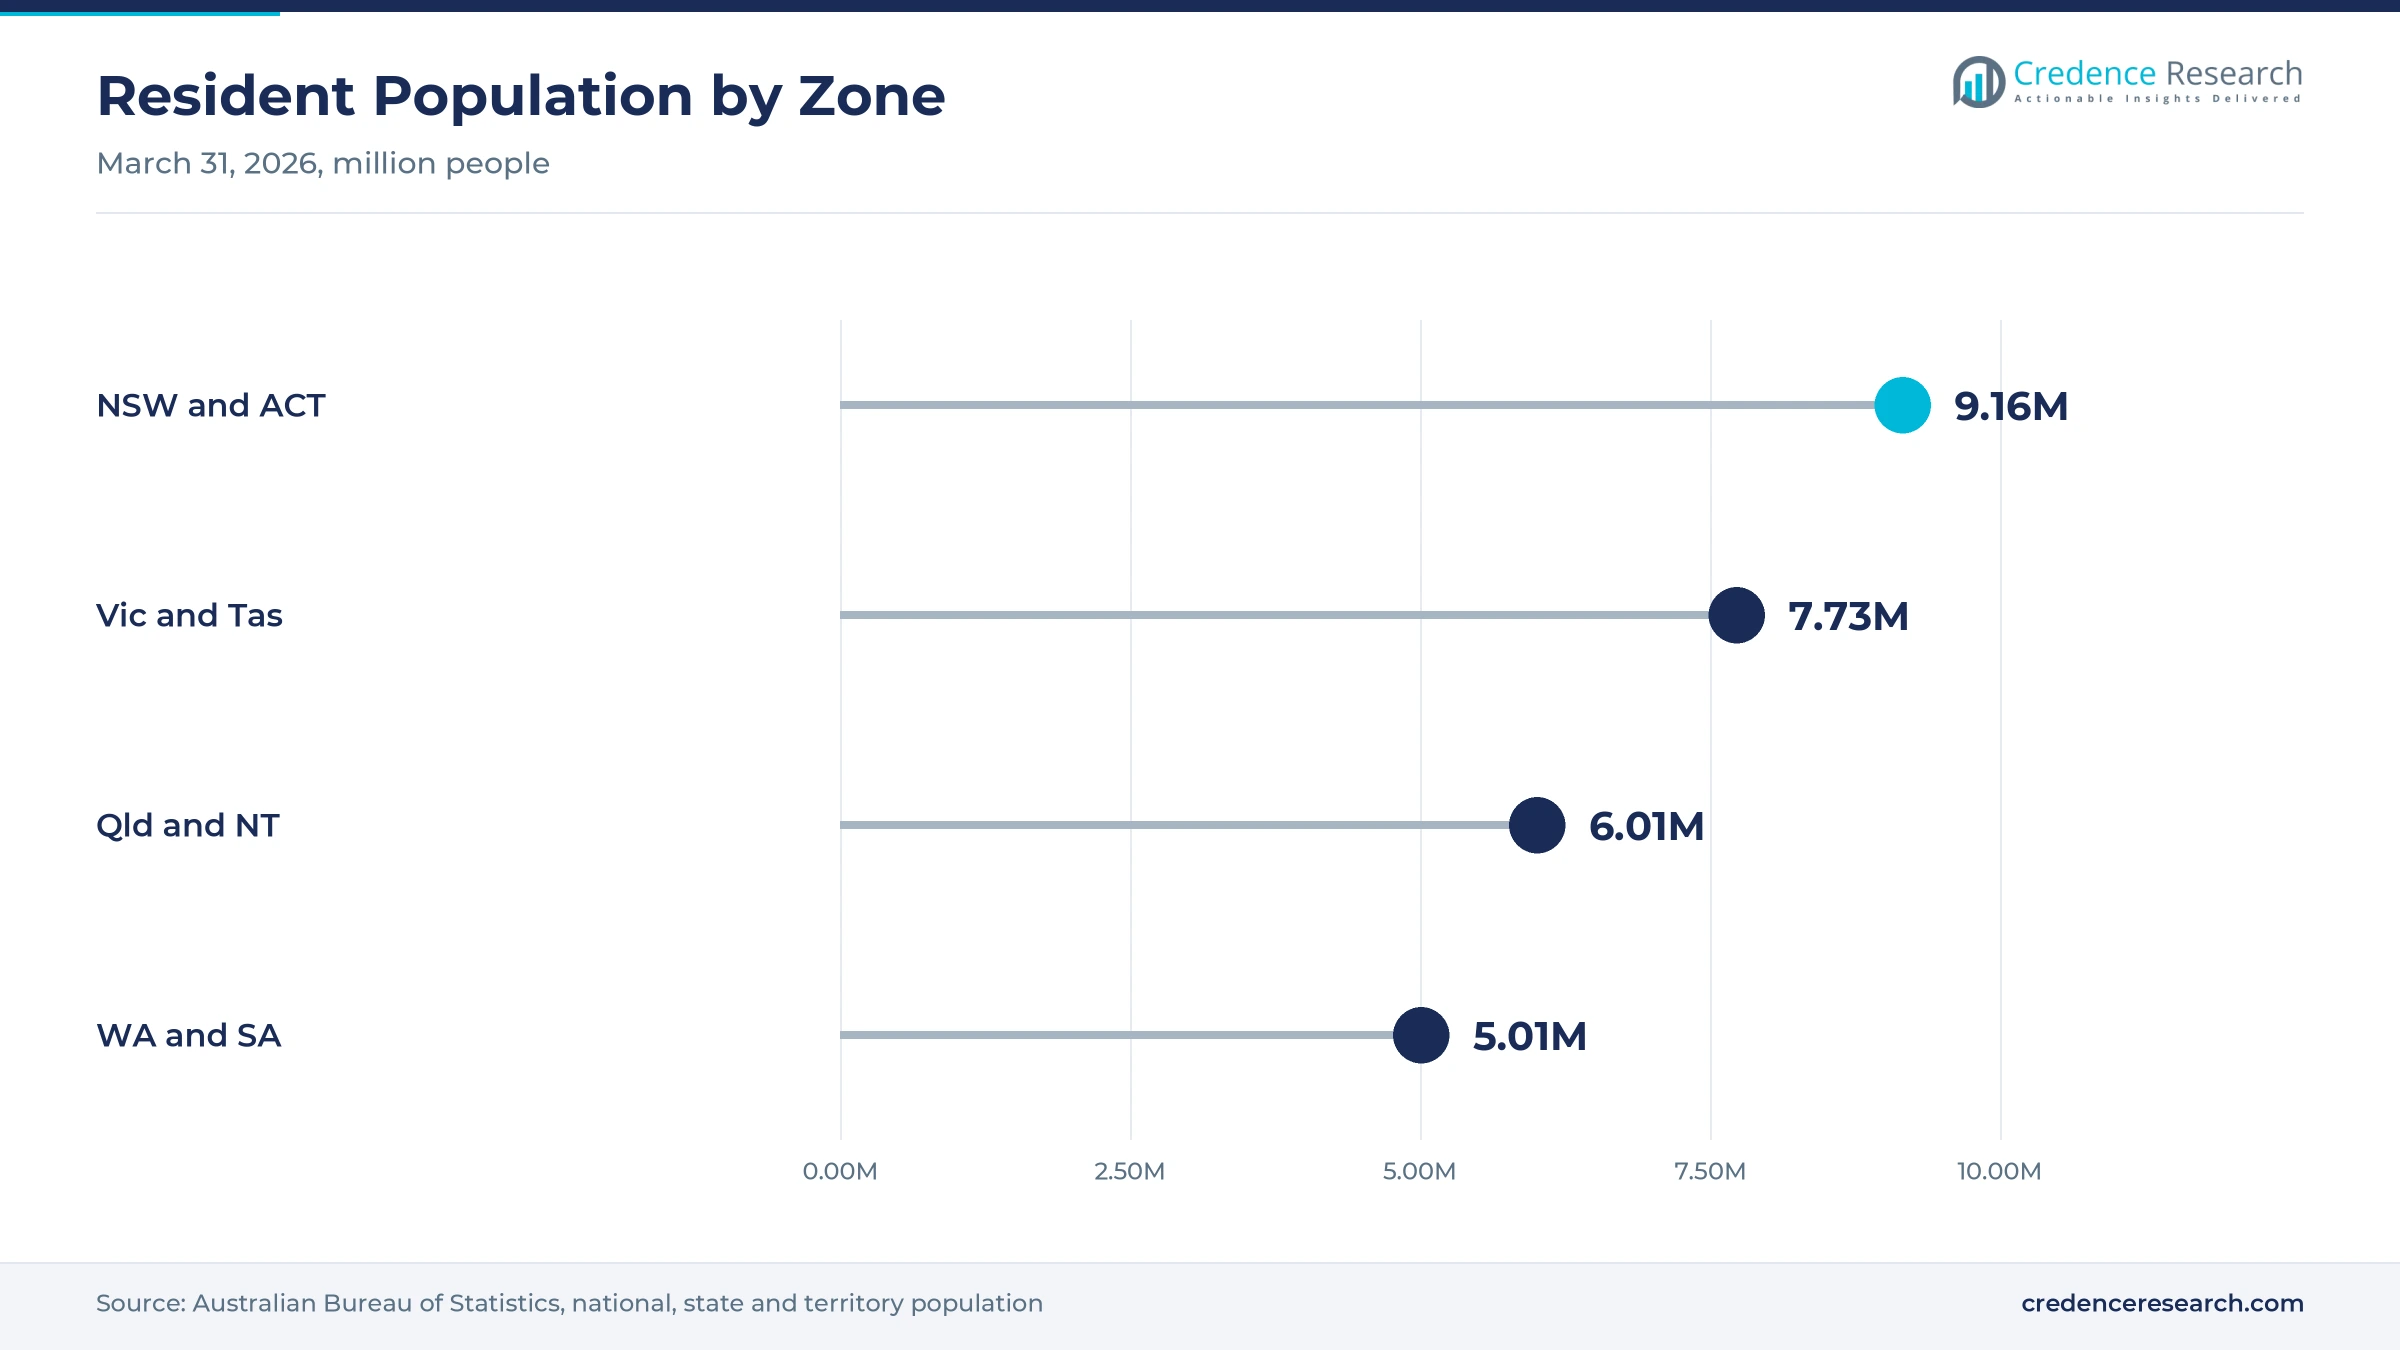
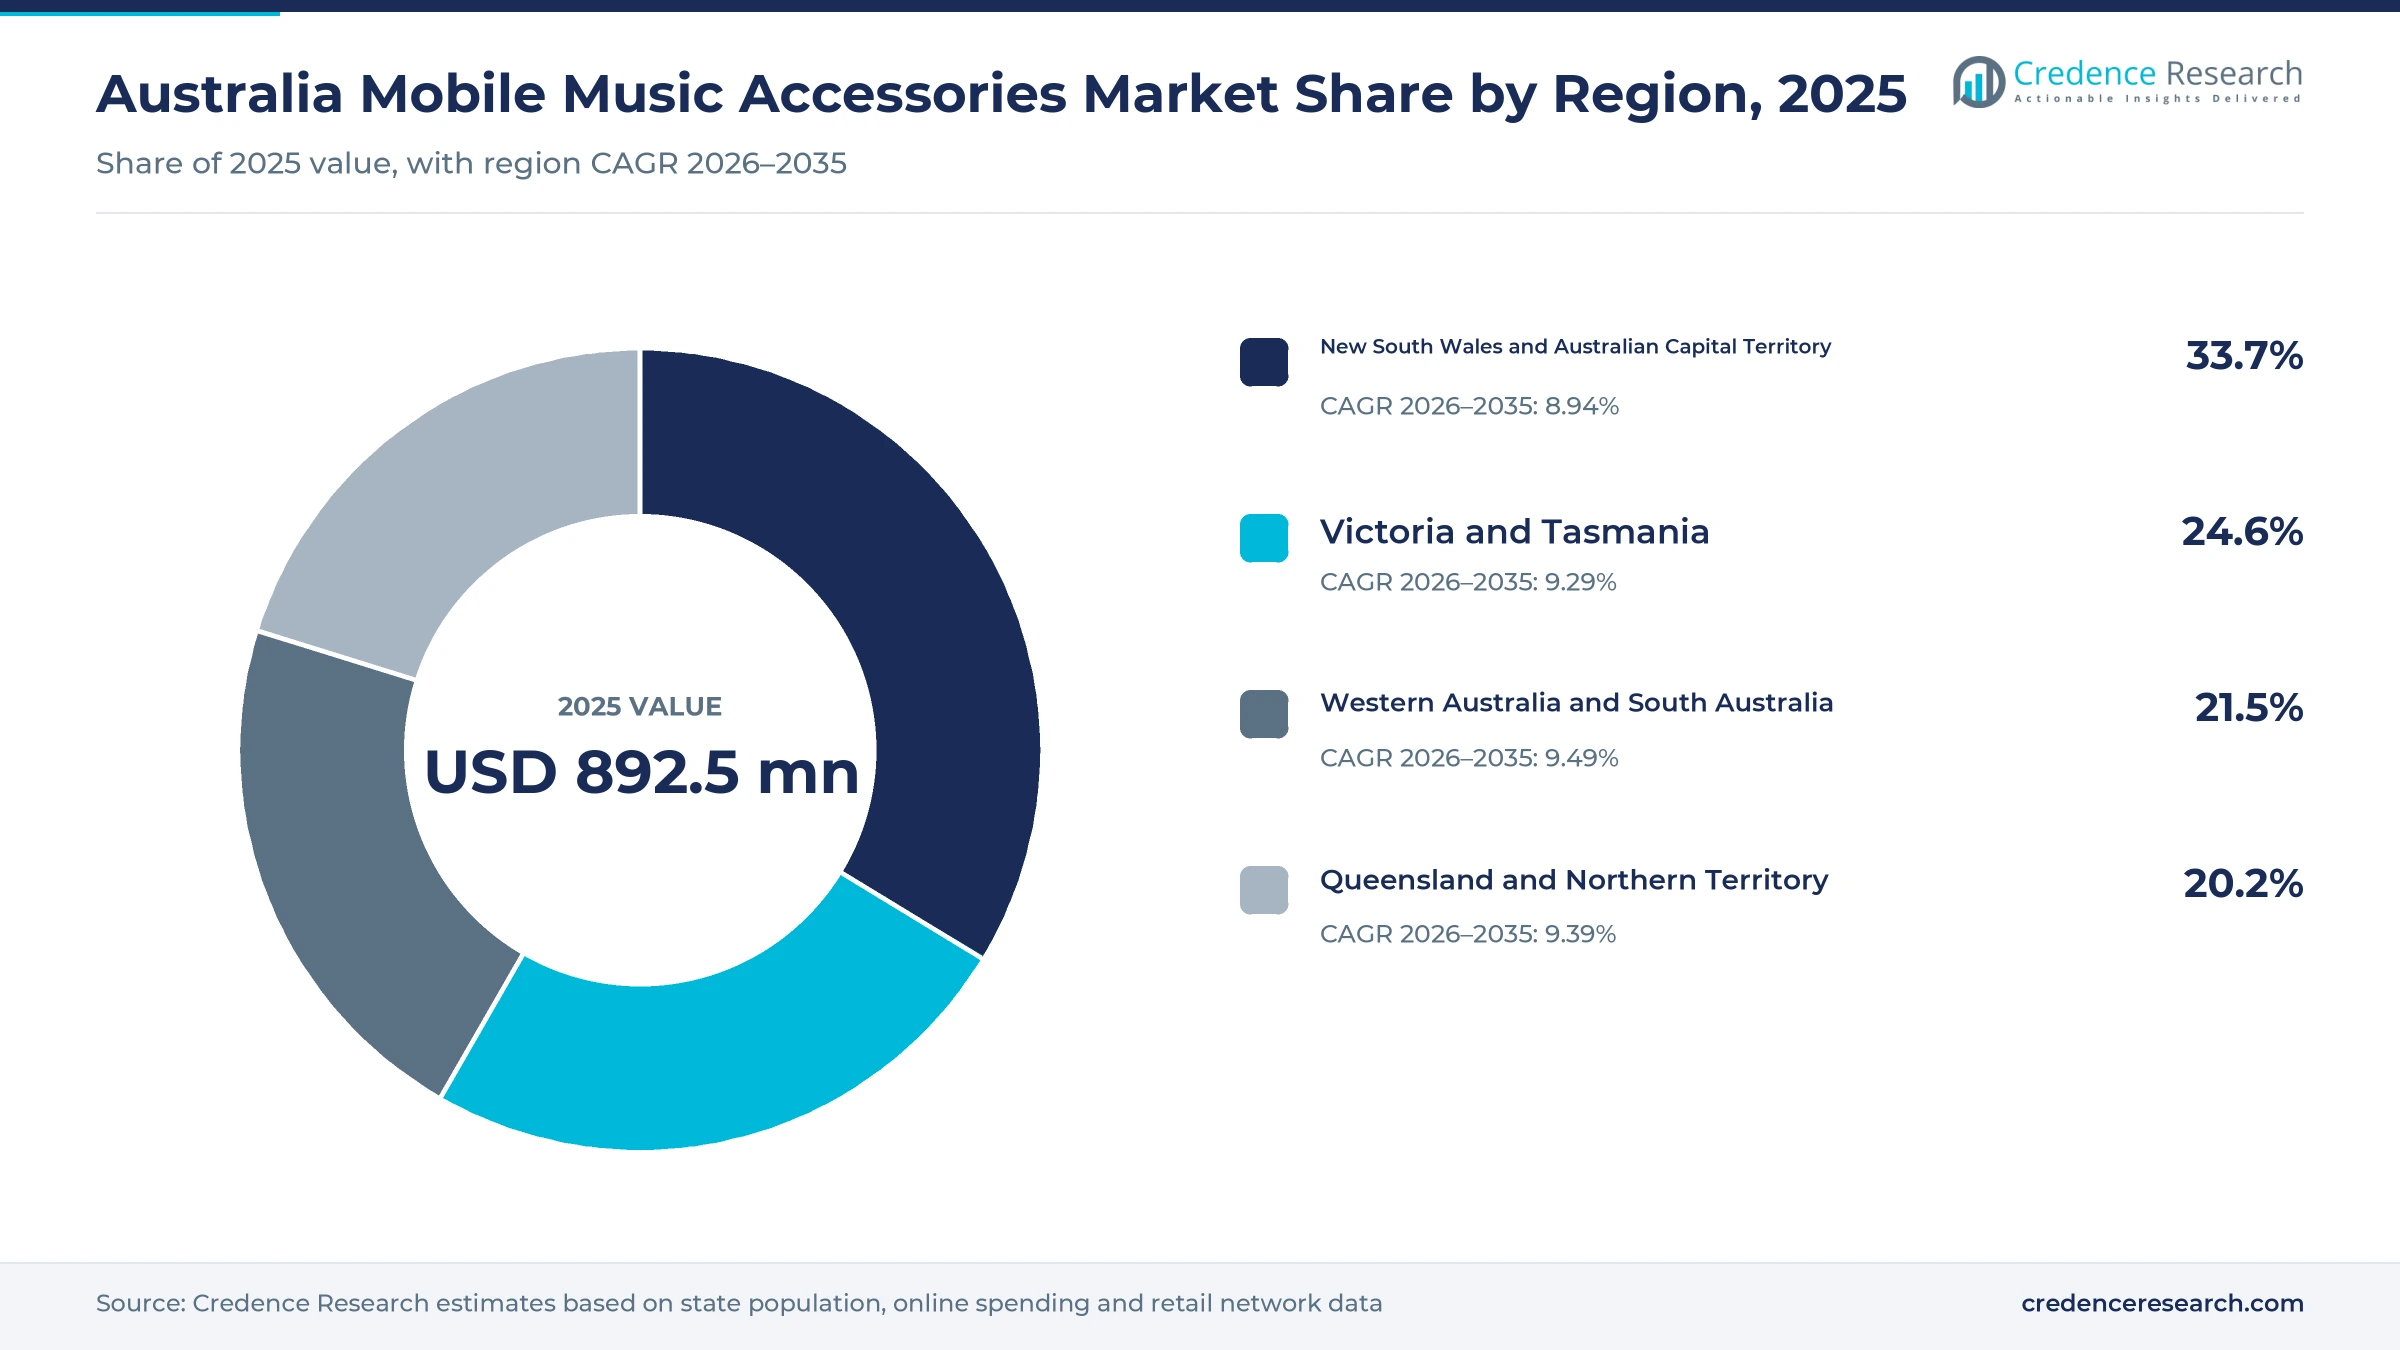
- New South Wales and Australian Capital Territory held a 33.7% share of 2025 value, because the zone has 9.16 million residents and the densest electronics retail network.
- True wireless and in-ear earphones led product types with a 52.0% share of 2025 value, because small charging-case earbuds suit commutes, workouts and calls.
- Subscription streaming earned A$517 million in 2025, or 71.0% of recorded music value, according to ARIA, which keeps earphones and headphones in daily use.
- Bluetooth LE Audio capable models grow fastest among technologies at 14.29% a year during 2026–2035, as new earbuds add LC3 coding and broadcast audio support.
True wireless earbuds lead as LE Audio models grow
Why do true wireless earbuds hold the largest share?
Based on product type, the market is categorized into True wireless and in-ear earphones, Over-ear and on-ear headphones, and Portable Bluetooth speakers. True wireless and in-ear earphones led with a 52.0% share of 2025 value, because charging-case earbuds fit pockets and handle calls, workouts and commutes. True wireless and in-ear earphones also grow fastest at 9.64% a year, as new models add noise cancellation, heart rate sensing and hearing support.
Which listening occasions drive the most spending?
Based on application, the market is categorized into Everyday personal listening, Active outdoor listening and Shared recreational listening. Everyday personal listening led with a 58.0% share of 2025 value, because paid streaming subscriptions fill most listening hours on commutes, at work and at home. Active outdoor listening grows fastest at 9.71% a year, as sweat-resistant earbuds with fitness tracking replace older sports models.
How fast are LE Audio models replacing older links?
Based on technology, the market is categorized into Wired audio, Bluetooth Classic audio and Bluetooth LE Audio capable products. Bluetooth Classic audio led with a 70.0% share of 2025 value, because most installed phones and earbuds still pair over the classic link. Bluetooth LE Audio capable products grow fastest at 14.29% a year, as newer earbuds list LC3 coding and Auracast broadcast support.
Which sales channels reach Australian buyers best?
Based on distribution channel, the market is categorized into Electronics retail chains, Online marketplaces, Brand-owned retail and Specialist and general retailers. Electronics retail chains led with a 41.0% share of 2025 value, because buyers like to compare fit and sound in store. Online marketplaces grow fastest at 10.16% a year, as more households buy electronics online.
| Segment Group | Leading Sub-segment | Share, 2025 | Fastest-growing Sub-segment | CAGR, 2026–2035 |
|---|---|---|---|---|
| By Product Type | True wireless and in-ear earphones | 52.0% | True wireless and in-ear earphones | 9.64% |
| By Application | Everyday personal listening | 58.0% | Active outdoor listening | 9.71% |
| By Technology | Bluetooth Classic audio | 70.0% | Bluetooth LE Audio capable | 14.29% |
| By Distribution Channel | Electronics retail chains | 41.0% | Online marketplaces | 10.16% |
Request a Free Sample
Fill in your details and we'll send you a free sample report.
- Sample data tables & charts
- Research methodology
Streaming habits and feature upgrades drive audio demand
How do streaming habits keep earbuds in daily use?
Streaming has become the default way Australians listen, which keeps earphones and headphones in daily use on commutes, at work and at home. The Australian Communications and Media Authority found that online streaming remained the preferred way to listen to music in 2025, used by 72% of adults. Among music streamers, 65% used Spotify, while YouTube Music use rose to 30% from 27% a year earlier, the ACMA's executive summary shows. ARIA reported that subscription streaming earned A$517 million in 2025, or 71.0% of a recorded music market that grew for a seventh straight year. As a result, Everyday personal listening led applications with 58.0% of 2025 value.
Why do feature upgrades shorten earbud replacement cycles?
Brands now add health, translation and noise control features to each new generation, which pushes buyers to replace earbuds and headphones before they wear out. Apple released AirPods Pro 3 in Australia on Sept. 19, 2025, from A$429, with heart rate sensing for workouts and up to eight hours of playback with noise cancellation, according to Apple. Apple opened orders for AirPods Max 2 at A$999 on March 26, 2026, with noise cancellation up to 1.5 times more effective than before. Sony priced its WH-1000XM6 headphones at A$699.95 in Australia, as Pickr noted in June 2025. In turn, True wireless and in-ear earphones held 52.0% of 2025 value across product types.
How does online retail widen access to audio brands?
Online retail now reaches most homes, which gives audio brands and marketplaces direct access to buyers outside large shopping centers. Australia Post reported that online shopping reached a record A$82.6 billion in 2025, up 13.9%, with 9.8 million households, or 82% of homes, buying online. Online marketplaces were the largest category at A$18.9 billion, as the International Post Corporation noted in March 2026. JB Hi-Fi said online sales reached 17.2% of its total in fiscal 2026, up from 16.8%, while it ran 209 Australian stores. As a result, Online marketplaces grow fastest at 10.16% a year during 2026–2035.
How do hearing support features add older buyers?
Apple's hearing aid software turned premium earbuds into health devices, which brings older adults into a category once led by young listeners and lifts demand for higher-priced models. InDaily reported that the Therapeutic Goods Administration approved the AirPods Pro 2 hearing aid feature in December 2024 for adults with mild to moderate hearing loss. The feature and a hearing test went live in Australia on April 1, 2025. The ACMA found that YouTube Music use among music streamers aged 65 to 74 rose to 36% from 22%. The WHO and the International Telecommunication Union set the H.870 safe listening standard, which guides volume limits and warnings on personal audio devices.
Broadcast audio, open-ear designs and value tiers rise
Why is Auracast broadcast audio on the rise in venues?
Bluetooth broadcast audio lets one transmitter stream sound to many earbuds and hearing aids, which gives LE Audio capable products a new use in public venues. The Sydney Opera House became the first cultural institution to offer Auracast broadcasts on May 6, 2025, according to the Bluetooth Special Interest Group. The rollout covered three of its seven venues and was built with GN Group, Hearing Australia and National Acoustic Laboratories. Visitors can use their own Auracast earbuds, headphones, hearing aids or cochlear implants. Sennheiser lists LC3 coding on its Momentum True Wireless 4 earbuds, with Auracast added by firmware update. As a result, Bluetooth LE Audio capable products grow fastest at 14.29% a year.
How is open-ear noise control shifting earbud design?
Brands now bring noise cancellation and translation into lighter open-ear designs, which shifts features once reserved for sealed premium earbuds into lower price points. Apple released AirPods 5 in Australia on Sept. 18, 2026, at A$219, or A$249 with a wireless charging case, with open-ear noise cancellation that removes up to 50% more noise than AirPods 4. AirPods Pro 3 added Live Translation in beta for five languages in September 2025. Samsung launched Galaxy Buds3 FE in Australia on Sept. 26, 2025, with Galaxy AI interpreter support, FutureFive reported. In turn, True wireless and in-ear earphones gain value as buyers trade up within the earbud category.
Can mid-priced earbuds open a larger buyer base?
Mid-market earbuds with noise cancellation offer an opening to reach younger and price-sensitive buyers who skip flagship models. Samsung priced Galaxy Buds3 FE at A$249 with Bluetooth 5.4 and IP54 water resistance. Sennheiser listed Momentum True Wireless 4 earbuds at A$249 on its Australian store, down from A$499, after a March 2024 launch at A$499.95. The ACMA found that 86% of music streamers aged 18 to 24 listened at home in 2025, down from 96% a year earlier, which keeps young buyers active in the category. As a result, entry and mid-market tiers give brands a path to earbuds buyers outside the premium tier.
Is shared outdoor listening an opening for speakers?
Rugged portable speakers offer an opening in group listening at beaches, parks and campsites, where buyers want sound for several people at once. Bose launched its SoundLink Plus speaker at A$429 and the SoundLink Micro second generation at A$179 in Australia, Pickr reported in July 2025. Bose also updated its app so owners can stream to several mixed speakers at once. ARIA reported that vinyl album sales rose 4.1% in 2025, which shows that shared listening still matters to local fans. In turn, Active outdoor listening grows at 9.71% a year, and demand for wireless speakers follows outdoor leisure.
Discounting, lock-in and hearing risks test audio sellers
How does heavy discounting squeeze retail margins?
Frequent price cuts on earbuds and headphones squeeze margins for retailers and brands, because buyers learn to wait for sales events. JB Hi-Fi management expected a variable trading environment in the short term, the Motley Fool reported in August 2026, after a slight July sales dip at JB Hi-Fi Australia. In turn, premium launches lose value faster, and retailers must clear older stock before each new generation arrives. Brands respond with bundled cases, longer warranties and loyalty offers that protect full-price sales during launch periods.
Why does phone ecosystem lock-in limit brand switching?
Many advanced earbud features work only with the same brand of phone, which limits choice for buyers who switch handsets. Samsung states that Auto Switch and the Galaxy AI interpreter on Galaxy Buds3 FE need a supported Galaxy device. Apple says hands-free Siri AI on AirPods 5 needs an iPhone with Apple Intelligence. As a result, independent audio brands must compete on sound quality, comfort and cross-platform apps that work equally well with Android phones and iPhones.
How does ownership change affect specialist brands?
Sennheiser's consumer business faces another change of owner, which can unsettle retail ranging and service plans for headphone buyers in Australia. Stereonet reported on March 24, 2026, that Sonova plans to divest its consumer hearing business, which sells Sennheiser headphones, without naming a buyer. In turn, retailers may limit stock commitments until a new owner sets its range. Brands respond with firmware support and warranty pledges that reassure buyers and retailers.
Why do hearing safety concerns shape product design?
Loud listening on personal devices raises hearing risks, which pushes brands to add volume limits and exposure warnings. The WHO estimates that sound-induced hearing loss threatens more than one billion young people worldwide, according to the International Telecommunication Union. In turn, brands must build safe listening tools into apps and firmware. These tools add development cost for every brand, while parents look for limited-volume models for children and teenagers.
New South Wales leads as the west and south grow fastest
| Region | Value, 2025 (USD million) | Share, 2025 | CAGR, 2026–2035 |
|---|---|---|---|
| New South Wales and Australian Capital Territory | 300.8 | 33.7% | 8.94% |
| Victoria and Tasmania | 219.6 | 24.6% | 9.29% |
| Western Australia and South Australia | 191.9 | 21.5% | 9.49% |
| Queensland and Northern Territory | 180.3 | 20.2% | 9.39% |
What keeps New South Wales and the ACT in the lead?
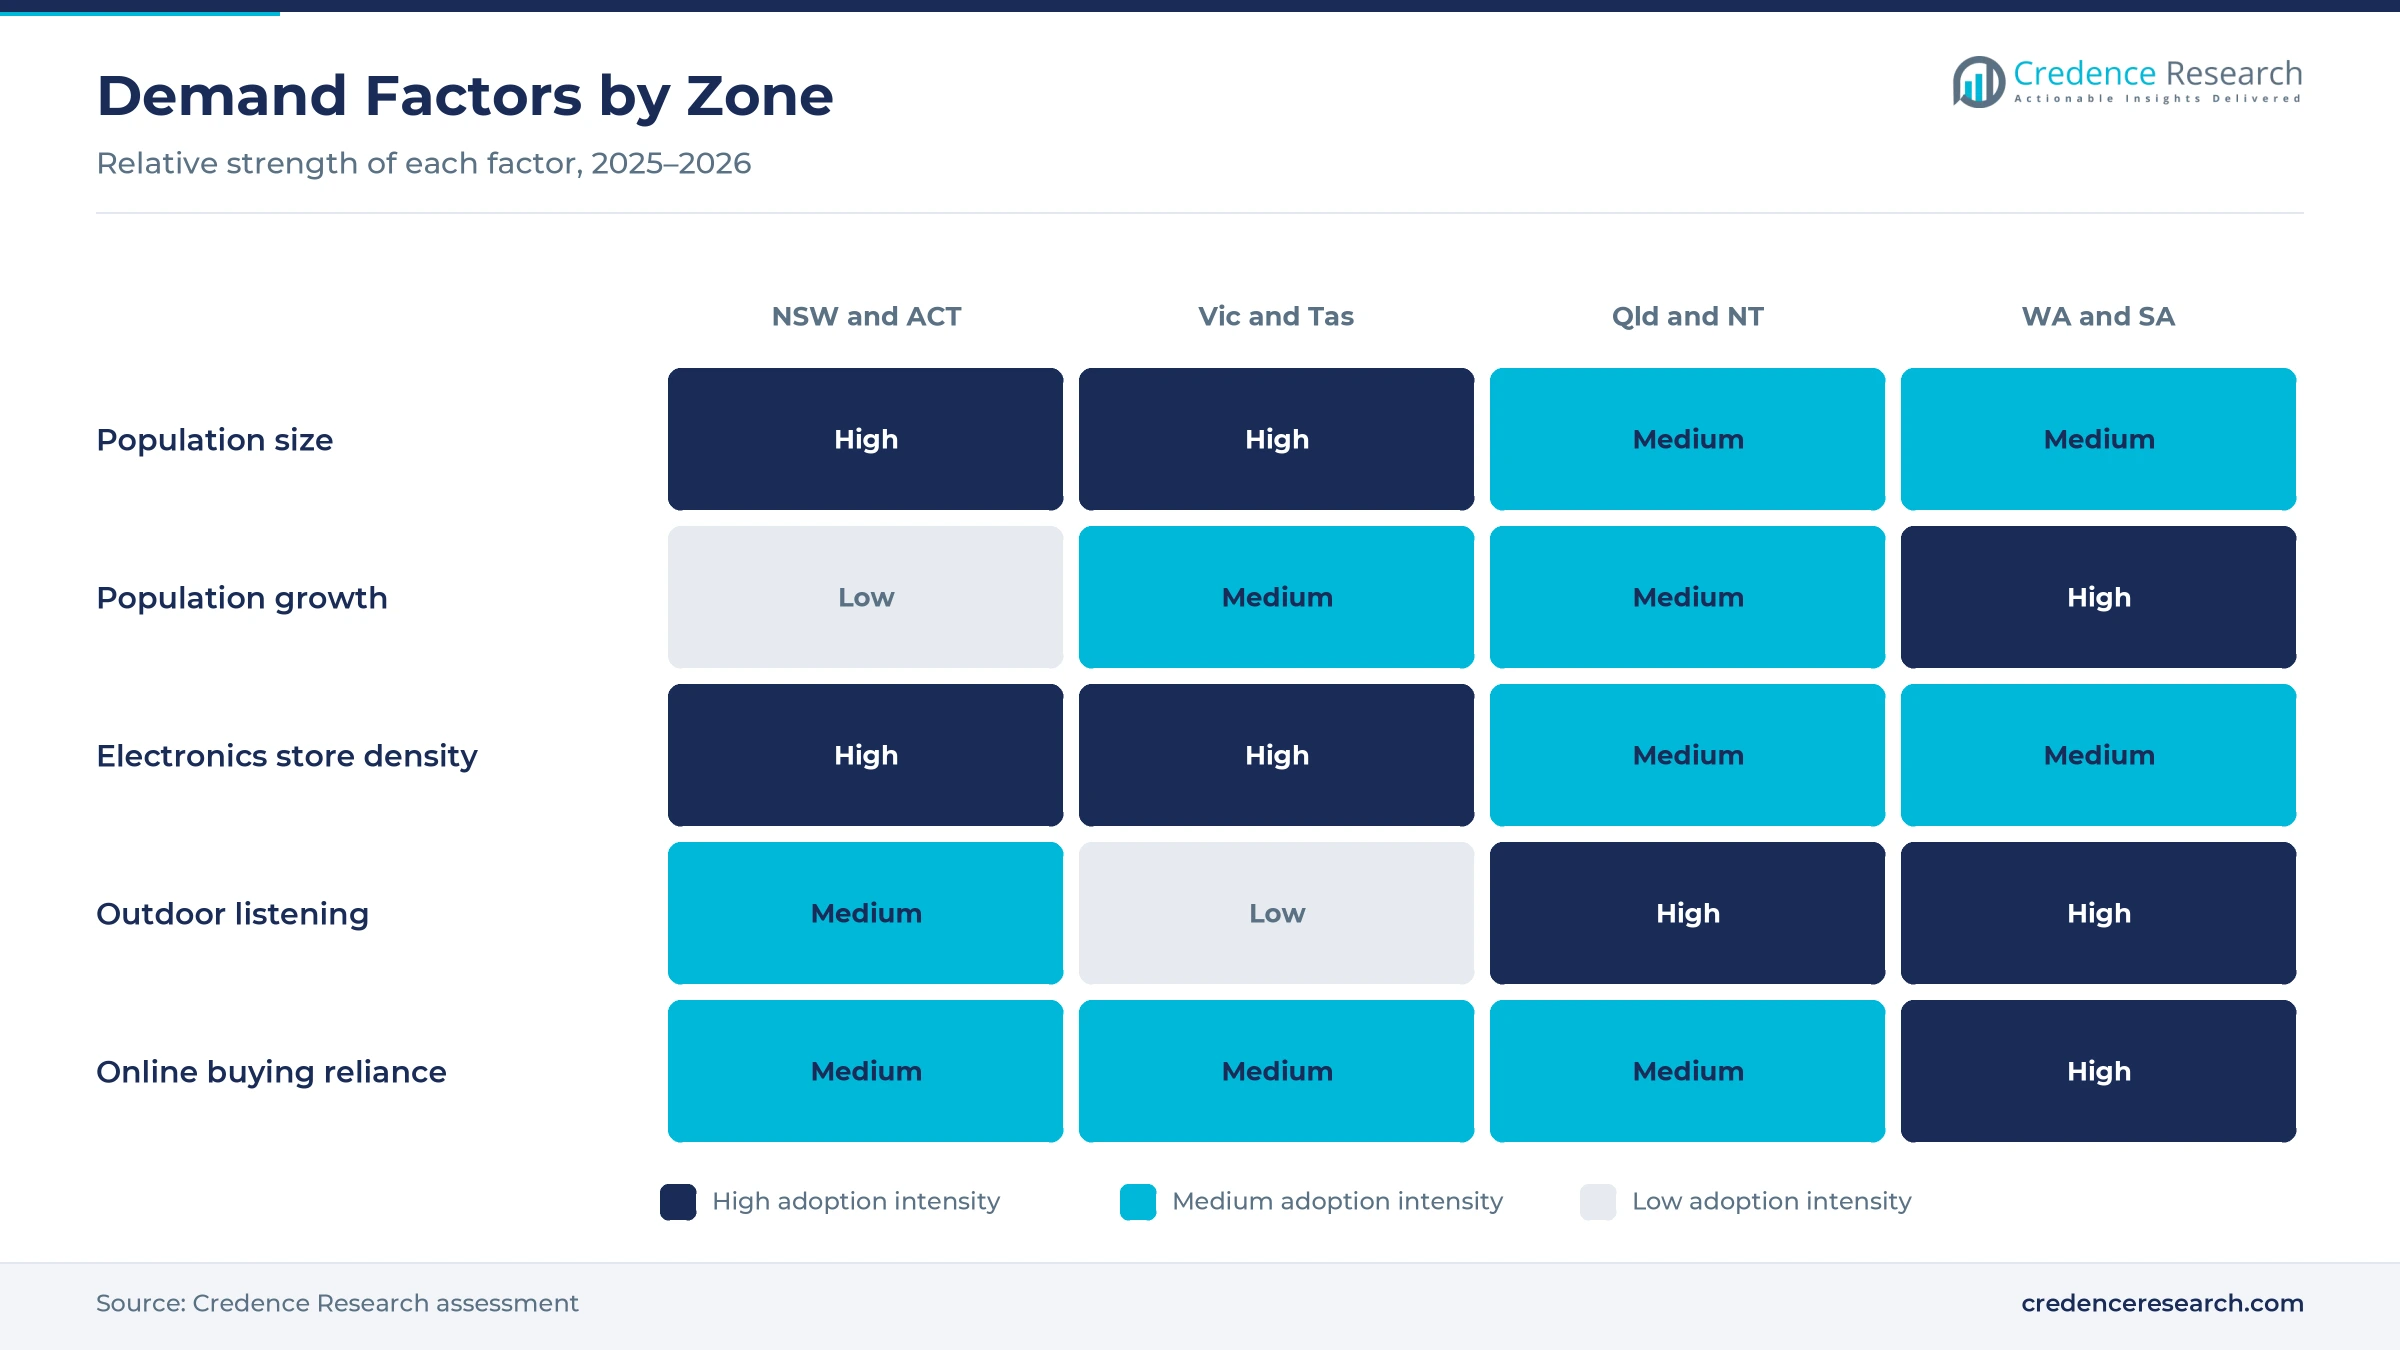
New South Wales and Australian Capital Territory held 33.7% of 2025 value and grows at 8.94% a year, because Sydney and Canberra combine large populations with dense electronics retail. New South Wales had 8,670,100 residents on March 31, 2026, and the ACT had 489,700, according to the Australian Bureau of Statistics. Population growth in New South Wales was 1.1% over the year, which keeps growth below the national pace of 1.4%. Even so, the zone remains the largest pool of earbud and headphone buyers.
How do Victoria and Tasmania support headphone demand?
Victoria and Tasmania held a 24.6% share of 2025 value and grow at 9.29% a year, as Victoria adds residents faster than New South Wales. Victoria had 7,154,200 residents on March 31, 2026, after growth of 1.6% over the year. Tasmania grew only 0.6%, which tempers growth for the combined zone. In turn, Victoria's faster population growth drives most new spending on headphones and earphones in this zone.
Why does Queensland and the NT add buyers quickly?
Queensland and Northern Territory held a 20.2% share of 2025 value and grow at 9.39% a year, as population growth and outdoor lifestyles lift demand. Queensland had 5,739,500 residents on March 31, 2026, after growth of 1.6%, while the Northern Territory grew 1.5%. Warm weather supports beach and pool listening, which favors water-resistant earbuds and portable speakers across the zone. Credence Research expects active outdoor listening to rise fastest in this zone.
Why do Western Australia and South Australia grow fastest?
Western Australia adds residents faster than any other state, which lifts spending on earbuds and speakers across the combined zone. Western Australia and South Australia held a 21.5% share of 2025 value and grow fastest at 9.49% a year. Western Australia had 3,096,200 residents on March 31, 2026, after growth of 2.1%, the fastest state rate. South Australia had 1,916,800 residents, and JB Hi-Fi plans regional store openings in fiscal 2027 that widen in-store access.
Launches, approvals and venue rollouts, 2024–2026
| Development | Status and market relevance |
|---|---|
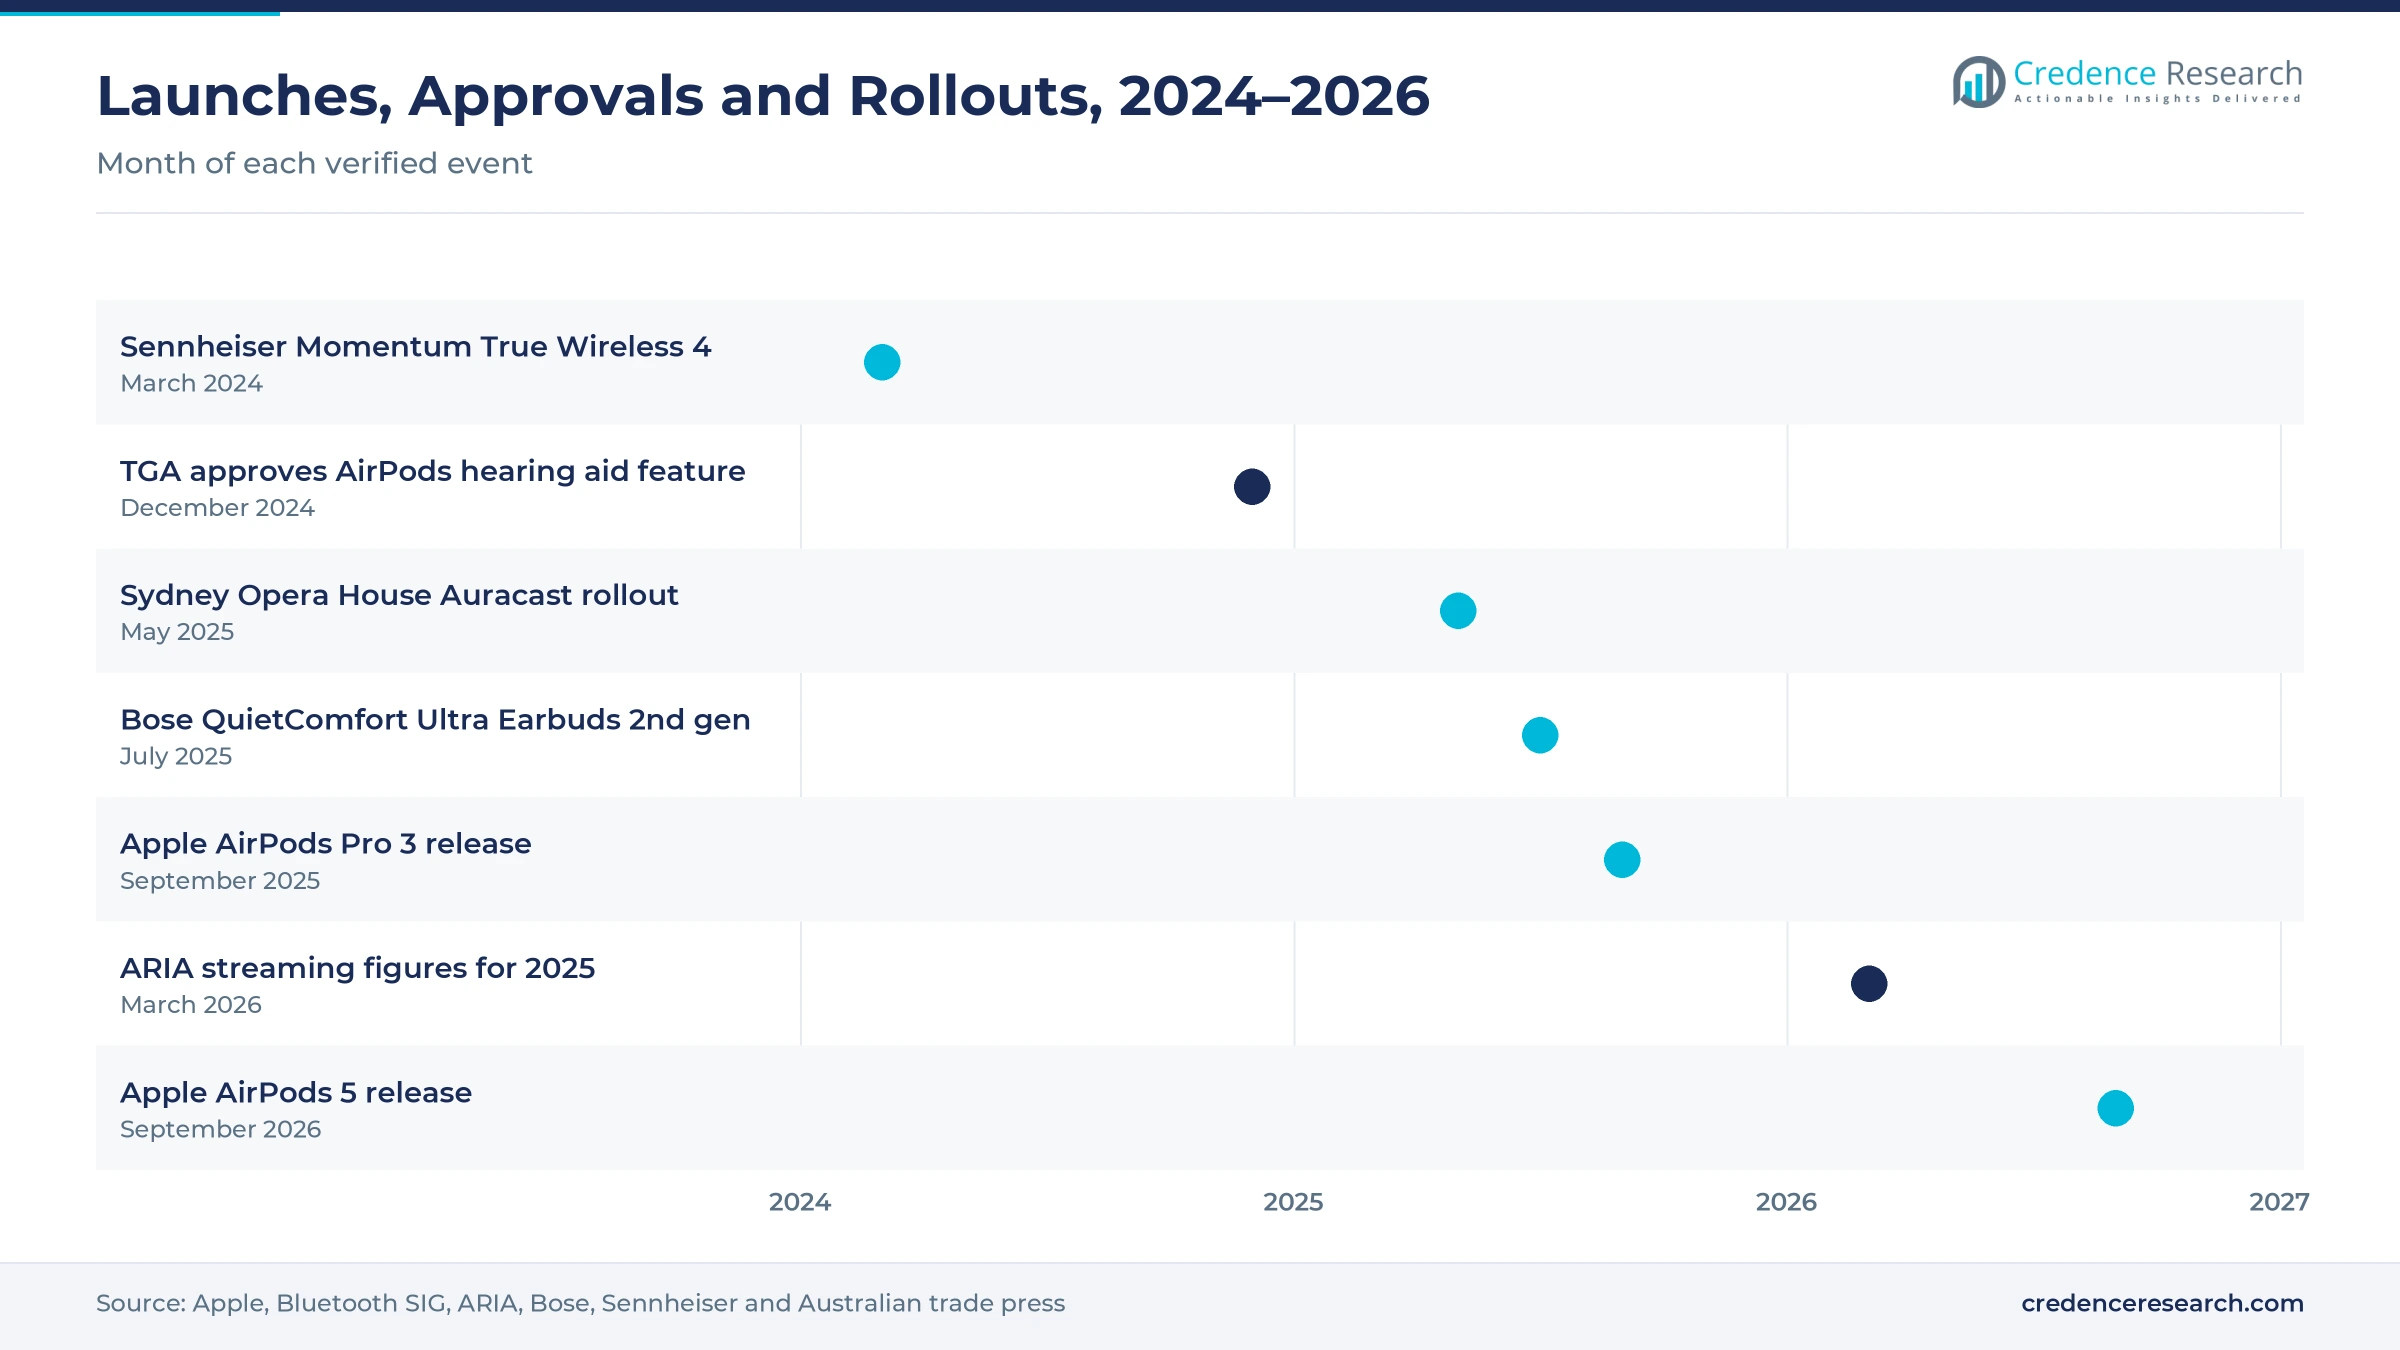
| In March 2024, Sennheiser launched Momentum True Wireless 4 earbuds in Australia at A$499.95, with Bluetooth 5.4 and lossless codec support. | Adds a premium specialist option to the earbud tier |
| In April 2025, Apple switched on the AirPods Pro 2 hearing test and hearing aid feature in Australia after Therapeutic Goods Administration approval. | Opens earbuds to adults with mild to moderate hearing loss |
| In May 2025, the Sydney Opera House introduced Auracast broadcast audio in three venues with GN Group, Hearing Australia and National Acoustic Laboratories. | Gives LE Audio earbuds a public venue use case |
| In September 2025, Apple released AirPods Pro 3 in Australia from A$429, with heart rate sensing and Live Translation in beta. | Raises the premium earbud feature bar |
| In September 2026, Apple released AirPods 5 in Australia from A$219, with open-ear Active Noise Cancellation. | Brings noise control to a lower price point |
Bluetooth LE Audio and smart sensors reshape earbuds
- Bluetooth LE Audio uses the LC3 codec and supports Auracast broadcasts, which Sennheiser added to Momentum True Wireless 4 earbuds by firmware update.
- Bluetooth Classic audio still links most phones and earbuds, and new models such as Galaxy Buds3 FE use Bluetooth 5.4 for stable pairing.
- Active noise cancellation now reaches open-ear earbuds, as AirPods 5 remove up to 50% more noise than the previous generation.
- Health sensing adds heart rate tracking during workouts to AirPods Pro 3, linking earbuds with fitness apps on the phone.
Need a Custom Version of This Report?
Tailor the scope, geography, or segments to your exact requirements.
- Custom geography or segment scope
- Direct access to our analyst team
Phone makers and audio specialists compete on features
Competition for personal audio spending in Australia is led by smartphone makers that bundle earbuds into their own device ecosystems. Apple sells AirPods through its own stores, its online store and national electronics chains, and it added AirPods Pro 3 in September 2025 and AirPods 5 in September 2026, widening its range of mobile music accessories. Samsung Electronics pairs Galaxy Buds with Galaxy phones and released Galaxy Buds3 FE at A$249 in September 2025. Sony competes in premium noise-cancelling headphones with the WH-1000XM6 at A$699.95. Bose spans earbuds, headphones and SoundLink speakers, including the QuietComfort Headphones second generation at A$549.95 from August 2026. Sonova Consumer Hearing sells Sennheiser products through its Australian online store and marketplaces. Rivals compete on noise control, battery life, ecosystem features and retail reach.
Which brands compete for Australian listeners?
| Company | Type | Role in the market |
|---|---|---|
| Apple | Phone maker | AirPods earbuds and headphones sold through Apple Stores, online and electronics chains |
| Samsung Electronics | Phone maker | Galaxy Buds range tied to Galaxy phones, including Buds3 FE and Buds4 |
| Sony | Audio and electronics brand | Premium noise-cancelling headphones such as the WH-1000XM6 |
| Bose | Audio specialist | QuietComfort earbuds and headphones plus SoundLink portable speakers |
| Sonova Consumer Hearing | Audio specialist | Sennheiser Momentum earbuds and headphones sold through its Australian store |
Credence Research view on personal audio demand
Credence Research's view is that Australian spending on mobile music accessories will grow steadily because streaming keeps listening hours high, and each new earbud generation adds features that justify replacement. True wireless earbuds remain the largest value pool, while LE Audio capable models add the fastest growth as broadcast audio spreads to venues. Phone makers should keep their lead through ecosystem features, while audio specialists compete on sound and comfort. Heavy discounting and ecosystem lock-in will limit margins for smaller brands.
How the national personal audio estimate was built
The report uses 2025 as the base year on a calendar basis, and market values come from the Credence Research model. That model combines streaming usage data, state population data, online retail spending, product launch prices and company disclosures. Segment splits and zone growth rates are Credence Research estimates, while zone shares follow the regional split defined for this report. Sources used are government regulators, official statistics, industry associations, trade press and company publications, and no interviews or surveys were used.
Earbuds and broadcast audio carry growth to 2035
Value across Australian mobile music accessories is expected to reach USD 2.18 billion by 2035, a 9.24% CAGR during 2026–2035, as streaming, feature upgrades and online retail widen demand. Growth should be strongest where population expands fastest, led by Western Australia and South Australia. LE Audio capable models will take a larger share of new earbuds as broadcast audio spreads, while wired products shrink to niche use. Brands that combine health features, cross-platform apps and broad retail reach should gain the most.
Frequently Asked Questions
How big is the Australia mobile music accessories market?
Which product type leads personal audio spending?
Which region leads personal audio spending in Australia?
How common is streaming among Australian adults?
Can earbuds work as hearing aids in Australia?
Why is Bluetooth LE Audio growing fastest?
Which companies compete in Australian personal audio?
What are the main challenges for audio brands?
Table of Content
Chapter 1 Market Segmentation
- 1.1 Segmentation Framework
- 1.1.1 Product and Service Classification
- 1.1.2 Application and End-Use Classification
- 1.1.3 Technology and Solution Classification
- 1.1.4 Customer and Distribution Channel Classification
- 1.1.5 Geographic Segmentation
- 1.1.6 Market Segment Definitions and Boundaries
- 1.2 By Product Type
- 1.2.1 True wireless and in-ear earphones
- 1.2.2 Over-ear and on-ear headphones
- 1.2.3 Portable Bluetooth speakers
- 1.3 By Application
- 1.3.1 Everyday personal listening
- 1.3.2 Active outdoor listening
- 1.3.3 Shared recreational listening
- 1.4 By Technology
- 1.4.1 Wired audio
- 1.4.2 Bluetooth Classic audio
- 1.4.3 Bluetooth LE Audio capable
Chapter 2 Introduction
- 2.1 Report Objectives and Scope
- 2.2 Product Definition and Industry Terminology
- 2.3 Market Inclusions and Exclusions
- 2.4 Research Process
- 2.4.1 Primary Research and Expert Interviews
- 2.4.2 Secondary Research and Source Review
- 2.4.3 Top-Down and Bottom-Up Estimation
- 2.4.4 Data Triangulation and Verification
- 2.5 Market Size Measurement Basis
- 2.5.1 2025: USD 892.5 million → 2035: USD 2.18 billion
- 2.6 Historical and Forecast Reference Periods
- 2.6.1 Historical Period: 2018-2025
- 2.6.2 Base Year: 2025
- 2.6.3 Forecast Period: 2025-2035
- 2.7 Research Assumptions and Limitations
Chapter 3 Executive Summary
- 3.1 Market Snapshot and Key Findings
- 3.2 Base-Year Market Size, 2025
- 3.3 Forecast Market Size, 2035
- 3.4 Revenue and Volume Growth Outlook
- 3.5 Key Demand and Supply Indicators
- 3.6 Leading Market Segments
- 3.7 Fastest-Growing Market Opportunities
- 3.8 Regional Performance Highlights
- 3.9 Technology and Industry Transformation
- 3.10 Competitive Landscape Summary
- 3.11 Analyst View and Strategic Implications
Chapter 4 Australia Mobile Music Accessories Market Trends and Developments
- 4.1 Historical Industry Development, 2018-2025
- 4.2 Recent Market Trends and Developments
- 4.3 Demand and Customer Behavior Trends
- 4.4 Technology and Product Innovation
- 4.5 Artificial Intelligence, Automation and Digitalization
- 4.6 Local Manufacturing and Supply Chain Realignment
- 4.7 Industry Partnerships, Mergers and Acquisitions
- 4.8 Sustainability and Circular Economy Developments
- 4.9 Government and Private Sector Investment Trends
- 4.10 Emerging Business Models and Commercialization
- 4.11 Industry Developments and Announcements
Chapter 5 Australia Mobile Music Accessories Market Production, Supply and Demand Analysis
- 5.1 Demand Trend and Consumption Analysis, 2018-2025
- 5.2 Demand Forecast, 2025-2035
- 5.3 Production and Output Trend, 2018-2025
- 5.4 Production and Output Forecast, 2025-2035
- 5.5 Installed Capacity and Capacity Utilization
- 5.6 Company-Wise Production Plants and Statistics
- 5.6.1 Installed Production Capacity
- 5.6.2 Actual Production
- 5.6.3 Planned Capacity and Expansion Targets
- 5.7 Supply Chain Structure and Procurement Trends
- 5.8 Supply-Demand Gap and Bottlenecks
- 5.9 Import Dependence and Sourcing Structure
- 5.10 Contract Manufacturing and Outsourcing
- 5.11 Regional Supply and Demand Concentration
Chapter 6 Australia Mobile Music Accessories Market Pricing Analysis
- 6.1 Pricing Structure and Measurement
- 6.2 Historical Pricing Trends, 2018-2025
- 6.3 Pricing Outlook, 2025-2035
- 6.4 Average Selling Price and Unit Economics
- 6.5 Pricing by Product and Market Segment
- 6.6 Geographic Pricing Differences
- 6.7 Key Input, Energy, Labor and Logistics Costs
- 6.8 Contract Pricing and Purchasing Models
- 6.9 Pricing Sensitivity and Competitive Positioning
- 6.10 Price, Margin and Profitability Implications
Chapter 7 Australia Mobile Music Accessories Market Dynamics
- 7.1 Market Growth Drivers
- 7.1.1 Demand-Side Drivers
- 7.1.2 Technology and Innovation Drivers
- 7.1.3 Infrastructure and Investment Drivers
- 7.1.4 Regulatory and Policy Drivers
- 7.2 Market Restraints
- 7.2.1 Cost and Affordability Constraints
- 7.2.2 Technology and Adoption Barriers
- 7.2.3 Supply Chain and Operational Constraints
- 7.3 Market Challenges
- 7.3.1 Competitive Pressure and Margin Erosion
- 7.3.2 Skills, Infrastructure and Implementation Gaps
- 7.4 Emerging Market Opportunities
- 7.5 Market Dynamics Impact and Time-Horizon Assessment
Chapter 8 Australia Mobile Music Accessories Value Chain Analysis
- 8.1 Industry Value Chain Overview
- 8.2 Upstream Suppliers and Critical Inputs
- 8.3 Technology and Component Providers
- 8.4 Manufacturing or Service Delivery
- 8.5 Distribution, Channel Partners and Integrators
- 8.6 Downstream Applications and End Users
- 8.7 Value Addition and Profit Pools
- 8.8 Vertical Integration and Outsourcing
- 8.9 Supplier Concentration and Risk
- 8.10 Supply Chain Localization and Resilience
Chapter 9 Australia Mobile Music Accessories Market Regulations and Policies
- 9.1 Relevant Laws, Standards and Compliance Frameworks
- 9.2 Product, Service, Safety and Quality Requirements
- 9.3 Government Policies, Incentives and Subsidies
- 9.4 Imports, Exports and Trade Barriers
- 9.5 Public Procurement and Local Content Requirements
- 9.6 Environmental and Sustainability Compliance
- 9.7 Data Protection, AI and Cybersecurity Compliance
- 9.8 Upcoming Policy Changes and Market Implications
Chapter 10 Australia Mobile Music Accessories Market Hotspots and Opportunities
- 10.1 Market Opportunity Mapping and Growth Hotspots
- 10.2 High-Growth Applications and Customer Groups
- 10.3 Underserved Markets and White-Space Opportunities
- 10.4 Emerging Technology and Product Opportunities
- 10.5 New Capacity and Investment Hotspots
- 10.6 Market Entry and Expansion Opportunities
- 10.7 Distribution and Partnership Opportunities
- 10.8 Near-Term and Long-Term Commercial Potential
- 10.9 Opportunity Attractiveness and Execution Risks
Chapter 11 Australia Mobile Music Accessories Market Outlook, 2025-2035
- 11.1 Market Size and Analysis
- 11.1.1 Revenue (Market Measurement: 2025: USD 892.5 million → 2035: USD 2.18 billion)
- 11.1.2 Market Volume and Quantity Sold
- 11.1.3 Historical Market Size, 2018-2025
- 11.1.4 Base-Year Market Size, 2025
- 11.2 Market Forecast, 2025-2035
- 11.2.1 Revenue Forecast to 2035
- 11.2.2 Volume Forecast to 2035
- 11.2.3 CAGR and Year-on-Year Growth
- 11.2.4 Incremental Revenue Opportunity
- 11.3 Forecast Assumptions and Scenario Analysis
- 11.3.1 Base-Case Forecast
- 11.3.2 Optimistic and Conservative Scenarios
- 11.3.3 Technology, Pricing and Policy Sensitivities
- 11.4 Market Attractiveness and Growth Outlook
Chapter 12 Australia Mobile Music Accessories Market Segmentation and Outlook
- 12.1 Segmentation Summary and Market Shares, 2025
- 12.2 Largest and Fastest-Growing Segments
- 12.3 By Product Type - Market Size and Forecast, 2025-2035
- 12.3.1 Segment Definition and Scope
- 12.3.2 Historical Market Size, 2018-2025
- 12.3.3 Revenue Forecast, 2025-2035
- 12.3.4 Volume Forecast, 2025-2035
- 12.3.5 Base-Year Market Share, 2025
- 12.3.6 Segment CAGR and Growth Drivers
- 12.3.7 Subsegment Market Size and Forecast
- 12.3.7.1 True wireless and in-ear earphones
- 12.3.7.2 Over-ear and on-ear headphones
- 12.3.7.3 Portable Bluetooth speakers
- 12.3.8 Subsegment Pricing and Adoption Trends
- 12.3.9 Leading Suppliers and Competition
- 12.3.10 Regional Demand and Opportunities
- 12.4 By Application - Market Size and Forecast, 2025-2035
- 12.4.1 Segment Definition and Scope
- 12.4.2 Historical Market Size, 2018-2025
- 12.4.3 Revenue Forecast, 2025-2035
- 12.4.4 Volume Forecast, 2025-2035
- 12.4.5 Base-Year Market Share, 2025
- 12.4.6 Segment CAGR and Growth Drivers
- 12.4.7 Subsegment Market Size and Forecast
- 12.4.7.1 Everyday personal listening
- 12.4.7.2 Active outdoor listening
- 12.4.7.3 Shared recreational listening
- 12.4.8 Subsegment Pricing and Adoption Trends
- 12.4.9 Leading Suppliers and Competition
- 12.4.10 Regional Demand and Opportunities
- 12.5 By Technology - Market Size and Forecast, 2025-2035
- 12.5.1 Segment Definition and Scope
- 12.5.2 Historical Market Size, 2018-2025
- 12.5.3 Revenue Forecast, 2025-2035
- 12.5.4 Volume Forecast, 2025-2035
- 12.5.5 Base-Year Market Share, 2025
- 12.5.6 Segment CAGR and Growth Drivers
- 12.5.7 Subsegment Market Size and Forecast
- 12.5.7.1 Wired audio
- 12.5.7.2 Bluetooth Classic audio
- 12.5.7.3 Bluetooth LE Audio capable
- 12.5.8 Subsegment Pricing and Adoption Trends
- 12.5.9 Leading Suppliers and Competition
- 12.5.10 Regional Demand and Opportunities
- 12.6 Segment Growth Comparison
- 12.7 Segment Attractiveness and Priority Matrix
Chapter 13 Australia Mobile Music Accessories End-Use and Application Market Outlook
- 13.1 End-Use Industry and Customer Demand Structure
- 13.2 Leading Applications and Customer Groups
- 13.3 End-Use Market Size, Share and Forecast
- 13.4 Major End-Use Industry Deep Dives
- 13.4.1 Customer Requirements and Use Cases
- 13.4.2 Demand and Replacement Cycles
- 13.4.3 Technical and Regulatory Considerations
- 13.4.4 Purchasing and Procurement Models
- 13.4.5 Leading Vendors and Distribution Channels
- 13.4.6 Forecast and Commercial Opportunities
- 13.5 Emerging Applications and Cross-Segment Demand
- 13.6 End-Use Industry Investment Priorities
Chapter 14 Australia Mobile Music Accessories Geographic Market Outlook, 2025-2035
- 14.1 Domestic Market Distribution and Demand Clusters
- 14.2 State- or Province-Wise Market Size and Forecast, 2025-2035
- 14.3 City and Metropolitan Market Outlook
- 14.4 Industrial, Manufacturing and Commercial Clusters
- 14.5 Geographic Concentration of Key End Users
- 14.6 Local Pricing and Purchasing Differences
- 14.7 Domestic Production Facilities and Capacity Map
- 14.8 Local Infrastructure and Project Pipeline
- 14.9 State-Level Policy and Incentive Differences
- 14.10 Subnational Investment Hotspots and Opportunities
- 14.11 Distribution and Logistics Networks
- 14.12 Domestic Competitive Footprint
Chapter 15 Australia Mobile Music Accessories Technology, Innovation and Sustainability Outlook
- 15.1 Technology Landscape and Maturity
- 15.2 Product, Process and Service Innovation
- 15.3 AI, Automation and Digital Tools in the Industry
- 15.4 Technology Adoption and Performance Benchmarking
- 15.5 Innovation Pipeline and R&D Investment
- 15.6 Patent and Intellectual Property Trends
- 15.7 Energy Efficiency and Resource Management
- 15.8 Sustainability, Recycling and Circularity
- 15.9 Technology Roadmap, 2025-2035
- 15.10 Risks of Obsolescence and Technology Substitution
Chapter 16 Australia Mobile Music Accessories Market Key Strategic Imperatives
- 16.1 Growth and Market Entry Priorities
- 16.2 High-Return Products and Segments
- 16.3 Pricing, Profitability and Cost Optimization
- 16.4 Technology Investment and Product Differentiation
- 16.5 Supply Chain Localization and Resilience
- 16.6 Distribution and Customer Acquisition
- 16.7 Partnership, Acquisition and Capacity Strategy
- 16.8 Regional Expansion Priorities
- 16.9 Short-, Medium- and Long-Term Actions
Chapter 17 Competition Outlook
- 17.1 Industry Competition Characteristics
- 17.2 Market Structure and Concentration
- 17.3 Market Share and Competitive Positioning, 2025
- 17.4 Company-Wise Revenue and Product Benchmarking
- 17.5 Production and Service Capacity Benchmarking
- 17.6 Technology, Pricing and Differentiation
- 17.7 Regional Footprint and Distribution Strength
- 17.8 Mergers, Acquisitions and Strategic Alliances
- 17.9 New Entrants and Competitive Threats
- 17.10 Porter's Five Forces and Industry Attractiveness
- 17.11 Competitive Outlook, 2025-2035
Chapter 18 Company Profiles
- 18.1 Company Coverage and Selection Criteria
- 18.2 Apple
- 18.2.1 Business Description
- 18.2.2 Company Ownership and Geographic Presence
- 18.2.3 Product and Service Portfolio
- 18.2.4 Manufacturing and Operating Footprint
- 18.2.5 Production Capacity and Expansion Plans
- 18.2.6 Financial Performance and Investment
- 18.2.7 Market Share and Competitive Position
- 18.2.8 Technology and Innovation Capabilities
- 18.2.9 Strategic Alliances or Partnerships
- 18.2.10 Recent Developments
- 18.2.11 Growth Strategy and Outlook
- 18.3 Samsung Electronics
- 18.4 Sony
- 18.5 Bose
- 18.6 Sonova Consumer Hearing
- 18.7 Other Relevant Market Participants
Note: Every listed company is profiled on the structure shown under the first company. The company list is preliminary and may change based on research findings, market developments, data availability and client requirements.
Chapter 19 Disclaimer
- 19.1 Research and Forecast Disclaimer
- 19.2 Data Source and Estimation Limitations
Note: The depth of individual sections depends on data availability for this market. Volume, capacity, trade and other unit-based metrics are included where applicable.

