
Skill shortages and premium ad tiers sustain hirer spending
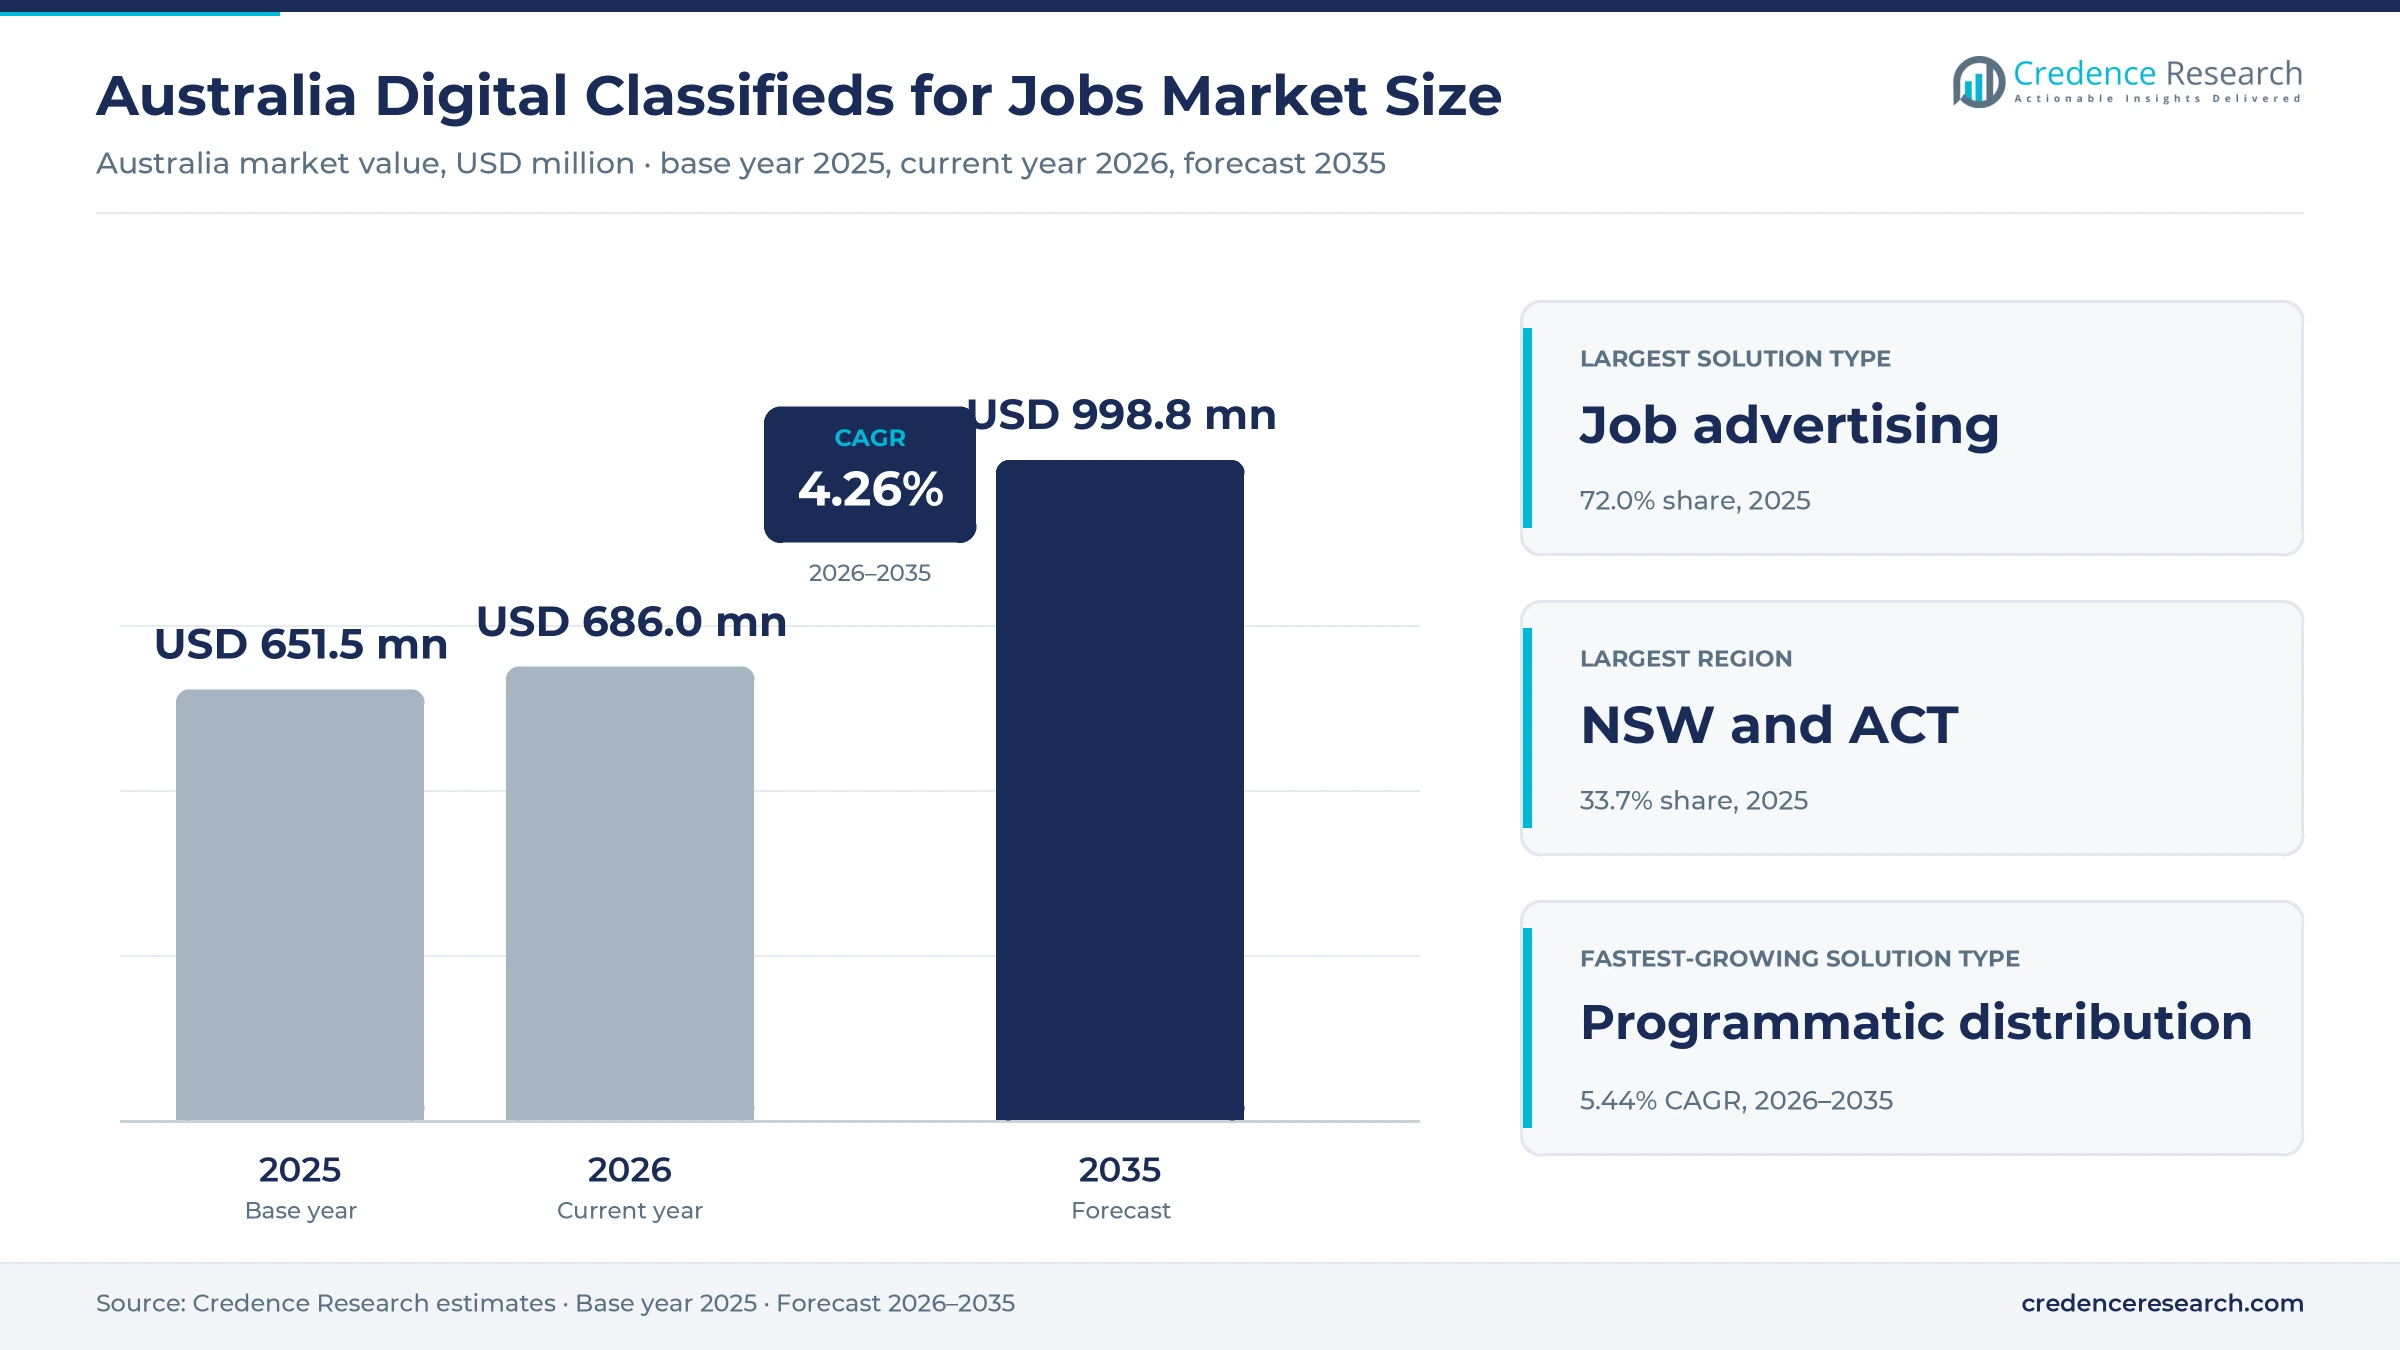
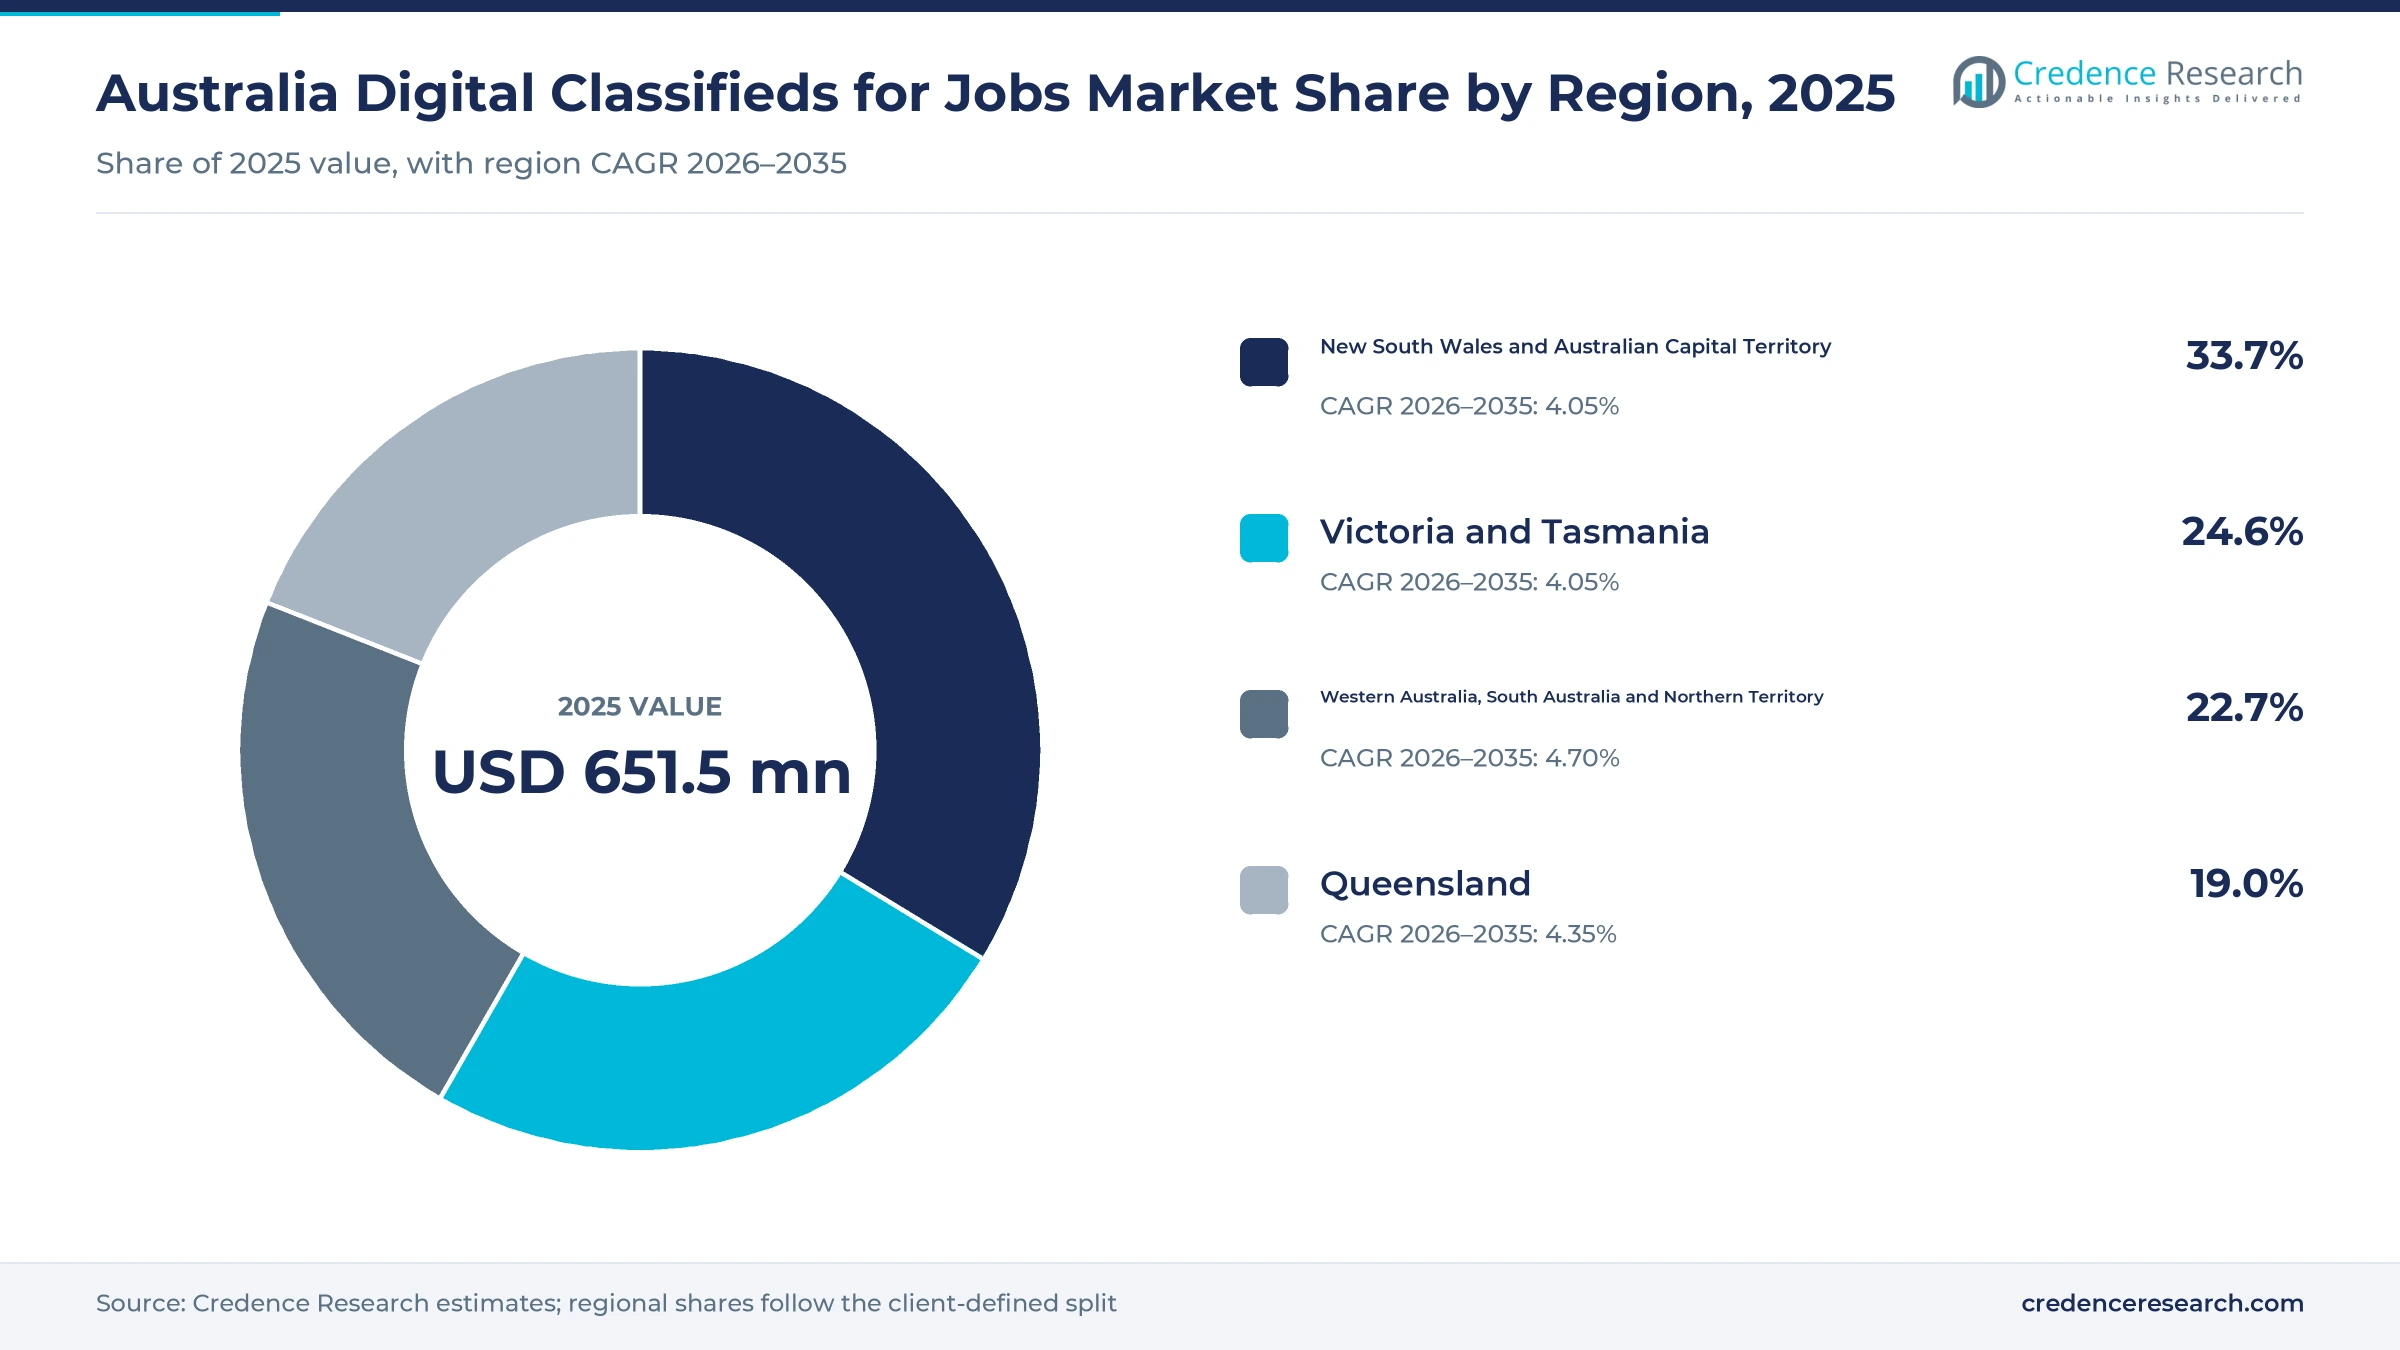
The Australia digital classifieds for jobs market was valued at USD 651.5 million in 2025 and is projected to increase from USD 686.0 million in 2026 to USD 998.8 million by 2035, registering a CAGR of 4.26% during 2026–2035. Spending comes from employers that pay to post vacancies, buy premium placement, search candidate profiles and distribute advertisements across partner sites, from sole traders hiring a first worker to hospital networks and national retailers. New South Wales and the Australian Capital Territory held the largest regional share, 33.7% in 2025, because Sydney and Canberra concentrate head offices, professional services and federal agencies. Western Australia, South Australia and the Northern Territory form the fastest-growing region at 4.70% a year, as Western Australia was the only state with more online job advertisements in June 2026 than a year earlier. Platforms are also shifting revenue from ad counts toward AI-enabled ad tiers and outcome-based pricing.
Which online hiring products are counted in this estimate?
The estimate measures what employers and recruiters in Australia spend on online job classifieds and related hiring products. It counts standard and premium job listings, subscription access to candidate databases and talent search tools, and performance-priced advertising that distributes vacancies across search engines, aggregators and partner sites.
The estimate excludes recruitment agency placement fees, applicant tracking software licenses sold on their own, and government employment services. The value chain runs from listing platforms and aggregators through recruitment agencies and in-house talent teams to employers of every size in each state and territory.
Australia Digital Classifieds for Jobs Market Insights
- The Australia digital classifieds for jobs market was valued at USD 651.5 million in 2025 and is projected to reach USD 998.8 million by 2035, registering a CAGR of 4.26% during 2026–2035.
- New South Wales and the Australian Capital Territory held a 33.7% share of 2025 value, because Sydney and Canberra concentrate head offices and public agencies.
- Job advertising led with a 72.0% share of 2025 value, because most employers still buy paid listings for each vacancy they need to fill.
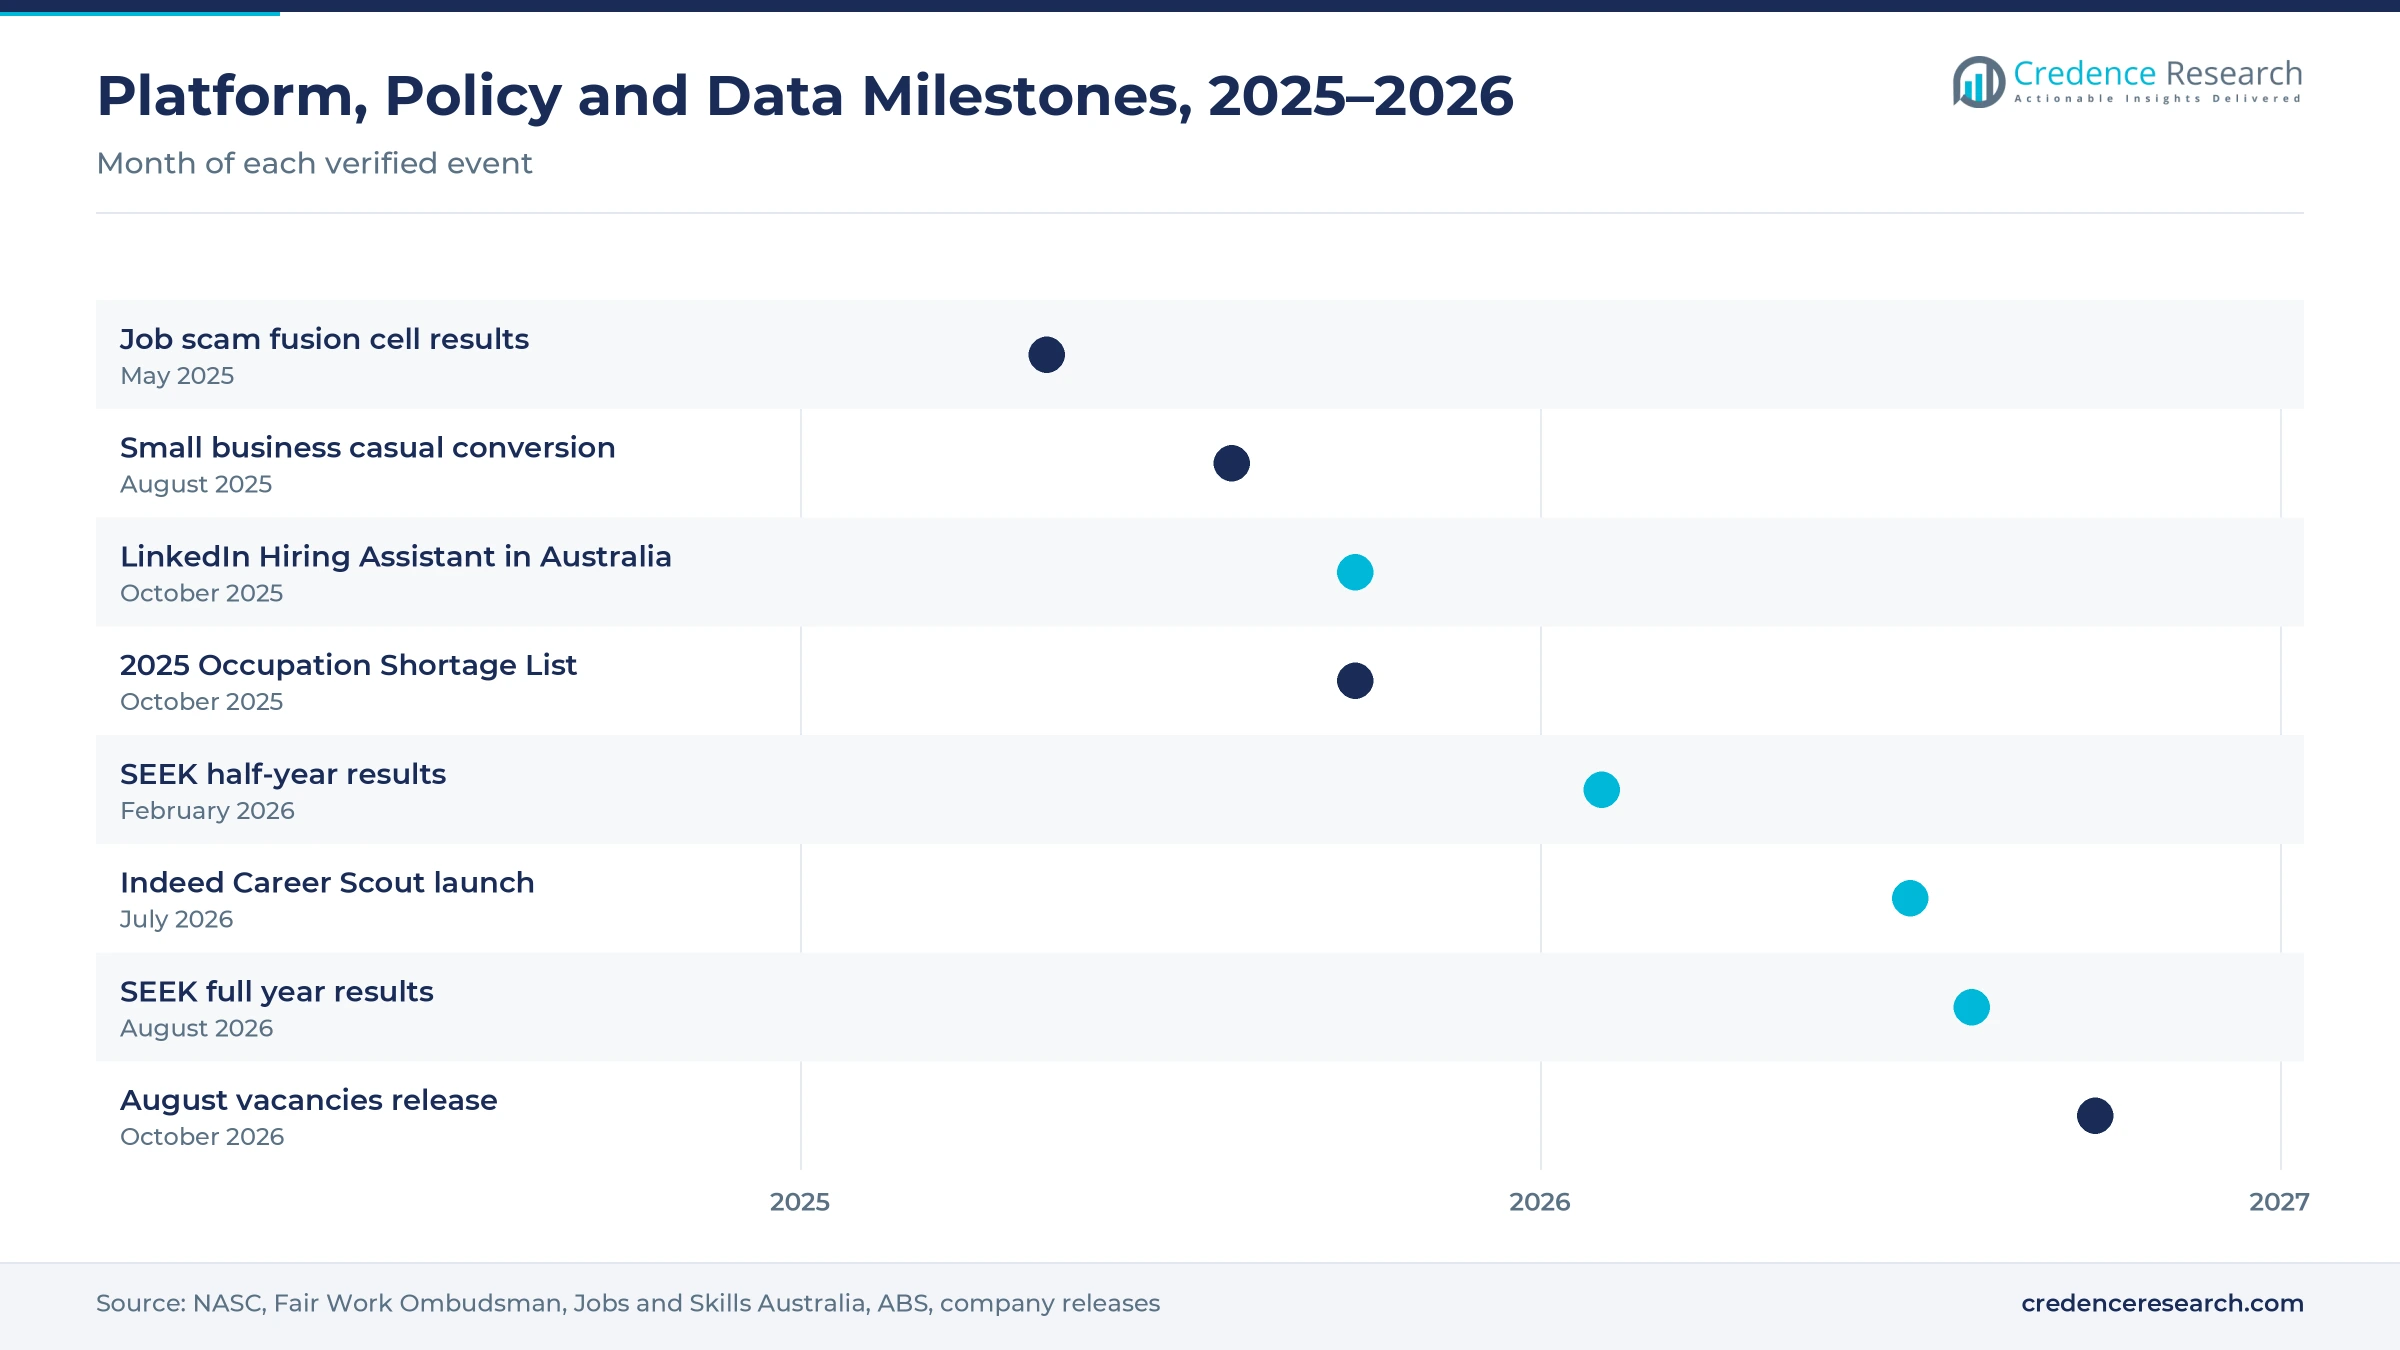
- The 2025 Occupation Shortage List, released in October 2025, placed 29% of 1,022 assessed occupations in shortage, which keeps skilled hiring competitive.
- Programmatic distribution grows fastest at 5.44% a year during 2026–2035, as performance-priced ads spread vacancies across search engines and partner sites.
Listings lead while sourcing and distribution grow faster
Why do paid listings still hold most of the spending?
Based on solution type, the market is categorized into job advertising, talent sourcing access and programmatic distribution. Job advertising led with a 72.0% share of 2025 value, because most employers still pay for a listing each time they open a vacancy. Programmatic distribution grows fastest at 5.44% a year, as employers pay per click or per applicant to reach candidates on search engines and partner sites.
How do permanent, fixed-term and casual vacancies differ?
Based on application, the market is categorized into permanent hiring, fixed-term hiring and casual hiring. Permanent hiring led with a 63.0% share of 2025 value, because employers buy longer and more visible listings for ongoing positions. Fixed-term hiring grows fastest at 4.65% a year, as project work in construction, health and government relies on contracts of set length.
Which industries spend the most on online hiring ads?
Based on end-use industry, the market is categorized into business and professional services, health and education, goods and infrastructure, and consumer and public services. Business and professional services led with a 34.0% share of 2025 value, because office-based employers advertise most vacancies online. Health and education grows fastest at 4.72% a year, as nurses, carers and teachers remain hard to recruit.
How does employer size shape buying patterns?
Based on enterprise size, the market is categorized into micro employers, small employers, medium employers and large employers. Large employers led with a 31.0% share of 2025 value, because they hire continuously and buy subscription access and bulk listings. Micro employers grow fastest at 4.63% a year, as sole traders and very small firms move from word of mouth to paid listings.
| Segment Group | Leading Sub-segment | Share, 2025 | Fastest-growing Sub-segment | CAGR, 2026–2035 |
|---|---|---|---|---|
| By Solution Type | Job advertising | 72.0% | Programmatic distribution | 5.44% |
| By Application | Permanent hiring | 63.0% | Fixed-term hiring | 4.65% |
| By End-Use Industry | Business and professional services | 34.0% | Health and education | 4.72% |
| By Enterprise Size | Large employers | 31.0% | Micro employers | 4.63% |
Request a Free Sample
Fill in your details and we'll send you a free sample report.
- Sample data tables & charts
- Research methodology
Shortages, repeat hirers and premium tiers drive spending
How do persistent occupational shortages keep hirers paying?
Employers that cannot fill skilled positions quickly advertise for longer, buy premium placement and search candidate databases, which keeps listing spending firm even when total vacancies ease. The 2025 Occupation Shortage List from Jobs and Skills Australia found 293 of 1,022 assessed occupations in shortage, or 29%, down from 33% in 2024. Almost one in two technicians and trades occupations remained in shortage, mainly in construction, engineering and automotive trades. Nurses and care workers stayed among the occupations in persistent shortage from 2021 to 2025, and the recruitment difficulty rate was still 44% in June 2025. Permanent hiring, which covers most of these skilled positions, holds 63.0% of 2025 value, as employers compete for scarce trades and care workers with longer, more visible listings.
Why does repeat employer demand support listing income?
Job platforms must keep winning employers that recruit only a few times a year, which makes repeat acquisition of small firms a steady source of listing income. Australia had 2,741,087 actively trading small businesses at June 30, 2026, and firms with fewer than 20 employees made up 97% of all trading businesses, according to the Australian Small Business and Family Enterprise Ombudsman. The national labor force reached about 15.13 million people in 2025, according to the World Bank, which gives platforms a large candidate audience to sell against. Because staff turnover reopens positions every year, the same firms return to buy listings again. Against this base, Micro employers grow fastest at 4.63% a year, as more sole traders advertise online.
How do premium products and workflow tools raise yield?
Platforms now charge more for each listing through tiered products and AI features, which lets income rise even when advertisement counts fall. SEEK reported Australian job ad volumes down 2% in fiscal 2026, while ANZ yield rose 14%, helped by upgraded ad tiers and the Advanced ad, according to its full year results announcement of Aug. 12, 2026. In its half-year results, the company said yield grew 17% on variable pricing and that its placement share lead in Australia reached 4.9 times the nearest competitor. LinkedIn made Hiring Assistant, an AI agent that sources, screens and contacts candidates, available in Australia on Oct. 1, 2025. As a result, talent sourcing access and performance products take a larger share of hirer budgets each year.
Why do casual conversion rules shift the hiring mix?
Workplace law changes push some employers to recruit for permanent and fixed-term positions instead of casual shifts, which changes the listings they buy. From Aug. 26, 2025, eligible casual employees of small businesses could notify their employer that they want full-time or part-time work, according to the Fair Work Ombudsman. The casual share of employees fell to 19.5% in August 2025 from 20.4% a year earlier, and 2.4 million people still worked as casual employees, according to the Australian Bureau of Statistics. Another 459,000 employees, or 3.7%, were on fixed-term contracts in the same survey. With casual shares falling and contracts steady, Fixed-term hiring grows fastest at 4.65% a year, while casual hiring loses share through 2035.
AI agents, regional hiring and anti-scam tools reshape ads
How is the rise of AI career agents changing job search?
Job platforms now add AI assistants that recommend positions, refine resumes and contact candidates, which raises the value of profile data and premium matching. Indeed launched Career Scout for Australian job seekers on July 16, 2026, and the release reported by IT Brief Australia said 43% of local job seekers see finding the right opportunities as their biggest hurdle. The same survey found that 55% wished they knew which positions their skills qualified them for. Engineering firm Aurecon reported a roughly 30% cut in candidate sourcing time after adopting LinkedIn Hiring Assistant, according to Mediaweek. These tools favor talent sourcing access, although job advertising still holds 72.0% of 2025 value.
Why does regional hiring growth matter for platforms?
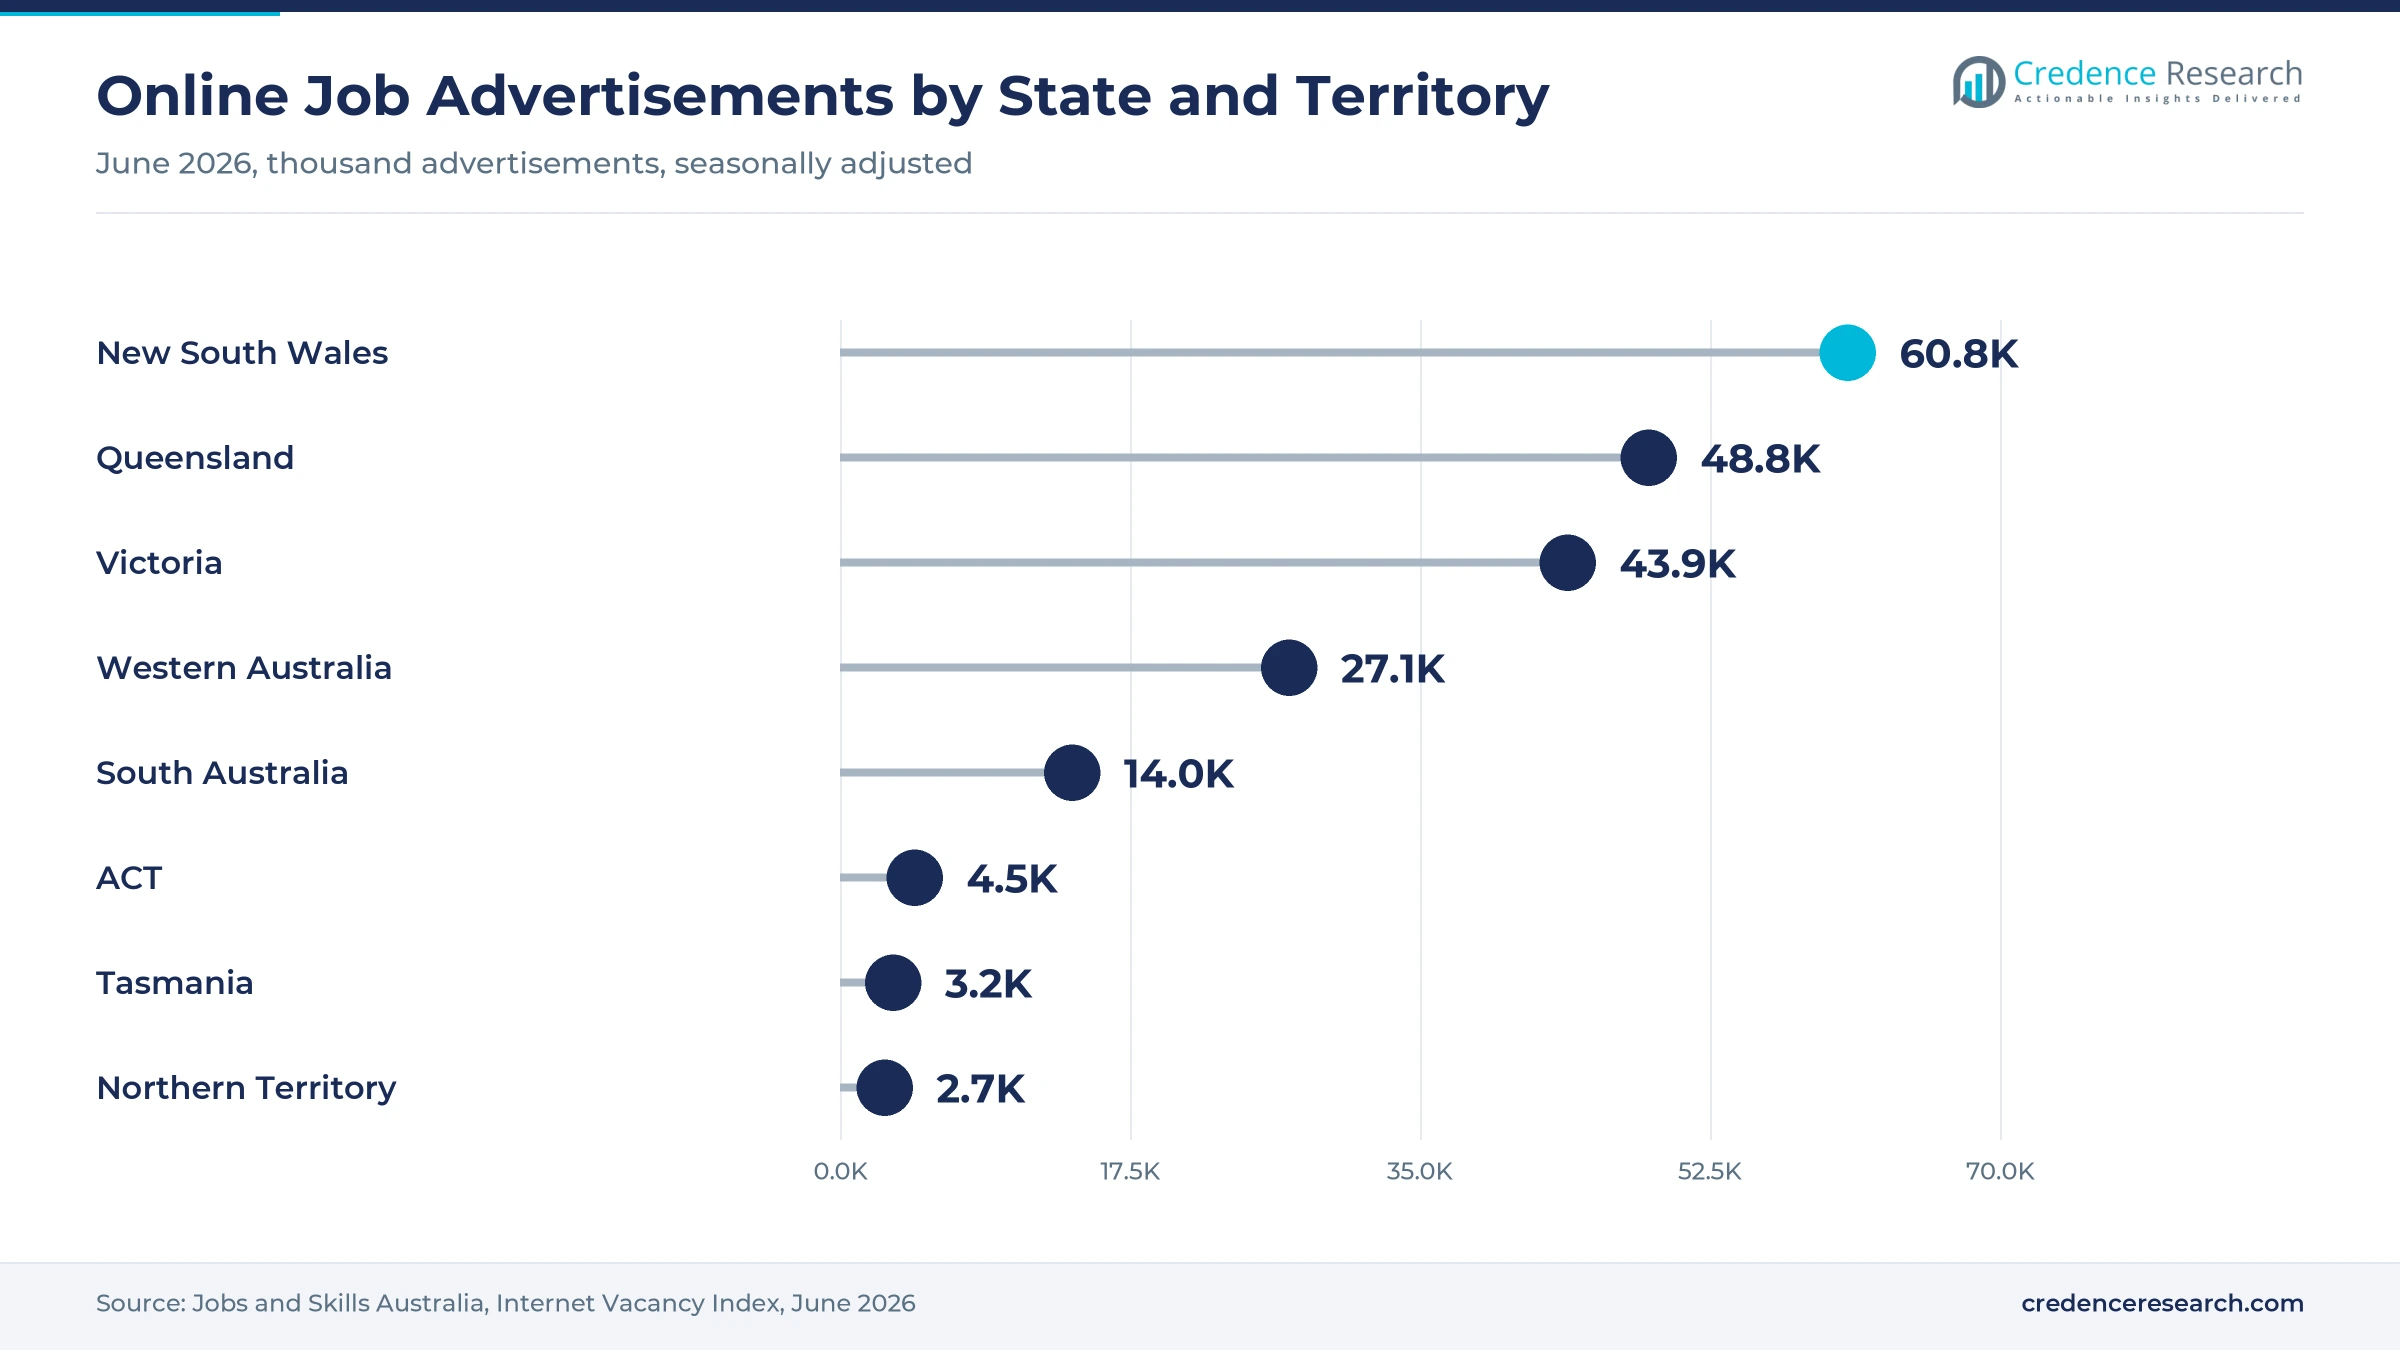
Online vacancies are moving away from capital cities and toward mining, logistics and regional service economies, which changes where platforms win new employers. Jobs and Skills Australia counted 205,400 online job advertisements in June 2026, down 3.9% on the year. Capital cities still held 70.2% of advertisements but fell 3.2%, while regional areas rose 1.8% over the same 12 months. Western Australia was the only state with growth, up 2.7% to 27,100 advertisements, and machinery operators and drivers were the only occupation group to rise strongly, up 7.2%. As a result, the Western Australia, South Australia and Northern Territory zone grows faster than any other zone through 2035.
Is there room for verified listings as job scams grow?
Fake job advertisements damage trust in open classifieds, which creates an opening for platforms that verify employers and screen postings before they go live. Scamwatch received more than 3,000 job scam reports in 2024, with reported losses of AUD 13.7 million, according to the National Anti-Scam Centre. A job scam fusion cell that ran from September 2024 to March 2025 worked with Meta to remove 29,000 social media accounts and referred 1,850 scam websites and fake job advertisements for removal. Average losses to job scams were also 5.1% higher than for other scam types. In turn, platforms with checked employer accounts can charge for trust, which supports listing prices for large employers.
Can public sector and health hiring offset private weakness?
Public employers, retailers and health and education providers keep recruiting while some office-based industries pull back, which opens room for platforms with strong public and care audiences. The Australian Bureau of Statistics counted 325,000 job vacancies in August 2026, down 1.3% on the year. Public sector vacancies rose 7.8% in the quarter while private sector vacancies fell 2.0%. Retail trade vacancies rose 24.5% and financial and insurance services rose 14.1% over the same three months. Community and personal service workers also gained 2.2% in online advertisements in June 2026. Because care and education hiring holds up better than office hiring, health and education employers grow at 4.72% a year, the fastest end-use rate.
Softer hiring, price pushback and applicant overload
How does a softer labor market cut advertisement volumes?
Rising unemployment means fewer employers open new positions, which reduces the number of paid listings. The unemployment rate rose to 4.7% in September 2026 as employment fell by 39,000 people, according to the Australian Bureau of Statistics. SEEK said its base case for fiscal 2027 assumes a lower-volume environment. As a result, platforms depend on price and product upgrades for growth, which leaves them exposed if employers resist higher charges.
Why do higher listing prices risk employer pushback?
Several years of yield increases raise the cost of each hire for small firms, which may push some toward free channels, social media and referrals. SEEK said ANZ yield grew 17% in the first half of fiscal 2026, largely because of pricing changes made in fiscal 2025. Small firms watch hiring budgets closely and often recruit only once or twice a year. In turn, platforms need clear evidence of better candidates to keep these employers buying premium listings.
How does applicant overload raise screening costs?
Easy online applications flood employers with unsuitable candidates, which raises screening effort and weakens the perceived value of a listing. Employers received 27.5 applicants per vacancy in 2024–25 but only 4.3 suitable applicants, according to Jobs and Skills Australia. Small firms without dedicated talent teams feel this burden the most. As a result, platforms invest in screening questions, ranking and AI shortlisting to protect the value of paid placement.
Why does the white-collar slowdown weigh on spending?
Office-based employers buy many of the most expensive listings, so weaker professional hiring hits revenue harder than volume suggests. Online advertisements for clerical and administrative workers fell 8.8% in the year to June 2026, and sales worker advertisements fell 9.4%. Professional, scientific and technical services vacancies fell 17.3% in the three months to August 2026. In turn, business and professional services lose share through 2035.
Sydney and Canberra lead while western states grow fastest
| Region | Value, 2025 (USD million) | Share, 2025 | CAGR, 2026–2035 |
|---|---|---|---|
| New South Wales and Australian Capital Territory | 219.6 | 33.7% | 4.05% |
| Victoria and Tasmania | 160.3 | 24.6% | 4.05% |
| Western Australia, South Australia and Northern Territory | 147.9 | 22.7% | 4.70% |
| Queensland | 123.8 | 19.0% | 4.35% |
New South Wales and the ACT lead on head office hiring
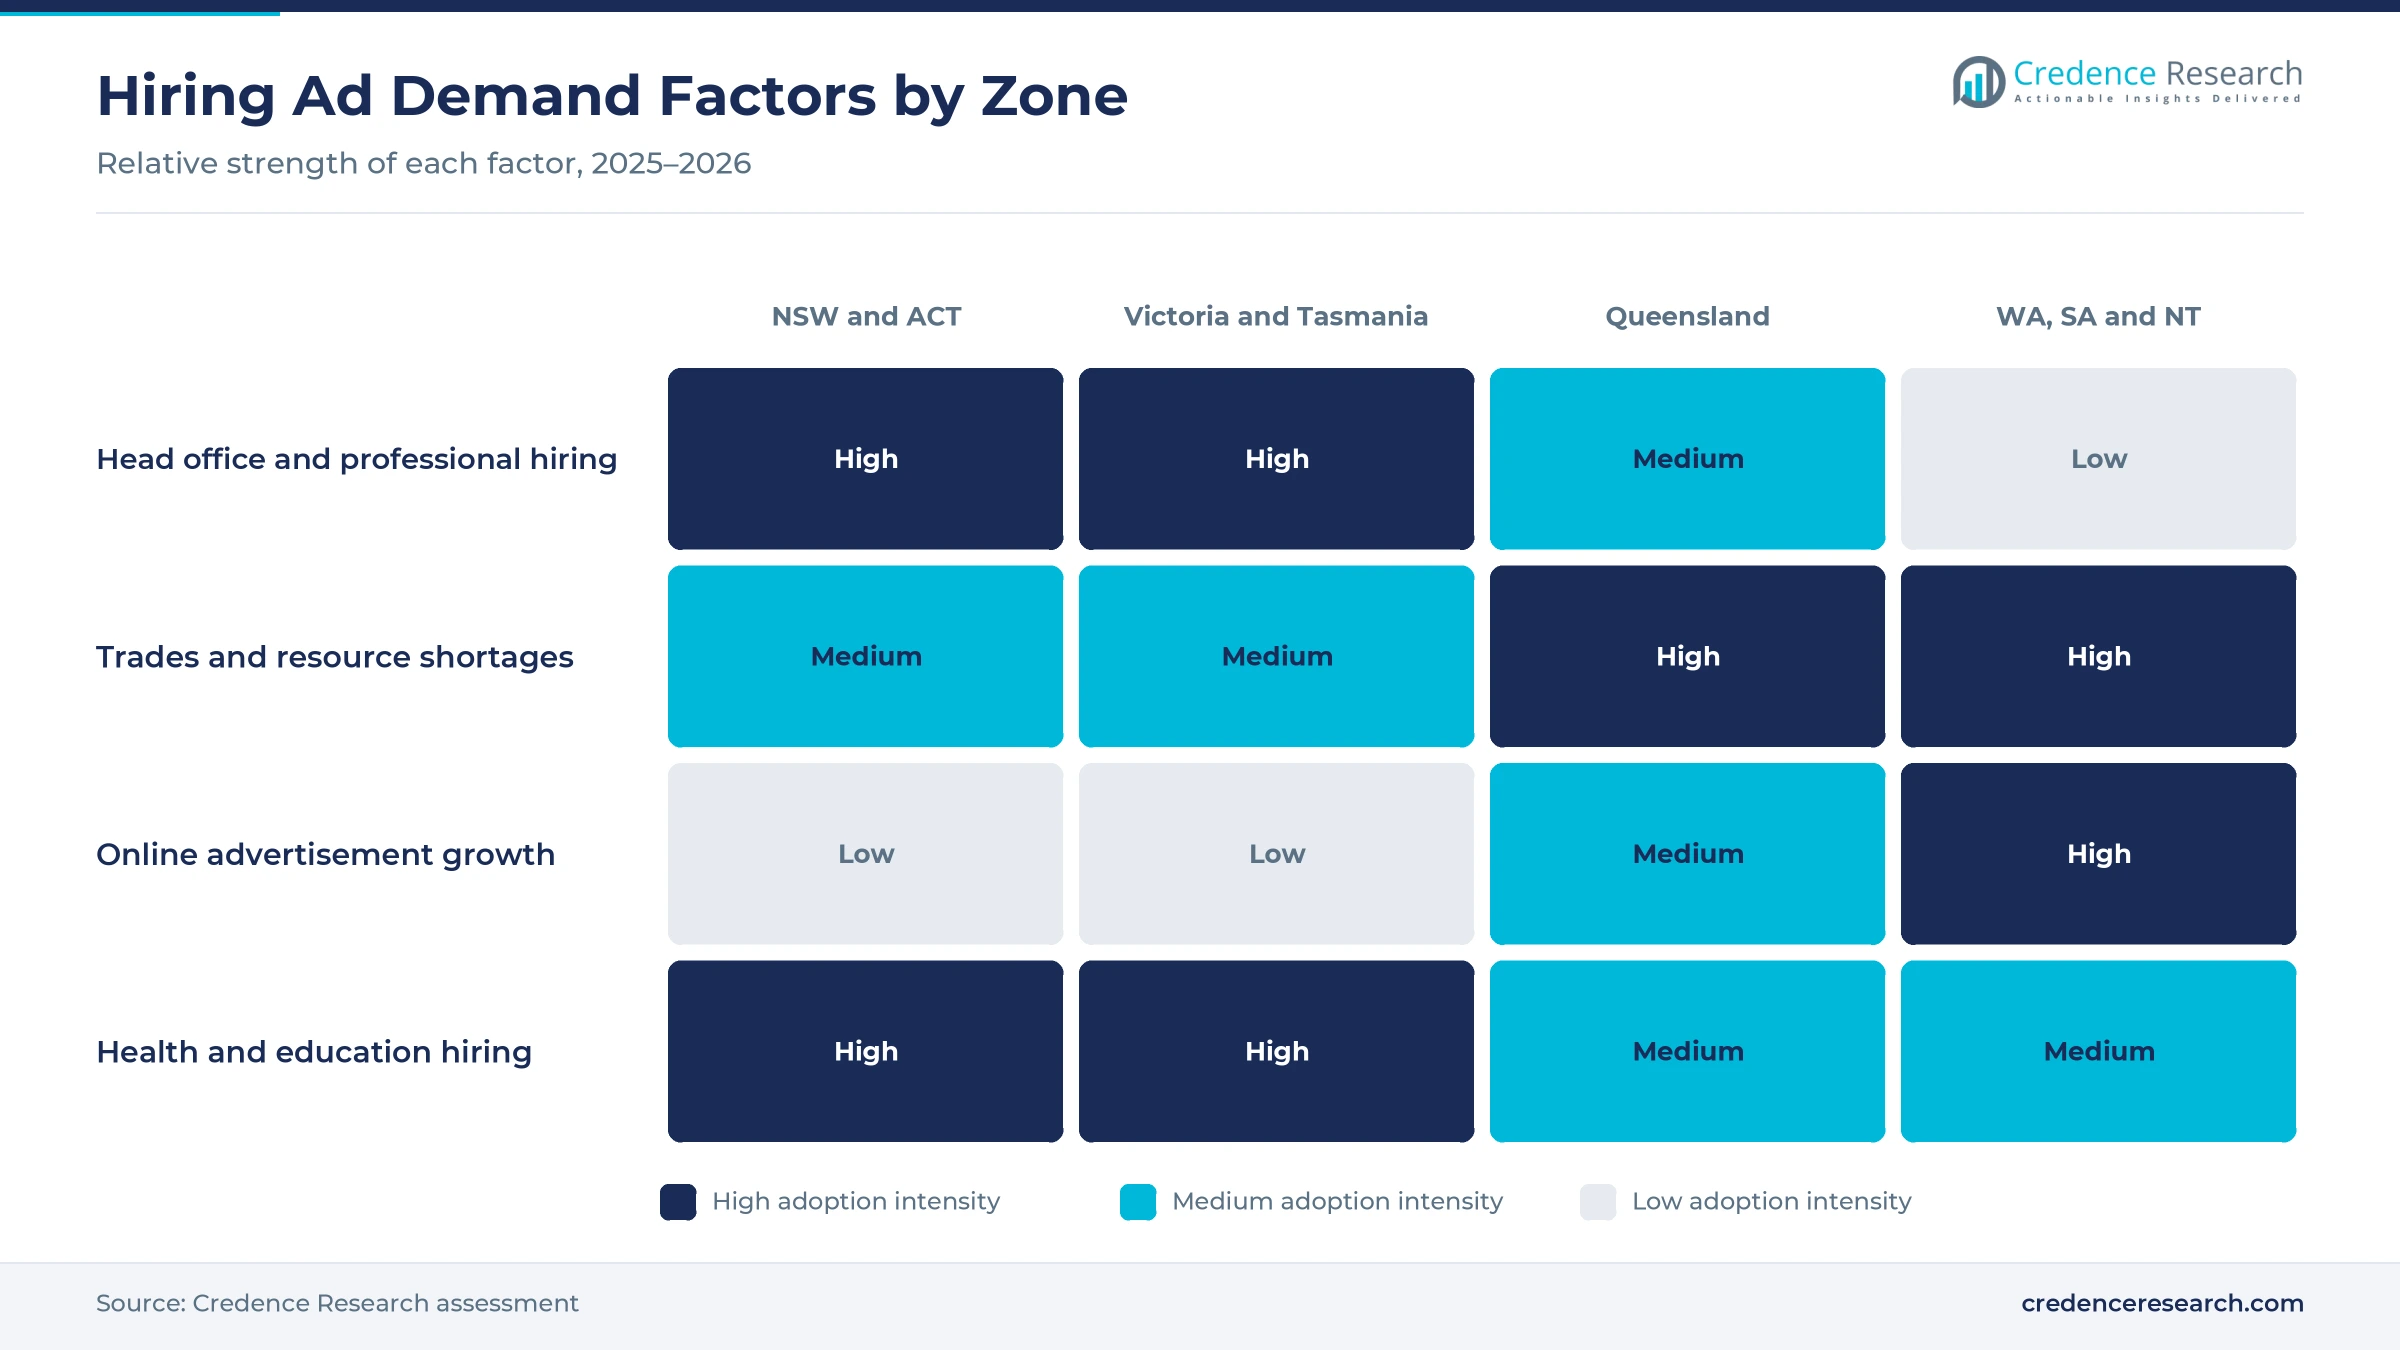
New South Wales and the Australian Capital Territory held a 33.7% share of 2025 value and grow at 4.05% a year. New South Wales recorded 60,800 online job advertisements in June 2026, the most of any state, though the count fell 4.4% on the year. Canberra adds federal agency recruitment, but vacancies in the territory fell 21.9% in the three months to August 2026. As a result, the zone stays largest while growing slightly below the national rate.
Why do Victoria and Tasmania hold the second share?
Victoria and Tasmania held a 24.6% share of 2025 value and grow at 4.05% a year, because Melbourne supports a broad base of professional, health and education employers. Victoria counted 43,900 online job advertisements in June 2026, down 5.3% on the year, while Tasmania counted 3,200. Victorian vacancies still rose 1.4% in the three months to August 2026, which points to a steadier second half for hiring. In turn, the zone keeps its share close to the 2025 level.
What keeps Queensland near the national growth rate?
Queensland held a 19.0% share of 2025 value and grows at 4.35% a year, because the state combines tourism, construction and health hiring with a large regional workforce. Queensland counted 48,800 online job advertisements in June 2026, more than Victoria, although the count fell 6.2% on the year. Advertisements rose 1.0% during the month, which suggests the decline is easing. As a result, regional and trades hiring keeps the state close to the national rate through 2035.
Why do Western Australia, SA and the NT grow fastest?
Western Australia, South Australia and the Northern Territory held a 22.7% share of 2025 value and grow fastest at 4.70% a year. Western Australia recorded 27,100 online job advertisements in June 2026, up 2.7% on the year, while South Australia was nearly flat at 14,000. South Australian vacancies also rose 5.8% in the three months to August 2026. As a result, resource, defense and logistics employers lift spending fastest in this zone.
AI launches, shortage data and platform results, 2025–2026
| Development | Status and market relevance |
|---|---|
| In October 2025, LinkedIn made Hiring Assistant, its first AI recruiting agent, available to recruiters in Australia. | Brings automated sourcing and outreach to local hirers |
| In October 2025, Jobs and Skills Australia released the 2025 Occupation Shortage List, with 29% of assessed occupations in shortage. | Confirms persistent trades, health and care shortages |
| In February 2026, SEEK reported that ANZ yield grew 17% in the first half on AI-enabled ad tiers and variable pricing. | Shows premium products lifting spend per listing |
| In July 2026, Indeed launched Career Scout, an AI career assistant, for Australian job seekers. | Raises competition in candidate matching |
| In August 2026, SEEK reported Australian job ad volumes down 2% in fiscal 2026 while ANZ yield rose 14%. | Confirms the shift from volume to yield |
AI matching, tiered pricing and ad distribution
- AI matching and recruiting agents rank candidates on skills, write outreach and shortlist applicants, which links listings with recruitment software and screening workflows.
- Tiered and variable pricing engines set the price of each listing by occupation, location and expected demand, which lets platforms sell premium tiers and outcome-based products instead of one flat fee.
- Programmatic distribution networks push vacancies to search engines, aggregators and partner publishers on a per-click or per-applicant basis, which extends reach for online recruitment campaigns beyond one site.
Need a Custom Version of This Report?
Tailor the scope, geography, or segments to your exact requirements.
- Custom geography or segment scope
- Direct access to our analyst team
One dominant local platform faces global AI-led rivals
Competition centers on one dominant local platform and several global rivals that use AI and large candidate networks. SEEK leads paid listings and reported a placement share lead of 4.9 times its nearest competitor in Australia, while its income now grows through premium ad tiers rather than volume. LinkedIn Talent Solutions competes for professional and corporate hiring through profile search and its Hiring Assistant agent. Indeed competes on reach and free job seeker tools, adding Career Scout in July 2026. Adzuna aggregates vacancies and sells employer listings, and CareerOne powers the 7NEWS.com.au jobs portal. Rivals compete on candidate quality, price per hire and integration with staffing technology used by recruiters. Because hirers now judge platforms on outcomes, data and matching quality matter more than listing counts.
Which platforms lead Australian online hiring ads?
| Company | Type | Role in the market |
|---|---|---|
| SEEK | Local listing platform | Australian volumes down 2% and ANZ yield up 14% in fiscal 2026 |
| LinkedIn Talent Solutions | Professional network | Hiring Assistant available in Australia from Oct. 1, 2025 |
| Indeed | Job search platform | Launched Career Scout for Australian job seekers on July 16, 2026 |
| Adzuna | Job search aggregator | Sells employer listings and distributes ads to regional community job boards |
| CareerOne | Listing platform | Powers the 7NEWS.com.au jobs portal, launched in March 2023 |
Credence Research view on Australian hiring ad spending
Credence Research's view is that Australian spending on online hiring ads will keep growing even as vacancy counts drift lower, because platforms are moving from selling listings to selling outcomes. Skill shortages in trades, health and care keep employers paying for premium placement and candidate search. AI agents and variable pricing raise spending per vacancy, while scam controls add value to verified listings. Platforms that combine deep candidate data, transparent pricing for small employers and strong regional reach should gain the most from the Australia digital classifieds for jobs opportunity through 2035.
How the national online recruitment ad estimate was built
The report uses 2025 as the base year on a calendar basis, and market values come from the Credence Research model. That model combines official online job advertisement and vacancy statistics, labor force and working arrangement data, small business counts, World Bank labor force data and listed-company operating disclosures. Segment splits and zone growth rates are Credence Research estimates, while zone shares follow the client-defined split. Sources used are official statistics, regulator publications, exchange filings and company releases, and Credence Research conducted no interviews or surveys of its own for this report.
Sourcing tools and western hiring lead growth to 2035
Spending is expected to reach USD 998.8 million by 2035, a 4.26% CAGR during 2026–2035, as employers pay more for each vacancy through premium tiers, sourcing tools and performance advertising. Growth should come from programmatic distribution, fixed-term hiring, health and education employers and Western Australia, South Australia and Northern Territory. A recovery in vacancies would add volume, while a deeper downturn or employer pushback on prices would slow smaller platforms. Firms that link listings with human resources analytics and verified employer data are expected to gain share as Australian online hiring matures.
Frequently Asked Questions
How big is the Australia digital classifieds for jobs market?
Which solution type leads Australian online hiring ads?
Which region leads the Australian market?
How do skill shortages affect spending on job ads?
Why can spending rise when ad volumes fall?
How is AI changing online hiring in Australia?
Who are the leading companies in the Australian market?
What are the main challenges for job ad platforms?
Table of Content
Chapter 1 Market Segmentation
- 1.1 Segmentation Framework
- 1.1.1 Product and Service Classification
- 1.1.2 Application and End-Use Classification
- 1.1.3 Technology and Solution Classification
- 1.1.4 Customer and Distribution Channel Classification
- 1.1.5 Geographic Segmentation
- 1.1.6 Market Segment Definitions and Boundaries
- 1.2 By Solution Type
- 1.2.1 Job advertising
- 1.2.2 Talent sourcing access
- 1.2.3 Programmatic distribution
- 1.3 By Application
- 1.3.1 Permanent hiring
- 1.3.2 Fixed-term hiring
- 1.3.3 Casual hiring
- 1.4 By End-Use Industry
- 1.4.1 Business and professional services
- 1.4.2 Health and education
- 1.4.3 Goods and infrastructure
- 1.4.4 Consumer and public services
- 1.5 By Enterprise Size
- 1.5.1 Micro employers
- 1.5.2 Small employers
- 1.5.3 Medium employers
- 1.5.4 Large employers
Chapter 2 Introduction
- 2.1 Report Objectives and Scope
- 2.2 Product Definition and Industry Terminology
- 2.3 Market Inclusions and Exclusions
- 2.4 Research Process
- 2.4.1 Primary Research and Expert Interviews
- 2.4.2 Secondary Research and Source Review
- 2.4.3 Top-Down and Bottom-Up Estimation
- 2.4.4 Data Triangulation and Verification
- 2.5 Market Size Measurement Basis
- 2.5.1 2025: USD 651.5 million → 2035: USD 998.8 million
- 2.6 Historical and Forecast Reference Periods
- 2.6.1 Historical Period: 2018-2025
- 2.6.2 Base Year: 2025
- 2.6.3 Forecast Period: 2025-2035
- 2.7 Research Assumptions and Limitations
Chapter 3 Executive Summary
- 3.1 Market Snapshot and Key Findings
- 3.2 Base-Year Market Size, 2025
- 3.3 Forecast Market Size, 2035
- 3.4 Revenue and Volume Growth Outlook
- 3.5 Key Demand and Supply Indicators
- 3.6 Leading Market Segments
- 3.7 Fastest-Growing Market Opportunities
- 3.8 Regional Performance Highlights
- 3.9 Technology and Industry Transformation
- 3.10 Competitive Landscape Summary
- 3.11 Analyst View and Strategic Implications
Chapter 4 Australia Digital Classifieds for Jobs Market Trends and Developments
- 4.1 Historical Industry Development, 2018-2025
- 4.2 Recent Market Trends and Developments
- 4.3 Demand and Customer Behavior Trends
- 4.4 Technology and Product Innovation
- 4.5 Artificial Intelligence, Automation and Digitalization
- 4.6 Local Manufacturing and Supply Chain Realignment
- 4.7 Industry Partnerships, Mergers and Acquisitions
- 4.8 Sustainability and Circular Economy Developments
- 4.9 Government and Private Sector Investment Trends
- 4.10 Emerging Business Models and Commercialization
- 4.11 Industry Developments and Announcements
Chapter 5 Australia Digital Classifieds for Jobs Market Production, Supply and Demand Analysis
- 5.1 Demand Trend and Consumption Analysis, 2018-2025
- 5.2 Demand Forecast, 2025-2035
- 5.3 Production and Output Trend, 2018-2025
- 5.4 Production and Output Forecast, 2025-2035
- 5.5 Installed Capacity and Capacity Utilization
- 5.6 Company-Wise Production Plants and Statistics
- 5.6.1 Installed Production Capacity
- 5.6.2 Actual Production
- 5.6.3 Planned Capacity and Expansion Targets
- 5.7 Supply Chain Structure and Procurement Trends
- 5.8 Supply-Demand Gap and Bottlenecks
- 5.9 Import Dependence and Sourcing Structure
- 5.10 Contract Manufacturing and Outsourcing
- 5.11 Regional Supply and Demand Concentration
Chapter 6 Australia Digital Classifieds for Jobs Market Pricing Analysis
- 6.1 Pricing Structure and Measurement
- 6.2 Historical Pricing Trends, 2018-2025
- 6.3 Pricing Outlook, 2025-2035
- 6.4 Average Selling Price and Unit Economics
- 6.5 Pricing by Product and Market Segment
- 6.6 Geographic Pricing Differences
- 6.7 Key Input, Energy, Labor and Logistics Costs
- 6.8 Contract Pricing and Purchasing Models
- 6.9 Pricing Sensitivity and Competitive Positioning
- 6.10 Price, Margin and Profitability Implications
Chapter 7 Australia Digital Classifieds for Jobs Market Dynamics
- 7.1 Market Growth Drivers
- 7.1.1 Demand-Side Drivers
- 7.1.2 Technology and Innovation Drivers
- 7.1.3 Infrastructure and Investment Drivers
- 7.1.4 Regulatory and Policy Drivers
- 7.2 Market Restraints
- 7.2.1 Cost and Affordability Constraints
- 7.2.2 Technology and Adoption Barriers
- 7.2.3 Supply Chain and Operational Constraints
- 7.3 Market Challenges
- 7.3.1 Competitive Pressure and Margin Erosion
- 7.3.2 Skills, Infrastructure and Implementation Gaps
- 7.4 Emerging Market Opportunities
- 7.5 Market Dynamics Impact and Time-Horizon Assessment
Chapter 8 Australia Digital Classifieds for Jobs Value Chain Analysis
- 8.1 Industry Value Chain Overview
- 8.2 Upstream Suppliers and Critical Inputs
- 8.3 Technology and Component Providers
- 8.4 Manufacturing or Service Delivery
- 8.5 Distribution, Channel Partners and Integrators
- 8.6 Downstream Applications and End Users
- 8.7 Value Addition and Profit Pools
- 8.8 Vertical Integration and Outsourcing
- 8.9 Supplier Concentration and Risk
- 8.10 Supply Chain Localization and Resilience
Chapter 9 Australia Digital Classifieds for Jobs Market Regulations and Policies
- 9.1 Relevant Laws, Standards and Compliance Frameworks
- 9.2 Product, Service, Safety and Quality Requirements
- 9.3 Government Policies, Incentives and Subsidies
- 9.4 Imports, Exports and Trade Barriers
- 9.5 Public Procurement and Local Content Requirements
- 9.6 Environmental and Sustainability Compliance
- 9.7 Data Protection, AI and Cybersecurity Compliance
- 9.8 Upcoming Policy Changes and Market Implications
Chapter 10 Australia Digital Classifieds for Jobs Market Hotspots and Opportunities
- 10.1 Market Opportunity Mapping and Growth Hotspots
- 10.2 High-Growth Applications and Customer Groups
- 10.3 Underserved Markets and White-Space Opportunities
- 10.4 Emerging Technology and Product Opportunities
- 10.5 New Capacity and Investment Hotspots
- 10.6 Market Entry and Expansion Opportunities
- 10.7 Distribution and Partnership Opportunities
- 10.8 Near-Term and Long-Term Commercial Potential
- 10.9 Opportunity Attractiveness and Execution Risks
Chapter 11 Australia Digital Classifieds for Jobs Market Outlook, 2025-2035
- 11.1 Market Size and Analysis
- 11.1.1 Revenue (Market Measurement: 2025: USD 651.5 million → 2035: USD 998.8 million)
- 11.1.2 Market Volume and Quantity Sold
- 11.1.3 Historical Market Size, 2018-2025
- 11.1.4 Base-Year Market Size, 2025
- 11.2 Market Forecast, 2025-2035
- 11.2.1 Revenue Forecast to 2035
- 11.2.2 Volume Forecast to 2035
- 11.2.3 CAGR and Year-on-Year Growth
- 11.2.4 Incremental Revenue Opportunity
- 11.3 Forecast Assumptions and Scenario Analysis
- 11.3.1 Base-Case Forecast
- 11.3.2 Optimistic and Conservative Scenarios
- 11.3.3 Technology, Pricing and Policy Sensitivities
- 11.4 Market Attractiveness and Growth Outlook
Chapter 12 Australia Digital Classifieds for Jobs Market Segmentation and Outlook
- 12.1 Segmentation Summary and Market Shares, 2025
- 12.2 Largest and Fastest-Growing Segments
- 12.3 By Solution Type - Market Size and Forecast, 2025-2035
- 12.3.1 Segment Definition and Scope
- 12.3.2 Historical Market Size, 2018-2025
- 12.3.3 Revenue Forecast, 2025-2035
- 12.3.4 Volume Forecast, 2025-2035
- 12.3.5 Base-Year Market Share, 2025
- 12.3.6 Segment CAGR and Growth Drivers
- 12.3.7 Subsegment Market Size and Forecast
- 12.3.7.1 Job advertising
- 12.3.7.2 Talent sourcing access
- 12.3.7.3 Programmatic distribution
- 12.3.8 Subsegment Pricing and Adoption Trends
- 12.3.9 Leading Suppliers and Competition
- 12.3.10 Regional Demand and Opportunities
- 12.4 By Application - Market Size and Forecast, 2025-2035
- 12.4.1 Segment Definition and Scope
- 12.4.2 Historical Market Size, 2018-2025
- 12.4.3 Revenue Forecast, 2025-2035
- 12.4.4 Volume Forecast, 2025-2035
- 12.4.5 Base-Year Market Share, 2025
- 12.4.6 Segment CAGR and Growth Drivers
- 12.4.7 Subsegment Market Size and Forecast
- 12.4.7.1 Permanent hiring
- 12.4.7.2 Fixed-term hiring
- 12.4.7.3 Casual hiring
- 12.4.8 Subsegment Pricing and Adoption Trends
- 12.4.9 Leading Suppliers and Competition
- 12.4.10 Regional Demand and Opportunities
- 12.5 By End-Use Industry - Market Size and Forecast, 2025-2035
- 12.5.1 Segment Definition and Scope
- 12.5.2 Historical Market Size, 2018-2025
- 12.5.3 Revenue Forecast, 2025-2035
- 12.5.4 Volume Forecast, 2025-2035
- 12.5.5 Base-Year Market Share, 2025
- 12.5.6 Segment CAGR and Growth Drivers
- 12.5.7 Subsegment Market Size and Forecast
- 12.5.7.1 Business and professional services
- 12.5.7.2 Health and education
- 12.5.7.3 Goods and infrastructure
- 12.5.7.4 Consumer and public services
- 12.5.8 Subsegment Pricing and Adoption Trends
- 12.5.9 Leading Suppliers and Competition
- 12.5.10 Regional Demand and Opportunities
- 12.6 By Enterprise Size - Market Size and Forecast, 2025-2035
- 12.6.1 Segment Definition and Scope
- 12.6.2 Historical Market Size, 2018-2025
- 12.6.3 Revenue Forecast, 2025-2035
- 12.6.4 Volume Forecast, 2025-2035
- 12.6.5 Base-Year Market Share, 2025
- 12.6.6 Segment CAGR and Growth Drivers
- 12.6.7 Subsegment Market Size and Forecast
- 12.6.7.1 Micro employers
- 12.6.7.2 Small employers
- 12.6.7.3 Medium employers
- 12.6.7.4 Large employers
- 12.6.8 Subsegment Pricing and Adoption Trends
- 12.6.9 Leading Suppliers and Competition
- 12.6.10 Regional Demand and Opportunities
- 12.7 Segment Growth Comparison
- 12.8 Segment Attractiveness and Priority Matrix
Chapter 13 Australia Digital Classifieds for Jobs End-Use and Application Market Outlook
- 13.1 End-Use Industry and Customer Demand Structure
- 13.2 Leading Applications and Customer Groups
- 13.3 End-Use Market Size, Share and Forecast
- 13.4 Major End-Use Industry Deep Dives
- 13.4.1 Customer Requirements and Use Cases
- 13.4.2 Demand and Replacement Cycles
- 13.4.3 Technical and Regulatory Considerations
- 13.4.4 Purchasing and Procurement Models
- 13.4.5 Leading Vendors and Distribution Channels
- 13.4.6 Forecast and Commercial Opportunities
- 13.5 Emerging Applications and Cross-Segment Demand
- 13.6 End-Use Industry Investment Priorities
Chapter 14 Australia Digital Classifieds for Jobs Geographic Market Outlook, 2025-2035
- 14.1 Domestic Market Distribution and Demand Clusters
- 14.2 State- or Province-Wise Market Size and Forecast, 2025-2035
- 14.3 City and Metropolitan Market Outlook
- 14.4 Industrial, Manufacturing and Commercial Clusters
- 14.5 Geographic Concentration of Key End Users
- 14.6 Local Pricing and Purchasing Differences
- 14.7 Domestic Production Facilities and Capacity Map
- 14.8 Local Infrastructure and Project Pipeline
- 14.9 State-Level Policy and Incentive Differences
- 14.10 Subnational Investment Hotspots and Opportunities
- 14.11 Distribution and Logistics Networks
- 14.12 Domestic Competitive Footprint
Chapter 15 Australia Digital Classifieds for Jobs Technology, Innovation and Sustainability Outlook
- 15.1 Technology Landscape and Maturity
- 15.2 Product, Process and Service Innovation
- 15.3 AI, Automation and Digital Tools in the Industry
- 15.4 Technology Adoption and Performance Benchmarking
- 15.5 Innovation Pipeline and R&D Investment
- 15.6 Patent and Intellectual Property Trends
- 15.7 Energy Efficiency and Resource Management
- 15.8 Sustainability, Recycling and Circularity
- 15.9 Technology Roadmap, 2025-2035
- 15.10 Risks of Obsolescence and Technology Substitution
Chapter 16 Australia Digital Classifieds for Jobs Market Key Strategic Imperatives
- 16.1 Growth and Market Entry Priorities
- 16.2 High-Return Products and Segments
- 16.3 Pricing, Profitability and Cost Optimization
- 16.4 Technology Investment and Product Differentiation
- 16.5 Supply Chain Localization and Resilience
- 16.6 Distribution and Customer Acquisition
- 16.7 Partnership, Acquisition and Capacity Strategy
- 16.8 Regional Expansion Priorities
- 16.9 Short-, Medium- and Long-Term Actions
Chapter 17 Competition Outlook
- 17.1 Industry Competition Characteristics
- 17.2 Market Structure and Concentration
- 17.3 Market Share and Competitive Positioning, 2025
- 17.4 Company-Wise Revenue and Product Benchmarking
- 17.5 Production and Service Capacity Benchmarking
- 17.6 Technology, Pricing and Differentiation
- 17.7 Regional Footprint and Distribution Strength
- 17.8 Mergers, Acquisitions and Strategic Alliances
- 17.9 New Entrants and Competitive Threats
- 17.10 Porter's Five Forces and Industry Attractiveness
- 17.11 Competitive Outlook, 2025-2035
Chapter 18 Company Profiles
- 18.1 Company Coverage and Selection Criteria
- 18.2 SEEK
- 18.2.1 Business Description
- 18.2.2 Company Ownership and Geographic Presence
- 18.2.3 Product and Service Portfolio
- 18.2.4 Manufacturing and Operating Footprint
- 18.2.5 Production Capacity and Expansion Plans
- 18.2.6 Financial Performance and Investment
- 18.2.7 Market Share and Competitive Position
- 18.2.8 Technology and Innovation Capabilities
- 18.2.9 Strategic Alliances or Partnerships
- 18.2.10 Recent Developments
- 18.2.11 Growth Strategy and Outlook
- 18.3 LinkedIn Talent Solutions
- 18.4 Indeed
- 18.5 Adzuna
- 18.6 CareerOne
- 18.7 Other Relevant Market Participants
Note: Every listed company is profiled on the structure shown under the first company. The company list is preliminary and may change based on research findings, market developments, data availability and client requirements.
Chapter 19 Disclaimer
- 19.1 Research and Forecast Disclaimer
- 19.2 Data Source and Estimation Limitations
Note: The depth of individual sections depends on data availability for this market. Volume, capacity, trade and other unit-based metrics are included where applicable.

