Market Overview
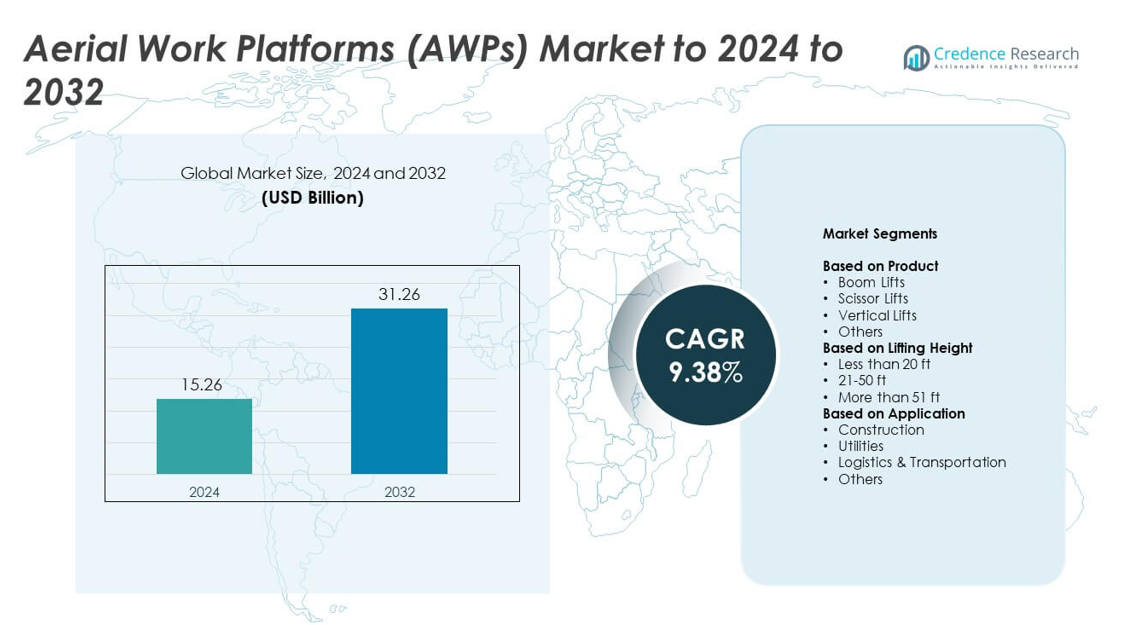
Aerial Work Platforms (AWPs) Market size was valued at USD 15.26 billion in 2024 and is anticipated to reach USD 31.26 billion by 2032, growing at a CAGR of 9.38% during the forecast period.
| REPORT ATTRIBUTE |
DETAILS |
| Historical Period |
2020-2023 |
| Base Year |
2024 |
| Forecast Period |
2025-2032 |
| Aerial Work Platforms (AWPs) Market Size 2024 |
USD 15.26 billion |
| Aerial Work Platforms (AWPs) Market, CAGR |
9.38% |
| Aerial Work Platforms (AWPs) Market Size 2032 |
USD 31.26 billion |
The Aerial Work Platforms (AWPs) market is shaped by several leading manufacturers that compete through advanced lift technologies, enhanced safety systems, and expanded rental partnerships. These companies focus on electric and hybrid models, smart telematics, and strong service networks to support high-demand sectors such as construction, utilities, and logistics. North America led the global market in 2024 with about 41% share, driven by large rental fleets, strict safety regulations, and steady infrastructure spending. Europe followed with nearly 32% share due to strong adoption of low-emission platforms, while Asia Pacific remained the fastest-growing region with around 21% share supported by rapid urban development.
Market Insights
- The market reached USD 15.26 billion in 2024 and will reach USD 31.26 billion by 2032, growing at a CAGR of 9.38%.
• Strong construction and warehouse expansion drive steady demand, with boom lifts holding about 46% share due to their versatility and height advantage.
• Electrification and telematics adoption shape market trends as companies shift toward low-emission and connected platforms for safer and more efficient operations.
• Competition intensifies through innovation in battery technology, fleet management systems, and rental service expansion, with major players strengthening after-sales networks.
• North America leads with 41% share, followed by Europe at 32% and Asia Pacific at 21%, while the 21–50 ft height segment dominates globally with nearly 52% share.
Access crucial information at unmatched prices!
Request your sample report today & start making informed decisions powered by Credence Research Inc.!
Download Sample
Market Segmentation Analysis:
By Product
Boom lifts held the dominant share in 2024 with about 46% of the market. Their lead came from strong use in building maintenance, urban infrastructure work, and high-reach industrial tasks. Boom lifts offer greater height, flexible articulation, and improved horizontal outreach, which support demand in both indoor and outdoor settings. Scissor lifts also grew due to warehouse expansion and e-commerce logistics. Vertical lifts and other compact platforms gained traction in facility management, but boom lifts remained ahead because they provide wider operational versatility and enhanced productivity across complex job sites.
- For instance, JLG’s 1850SJ telescopic boom lift provides a platform height of 185 ft 7 in and a horizontal outreach of 80 ft, with a restricted platform capacity of 1,000 lb as stated in its official specifications.
By Lifting Height
The 21–50 ft category dominated the segment in 2024 with nearly 52% share. This height range supports broad use across construction, utilities, and industrial maintenance. Manufacturers focus on mid-range platforms because they balance reach, stability, and cost, making them suitable for both indoor and outdoor tasks. Growth in commercial building projects and utility infrastructure upgrades strengthened demand. Less than 20 ft lifts expanded in warehouses and retail spaces, while more than 51 ft lifts saw steady adoption in specialized high-reach work, but the mid-range segment stayed ahead due to wider operational relevance.
- For instance, Genie’s GS-4047 electric scissor lift offers a working height of about 46 ft (14.29 m) and a lift capacity of up to 770 lb (350 kg), according to the manufacturer’s product datasheets.
By Application
Construction led the application segment in 2024 with about 58% share. Demand increased due to rising commercial building projects, urban development, and renovation activities. Construction firms prefer AWPs for improved worker safety, faster elevation, and reduced labor intensity. Utilities followed with strong adoption in grid repair, telecom tower maintenance, and street-light operations. Logistics and transportation expanded with growing warehouse automation and fleet yard operations. Despite growth in other areas, construction remained dominant because of continuous investment in infrastructure and stricter worker-safety regulations that favor AWP adoption.
Key Growth Drivers
Rising Construction and Infrastructure Expansion
Global investment in commercial buildings, industrial facilities, and transportation infrastructure boosts demand for AWPs. Builders rely on these platforms to improve worker safety, cut project delays, and meet stricter site regulations. Rapid urban growth increases the need for high-reach and mid-range platforms across dense city projects. Expanding renovation and maintenance work adds steady use across existing structures. This broad activity makes construction and infrastructure expansion a primary growth driver for the market.
- For instance, Horizon Construction Development’s mobile elevated work platform (MEWP) fleet in China was reported to be more than 160,000 units as of November 2023.
Growing Focus on Worker Safety and Productivity
Strict safety standards across industrial and commercial sites drive stronger adoption of AWPs over ladders and scaffolding. Companies prefer AWPs because they offer stable platforms, improved reach, and reduced accident risks. The shift toward mechanized access equipment helps workers complete elevation tasks faster with fewer errors. Employers see productivity gains through safer movement, enhanced platform control, and advanced monitoring features. As safety compliance tightens worldwide, this factor remains one of the most important market drivers.
- For instance, Manitou’s TJ telescopic boom range includes models like the TJ 85, which has a platform height of 84 ft 6 in and an unrestricted platform capacity of approximately 530 lb (240 kg) or a restricted capacity of 770 lb (350 kg).
Rising Adoption in Warehousing and E-commerce Logistics
Expanding warehouse networks, fueled by e-commerce growth, increases demand for compact and efficient access platforms. AWPs support inventory management, equipment servicing, racking installation, and overhead maintenance inside large distribution centers. Operators favor models with high maneuverability and electric powertrains that suit indoor operations. Rapid fulfillment cycles encourage the use of equipment that reduces downtime and supports continuous movement. This shift in logistics operations makes warehousing adoption a significant driver of market expansion.
Key Trends and Opportunities
Electrification and Low-Emission Platforms
Manufacturers shift toward electric and hybrid AWPs to meet global emission targets and indoor-use requirements. These platforms offer quieter operation, lower maintenance, and improved energy efficiency, supporting adoption in warehouses, airports, and urban sites. Incentives for clean equipment in developed regions create strong openings for hybrid and next-generation battery technologies. This transition positions low-emission platforms as a major trend shaping product development and future growth.
- For instance, Niftylift’s HR21E and HR21 Hybrid 4×4 boom lifts can raise two people and their tools to a working height of 20.8 m (68 ft 3 in) with a working outreach of up to 12.8 m (42 ft), using electric or hybrid power for lower-emission operation.
Integration of Telematics and Smart Fleet Management
Operators adopt telematics to monitor location, usage hours, load limits, and maintenance schedules. Smart connectivity helps reduce breakdowns, improve asset availability, and optimize rental fleet performance. Rental companies see strong value in predictive maintenance and remote diagnostics, driving investment in digital platforms. Growing interest in sensor-based safety features and intelligent control systems creates opportunities for premium models and connected fleet solutions across global markets.
- For instance, JCB reports that its LiveLink telematics platform monitors more than 275,000 machines worldwide, providing real-time data to support maintenance planning and fleet optimization, by the year 2021.
Rising Demand for Rental-Based Models
High upfront costs and short-term project needs encourage businesses to shift from ownership to rental. Rental firms expand fleets with versatile AWPs that cover multiple applications, offering customers flexible, cost-effective access to modern equipment. This trend increases market penetration, especially in developing regions. Opportunities grow for manufacturers to collaborate with rental networks through service packages, digital monitoring, and performance-based contracts.
Key Challenges
High Initial Investment and Ownership Costs
AWPs require significant upfront spending, which limits adoption among small contractors and emerging-market users. Maintenance, charging systems, and replacement parts add to lifetime expenses, creating financial pressure. Companies often delay upgrades due to budget constraints and rely on rental alternatives instead. These cost barriers slow wider market reach, especially in regions with limited financial support for mechanized access equipment.
Operational Risks and Safety Concerns
Despite strong safety features, AWPs still face operational risks when used in harsh environments, uneven terrain, or crowded sites. Human error, overload incidents, and improper training increase accident potential. Strict certification rules require continuous operator training, which adds time and expense for employers. Safety compliance gaps in developing markets further challenge adoption. These risks make operational safety a major obstacle to market growth.
Regional Analysis
North America
North America held the leading share of about 41% in 2024. Strong construction spending, warehouse expansion, and high adoption of rental-based AWPs supported regional growth. The United States drove most demand due to active infrastructure upgrades and strict workplace safety standards. Canada contributed through investments in commercial buildings and utility maintenance. Electric and hybrid platforms saw faster uptake as companies targeted lower emissions and indoor efficiency. Large rental fleets, mature regulations, and steady industrial activity kept North America ahead of other regions in overall market share.
Europe
Europe accounted for nearly 32% share in 2024. Demand rose from ongoing refurbishment of aging infrastructure, growth in logistics hubs, and rising use of electric AWPs across urban zones. Countries such as Germany, France, and the United Kingdom supported stable deployment through strong safety compliance and growing preference for sustainable lifting equipment. Strict emission rules accelerated the shift to battery-powered lifts, especially in indoor and city-center projects. Expanding rental networks and cross-border fleet sharing enhanced access to advanced platforms, helping Europe maintain significant presence in the global market.
Asia Pacific
Asia Pacific captured about 21% share in 2024 and remained the fastest-growing region. Rapid urbanization, large-scale commercial construction, and expanding industrial activity increased AWP adoption across China, India, Japan, and Southeast Asia. The region saw rising demand for mid-height platforms due to extensive real estate development and government-led infrastructure programs. Growing warehouse construction driven by e-commerce lifted indoor AWP usage. Adoption is slower in smaller markets due to high equipment costs, but increasing rental availability and stronger safety awareness continue to expand regional market penetration.
Latin America
Latin America held nearly 4% share in 2024. Demand improved with ongoing commercial construction, energy projects, and infrastructure upgrades in Brazil, Mexico, and Chile. Companies used AWPs to enhance worker safety and reduce reliance on scaffolding in high-risk environments. Rental firms expanded fleets in major cities despite economic fluctuations. Adoption remains moderate due to financing challenges and slower regulatory enforcement, but growing industrial activity and warehouse development create steady opportunities for mid-range lifts across the region.
Middle East and Africa
Middle East and Africa accounted for around 2% share in 2024. Construction of airports, commercial complexes, and industrial zones supported demand for high-reach and articulated platforms. GCC countries led adoption due to large-scale development programs and strong investment in public infrastructure. Africa showed limited but rising use as safety standards improve in mining and utilities. Economic diversification in Gulf nations and expansion of rental operations increased access to modern equipment, helping the region gradually grow its share within the global AWP market.
Market Segmentations:
By Product
- Boom Lifts
- Scissor Lifts
- Vertical Lifts
- Others
By Lifting Height
- Less than 20 ft
- 21-50 ft
- More than 51 ft
By Application
- Construction
- Utilities
- Logistics & Transportation
- Others
By Geography
- North America
- Europe
- Germany
- France
- U.K.
- Italy
- Spain
- Rest of Europe
- Asia Pacific
- China
- Japan
- India
- South Korea
- South-east Asia
- Rest of Asia Pacific
- Latin America
- Brazil
- Argentina
- Rest of Latin America
- Middle East & Africa
- GCC Countries
- South Africa
- Rest of the Middle East and Africa
Competitive Landscape
Terex Corporation, Haulotte Group, Linamar Corporation, Tadano Ltd., MEC Aerial Work Platforms, and JLG Industries, Inc. lead the competitive landscape of the Aerial Work Platforms (AWPs) market. These companies compete through continuous product innovation, strong rental partnerships, and expanded global distribution. Manufacturers prioritize advanced safety features, electric drivetrains, and telematics integration to meet rising demand across construction, utilities, and logistics sectors. Many players focus on expanding production capacity and strengthening after-sales networks to support fleet uptime and boost customer retention. Growing emphasis on low-emission equipment and connected platforms pushes competitors to invest in sustainable technologies and digital fleet management. Strategic acquisitions, regional expansions, and collaborative service programs help major companies secure stronger market presence in both mature and developing regions.
Shape Your Report to Specific Countries or Regions & Enjoy 30% Off!
Key Player Analysis
Recent Developments
- In 2025, JLG rolled out the Rapid Replaceable Platform as a standard feature on select boom lift models in North America, announced, to enable quick field servicing and reduce downtime.
- In 2025, MEC showcased multiple new models at The ARA Show 2025, including the Micro 2032 Slab Scissor Lift with 800-lb capacity and 26 ft working height for tight spaces.
- In 2025, Tadano delivered two AS-15MC aerial work platforms equipped with optional 8-ft baskets allowing two operators to work simultaneously, enhancing on-site efficiency.
Report Coverage
The research report offers an in-depth analysis based on Product, Lifting height, Application and Geography. It details leading market players, providing an overview of their business, product offerings, investments, revenue streams, and key applications. Additionally, the report includes insights into the competitive environment, SWOT analysis, current market trends, as well as the primary drivers and constraints. Furthermore, it discusses various factors that have driven market expansion in recent years. The report also explores market dynamics, regulatory scenarios, and technological advancements that are shaping the industry. It assesses the impact of external factors and global economic changes on market growth. Lastly, it provides strategic recommendations for new entrants and established companies to navigate the complexities of the market.
Future Outlook
- The market will grow with wider adoption of electric and hybrid platforms across indoor and urban sites.
- Rental providers will expand fleets as more businesses shift from ownership to flexible access models.
- Safety requirements will drive demand for advanced stabilization features and smarter control systems.
- Telematics and connected fleet tools will become standard for monitoring performance and reducing downtime.
- Warehousing and e-commerce expansion will increase the use of compact lifts designed for indoor tasks.
- Manufacturers will invest more in lightweight materials to improve efficiency and reduce maintenance needs.
- Emerging markets will adopt AWPs faster as safety awareness and rental availability increase.
- High-reach boom lifts will gain traction due to large infrastructure and industrial maintenance projects.
- Automation and semi-autonomous functions will appear in premium platforms for higher precision and safety.
- Sustainability goals will push the industry toward zero-emission designs and eco-friendly product development.


