CHAPTER NO. 1 :GENESIS OF THE MARKET
1.1 Market Prelude – Introduction & Scope
1.2 The Big Picture – Objectives & Vision
1.3 Strategic Edge – Unique Value Proposition
1.4 Stakeholder Compass – Key Beneficiaries
CHAPTER NO. 2 : EXECUTIVE LENS
2.1 Pulse of the Industry – Market Snapshot
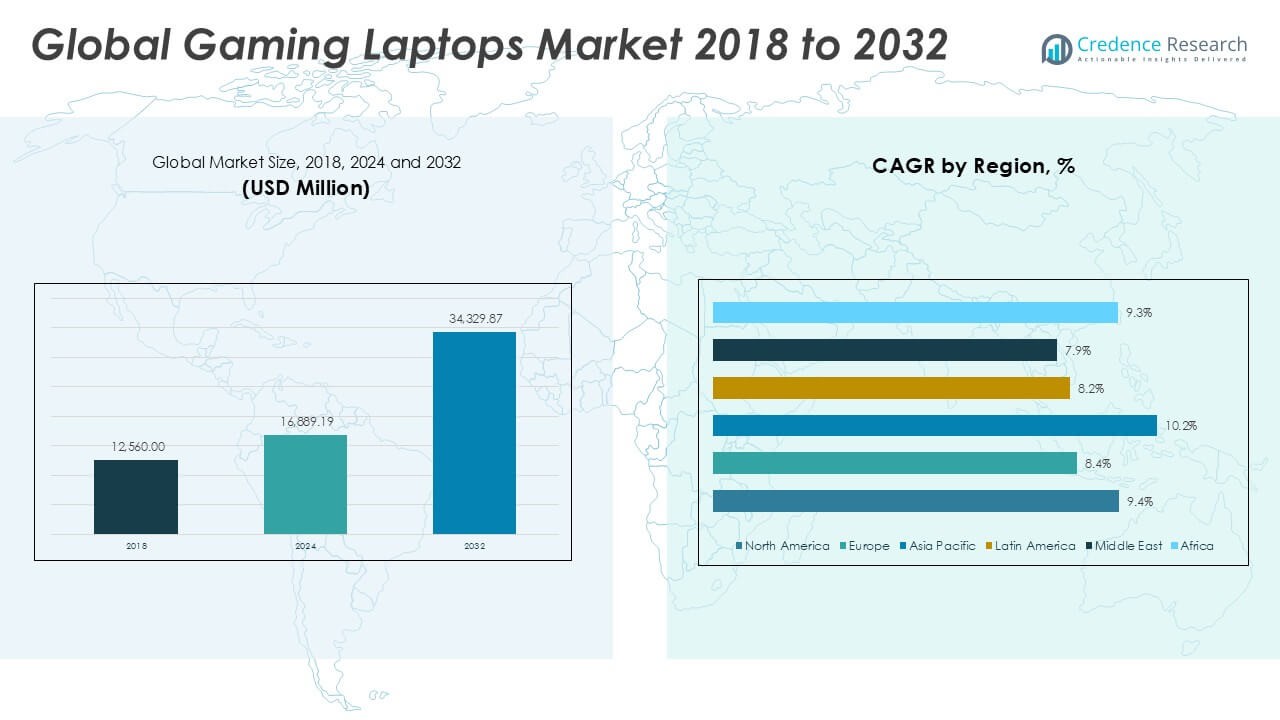
2.2 Growth Arc – Revenue Projections (USD Million)
2.3. Premium Insights – Based on Primary Interviews
CHAPTER NO. 3 :GAMING LAPTOPS MARKET FORCES & INDUSTRY PULSE
3.1 Foundations of Change – Market Overview
3.2 Catalysts of Expansion – Key Market Drivers
3.2.1 Momentum Boosters – Growth Triggers
3.2.2 Innovation Fuel – Disruptive Technologies
3.3 Headwinds & Crosswinds – Market Restraints
3.3.1 Regulatory Tides – Compliance Challenges
3.3.2 Economic Frictions – Inflationary Pressures
3.4 Untapped Horizons – Growth Potential & Opportunities
3.5 Strategic Navigation – Industry Frameworks
3.5.1 Market Equilibrium – Porter’s Five Forces
3.5.2 Ecosystem Dynamics – Value Chain Analysis
3.5.3 Macro Forces – PESTEL Breakdown
3.6 Price Trend Analysis
3.6.1 Regional Price Trend
3.6.2 Price Trend by product
CHAPTER NO. 4 :KEY INVESTMENT EPICENTER
4.1 Regional Goldmines – High-Growth Geographies
4.2 Product Frontiers – Lucrative Product Categories
4.3 Application Sweet Spots – Emerging Demand Segments
CHAPTER NO. 5: REVENUE TRAJECTORY & WEALTH MAPPING
5.1 Momentum Metrics – Forecast & Growth Curves
5.2 Regional Revenue Footprint – Market Share Insights
5.3 Segmental Wealth Flow – Component & Application Revenue
CHAPTER NO. 6 :TRADE & COMMERCE ANALYSIS
6.1.Import Analysis by Region
6.1.1. Global Gaming Laptops Market Import Volume By Region
6.2.Export Analysis by Region
6.2.1. Global Gaming Laptops Market Export Volume By Region
CHAPTER NO. 7 :COMPETITION ANALYSIS
7.1.Company Market Share Analysis
7.1.1. Global Gaming Laptops Market: Company Market Share
7.1. Global Gaming Laptops Market Company Volume Market Share
7.2. Global Gaming Laptops Market Company Revenue Market Share
7.3.Strategic Developments
7.3.1.Acquisitions & Mergers
7.3.2. New Product Launch
7.3.3. Regional Expansion
7.4. Competitive Dashboard
7.5. Company Assessment Metrics, 2024
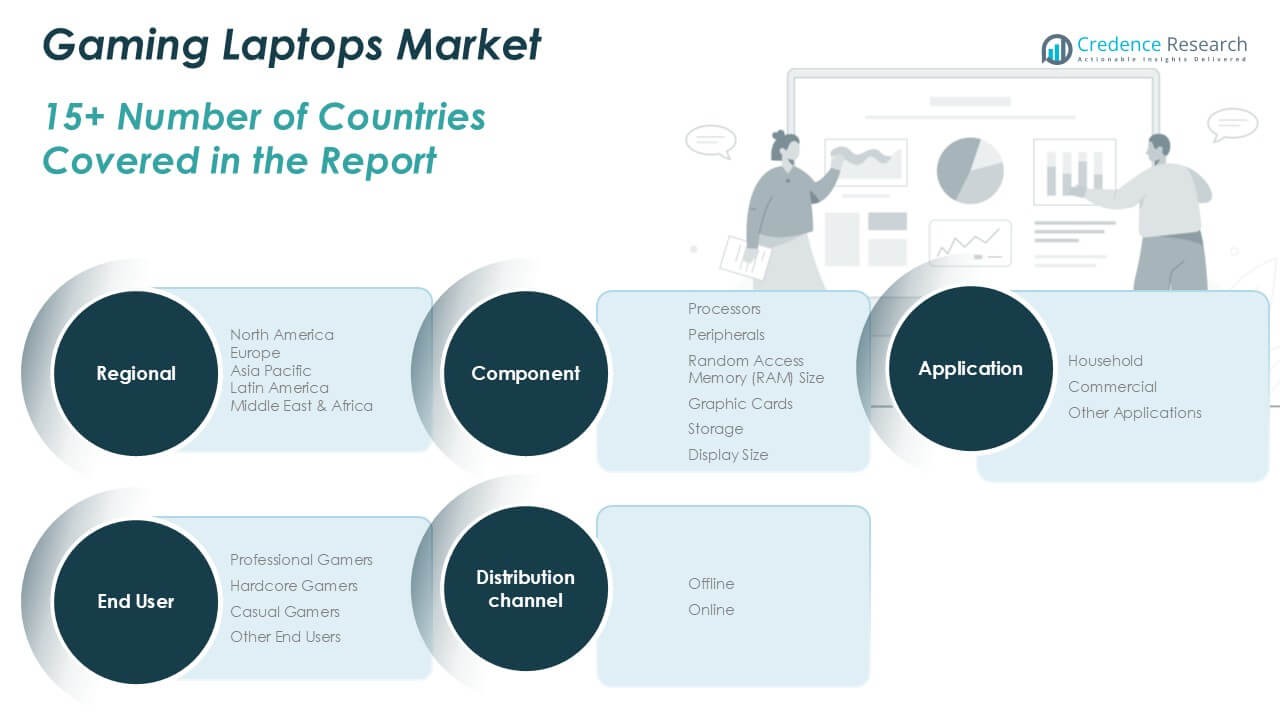
CHAPTER NO. 8 : GAMING LAPTOPS MARKET – BY COMPONENT SEGMENT ANALYSIS
8.1.Gaming Laptops Market Overview by Component Segment
8.1.1. Gaming Laptops Market Volume Share By Component
8.1.2. Gaming Laptops Market Revenue Share By Component
8.2. Processors
8.2.1Intel Processors
8.2.2AMD Processors
8.2.3 ARM Processors
8.3. Peripherals
8.3.1Keyboards
8.3.2Mice
8.3.3Headsets
8.3.4External Storage Devices
8.3.5Gaming Controllers
8.4.Random Access Memory (RAM) Size
8.4.18 GB RAM
8.4.216 GB RAM
8.4.332 GB RAM
8.4.464 GB RAM
8.5. Graphic Cards
8.5.1 NVIDIA Graphics Cards
8.5.2AMD Graphics Cards
8.5.3Integrated Graphics Cards
8.5.4External Graphics Cards (eGPU)
8.6. Storage
8.6.1Hard Disk Drive (HDD)
8.6.2Solid State Drive (SSD)
8.6.3Hybrid Drives (SSHD)
8.6.4NVMe SSD
8.7. Display Size
8.7.113-inch
8.7.215-inch
8.7.317-inch
8.7.418-inch or larger
CHAPTER NO. 9 : GAMING LAPTOPS MARKET – BY APPLICATION SEGMENT ANALYSIS
9.1.Gaming Laptops Market Overview by Application Segment
9.1.1. Gaming Laptops Market Volume Share By Application
9.1.2. Gaming Laptops Market Revenue Share By Application
9.2. Household
9.3. Commercial
9.4. Other Applications
CHAPTER NO. 10 :GAMING LAPTOPS MARKET – BY END-USER SEGMENT ANALYSIS
10.1.Gaming Laptops Market Overview by End-user Segment
10.1.1. Gaming Laptops Market Volume Share By End-user
10.1.2. Gaming Laptops Market Revenue Share By End-user
10.2. Professional Gamers
10.3.Hardcore Gamers
10.4. Casual Gamers
CHAPTER NO. 11 : GAMING LAPTOPS MARKET – BY DISTRIBUTION CHANNEL SEGMENT ANALYSIS
11.1.Gaming Laptops Market Overview by Distribution Channel Segment
11.1.1. Gaming Laptops Market Volume Share By Distribution Channel
11.1.2. Gaming Laptops Market Revenue Share By Distribution Channel
11.2. Offline
11.3.Online
CHAPTER NO. 12 :GAMING LAPTOPS MARKET – REGIONAL ANALYSIS
12.1.Gaming Laptops Market Overview by Region Segment
12.1.1. Global Gaming Laptops Market Volume Share By Region
12.1.2. Global Gaming Laptops Market Revenue Share By Region
12.1.3.Regions
12.1.4.Global Gaming Laptops Market Volume By Region
12.1.5.Global Gaming Laptops Market Revenue By Region
12.1.6.Component
12.1.7.Global Gaming Laptops Market Volume By Component
12.1.8.Global Gaming Laptops Market Revenue By Component
12.1.9.Application
12.1.10. Global Gaming Laptops Market Volume By Application
12.1.11. Global Gaming Laptops Market Revenue By Application
12.1.12.End-user
12.1.13. Global Gaming Laptops Market Volume By End-user
12.1.14. Global Gaming Laptops Market Revenue By End-user
12.1.12.Distribution Channel
12.1.13. Global Gaming Laptops Market Volume By Distribution Channel
12.1.14. Global Gaming Laptops Market Revenue By Distribution Channel
CHAPTER NO. 13 : NORTH AMERICA GAMING LAPTOPS MARKET – COUNTRY ANALYSIS
13.1.North America Gaming Laptops Market Overview by Country Segment
13.1.1.North America Gaming Laptops Market Volume Share By Region
13.1.2. North America Gaming Laptops Market Revenue Share By Region
13.2.North America
13.2.1.North America Gaming Laptops Market Volume By Country
13.2.2.North America Gaming Laptops Market Revenue By Country
13.2.3.Component
13.2.4.North America Gaming Laptops Market Volume By Component
13.2.5.North America Gaming Laptops Market Revenue By Component
13.2.6.Application
13.2.7.North America Gaming Laptops Market Volume By Application
13.2.8. North America Gaming Laptops Market Revenue By Application
13.2.9.End-user
13.2.10.North America Gaming Laptops Market Volume By End-user
13.2.11.North America Gaming Laptops Market Revenue By End-user
13.2.12.Distribution Channel
13.2.13.North America Gaming Laptops Market Volume By Distribution Channel
13.2.14.North America Gaming Laptops Market Revenue By Distribution Channel
13.3.U.S.
13.4.Canada
13.5.Mexico
CHAPTER NO. 14 :EUROPE GAMING LAPTOPS MARKET – COUNTRY ANALYSIS
14.1. Europe Gaming Laptops Market Overview by Country Segment
14.1.1. Europe Gaming Laptops Market Volume Share By Region
14.1.2. Europe Gaming Laptops Market Revenue Share By Region
14.2.Europe
14.2.1.Europe Gaming Laptops Market Volume By Country
14.2.2.Europe Gaming Laptops Market Revenue By Country
14.2.3.Component
14.2.4.Europe Gaming Laptops Market Volume By Component
14.2.5.Europe Gaming Laptops Market Revenue By Component
14.2.6.Application
14.2.7. Europe Gaming Laptops Market Volume By Application
14.2.8. Europe Gaming Laptops Market Revenue By Application
14.2.9.End-user
14.2.10. Europe Gaming Laptops Market Volume By End-user
14.2.11. Europe Gaming Laptops Market Revenue By End-user
14.2.12.Distribution Channel
14.2.13. Europe Gaming Laptops Market Volume By Distribution Channel
14.2.14. Europe Gaming Laptops Market Revenue By Distribution Channel
14.3.UK
14.4.France
14.5.Germany
14.6.Italy
14.7.Spain
14.8.Russia
14.9. Rest of Europe
CHAPTER NO. 15 :ASIA PACIFIC GAMING LAPTOPS MARKET – COUNTRY ANALYSIS
15.1.Asia Pacific Gaming Laptops Market Overview by Country Segment
15.1.1.Asia Pacific Gaming Laptops Market Volume Share By Region
15.1.2.Asia Pacific Gaming Laptops Market Revenue Share By Region
15.2.Asia Pacific
15.2.1. Asia Pacific Gaming Laptops Market Volume By Country
15.2.2.Asia Pacific Gaming Laptops Market Revenue By Country
15.2.3.Component
15.2.4.Asia Pacific Gaming Laptops Market Volume By Component
15.2.5.Asia Pacific Gaming Laptops Market Revenue By Component
15.2.6.Application
15.2.7.Asia Pacific Gaming Laptops Market Volume By Application
15.2.8.Asia Pacific Gaming Laptops Market Revenue By Application
15.2.9.End-user
15.2.10.Asia Pacific Gaming Laptops Market Volume By End-user
15.2.11.Asia Pacific Gaming Laptops Market Revenue By End-user
15.2.12.Distribution Channel
15.2.13.Asia Pacific Gaming Laptops Market Volume By Distribution Channel
15.2.14.Asia Pacific Gaming Laptops Market Revenue By Distribution Channel
15.3.China
15.4.Japan
15.5.South Korea
15.6.India
15.7.Australia
15.8.Southeast Asia
15.9. Rest of Asia Pacific
CHAPTER NO. 16 : LATIN AMERICA GAMING LAPTOPS MARKET – COUNTRY ANALYSIS
16.1.Latin America Gaming Laptops Market Overview by Country Segment
16.1.1.Latin America Gaming Laptops Market Volume Share By Region
16.1.2.Latin America Gaming Laptops Market Revenue Share By Region
16.2. Latin America
16.2.1. Latin America Gaming Laptops Market Volume By Country
16.2.2.Latin America Gaming Laptops Market Revenue By Country
16.2.3.Component
16.2.4. Latin America Gaming Laptops Market Volume By Component
16.2.5. Latin America Gaming Laptops Market Revenue By Component
16.2.6.Application
16.2.7.Latin America Gaming Laptops Market Volume By Application
16.2.8.Latin America Gaming Laptops Market Revenue By Application
16.2.9.End-user
16.2.10.Latin America Gaming Laptops Market Volume By End-user
16.2.11. Latin America Gaming Laptops Market Revenue By End-user
16.2.12.Distribution Channel
16.2.13.Latin America Gaming Laptops Market Volume By Distribution Channel
16.2.14.Latin America Gaming Laptops Market Revenue By Distribution Channel
16.3.Brazil
16.4.Argentina
16.5.Rest of Latin America
CHAPTER NO. 17 : MIDDLE EAST GAMING LAPTOPS MARKET – COUNTRY ANALYSIS
17.1.Middle East Gaming Laptops Market Overview by Country Segment
17.1.1.Middle East Gaming Laptops Market Volume Share By Region
17.1.2. Middle East Gaming Laptops Market Revenue Share By Region
17.2.Middle East
17.2.1. Middle East Gaming Laptops Market Volume By Country
17.2.2.Middle East Gaming Laptops Market Revenue By Country
17.2.3.Component
17.2.4.Middle East Gaming Laptops Market Volume By Component
17.2.5.Middle East Gaming Laptops Market Revenue By Component
17.2.6.Application
17.2.7.Middle East Gaming Laptops Market Volume By Application
17.2.8.Middle East Gaming Laptops Market Revenue By Application
17.2.9. End-user
17.2.10.Middle East Gaming Laptops Market Volume By End-user
17.2.11. Middle East Gaming Laptops Market Revenue By End-user
17.2.12. Distribution Channel
17.2.13.Middle East Gaming Laptops Market Volume By Distribution Channel
17.2.14. Middle East Gaming Laptops Market Revenue By Distribution Channel
17.3.GCC Countries
17.4. Israel
17.5. Turkey
17.6.Rest of Middle East
CHAPTER NO. 18 :AFRICA GAMING LAPTOPS MARKET – COUNTRY ANALYSIS
18.1. Africa Gaming Laptops Market Overview by Country Segment
18.1.1.Africa Gaming Laptops Market Volume Share By Region
18.1.2. Africa Gaming Laptops Market Revenue Share By Region
18.2. Africa
18.2.1.Africa Gaming Laptops Market Volume By Country
18.2.2.Africa Gaming Laptops Market Revenue By Country
18.2.3.Component
18.2.4.Africa Gaming Laptops Market Volume By Component
18.2.5.Africa Gaming Laptops Market Revenue By Component
18.2.6.Application
18.2.7. Africa Gaming Laptops Market Volume By Application
18.2.8. Africa Gaming Laptops Market Revenue By Application
18.2.9.End-user
18.2.10. Africa Gaming Laptops Market Volume By End-user
18.2.11. Africa Gaming Laptops Market Revenue By End-user
18.2.12.Distribution Channel
18.2.13. Africa Gaming Laptops Market Volume By Distribution Channel
18.2.14. Africa Gaming Laptops Market Revenue By Distribution Channel
18.3. South Africa
18.4.Egypt
18.5.Rest of Africa
CHAPTER NO. 19 :COMPANY PROFILES
19.1. Samsung Electronics Co. Ltd
19.1.1.Company Overview
19.1.2.Product Portfolio
19.1.3.Financial Overview
19.1.4.Recent Developments
19.1.5.Growth Strategy
19.1.6.SWOT Analysis
19.2. Dell Inc.
19.3. Lenovo Group Limited
19.4. HP Inc.
19.5. Toshiba Corporation
19.6.ASUSTeK Computer Inc.
19.7. Acer Incorporated
19.8. Micro-Star International Co. Ltd
19.9. Gigabyte Technology Co. Ltd
19.10. Razer Inc.
19.11. Clevo Co.
19.12.EVGA Corporation
19.13. Digital Storm Limited
19.14. Sager AG