2D Gesture Recognition Market: USD 202.0 million in 2025, Growing Fast From a Small Base
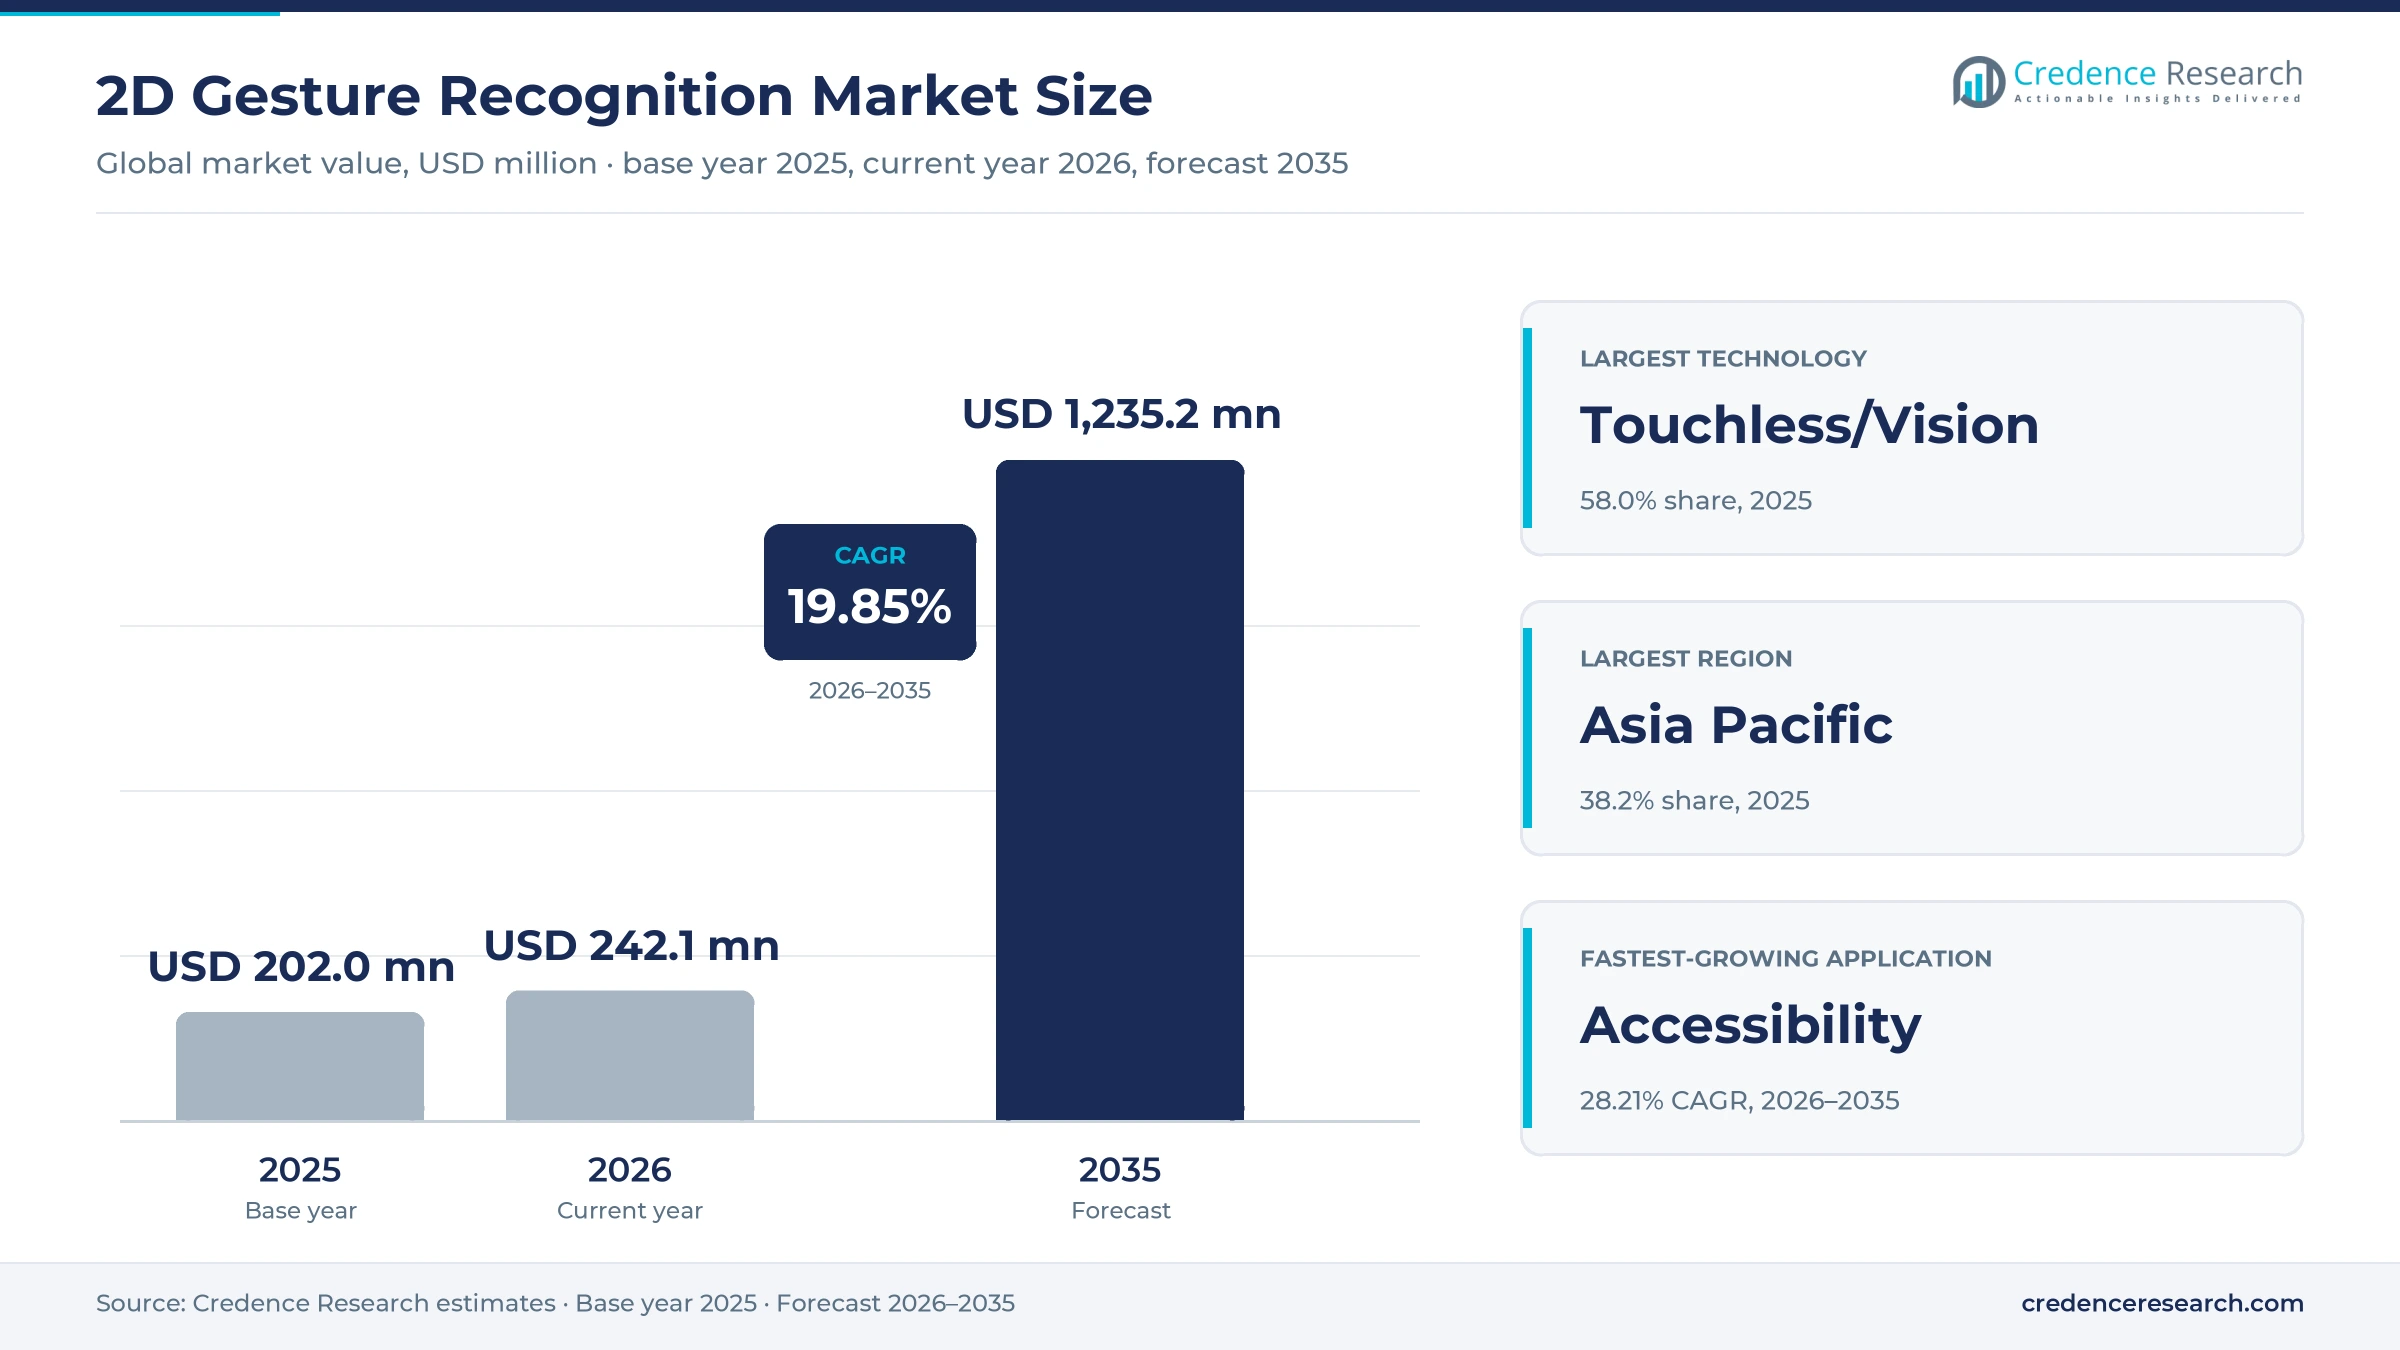
Camera-based and touch-based gesture recognition built on 2D sensing generated USD 202.0 million in 2025. Credence Research projects USD 1,235.2 million by 2035, a 19.85% CAGR over 2026–2035, and estimates 2026 at USD 242.1 million. The market is small because most gesture features are bundled into phones, cars and kiosks rather than sold separately, but on-device AI is making them cheaper to add.
2D gesture systems read hand shapes and movements from a single flat camera image or a flat sensing surface, without the depth cameras or radar used in premium systems. That keeps hardware costs low enough for mass-market devices.
What does the market cover?
The market covers hardware, software and services for recognizing gestures from 2D input. The scope includes:
- Touch-based gesture recognition on flat surfaces and touchless, vision-based recognition from RGB cameras, infrared and proximity sensors and embedded camera modules.
- Gesture algorithms and software development kits, and integration and support services.
- Edge, PC and embedded, and cloud-assisted deployments.
The scope excludes depth cameras using stereo, structured light or time of flight, radar gesture sensors, wrist-worn muscle-signal bands, and the value of the host device. Values are gesture-specific revenue in USD million at current prices, allocated to the region of the buyer. The wider field is covered in the gesture recognition market.
How was the estimate built?
All figures are Credence Research estimates, built from attach rates of gesture features in phones, vehicles, kiosks and industrial panels, typical software license and module prices, and supplier disclosures.
Why is a software toolkit an indicator?
Free toolkits have lowered the cost of entry. Google's MediaPipe Gesture Recognizer tracks 21 landmarks per hand and recognizes seven built-in gestures in about 17 milliseconds on a Pixel 6 phone processor.
Report Attributes
| Attribute | Details |
|---|---|
| Historical Period | 2018–2024 |
| Base Year | 2025 |
| Forecast Period | 2026–2035 |
| Market Size 2025 | USD 202.0 million |
| Market Size 2026 (estimate) | USD 242.1 million |
| Market Size 2035 (forecast) | USD 1,235.2 million |
| CAGR (2026–2035) | 19.85% |
| Segments Covered | By Technology, By Component, By Input Device, By Application, By Industry Vertical, By Deployment |
| Regions Covered | North America, Europe, Asia Pacific, Latin America, Middle East & Africa |
| Companies Covered | Qualcomm Incorporated, Intel Corporation, Microchip Technology, Microsoft Corporation, Sony Group Corporation, Samsung Electronics, Infineon Technologies, PointGrab, Crunchfish AB, ArcSoft, Inc. |
2D Gesture Recognition Market Insights
- The 2D gesture recognition market was worth USD 202.0 million in 2025 and is forecast to reach USD 1,235.2 million by 2035, a 19.85% CAGR over 2026–2035.
- Credence Research estimates the market at USD 242.1 million in 2026, the current year.
- Demand for hygienic touchless interfaces is the strongest driver, adding about 5.1 percentage points to the forecast CAGR.
- Touchless, vision-based recognition leads with a 58.0% share and grows fastest at 23.00% a year.
- Consumer electronics holds 36.0% of value; healthcare grows fastest at 22.90%.
- Asia Pacific is the largest region at 38.2% and grows fastest at 21.07%.
Touchless Camera Systems for Consumer Devices Hold the Largest Share
Which technology leads?
Touchless, vision-based recognition leads with a 58.0% share in 2025 and grows fastest at 23.00% a year. Touch-based gesture recognition on screens and pads remains common in older interfaces.
Which component leads?
Hardware leads with a 52.0% share, mainly camera and sensor modules sold with gesture functions. Services cover integration and tuning. Software and algorithms grow fastest at 23.89% a year.
Which input device leads?
RGB cameras lead with a 46.0% share because they are already built into phones, laptops and kiosks. Infrared and proximity sensors serve low-light and close-range uses. Embedded camera modules grow fastest at 24.03% a year.
Which application leads?
Touchless control leads with a 30.0% share. Automotive HMI, industrial controls and gaming follow. Sign language and accessibility grows fastest at 28.21% a year.
Which vertical and deployment lead?
Consumer electronics leads verticals with a 36.0% share, followed by automotive, healthcare, retail, banking and government. Healthcare grows fastest at 22.90%. Edge and on-device deployment leads with a 56.0% share. Automotive uses overlap with the driver monitoring systems market.
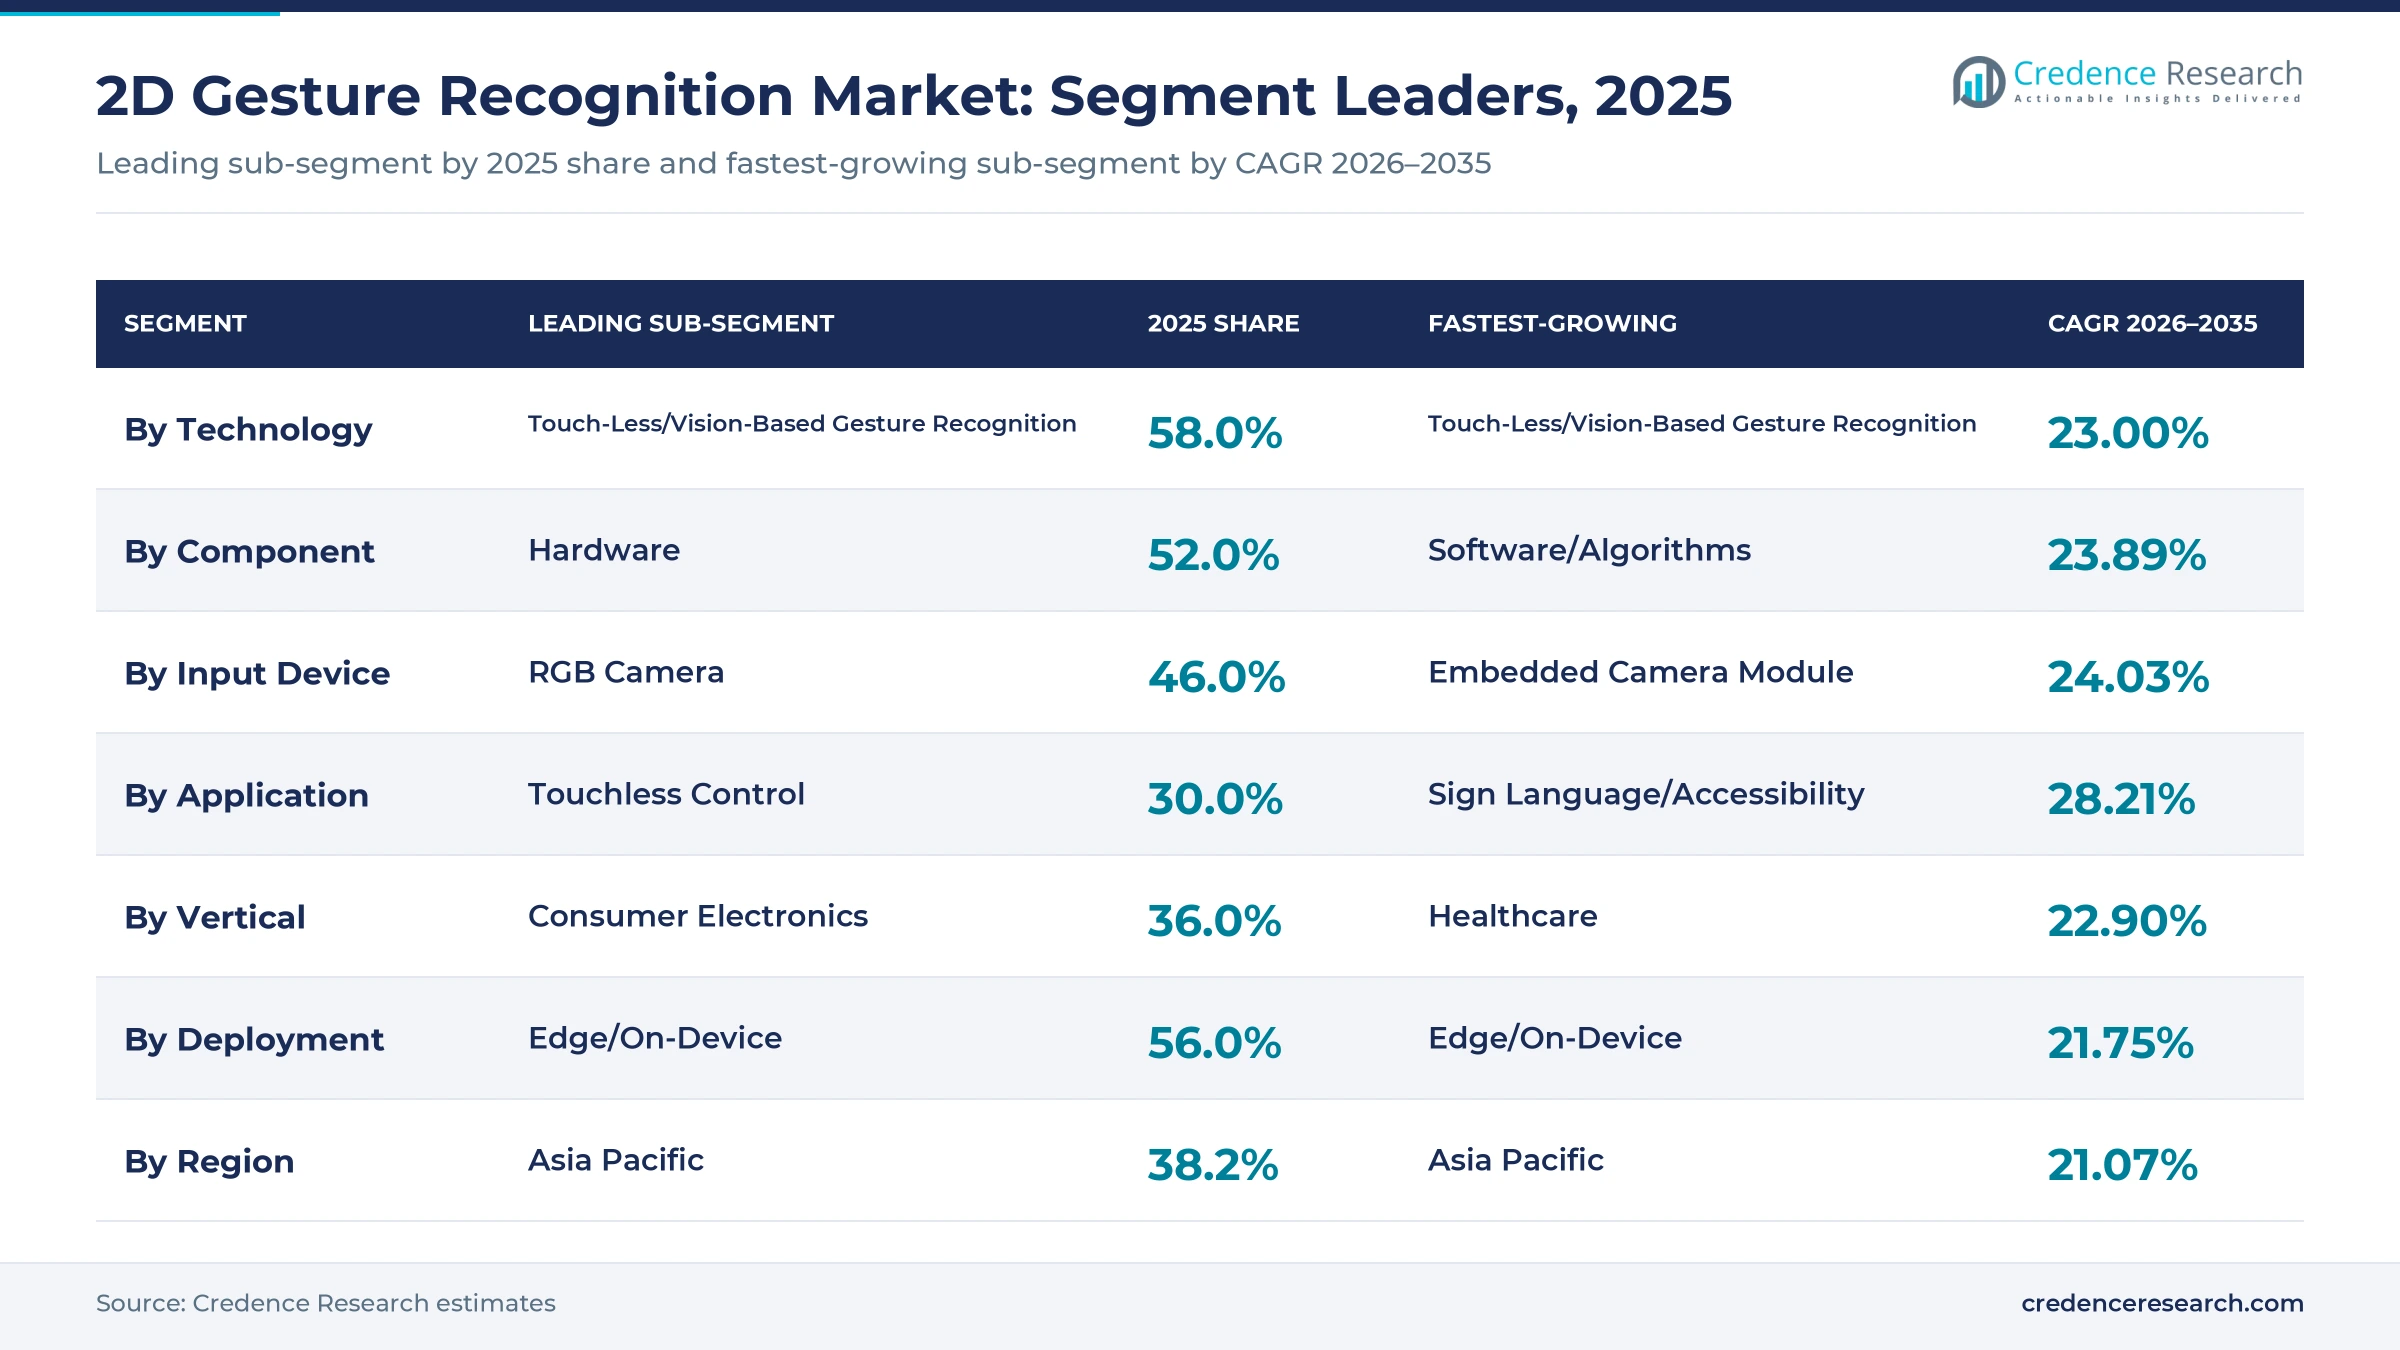
| Segment Group | Leading Sub-segment | 2025 Share | Fastest-growing Sub-segment | CAGR 2026–2035 |
|---|---|---|---|---|
| By Technology | Touch-Less/Vision-Based Gesture Recognition | 58.0% | Touch-Less/Vision-Based Gesture Recognition | 23.00% |
| By Component | Hardware | 52.0% | Software/Algorithms | 23.89% |
| By Input Device | RGB Camera | 46.0% | Embedded Camera Module | 24.03% |
| By Application | Touchless Control | 30.0% | Sign Language/Accessibility | 28.21% |
| By Industry Vertical | Consumer Electronics | 36.0% | Healthcare | 22.90% |
| By Deployment | Edge/On-Device | 56.0% | Edge/On-Device | 21.75% |
Request a Free Sample
Fill in your details and we'll send you a free sample report.
- Sample data tables & charts
- Research methodology
Touchless Interfaces, Car Cockpits and Edge AI Push Adoption
Why do touchless interfaces matter? (~+5.1% impact on forecast CAGR)
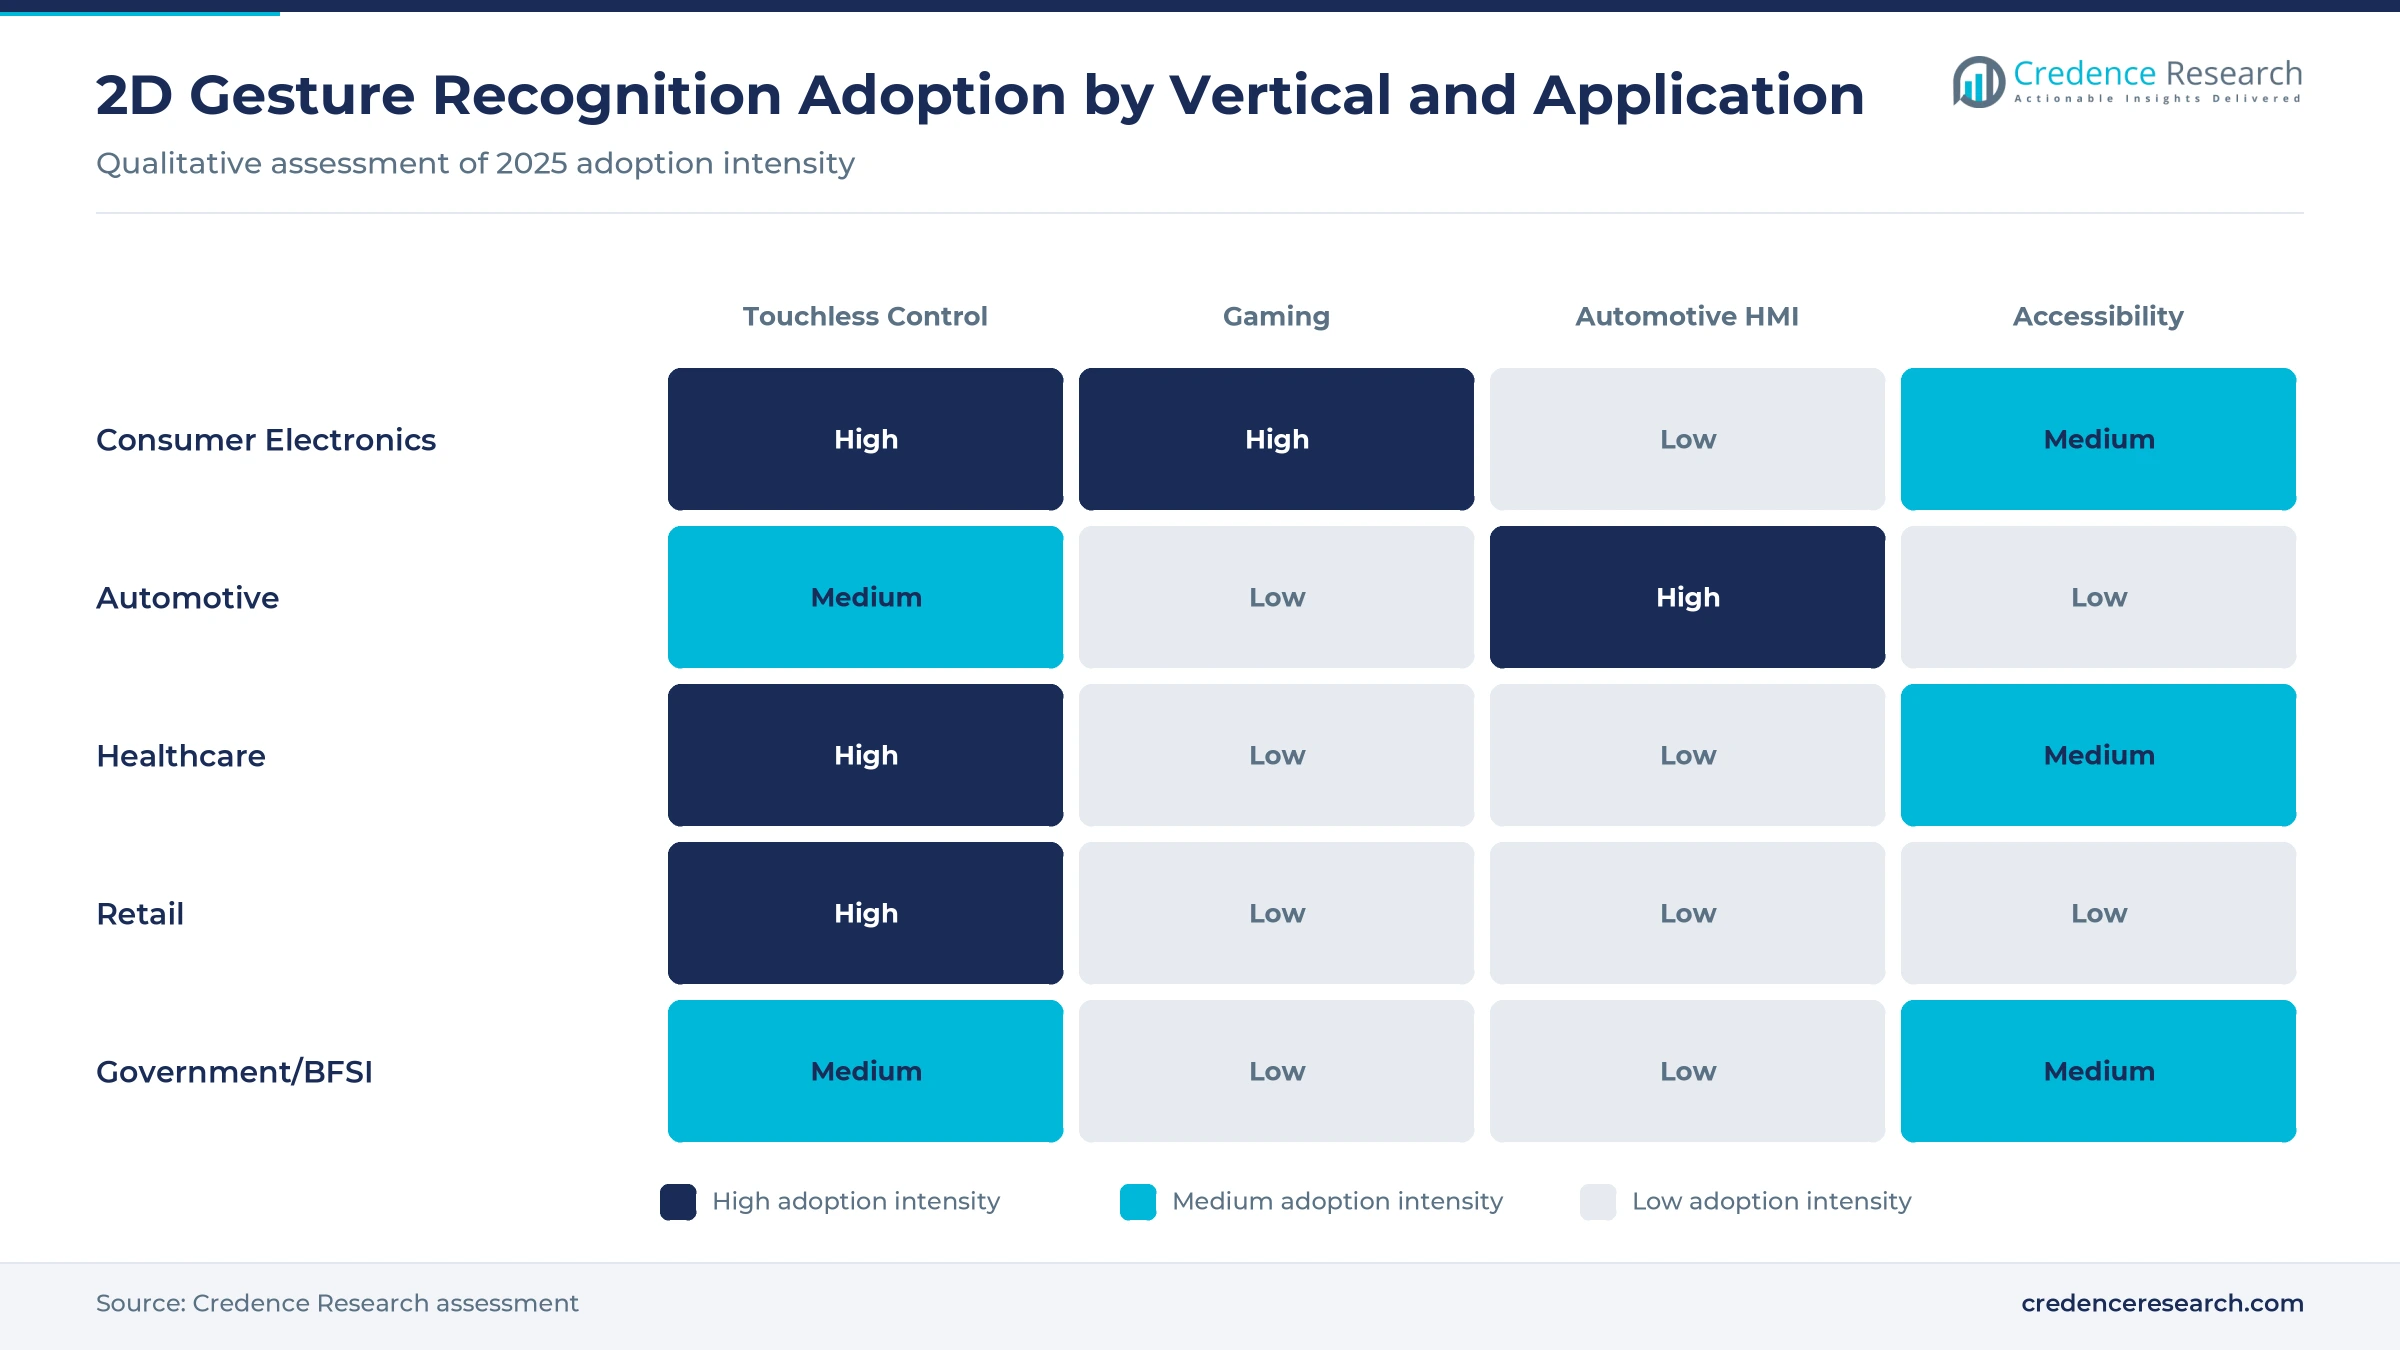
Rising demand for hygienic and intuitive touchless human-machine interfaces is the strongest driver, adding an estimated 5.1 percentage points to the forecast CAGR. Hospitals, airports, retail kiosks and food-service counters want controls that people do not have to touch, and gesture recognition from a basic camera is the cheapest way to provide them. Elevator panels, self-service kiosks and hospital displays can add a small camera module and software rather than replacing the whole interface. Touchless control is the largest application with a 30.0% share of 2025 value, and healthcare is the fastest-growing vertical at 22.90% a year. The limit is accuracy in busy public spaces, where lighting, crowds and gloves can confuse a 2D camera.
How do car cockpits add demand? (~+3.9% impact on forecast CAGR)
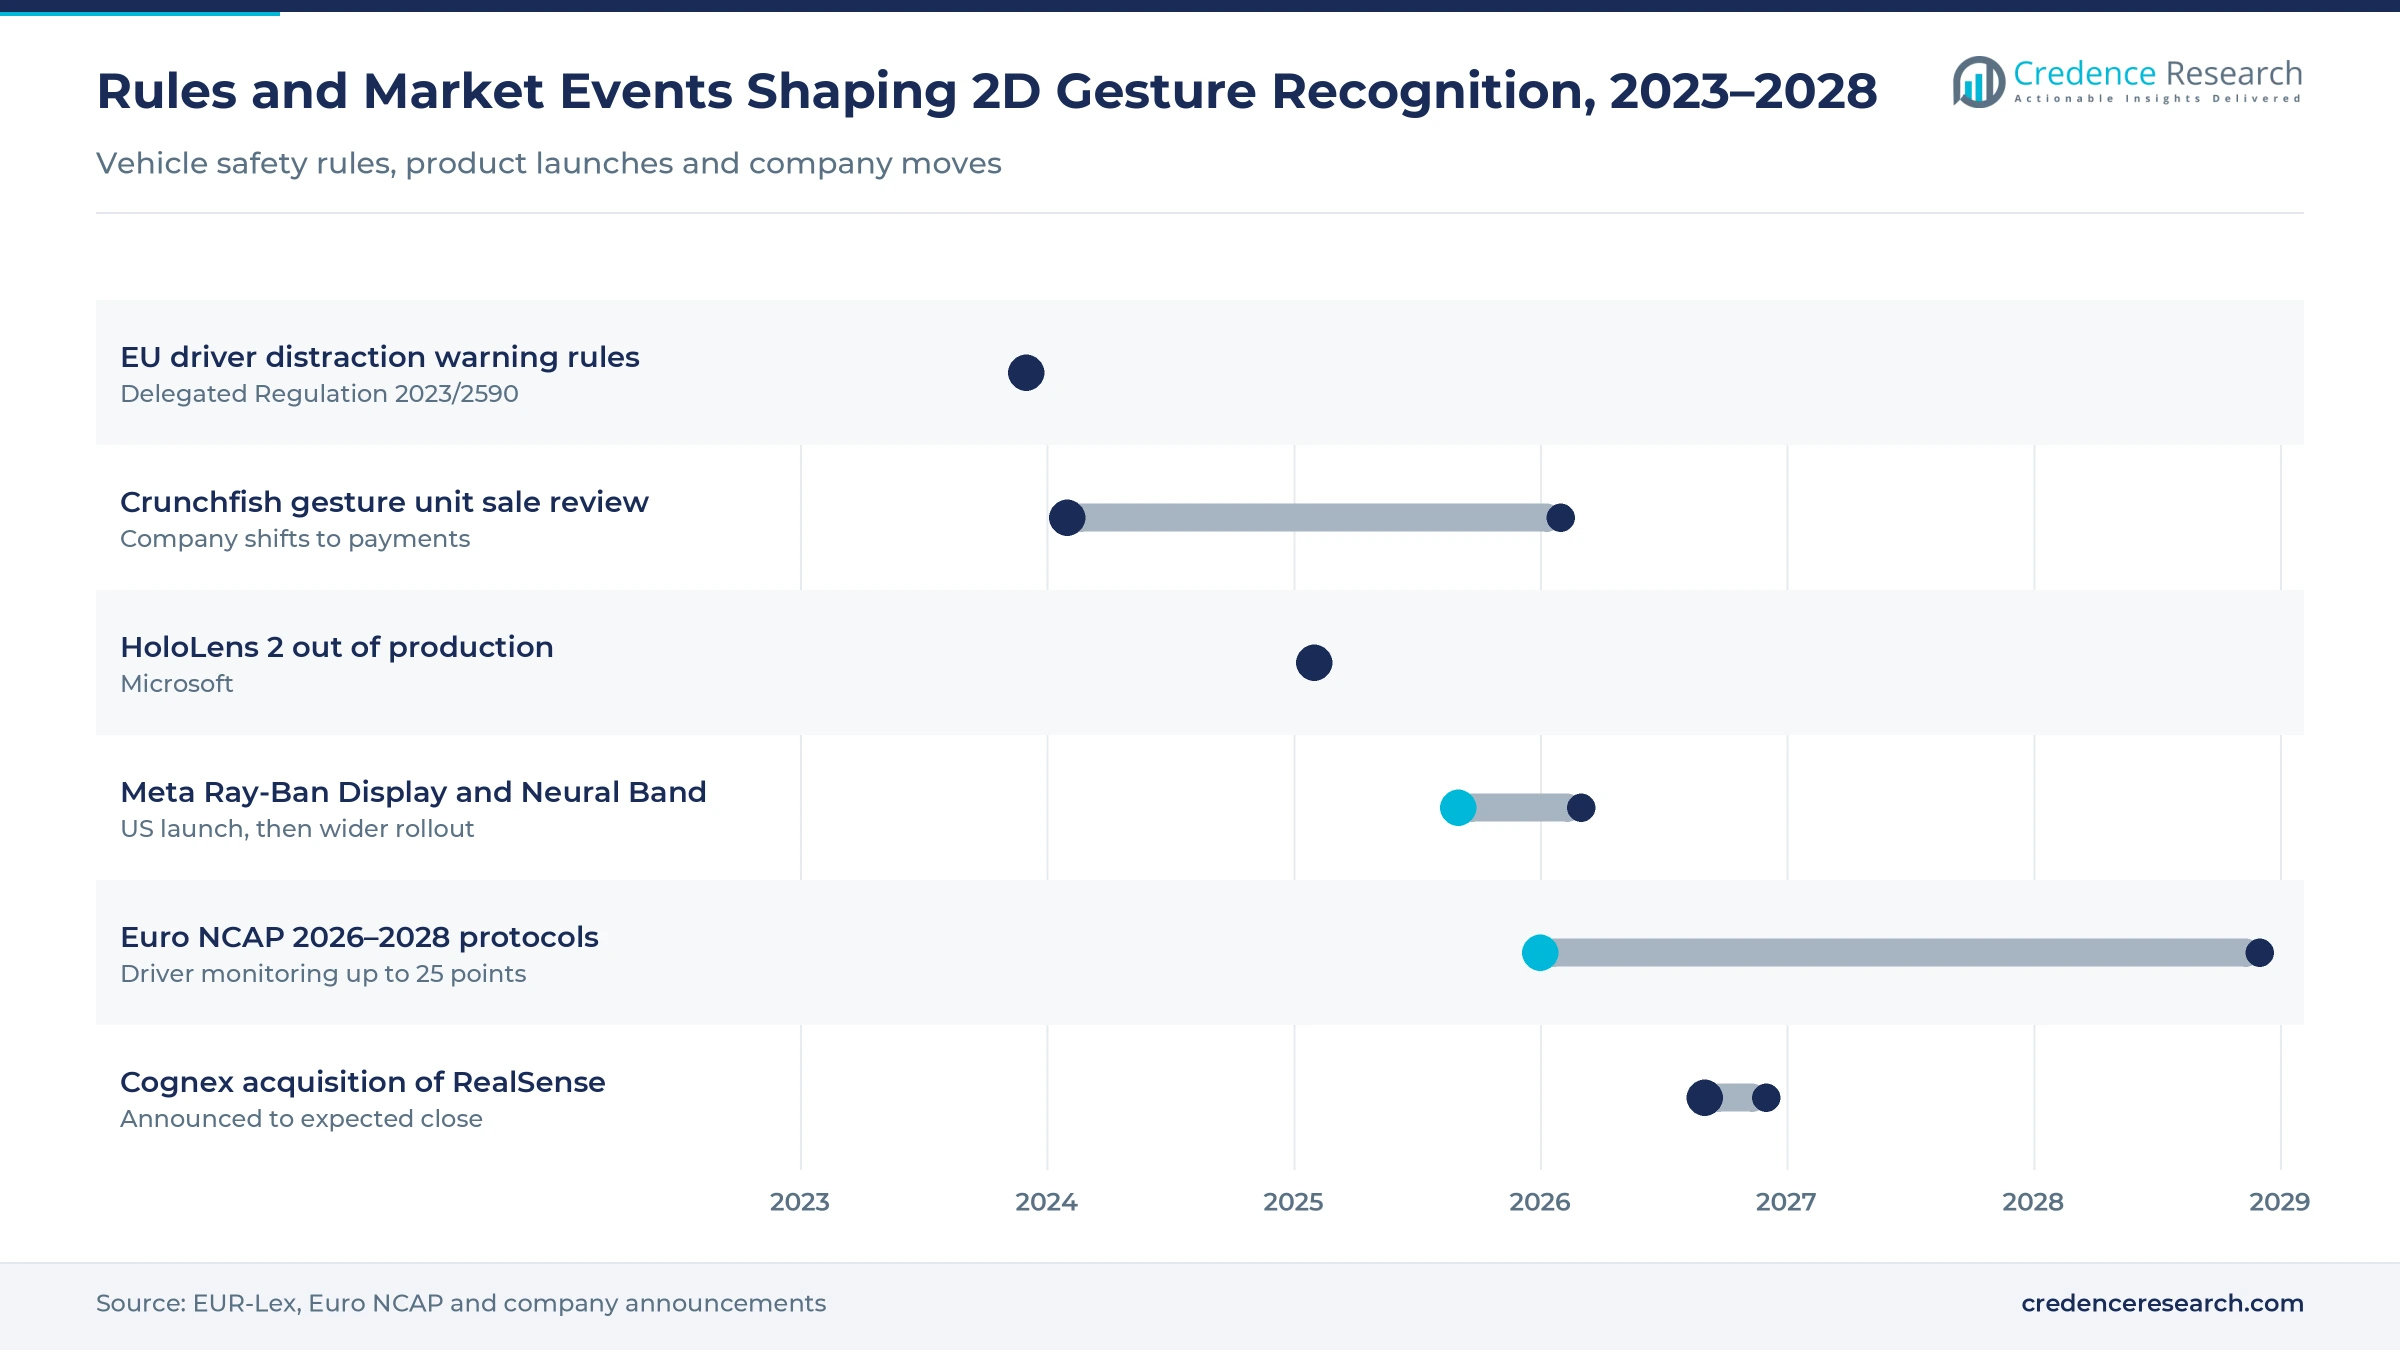
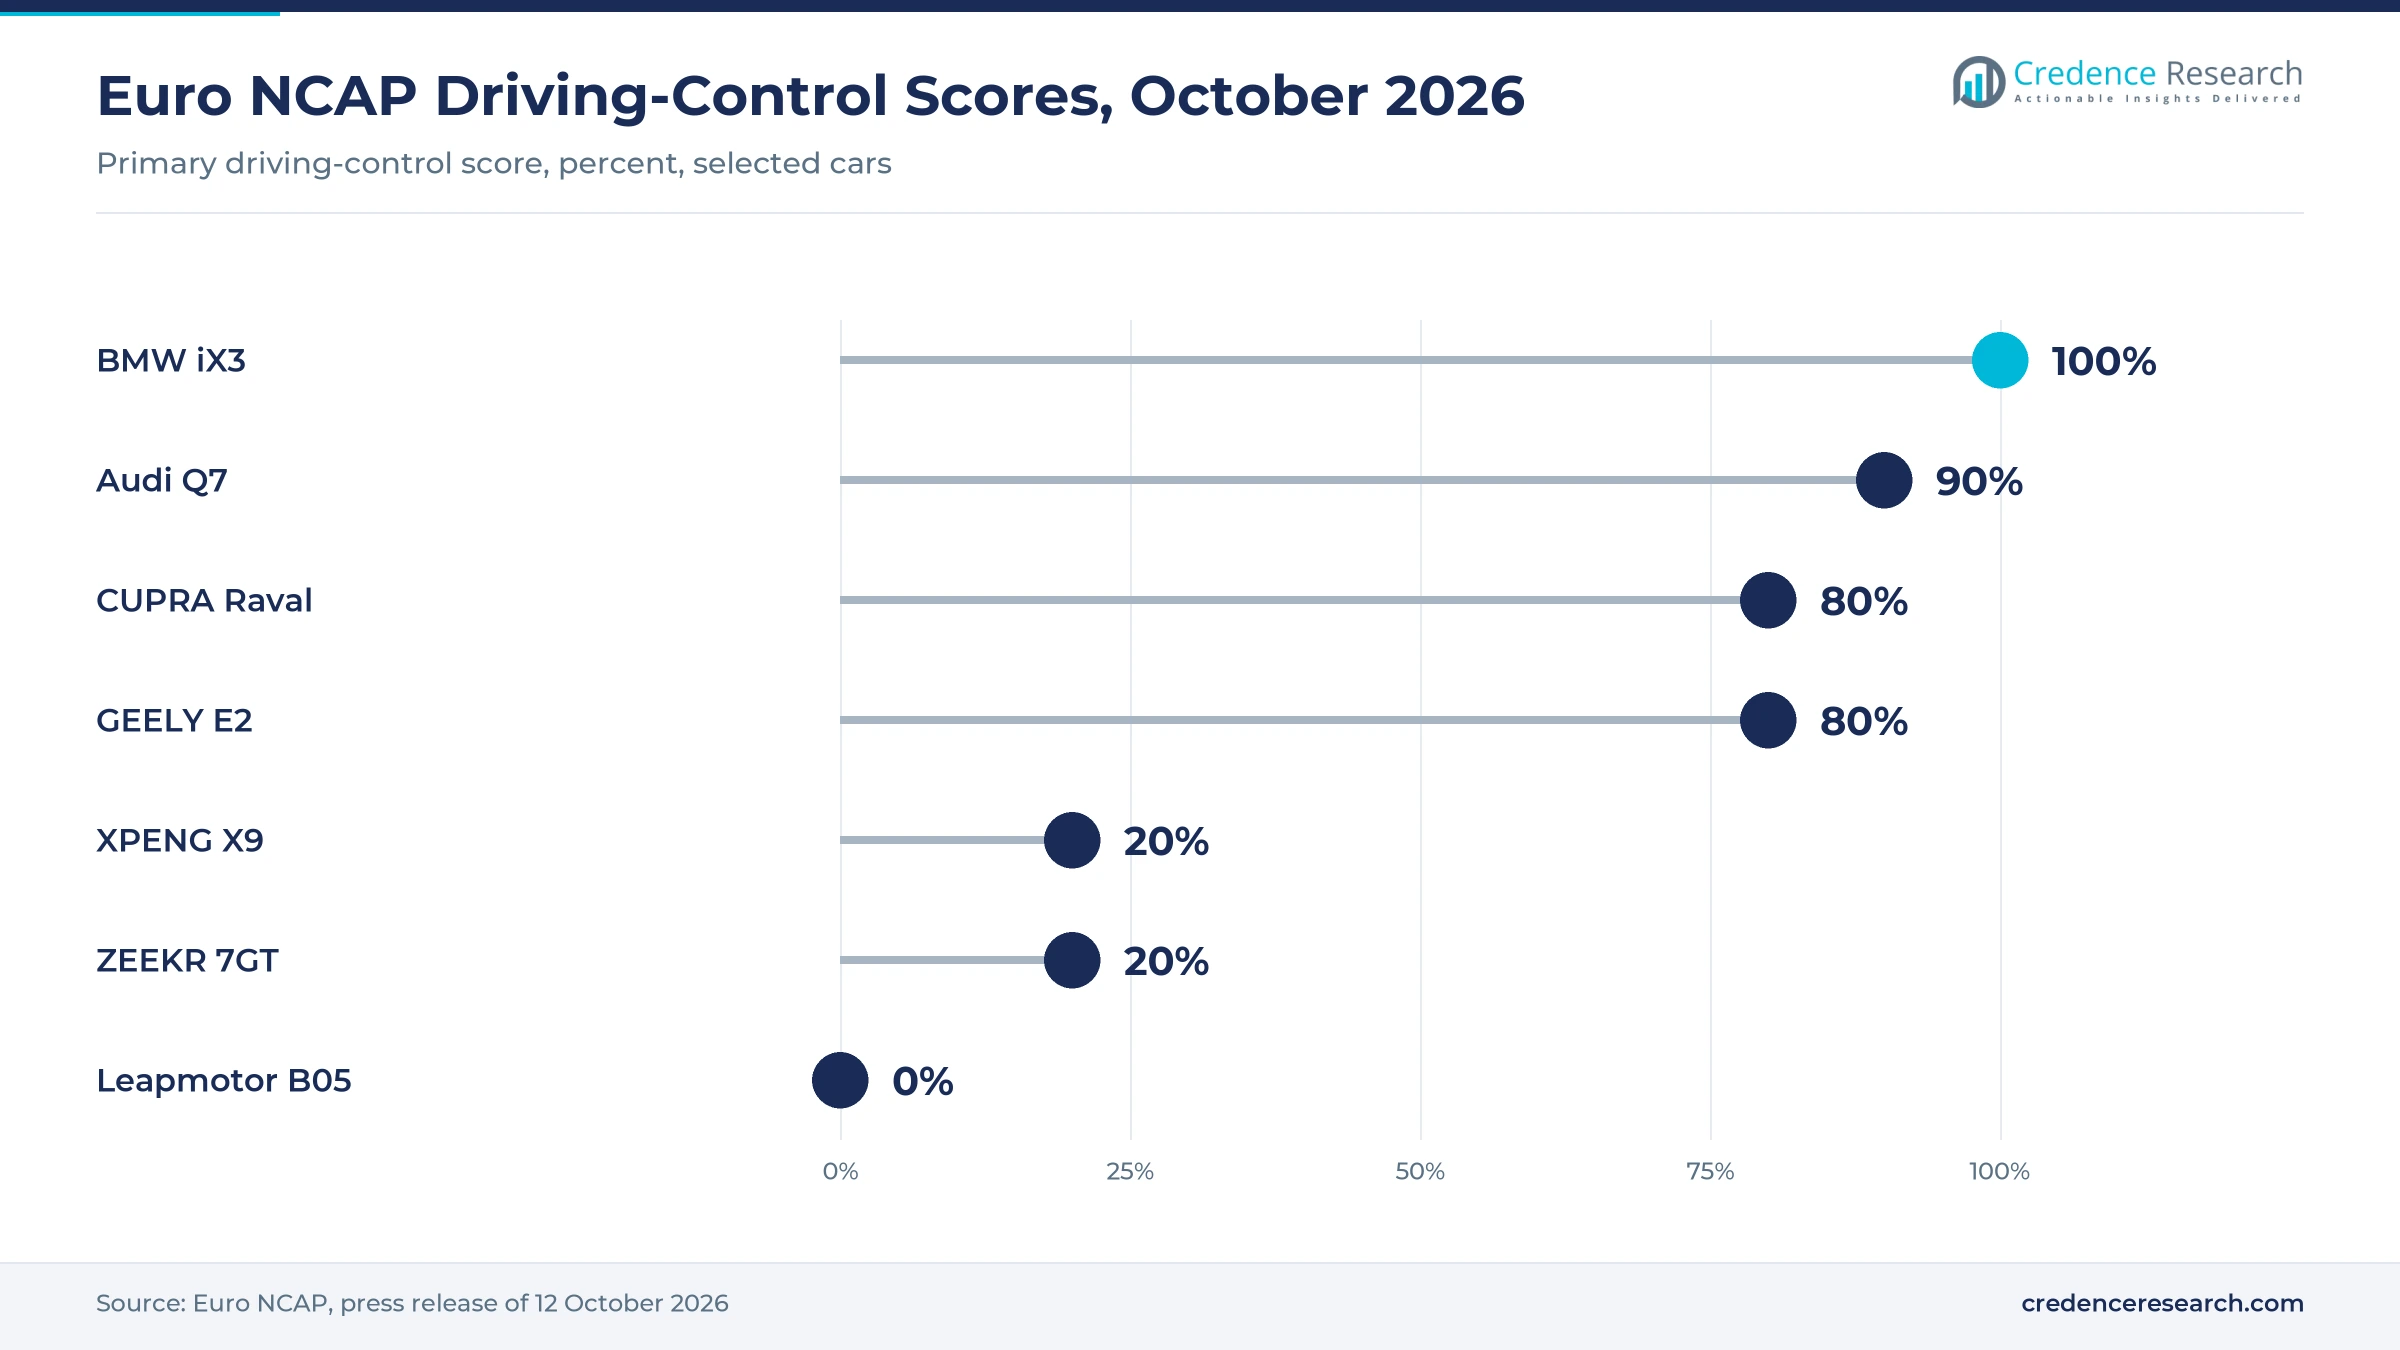
Gesture-enabled automotive cockpits and infotainment add about 3.9 percentage points to the forecast CAGR. Carmakers are adding interior cameras to monitor drivers, and those cameras can also read hand gestures. Euro NCAP raised the weight of driver monitoring in its 2026 protocols to up to 25 points, from 2 in 2023, according to Smart Eye. EU type-approval rules for advanced driver distraction warning, set out in Delegated Regulation (EU) 2023/2590, also push cameras into cabins. Automotive HMI is a major application, but Euro NCAP's October 2026 tests rewarded physical buttons for basic functions, so gesture remains a secondary control.
How does edge AI help? (~+2.8% impact on forecast CAGR)
Edge AI and better camera processing that raise recognition accuracy add about 2.8 percentage points to the forecast CAGR. Neural processing units in phones, PCs and car processors now run hand-tracking models locally, so devices do not need a cloud connection. Edge and on-device deployment leads with a 56.0% share and grows fastest at 21.75% a year. Software and algorithms grow fastest by component at 23.89%. Free reference models also let small developers build gesture features without licensing a proprietary engine, which widens the supplier base but puts pressure on software prices.
Software-Led Value, Accessibility Uses and Competition From Other Sensors
Trend 1: Is value moving to software?
Yes. Camera hardware is already in most devices, so suppliers earn more from algorithms that recognize more gestures in more conditions. Embedded camera modules grow fastest by input device at 24.03% a year as makers fit dedicated low-power sensors for always-on gesture detection.
Trend 2: Is accessibility becoming a use case?
Yes. Sign language and accessibility is the fastest-growing application at 28.21% a year. Research groups and app developers are training models to recognize signed letters and words from a phone camera, a use that needs no special hardware. Related apps are tracked in the sign language apps market.
Trend 3: Are other sensors taking premium uses?
Partly. Depth cameras, radar and wrist-worn muscle sensors offer richer input. Meta began selling Ray-Ban Display glasses with a wrist band that reads finger gestures in September 2025 at USD 799, and Cognex agreed in September 2026 to buy depth-camera maker RealSense for about USD 500 million. 2D systems keep the cost-sensitive mass market.
Trend 4: Are some suppliers leaving?
Yes. Microsoft stopped manufacturing the HoloLens 2 headset, and Crunchfish, an early gesture software firm, now focuses on offline payments. Consolidation leaves platform and chip suppliers in stronger positions.
Accuracy Limits, Button Preferences and Privacy Concerns Slow Adoption
Why is accuracy still a problem?
A single camera cannot measure depth, so it can misread gestures when hands overlap, lighting changes or the user stands at an angle. Built-in gesture sets are small: MediaPipe's standard model covers seven gestures, and adding more requires extra training data.
Why do safety bodies prefer buttons?
Euro NCAP found in October 2026 that physical controls for indicators, wipers, hazard lights and the horn are safer than menu-based controls, as stated in its test results release. Carmakers therefore keep gesture for comfort functions, which limits its value per vehicle.
Do users trust always-on cameras?
Not always. Cameras that watch for gestures also capture faces and surroundings, which raises privacy concerns in homes, offices and public places. Data-protection rules in Europe require careful design and on-device processing.
Is the business model clear?
Gesture is often given away as a feature, so standalone vendors struggle to charge for it. Several early specialists have exited.
Where are the opportunities?
Hospitals, laboratories and food plants need touchless control that works with gloved hands and in poor lighting. Suppliers that train models for these conditions and certify them for regulated settings can win this demand. The execution risk is validation cost in each regulated industry.
Asia Pacific Leads Through Device Manufacturing and Fast Adoption
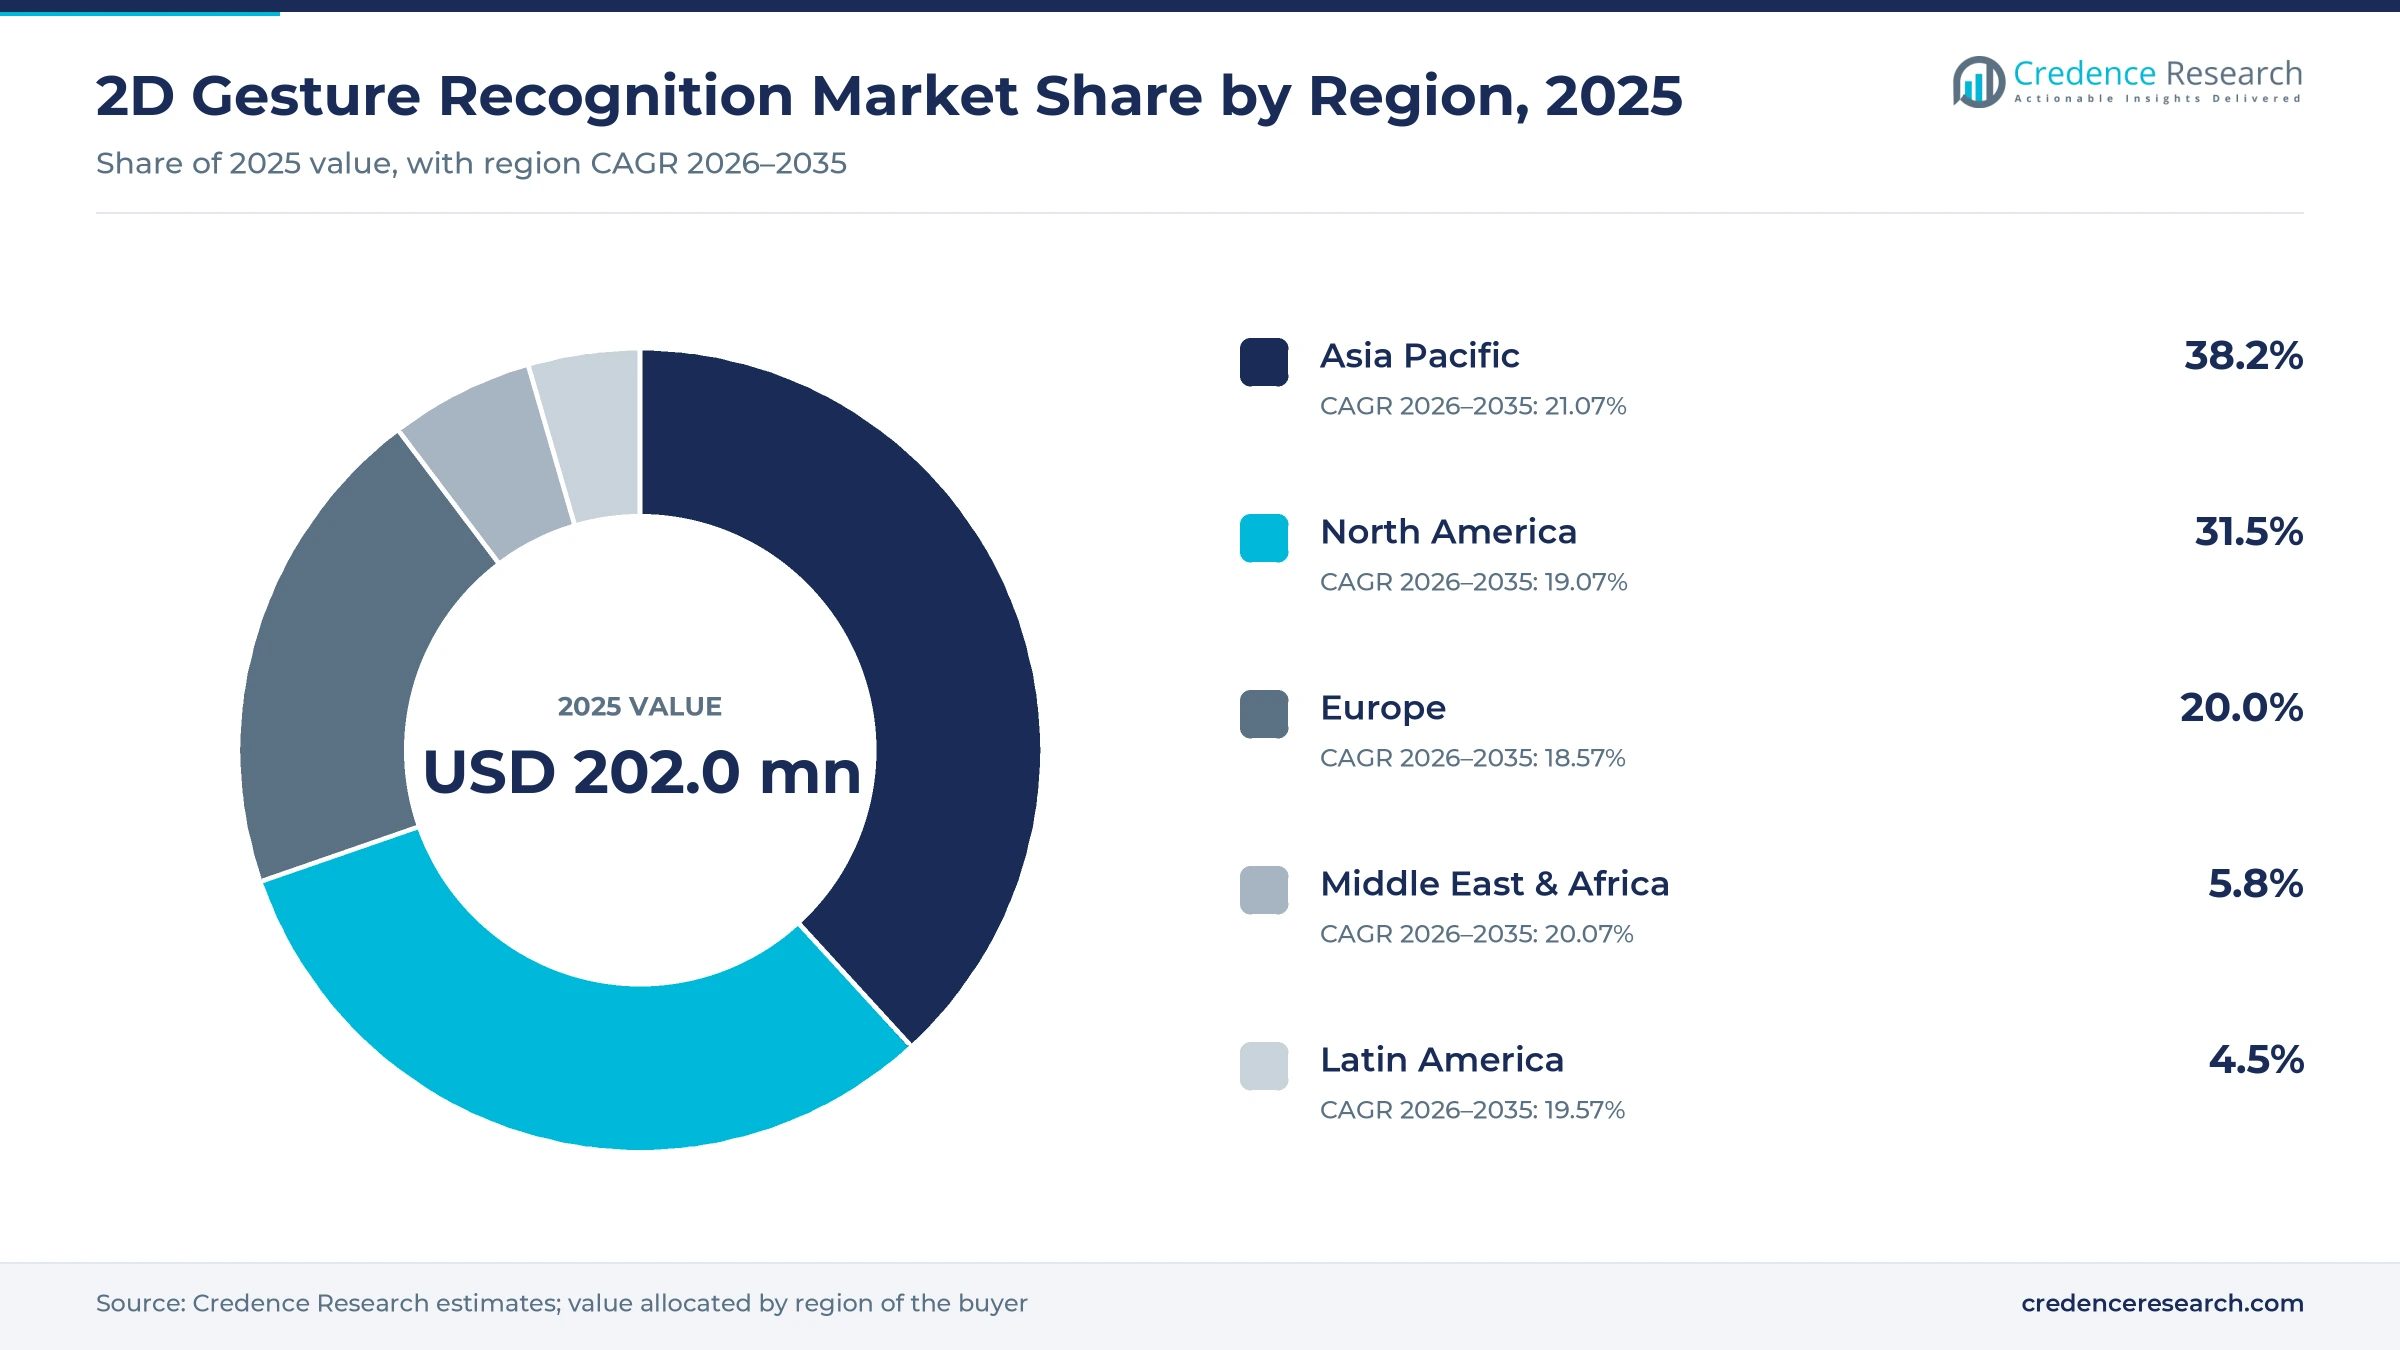
Value is allocated to the region of the buyer.
| Region | Share 2025 | CAGR 2026–2035 |
|---|---|---|
| Asia Pacific | 38.2% | 21.07% |
| North America | 31.5% | 19.07% |
| Europe | 20.0% | 18.57% |
| Middle East & Africa | 5.8% | 20.07% |
| Latin America | 4.5% | 19.57% |
Why does Asia Pacific lead?
Asia Pacific holds a 38.2% share in 2025 and is the fastest-growing region at 21.07% a year. Chinese, Korean and Japanese phone and car makers build camera-based features into high volumes of devices, and algorithm suppliers such as ArcSoft serve many of them.
What drives North America?
North America holds 31.5% and grows at 19.07% a year. Platform owners, chip suppliers and XR device makers are based in the United States, and hospitals and retailers buy touchless kiosks.
What shapes Europe?
Europe holds 20.0% and grows at 18.57% a year. Vehicle safety rules drive cabin cameras, while Euro NCAP's preference for physical buttons limits gesture to secondary controls.
What about Latin America and the Middle East & Africa?
Latin America holds 4.5% and grows at 19.57%, mainly through phones and retail kiosks. The Middle East & Africa region holds 5.8% and grows at 20.07%, with smart-city and airport projects in the Gulf adopting touchless interfaces.
Safety Ratings, Acquisitions and Product Launches, 2025–2026
| Development | Status and why it matters |
|---|---|
| In October 2026, Euro NCAP published test results showing that physical buttons for basic functions are safer, with scores from 100% for the BMW iX3 to 0% for the Leapmotor B05. | Published. Keeps gesture as a secondary car control. |
| In September 2026, Cognex announced an agreement to acquire RealSense, the depth-camera business spun out of Intel, for about USD 500 million. | Announced. Consolidates premium 3D sensing. |
| In June 2026, rFpro launched a simulation tool for driver and occupant monitoring development, citing higher Euro NCAP scoring for driver monitoring. | Launched. Supports cabin camera development. |
| In February 2026, Crunchfish announced year-end results describing a full focus on offline payments. | Reported. Confirms exit of an early gesture specialist. |
| In February 2026, NXP Semiconductors filed its fiscal 2025 Form 10-K listing automotive sensors with gesture recognition. | Filed. Shows gesture in automotive sensor portfolios. |
| In October 2025, Euro NCAP's 2026 rules were announced to require physical controls for key functions to earn top ratings. | Announced. Shapes cockpit design from 2026. |
| In September 2025, Meta launched Ray-Ban Display glasses with a wrist band for finger gestures in the United States at USD 799. | Launched. Raises user expectations for gesture input. |
| In February 2025, Microsoft confirmed that HoloLens 2 is no longer manufactured. | Discontinued. Removes a major hand-tracking device. |
Need a Custom Version of This Report?
Tailor the scope, geography, or segments to your exact requirements.
- Custom geography or segment scope
- Direct access to our analyst team
Chip Suppliers, Device Makers and Algorithm Specialists Shape the Market
Gesture recognition is supplied by chip makers, device owners and software specialists, and several early specialists have left the field. No share ranking is given because few suppliers report gesture revenue.
Who supplies the chips and sensors?
Qualcomm Incorporated supplies phone and XR processors whose AI engines run hand-tracking software. Sony Group Corporation is a leading maker of image sensors used in gesture cameras. Microchip Technology sells GestIC electric-field gesture controllers for close-range input. Infineon Technologies sells radar sensors and a radar gesture library, which compete with 2D camera systems at the premium end. NXP Semiconductors, not on the company list, describes automotive sensors with gesture recognition in its fiscal 2025 Form 10-K.
Who builds gesture into devices?
Samsung Electronics builds camera and motion gesture features into phones and wearables. Microsoft Corporation pioneered hand tracking with HoloLens 2, which is no longer manufactured. Intel Corporation spun out its RealSense camera business in 2025, which Cognex agreed to buy in 2026.
Who are the algorithm specialists?
ArcSoft, Inc. supplies camera algorithms to phone makers and driver-monitoring software used in more than 52 vehicle models. PointGrab was an early developer of camera-based gesture software, and its current gesture activity could not be confirmed. Crunchfish AB explored selling its gesture subsidiary in 2024 and now focuses on payments.
How do suppliers compete?
Suppliers compete on accuracy, latency, power use and ease of integration. Platform owners that ship gesture as part of chips or operating systems hold the strongest position, while specialists survive by tuning models for cars, kiosks and medical settings.
Frequently Asked Questions
How big is the 2D gesture recognition market?
What is 2D gesture recognition?
What drives the market?
Which application is largest?
Which region leads?
What holds the market back?
Table of Content
Chapter 1 Market Segmentation
- 1.1 Segmentation Framework
- 1.1.1 Product and Service Classification
- 1.1.2 Application and End-Use Classification
- 1.1.3 Technology and Solution Classification
- 1.1.4 Customer and Distribution Channel Classification
- 1.1.5 Geographic Segmentation
- 1.1.6 Market Segment Definitions and Boundaries
- 1.2 By Technology
- 1.2.1 Touch-Based Gesture Recognition
- 1.2.2 Touch-Less/Vision-Based Gesture Recognition
- 1.3 By Component
- 1.3.1 Hardware
- 1.3.2 Software/Algorithms
- 1.3.3 Services
- 1.4 By Input Device
- 1.4.1 RGB Camera
- 1.4.2 IR/Proximity Sensor
- 1.4.3 Embedded Camera Module
- 1.5 By Application
- 1.5.1 Touchless Control
- 1.5.2 Gaming
- 1.5.3 Automotive HMI
- 1.5.4 Sign Language/Accessibility
- 1.5.5 Industrial Controls
- 1.6 By Industry Vertical
- 1.6.1 Automotive
- 1.6.2 Consumer Electronics
- 1.6.3 BFSI
- 1.6.4 Government
- 1.6.5 Healthcare
- 1.6.6 Retail
- 1.7 By Deployment
- 1.7.1 Edge/On-Device
- 1.7.2 PC/Embedded
- 1.7.3 Cloud-Assisted
Chapter 2 Introduction
- 2.1 Report Objectives and Scope
- 2.2 Product Definition and Industry Terminology
- 2.3 Market Inclusions and Exclusions
- 2.4 Research Process
- 2.4.1 Primary Research and Expert Interviews
- 2.4.2 Secondary Research and Source Review
- 2.4.3 Top-Down and Bottom-Up Estimation
- 2.4.4 Data Triangulation and Verification
- 2.5 Market Size Measurement Basis
- 2.5.1 2025: USD 202.0 million → 2035: USD 1,235.2 million
- 2.6 Historical and Forecast Reference Periods
- 2.6.1 Historical Period: 2018-2025
- 2.6.2 Base Year: 2025
- 2.6.3 Forecast Period: 2025-2035
- 2.7 Research Assumptions and Limitations
Chapter 3 Executive Summary
- 3.1 Market Snapshot and Key Findings
- 3.2 Base-Year Market Size, 2025
- 3.3 Forecast Market Size, 2035
- 3.4 Revenue and Volume Growth Outlook
- 3.5 Key Demand and Supply Indicators
- 3.6 Leading Market Segments
- 3.7 Fastest-Growing Market Opportunities
- 3.8 Regional Performance Highlights
- 3.9 Technology and Industry Transformation
- 3.10 Competitive Landscape Summary
- 3.11 Analyst View and Strategic Implications
Chapter 4 Global 2D Gesture Recognition Market Trends and Developments
- 4.1 Historical Industry Development, 2018-2025
- 4.2 Recent Market Trends and Developments
- 4.3 Demand and Customer Behavior Trends
- 4.4 Technology and Product Innovation
- 4.5 Artificial Intelligence, Automation and Digitalization
- 4.6 Local Manufacturing and Supply Chain Realignment
- 4.7 Industry Partnerships, Mergers and Acquisitions
- 4.8 Sustainability and Circular Economy Developments
- 4.9 Government and Private Sector Investment Trends
- 4.10 Emerging Business Models and Commercialization
- 4.11 Industry Developments and Announcements
Chapter 5 Global 2D Gesture Recognition Market Production, Supply and Demand Analysis
- 5.1 Demand Trend and Consumption Analysis, 2018-2025
- 5.2 Demand Forecast, 2025-2035
- 5.3 Production and Output Trend, 2018-2025
- 5.4 Production and Output Forecast, 2025-2035
- 5.5 Installed Capacity and Capacity Utilization
- 5.6 Company-Wise Production Plants and Statistics
- 5.6.1 Installed Production Capacity
- 5.6.2 Actual Production
- 5.6.3 Planned Capacity and Expansion Targets
- 5.7 Supply Chain Structure and Procurement Trends
- 5.8 Supply-Demand Gap and Bottlenecks
- 5.9 Import Dependence and Sourcing Structure
- 5.10 Contract Manufacturing and Outsourcing
- 5.11 Regional Supply and Demand Concentration
Chapter 6 Global 2D Gesture Recognition Market Pricing Analysis
- 6.1 Pricing Structure and Measurement
- 6.2 Historical Pricing Trends, 2018-2025
- 6.3 Pricing Outlook, 2025-2035
- 6.4 Average Selling Price and Unit Economics
- 6.5 Pricing by Product and Market Segment
- 6.6 Geographic Pricing Differences
- 6.7 Key Input, Energy, Labor and Logistics Costs
- 6.8 Contract Pricing and Purchasing Models
- 6.9 Pricing Sensitivity and Competitive Positioning
- 6.10 Price, Margin and Profitability Implications
Chapter 7 Global 2D Gesture Recognition Market Dynamics
- 7.1 Market Growth Drivers
- 7.1.1 Demand-Side Drivers
- 7.1.2 Technology and Innovation Drivers
- 7.1.3 Infrastructure and Investment Drivers
- 7.1.4 Regulatory and Policy Drivers
- 7.2 Market Restraints
- 7.2.1 Cost and Affordability Constraints
- 7.2.2 Technology and Adoption Barriers
- 7.2.3 Supply Chain and Operational Constraints
- 7.3 Market Challenges
- 7.3.1 Competitive Pressure and Margin Erosion
- 7.3.2 Skills, Infrastructure and Implementation Gaps
- 7.4 Emerging Market Opportunities
- 7.5 Market Dynamics Impact and Time-Horizon Assessment
Chapter 8 Global 2D Gesture Recognition Value Chain Analysis
- 8.1 Industry Value Chain Overview
- 8.2 Upstream Suppliers and Critical Inputs
- 8.3 Technology and Component Providers
- 8.4 Manufacturing or Service Delivery
- 8.5 Distribution, Channel Partners and Integrators
- 8.6 Downstream Applications and End Users
- 8.7 Value Addition and Profit Pools
- 8.8 Vertical Integration and Outsourcing
- 8.9 Supplier Concentration and Risk
- 8.10 Supply Chain Localization and Resilience
Chapter 9 Global 2D Gesture Recognition Market Regulations and Policies
- 9.1 Relevant Laws, Standards and Compliance Frameworks
- 9.2 Product, Service, Safety and Quality Requirements
- 9.3 Government Policies, Incentives and Subsidies
- 9.4 Imports, Exports and Trade Barriers
- 9.5 Public Procurement and Local Content Requirements
- 9.6 Environmental and Sustainability Compliance
- 9.7 Upcoming Policy Changes and Market Implications
Chapter 10 Global 2D Gesture Recognition Market Hotspots and Opportunities
- 10.1 Market Opportunity Mapping and Growth Hotspots
- 10.2 High-Growth Applications and Customer Groups
- 10.3 Underserved Markets and White-Space Opportunities
- 10.4 Emerging Technology and Product Opportunities
- 10.5 New Capacity and Investment Hotspots
- 10.6 Market Entry and Expansion Opportunities
- 10.7 Distribution and Partnership Opportunities
- 10.8 Near-Term and Long-Term Commercial Potential
- 10.9 Opportunity Attractiveness and Execution Risks
Chapter 11 Global 2D Gesture Recognition Market Outlook, 2025-2035
- 11.1 Market Size and Analysis
- 11.1.1 Revenue (Market Measurement: 2025: USD 202.0 million → 2035: USD 1,235.2 million)
- 11.1.2 Market Volume and Quantity Sold
- 11.1.3 Historical Market Size, 2018-2025
- 11.1.4 Base-Year Market Size, 2025
- 11.2 Market Forecast, 2025-2035
- 11.2.1 Revenue Forecast to 2035
- 11.2.2 Volume Forecast to 2035
- 11.2.3 CAGR and Year-on-Year Growth
- 11.2.4 Incremental Revenue Opportunity
- 11.3 Forecast Assumptions and Scenario Analysis
- 11.3.1 Base-Case Forecast
- 11.3.2 Optimistic and Conservative Scenarios
- 11.3.3 Technology, Pricing and Policy Sensitivities
- 11.4 Market Attractiveness and Growth Outlook
Chapter 12 Global 2D Gesture Recognition Market Segmentation and Outlook
- 12.1 Segmentation Summary and Market Shares, 2025
- 12.2 Largest and Fastest-Growing Segments
- 12.3 By Technology - Market Size and Forecast, 2025-2035
- 12.3.1 Segment Definition and Scope
- 12.3.2 Historical Market Size, 2018-2025
- 12.3.3 Revenue Forecast, 2025-2035
- 12.3.4 Volume Forecast, 2025-2035
- 12.3.5 Base-Year Market Share, 2025
- 12.3.6 Segment CAGR and Growth Drivers
- 12.3.7 Subsegment Market Size and Forecast
- 12.3.7.1 Touch-Based Gesture Recognition
- 12.3.7.2 Touch-Less/Vision-Based Gesture Recognition
- 12.3.8 Subsegment Pricing and Adoption Trends
- 12.3.9 Leading Suppliers and Competition
- 12.3.10 Regional Demand and Opportunities
- 12.4 By Component - Market Size and Forecast, 2025-2035
- 12.4.1 Segment Definition and Scope
- 12.4.2 Historical Market Size, 2018-2025
- 12.4.3 Revenue Forecast, 2025-2035
- 12.4.4 Volume Forecast, 2025-2035
- 12.4.5 Base-Year Market Share, 2025
- 12.4.6 Segment CAGR and Growth Drivers
- 12.4.7 Subsegment Market Size and Forecast
- 12.4.7.1 Hardware
- 12.4.7.2 Software/Algorithms
- 12.4.7.3 Services
- 12.4.8 Subsegment Pricing and Adoption Trends
- 12.4.9 Leading Suppliers and Competition
- 12.4.10 Regional Demand and Opportunities
- 12.5 By Input Device - Market Size and Forecast, 2025-2035
- 12.5.1 Segment Definition and Scope
- 12.5.2 Historical Market Size, 2018-2025
- 12.5.3 Revenue Forecast, 2025-2035
- 12.5.4 Volume Forecast, 2025-2035
- 12.5.5 Base-Year Market Share, 2025
- 12.5.6 Segment CAGR and Growth Drivers
- 12.5.7 Subsegment Market Size and Forecast
- 12.5.7.1 RGB Camera
- 12.5.7.2 IR/Proximity Sensor
- 12.5.7.3 Embedded Camera Module
- 12.5.8 Subsegment Pricing and Adoption Trends
- 12.5.9 Leading Suppliers and Competition
- 12.5.10 Regional Demand and Opportunities
- 12.6 By Application - Market Size and Forecast, 2025-2035
- 12.6.1 Segment Definition and Scope
- 12.6.2 Historical Market Size, 2018-2025
- 12.6.3 Revenue Forecast, 2025-2035
- 12.6.4 Volume Forecast, 2025-2035
- 12.6.5 Base-Year Market Share, 2025
- 12.6.6 Segment CAGR and Growth Drivers
- 12.6.7 Subsegment Market Size and Forecast
- 12.6.7.1 Touchless Control
- 12.6.7.2 Gaming
- 12.6.7.3 Automotive HMI
- 12.6.7.4 Sign Language/Accessibility
- 12.6.7.5 Industrial Controls
- 12.6.8 Subsegment Pricing and Adoption Trends
- 12.6.9 Leading Suppliers and Competition
- 12.6.10 Regional Demand and Opportunities
- 12.7 By Industry Vertical - Market Size and Forecast, 2025-2035
- 12.7.1 Segment Definition and Scope
- 12.7.2 Historical Market Size, 2018-2025
- 12.7.3 Revenue Forecast, 2025-2035
- 12.7.4 Volume Forecast, 2025-2035
- 12.7.5 Base-Year Market Share, 2025
- 12.7.6 Segment CAGR and Growth Drivers
- 12.7.7 Subsegment Market Size and Forecast
- 12.7.7.1 Automotive
- 12.7.7.2 Consumer Electronics
- 12.7.7.3 BFSI
- 12.7.7.4 Government
- 12.7.7.5 Healthcare
- 12.7.7.6 Retail
- 12.7.8 Subsegment Pricing and Adoption Trends
- 12.7.9 Leading Suppliers and Competition
- 12.7.10 Regional Demand and Opportunities
- 12.8 By Deployment - Market Size and Forecast, 2025-2035
- 12.8.1 Segment Definition and Scope
- 12.8.2 Historical Market Size, 2018-2025
- 12.8.3 Revenue Forecast, 2025-2035
- 12.8.4 Volume Forecast, 2025-2035
- 12.8.5 Base-Year Market Share, 2025
- 12.8.6 Segment CAGR and Growth Drivers
- 12.8.7 Subsegment Market Size and Forecast
- 12.8.7.1 Edge/On-Device
- 12.8.7.2 PC/Embedded
- 12.8.7.3 Cloud-Assisted
- 12.8.8 Subsegment Pricing and Adoption Trends
- 12.8.9 Leading Suppliers and Competition
- 12.8.10 Regional Demand and Opportunities
- 12.9 Segment Growth Comparison
- 12.10 Segment Attractiveness and Priority Matrix
Chapter 13 Global 2D Gesture Recognition End-Use and Application Market Outlook
- 13.1 End-Use Industry and Customer Demand Structure
- 13.2 Leading Applications and Customer Groups
- 13.3 End-Use Market Size, Share and Forecast
- 13.4 Major End-Use Industry Deep Dives
- 13.4.1 Customer Requirements and Use Cases
- 13.4.2 Demand and Replacement Cycles
- 13.4.3 Technical and Regulatory Considerations
- 13.4.4 Purchasing and Procurement Models
- 13.4.5 Leading Vendors and Distribution Channels
- 13.4.6 Forecast and Commercial Opportunities
- 13.5 Emerging Applications and Cross-Segment Demand
- 13.6 End-Use Industry Investment Priorities
Chapter 14 Global 2D Gesture Recognition Geographic Market Outlook, 2025-2035
- 14.1 Regional Market Size and Share, 2025
- 14.2 Regional Market Forecast, 2025-2035
- 14.3 Regional Pricing, Production and Demand Differences
- 14.4 North America
- 14.4.1 United States
- 14.4.2 Canada
- 14.4.3 Mexico
- 14.5 Europe
- 14.5.1 Germany
- 14.5.2 France
- 14.5.3 Italy
- 14.5.4 United Kingdom
- 14.5.5 Spain
- 14.5.6 Poland
- 14.5.7 Russia
- 14.5.8 Netherlands
- 14.5.9 Belgium
- 14.5.10 Sweden
- 14.5.11 Denmark
- 14.5.12 Norway
- 14.5.13 Rest of Europe
- 14.6 Asia Pacific
- 14.6.1 China
- 14.6.2 India
- 14.6.3 Japan
- 14.6.4 South Korea
- 14.6.5 Thailand
- 14.6.6 Indonesia
- 14.6.7 Vietnam
- 14.6.8 Malaysia
- 14.6.9 Australia
- 14.6.10 Rest of Asia Pacific
- 14.7 Latin America
- 14.7.1 Brazil
- 14.7.2 Argentina
- 14.7.3 Colombia
- 14.7.4 Chile
- 14.7.5 Rest of Latin America
- 14.8 Middle East
- 14.8.1 Saudi Arabia
- 14.8.2 United Arab Emirates
- 14.8.3 Turkey
- 14.8.4 Israel
- 14.8.5 Iran
- 14.8.6 Rest of the Middle East
- 14.9 Africa
- 14.9.1 South Africa
- 14.9.2 Egypt
- 14.9.3 Nigeria
- 14.9.4 Morocco
- 14.9.5 Rest of Africa
- 14.10 Regional Investment, Policy and Supply Chain Differences
- 14.11 Regional Competitive Landscape
- 14.12 Geographic Growth Hotspots
Chapter 15 Global 2D Gesture Recognition Technology, Innovation and Sustainability Outlook
- 15.1 Technology Landscape and Maturity
- 15.2 Product, Process and Service Innovation
- 15.3 AI, Automation and Digital Tools in the Industry
- 15.4 Technology Adoption and Performance Benchmarking
- 15.5 Innovation Pipeline and R&D Investment
- 15.6 Patent and Intellectual Property Trends
- 15.7 Energy Efficiency and Resource Management
- 15.8 Sustainability, Recycling and Circularity
- 15.9 Technology Roadmap, 2025-2035
- 15.10 Risks of Obsolescence and Technology Substitution
Chapter 16 Global 2D Gesture Recognition Market Key Strategic Imperatives
- 16.1 Growth and Market Entry Priorities
- 16.2 High-Return Products and Segments
- 16.3 Pricing, Profitability and Cost Optimization
- 16.4 Technology Investment and Product Differentiation
- 16.5 Supply Chain Localization and Resilience
- 16.6 Distribution and Customer Acquisition
- 16.7 Partnership, Acquisition and Capacity Strategy
- 16.8 Regional Expansion Priorities
- 16.9 Short-, Medium- and Long-Term Actions
Chapter 17 Competition Outlook
- 17.1 Industry Competition Characteristics
- 17.2 Market Structure and Concentration
- 17.3 Market Share and Competitive Positioning, 2025
- 17.4 Company-Wise Revenue and Product Benchmarking
- 17.5 Production and Service Capacity Benchmarking
- 17.6 Technology, Pricing and Differentiation
- 17.7 Regional Footprint and Distribution Strength
- 17.8 Mergers, Acquisitions and Strategic Alliances
- 17.9 New Entrants and Competitive Threats
- 17.10 Porter's Five Forces and Industry Attractiveness
- 17.11 Competitive Outlook, 2025-2035
Chapter 18 Company Profiles
- 18.1 Company Coverage and Selection Criteria
- 18.2 Qualcomm Incorporated
- 18.2.1 Business Description
- 18.2.2 Company Ownership and Geographic Presence
- 18.2.3 Product and Service Portfolio
- 18.2.4 Manufacturing and Operating Footprint
- 18.2.5 Production Capacity and Expansion Plans
- 18.2.6 Financial Performance and Investment
- 18.2.7 Market Share and Competitive Position
- 18.2.8 Technology and Innovation Capabilities
- 18.2.9 Strategic Alliances or Partnerships
- 18.2.10 Recent Developments
- 18.2.11 Growth Strategy and Outlook
- 18.3 Intel Corporation
- 18.4 Microchip Technology
- 18.5 Microsoft Corporation
- 18.6 Sony Group Corporation
- 18.7 Samsung Electronics
- 18.8 Infineon Technologies
- 18.9 PointGrab
- 18.10 Crunchfish AB
- 18.11 ArcSoft, Inc.
- 18.12 Other Relevant Market Participants
Note: Every listed company is profiled on the structure shown under the first company. The company list is preliminary and may change based on research findings, market developments, data availability and client requirements.
Chapter 19 Disclaimer
- 19.1 Research and Forecast Disclaimer
- 19.2 Data Source and Estimation Limitations
Note: The depth of individual sections depends on data availability for this market. Volume, capacity, trade and other unit-based metrics are included where applicable.