
| REPORT ATTRIBUTE | DETAILS |
|---|---|
| Historical Period | 2019-2022 |
| Base Year | 2023 |
| Forecast Period | 2024-2032 |
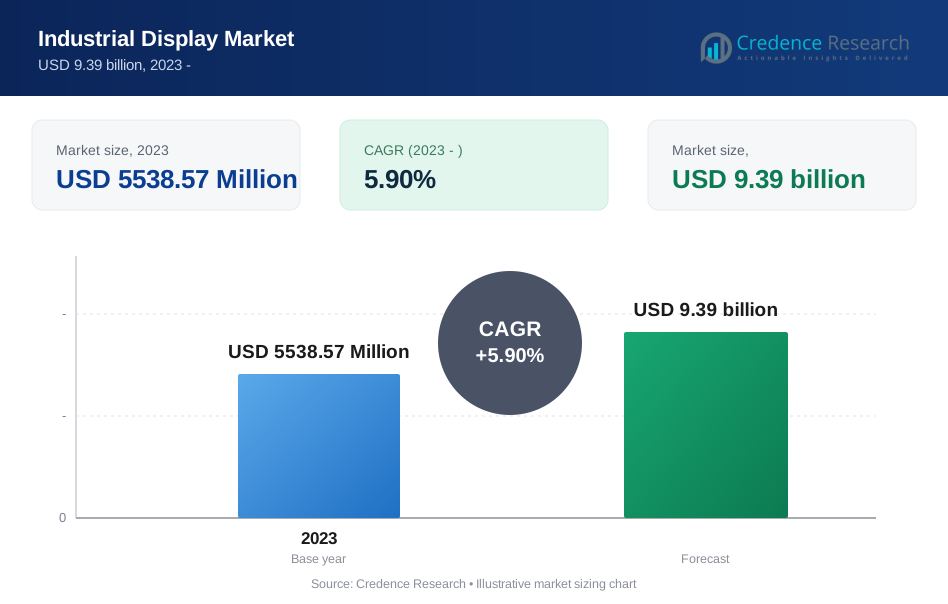
| Industrial Display Market Size 2023 | USD 5.54 billion |
| Industrial Display Market, CAGR | 5.90% |
| Industrial Display Market Size 2032 | USD 9.39 billion |
Market Overview:
The industrial display market, currently valued at USD 5.54 billion, is poised for steady growth, projected to reach USD 9.39 billion by 2032 at a CAGR of 5.90%.
The industrial display market is witnessing a surge in demand driven by the increasing adoption of Human-Machine Interface (HMI) devices in industrial automation and control systems. These devices rely on advanced displays for efficient operation and data visualization, leading to a growing need for high-definition (HD) displays with touch screen capabilities. LED-backlit LCD displays, known for their superior energy efficiency, brightness, and durability, are emerging as the preferred choice for industrial applications, further fueling market growth. Moreover, the integration of Industrial IoT (IIoT) is amplifying the demand for robust and reliable displays for data visualization and monitoring within connected industrial environments, reflecting the market's evolution towards smarter and more interconnected systems.
Geographically, the market exhibits diversity, with Asia Pacific leading the market due to significant industrial activity and rising automation adoption. North America and Europe also contribute substantially, with mature markets characterized by established players and continued demand for advanced display solutions. Stringent safety regulations and ongoing technological advancements further propel market growth in these regions. Major players such as Samsung Electronics, LG Display, Panasonic Corporation, and Schneider Electric are actively driving innovation and forming strategic partnerships to maintain their competitive positions in the dynamic industrial display market.
Market Drivers:
Automation and Industry 4.0 Integration:
The surge in automation and the widespread adoption of Industry 4.0 principles drive the need for advanced display solutions in industrial settings. For instance, in the automotive industry, the integration of Industry 4.0 principles has led to the rise of smart factories where advanced display solutions are crucial for monitoring and controlling automated systems.
Demand for Large-Format Displays:
Manufacturing and processing facilities are increasingly seeking large-format displays to enhance process visualization and control. For instance, in the oil & gas industry, large-format displays are used in control rooms to monitor drilling operations and pipeline networks, enhancing situational awareness and decision-making capabilities.
Technological Advancements in Display Technology:
Continuous advancements in LED backlighting, LCD panel technology, and touch functionalities are driving the evolution of industrial displays. For instance, the development of Organic Light Emitting Diode (OLED) technology has led to displays with higher contrast ratios and wider viewing angles, making them ideal for industrial applications. Moreover, the integration of touch interactivity and multi-touch capabilities further expands the applications of industrial displays, catering to diverse industrial needs. For example, in the healthcare industry, touch-enabled displays are used in medical devices for patient monitoring and diagnostics. Some of the latest innovations in the industry include Thin-Film-Transistor (TFT) Liquid Crystal Display (LCD), Low-Temperature Poly-Silicon (LTPS), Digital Light Processing (DLP), and Color Filter (CF) technologies.
Penetration of Industrial IoT:
The increasing penetration of Industrial IoT (IIoT) solutions drives the demand for interactive and connected displays in industrial settings. These displays enable real-time data visualization, remote monitoring, and control capabilities within interconnected environments. As IIoT adoption continues to rise, the demand for robust and versatile industrial displays is expected to remain high, supporting the seamless integration of smart technologies and enhancing operational efficiency across industries.
Market Trends:
Rising Demand for Advanced Display Technologies:
Industrial displays are experiencing a surge in demand driven by the need for enhanced functionality and usability. Beyond basic visuals, these displays now incorporate features like touchscreens, high-resolution capabilities, and wider viewing angles. For instance, in the industrial sector, companies like Siemens and Rockwell Automation are leveraging advanced display technologies for their automation systems. These displays offer high-resolution visuals and touchscreens, enabling operators to interact with the system more efficiently and make informed decisions.Such advancements enable improved user interaction, data visualization, and operational efficiency in industrial settings. Moreover, the integration of industrial displays with Industrial IoT (IIoT) technologies is fostering the development of intelligent systems capable of real-time data collection, analysis, and decision-making. This convergence facilitates remote monitoring, predictive maintenance, and optimized production processes, further driving the adoption of advanced display technologies in industrial environments.
Focus on Ruggedness and Environmental Sustainability:
The industrial display market is witnessing a growing emphasis on ruggedness and environmental sustainability. Industrial displays often operate in challenging environments, necessitating features like dust and water resistance, extreme temperature tolerance, and shockproof capabilities to ensure reliability and durability. Additionally, there is a notable shift towards sustainability initiatives among manufacturers, who are increasingly prioritizing energy-efficient displays with reduced environmental impact throughout their lifecycle. For instance, signage displays that have earned the ENERGY STAR are 4 percent more energy efficient than conventional options. This aligns with the rising sustainability concerns within the industrial sector, driving the adoption of eco-friendly display solutions that meet both performance and environmental standards.
Market Challenges Analysis:
High Initial Costs:
Industrial displays often come with a substantial upfront investment, posing a challenge for businesses, especially smaller enterprises or those operating on tight budgets. This higher cost is attributed to several factors inherent to industrial-grade displays. Firstly, these displays incorporate advanced technologies such as high resolution, wide viewing angles, and ruggedized designs, which inherently increase production expenses. Additionally, industrial applications frequently necessitate customized displays tailored to specific functionalities and features, further driving up costs compared to mass-produced consumer-grade models.
Complex Supply Chain Management:
The industrial display market operates within a complex supply chain ecosystem, encompassing raw material suppliers, manufacturers, and distributors. This intricate network can be susceptible to various disruptions, further complicating cost considerations. Geopolitical instability, such as trade wars or political tensions, can disrupt the flow of raw materials or finished products, leading to production delays and increased costs. Moreover, fluctuations in the prices of key raw materials like semiconductors and rare earth metals contribute to price volatility for industrial displays, adding another layer of uncertainty to cost management efforts.
Segmentation Analysis:
By Type:
Industrial displays come in various types tailored to specific applications and environmental conditions. Rugged displays are engineered to withstand harsh environments, offering features like dustproof, waterproof, and shockproof capabilities, making them ideal for industrial settings with challenging conditions. Open frame monitors are standalone displays with exposed edges, commonly utilized in industrial automation and control systems for their versatility. Panel-mount monitors, on the other hand, are integrated displays designed to be directly mounted into panels or equipment, widely used in Human-Machine Interface (HMI) systems for seamless integration and operation. Marine displays cater to maritime environments, built to endure the demanding conditions at sea. Finally, video walls, composed of multiple panels, serve for data visualization and collaborative viewing, finding applications in control rooms and command centers.
By Application:
Industrial displays find diverse applications across various sectors. They serve as Human-Machine Interface (HMI) displays for interacting with machines and monitoring industrial processes, facilitating efficient operation and control in manufacturing environments. In remote monitoring applications, these displays enable operators to observe and manage operations from distant locations, enhancing flexibility and operational efficiency. Interactive displays, often equipped with touchscreens, allow for user input and intuitive data visualization, promoting enhanced user engagement and interaction. Furthermore, industrial displays are utilized in digital signage applications for displaying information, advertisements, and other content in public spaces, contributing to effective communication and information dissemination.
Segments:
Based on Type :
- Rugged Displays
- Open Frame Monitors
- Panel-Mount Monitors
- Marine Displays
- Video Walls
Based on Application :
- HMI
- Remote Monitoring
- Interactive Display
- Digital Signage
Based on Technology:
- LCD
- LED
- OLED
- E-Paper
Based on Panel Size :
- Up to 14”
- 14-21”
- 21-40”
- 40” and above
Based on End-use :
- Manufacturing
- Mining & Metals
- Chemical, Oil, and Gas
- Energy & Power
- Others
Based on Regional :
- North America
- The U.S.
- Canada
- Mexico
- Europe
- Germany
- France
- The U.K.
- Italy
- Spain
- Rest of Europe
- Asia Pacific
- China
- Japan
- India
- South Korea
- South-east Asia
- Rest of Asia Pacific
- Latin America
- Brazil
- Argentina
- Rest of Latin America
- Middle East & Africa
- GCC Countries
- South Africa
- Rest of Middle East and Africa
Regional Analysis:
Asia Pacific Region:
The Asia Pacific region holds the largest share of the global Industrial Display market, estimated to be around 55%. This region's dominance can be attributed to several factors, including the presence of major manufacturing hubs, rapid industrialization, and the increasing adoption of advanced display technologies across various industries.Countries like China, Japan, South Korea, and India are significant contributors to the Asia Pacific market share. The region's booming manufacturing sector, particularly in industries such as automotive, electronics, and machinery, has driven the demand for industrial displays for monitoring, control, and visualization applications.
North America and Europe Regions:
The North America and Europe regions collectively account for the remaining 45% share of the global Industrial Display market. While these regions have a relatively smaller market share compared to Asia Pacific, they are established markets with a strong focus on industrial automation, process control, and advanced manufacturing practices.In North America, the United States leads the way, driven by its well-established industrial base, the presence of major display manufacturers, and the adoption of cutting-edge display technologies across various sectors, including energy, transportation, and defense.Europe, with countries like Germany, France, and the United Kingdom as major contributors, has a strong emphasis on industrial automation and the implementation of Industry 4.0 initiatives, driving the demand for advanced industrial displays in manufacturing facilities and process control applications.
Key player:
- Samsung (South Korea)
- LG Display (South Korea)
- Panasonic Corporation Co, Ltd (Japan)
- Japan Display Inc (Japan)
- AUO Corporation (Taiwan)
- BOE Technology Group Co., Ltd (China)
- Corning Incorporated (U.S.)
- DuPont (U.S.)
- FlexEnable Limited (U.K.)
- Kateeva (U.S.)
- SONY INDIA (India)
- Pioneer Corporation (Japan)
- WiseChip Semiconductor Inc. (Taiwan)
- WINSTAR Display Co., Ltd. (China)
- Visionox Company (China)
- SHARP CORPORATION (Japan)
- Innolux Corporation (Taiwan)
- RAYSTAR OPTRONICS, INC, (Taiwan)
- RITEK CORPORATION (Taiwan)
- OSRAM GmbH (Germany)
- Plessey (U.K.)
Competitive Analysis:
The Industrial Display market features a competitive landscape with established players like Samsung Display and LG Display holding significant market share. These companies leverage their expertise in panel manufacturing to offer a diverse range of industrial displays. Additionally, companies like Planar Systems (Leyard Optoelectronic) and Advantech specialize in ruggedized displays tailored for harsh industrial environments. Furthermore, global giants like Siemens and Schneider Electric integrate industrial displays into their automation solutions, offering comprehensive industrial control systems. This mix of specialized and diversified players fosters competition in technology, product offerings, and customer service, ultimately driving innovation and pushing the boundaries of industrial display capabilities.
Recent Developments:
In January 2023, Samsung Electronics Co., Ltd. developed the world’s first touch-integrated OLED display. It started using touch integrated panels in place of plastic touch film. Samsung developed On-Cell Touch AMOLED (OCTA) technology, which integrates the touch sensor directly into the panel, eliminating the need for separate touch screen panels.
In December 2022, LG Display Co., Ltd. launched a 97-inch OLED display panel which offers another level of cinematic experience for users due to its large size. In addition, it also launched a 77-inch 8K OLED panel which offers the highest level of resolution by controlling 33 million self-emissive pixels to deliver exceptional ultra-high- resolution images
In May 2022, AUO Corporation showcased the world’s first 34-inch AmLED curved gaming display panel with a 21:9 widescreen and a 165Hz ultra-high refresh rate at SID Display Week 2022
In 2022, Winmate introduced the M140TG 14-inch, a very rugged tablet developed to deliver field customer mobility and connectivity. This new Rugged Extreme tablet provides advanced processors and numerous connectivity choices in compact devices. Moreover, M140TG is designed to integrate functionality, ruggedness, mobile workforces, and mobility to form a dependable yet adaptable tablet that matches various situations and threats.
In 2022, Samsung will introduce the Smart Monitor M8 which is a 32-inch display. This new Monitor M8 produces a display that fits the design preference and matured lifestyle of Gen Z because they normally look for a one-stop solution to work, learn, and play. Moreover, the smart monitor would be available in spring green and sunset pink colors.
Market Concentration & Characteristics:
The Industrial Display market demonstrates a characteristic trend towards consolidation, with a few major players capturing a significant share. However, the market also features a diverse range of niche specialists catering to specific applications and regional demands. This dynamic fosters a balance between established industry leaders driving technological advancements and smaller, agile companies offering specialized solutions.
Report Coverage:
The research report offers an in-depth analysis based on Type, Application, Technology, and Region. It details leading market players, providing an overview of their business, product offerings, investments, revenue streams, and key applications. Additionally, the report includes insights into the competitive environment, SWOT analysis, current market trends, as well as the primary drivers and constraints. Furthermore, it discusses various factors that have driven market expansion in recent years. The report also explores market dynamics, regulatory scenarios, and technological advancements that are shaping the industry. It assesses the impact of external factors and global economic changes on market growth. Lastly, it provides strategic recommendations for new entrants and established companies to navigate the complexities of the market.
Future Outlook:
- Industrial displays will become increasingly integrated with IIoT platforms, enabling real-time data visualization, remote monitoring, and enhanced operational efficiency.
- Touchscreen displays will gain wider adoption due to their user-friendly interface and improved data interaction capabilities in industrial settings.
- Emerging technologies like MicroLED, OLED, and organic photovoltaics (OPVs) are expected to offer superior performance in terms of brightness, contrast, energy efficiency, and flexibility.
- Displays designed to withstand harsh industrial environments, including extreme temperatures, dust, and vibration, will see continued demand.
- As industrial applications become more data-intensive, the need for larger displays to visualize complex information will likely increase.
- AI-powered features like anomaly detection, predictive maintenance, and automated adjustments will be incorporated into industrial displays for enhanced functionality.
- The adoption of wireless technologies like Wi-Fi and Bluetooth will enable seamless data transmission and remote control of industrial displays.
- As industrial displays become more connected, robust cybersecurity measures will be crucial to protect against cyberattacks and data breaches.
- Manufacturers will focus on developing eco-friendly displays with reduced energy consumption and recyclable materials.
- Emerging economies in Asia Pacific and Latin America are expected to witness significant growth in the industrial display market due to rapid industrialization and infrastructure development.
Request a Free Sample
Fill in your details and we'll send you a free sample report.
- Sample data tables & charts
- Research methodology
Need a Custom Version of This Report?
Tailor the scope, geography, or segments to your exact requirements.
- Custom geography or segment scope
- Direct access to our analyst team
Frequently Asked Questions
What is the current size of the Industrial Display Market?
What factors are driving the growth of the Industrial Display Market?
What are the key segments within the Industrial Display Market?
What are some challenges faced by the Industrial Display Market?
Table of Content
Chapter 1. Report Introduction
- 1.1 Report Description & Purpose
- 1.1.1 Report Title & Market Definition
- 1.1.2 Unique Selling Propositions (USP) & Key Differentiators
- 1.1.3 Value Proposition for Stakeholders
- 1.2 Research Objectives
- 1.2.1 Market Sizing Objectives (Volume & Revenue) (Volume Where Applicable)
- 1.2.2 Segmentation Objectives
- 1.2.3 Competitive Intelligence Objectives
- 1.2.4 Forecast & Scenario Objectives
- 1.3 Report Scope
- 1.3.1 Industrial Display Scope – Segments & Subsegments Covered
- 1.3.2 Geographic Scope – Regions & Countries Covered
- 1.3.3 Historical Period, Base Year & Forecast Period (2023; forecast to the forecast period)
- 1.3.4 Inclusions & Exclusions
- 1.4 Industry Classification & Applicable Codes
- 1.5 Currency, Measurement Units & Valuation Basis
- 1.6 Target Stakeholders
- 1.7 Limitations & Assumptions
Chapter 2. Executive Summary
- 2.1 Global Industrial Display Market Snapshot
- 2.1.1 Market Size – Historical (2023) & Forecast (the forecast period) (2023: USD 5538.57 Million → forecast year: USD 9.39 billion)
- 2.1.2 Volume & Revenue – Global Totals (Volume Where Applicable)
- 2.1.3 Key Market Highlights – Top Five Facts
- 2.2 Industrial Display Market Segmentation Snapshot
- 2.2.1 Market Split by Region – 2023 vs.
- 2.3 Competitive Snapshot
- 2.3.1 Top 10 Players by Revenue Share – 2023
- 2.3.2 Top 10 Players by Volume Share – 2023 (Volume Where Applicable)
- 2.3.3 Recent Strategic Developments (18-Month Summary)
- 2.4 Key Investment Highlights & Strategic Conclusions
Chapter 3. Industrial Display Market Dynamics & Industry Analysis
- 3.1 Market Overview & Context
- 3.1.1 Industrial Display Market Position in the Broader Industry Value Chain
- 3.1.2 Demand Structure & Purchasing Dynamics
- 3.1.3 Market Maturity & Development Stage by Region
- 3.2 Industrial Display Market Drivers
- 3.3 Industrial Display Market Restraints & Challenges
- 3.4 Industrial Display Market Opportunities
- 3.5 Porter's Five Forces Analysis
- 3.5.1 Threat of New Entrants
- 3.5.2 Bargaining Power of Suppliers
- 3.5.3 Bargaining Power of Buyers
- 3.5.4 Threat of Substitutes
- 3.5.5 Competitive Rivalry – Intensity Assessment
- 3.6 Industrial Display Value Chain Analysis
- 3.6.1 Upstream – Key Inputs, Resources & Suppliers
- 3.6.1.1 Key Input/Resource 1
- 3.6.1.2 Key Input/Resource 2
- 3.6.1.3 Key Input/Resource 3
- 3.6.2 Midstream – Core Operations & Value Creation
- 3.6.2.1 Operating Model & Process Overview
- 3.6.2.2 Key Operating Locations & Capabilities by Company
- 3.6.3 Downstream – Market Channels & End Users
- 3.6.3.1 Direct Sales & Customer Engagement Channels
- 3.6.3.2 Indirect Sales, Intermediaries & Partner Channels
- 3.6.4 Value Chain Profitability Analysis
- 3.6.1 Upstream – Key Inputs, Resources & Suppliers
- 3.7 PESTEL Analysis
- 3.7.1 Political Factors
- 3.7.2 Economic Factors
- 3.7.3 Social Factors
- 3.7.4 Technological Factors
- 3.7.5 Environmental Factors
- 3.7.6 Legal Factors
- 3.8 Industrial Display Supply Chain Analysis
- 3.8.1 Critical Input & Resource Availability Risk Assessment
- 3.8.2 Supplier & Operational Concentration Risk (Geographic Exposure)
- 3.8.3 Supply & Service Disruption Impact Analysis
- 3.9 Regulatory & Policy Landscape
Note: The regulatory and policy landscape section covers regulations based on their applicability to the market, Industrial Display category, geography, and scope of the study. Only regulatory frameworks with a material impact on operations, compliance, trade, sustainability, or market access are analyzed in detail.
Chapter 4. Key Investment Pockets & Opportunity Analysis
- 4.1 Industrial Display Market Attractiveness Analysis
- 4.1.1 By Region – Investment Attractiveness Matrix (Market Size × CAGR)
- 4.2 Absolute Revenue Growth Opportunity
- 4.2.1 By Region – Absolute Revenue Growth Through the forecast period
- 4.3 Incremental Demand Opportunity
- 4.3.1 By Region – Incremental Demand Through the forecast period
- 4.3.2 Segment – Incremental Demand
- 4.4 Emerging Submarket Opportunity Deep Dive (Subject to Applicability)
- 4.5 Priority Market Opportunity Scorecards
- 4.5.1 United States
- 4.5.2 Europe
- 4.5.3 Asia
- 4.5.4 Middle East & Africa
Note: Priority market opportunity scorecards reflect the geographic scope and strategic relevance of the study. Listed markets are indicative and may be adapted to the industry.
Chapter 5. Industrial Display Cross-Border Trade & Market Access Analysis
- 5.1 International Trade & Cross-Border Activity Overview
- 5.1.1 Global Export Value by Country (2023)
- 5.1.2 Global Export Volume by Country (2023) (Volume Where Applicable)
- 5.1.3 Global Import Value by Country (2023)
- 5.1.4 Global Import Volume by Country (2023) (Volume Where Applicable)
- 5.1.5 Net Trade Balance by Country (2023)
- 5.2 Export Analysis – Segment
- 5.2.1 Category 1 (Applicable Classification Code)
- 5.2.2 Category 2 (Applicable Classification Code)
- 5.2.3 Category 3 (Applicable Classification Code)
- 5.2.4 Category 4 (Applicable Classification Code)
- 5.2.5 Category 5 (Applicable Classification Code)
- 5.3 Import Analysis – Segment
- 5.3.1 Category 1 (Applicable Classification Code)
- 5.3.2 Category 2 (Applicable Classification Code)
- 5.3.3 Category 3 (Applicable Classification Code)
- 5.3.4 Category 4 (Applicable Classification Code)
- 5.3.5 Category 5 (Applicable Classification Code)
- 5.4 Cross-Border Pricing & Transaction Benchmarks
- 5.4.1 Export Pricing – Segment & Country
- 5.4.2 Import Pricing – Segment & Source Country
- 5.4.3 Price Trends (2023)
- 5.5 Key Cross-Border Trade & Delivery Routes
- 5.5.1 Cross-Border Trade/Delivery Route 1
- 5.5.2 Cross-Border Trade/Delivery Route 2
- 5.5.3 Cross-Border Trade/Delivery Route 3
- 5.5.4 Cross-Border Trade/Delivery Route 4
- 5.5.5 Cross-Border Trade/Delivery Route 5
- 5.6 Trade Policy & Market Access Impact Assessment
- 5.6.1 Tariff & Non-Tariff Barriers
- 5.6.2 Regional Trade & Economic Integration Frameworks
- 5.6.3 Bilateral & Multilateral Trade Agreements
- 5.6.4 Cross-Border Operating, Licensing & Localization Requirements
Note: This chapter applies where cross-border trade or delivery is relevant to Industrial Display. Goods, services, and digital offerings are assessed using applicable classifications and transaction measures. Import-export volumes, trade balances, and route analyses are included only where meaningful to the market.
Chapter 6. Competitive Landscape & Company Benchmarking
- 6.1 Industrial Display Market Concentration & Structure
- 6.1.1 Herfindahl-Hirschman Index (HHI) – vs. 2023
- 6.1.2 Leading, Mid-Sized & Emerging Player Structure
- 6.1.3 Global, Regional & Local Player Dynamics
- 6.2 Industrial Display Market Share Analysis – 2023
- 6.2.1 Global Revenue Share by Company
- 6.2.2 Global Volume Share by Company (Volume Where Applicable)
- 6.2.3 Regional Revenue Share
- 6.2.4 Market Share Evolution ( vs. 2023)
- 6.2.5 Company Market Share by Key Segment
- 6.2.6 Company Market Share by Customer Group
- 6.3 Operating Scale, Capacity & Infrastructure Analysis
- 6.3.1 Global Operating Scale & Supply Capacity
- 6.3.2 Resource Utilization & Operating Efficiency
- 6.3.3 Output, Service Delivery & Activity Metrics
- 6.3.4 Operating Footprint & Infrastructure Map
- 6.3.5 Planned Operational & Capacity Expansion
- 6.4 Industrial Display Competitive Benchmarking Matrix
- 6.4.1 Revenue, Growth, Profitability & Operating Metric Comparison
- 6.4.2 Channel Revenue Mix
- 6.4.3 Geographic Revenue Exposure
- 6.4.4 R&D Intensity
- 6.4.5 Sustainability Maturity
- 6.5 Strategic Developments in Industrial Display (Last 24 Months)
- 6.5.1 Mergers, Acquisitions & Divestments
- 6.5.2 New Products, Services & Solutions in Industrial Display
- 6.5.3 Operational & Infrastructure Expansions
- 6.5.4 Strategic Alliances, Joint Ventures & Partnerships
- 6.5.5 Distribution Expansion & Market Entry
- 6.5.6 Sustainability & ESG Initiatives
- 6.6 Competitive Strategy Mapping
- 6.6.1 Leader, Challenger, Follower & Niche Classification
- 6.6.2 Pricing Strategy Comparison
- 6.6.3 Channel Strategy Matrix
Note: Strategic developments are included based on their materiality and the availability of reliable information.
Chapter 7. Global Industrial Display Market – By Sales & Delivery Channel
- 7.1 Segment Overview
- 7.1.1 Volume & Revenue Split by Channel (2023 & ) (Volume Where Applicable)
- 7.1.2 Channel Mix Evolution (the forecast period)
Chapter 8. Regional Market Analysis – Global Overview
- 8.1 Global Regional Overview
- 8.1.1 Regional Volume Share (Volume Where Applicable)
- 8.1.2 Regional Revenue Share
- 8.1.3 Regional Volume by Region (Volume Where Applicable)
- 8.1.4 Regional Revenue by Region
- 8.1.5 Regional Forecast Through the forecast period
- 8.2 Cross-Regional Segment Analysis
- 8.2.1 By Sales & Delivery Channel
- 8.2.2 By Competitive Positioning & Price Tier
Chapter 9. North America Industrial Display Market
- 9.1 United States
- 9.2 Canada
- 9.3 Mexico
Chapter 10. Europe Industrial Display Market
- 10.1 Germany
- 10.2 France
- 10.3 Italy
- 10.4 United Kingdom
- 10.5 Spain
- 10.6 Poland
- 10.7 Russia
- 10.8 Netherlands
- 10.9 Belgium
- 10.10 Sweden
- 10.11 Denmark
- 10.12 Norway
- 10.13 Rest of Europe
Chapter 11. Asia Pacific Industrial Display Market
- 11.1 China
- 11.2 India
- 11.3 Japan
- 11.4 South Korea
- 11.5 Thailand
- 11.6 Indonesia
- 11.7 Vietnam
- 11.8 Malaysia
- 11.9 Australia
- 11.10 Rest of Asia Pacific
Chapter 12. Latin America Industrial Display Market
- 12.1 Brazil
- 12.2 Argentina
- 12.3 Colombia
- 12.4 Chile
- 12.5 Rest of Latin America
Chapter 13. Middle East Industrial Display Market
- 13.1 Saudi Arabia
- 13.2 United Arab Emirates
- 13.3 Turkey
- 13.4 Israel
- 13.5 Iran
- 13.6 Rest of the Middle East
Chapter 14. Africa Industrial Display Market
- 14.1 South Africa
- 14.2 Egypt
- 14.3 Nigeria
- 14.4 Morocco
- 14.5 Rest of Africa
Chapter 15. Industrial Display Company Profiles
- 15.1 [Company 01]
- 15.1.1 Company Overview
- 15.1.2 Key Management Personnel
- 15.1.3 Products & Services Portfolio
- 15.1.4 Financial Performance
- 15.1.5 Key Market Focus & Geographic Presence
- 15.1.6 Recent Developments & Strategic Initiatives
Note: The company profile list is preliminary and may change based on research findings, market developments, data availability, and client requirements.
Chapter 16. Appendices
- Appendix A – List of Abbreviations & Acronyms
- Appendix B – Industry Classification Code Reference – Full Series
- Appendix C – Supply, Output & Operating Capacity Data Tables
- Appendix D – End-Use & Demand Base Tables
- Appendix E – Demand, Adoption & Usage Assumptions
- Appendix F – Pricing & Revenue Metric Reference Tables
- Appendix G – Company Operations & Infrastructure Database
- Appendix H – Cross-Border Trade & Activity Data Tables (Where Applicable)
- Appendix I – Regulatory Summary Tables
- Appendix J – Primary Research Participant List (Anonymized)
- Appendix K – Primary Research Questionnaire Framework
- Appendix L – Data Sources & Bibliography
- Appendix M – Market Size Divergence & Source Comparison
Chapter 17. Research Methodology
- 17.1 Research Framework & Philosophy
- 17.2 Secondary Research – Sources, Hierarchy & Data Extraction
- 17.3 Data Modeling – Bottom-Up & Top-Down Market Sizing
- 17.4 Primary Research – Stakeholder Framework, LOI & Sample Sizes
- 17.5 Forecast Methodology – Regression, Scenario & Sensitivity Analysis
- 17.6 Quality Control – Four-Layer Validation Framework
- 17.7 Limitations & Standard Assumptions
- 17.8 Disclaimer
