
A growing kidney failure population needs steady capacity
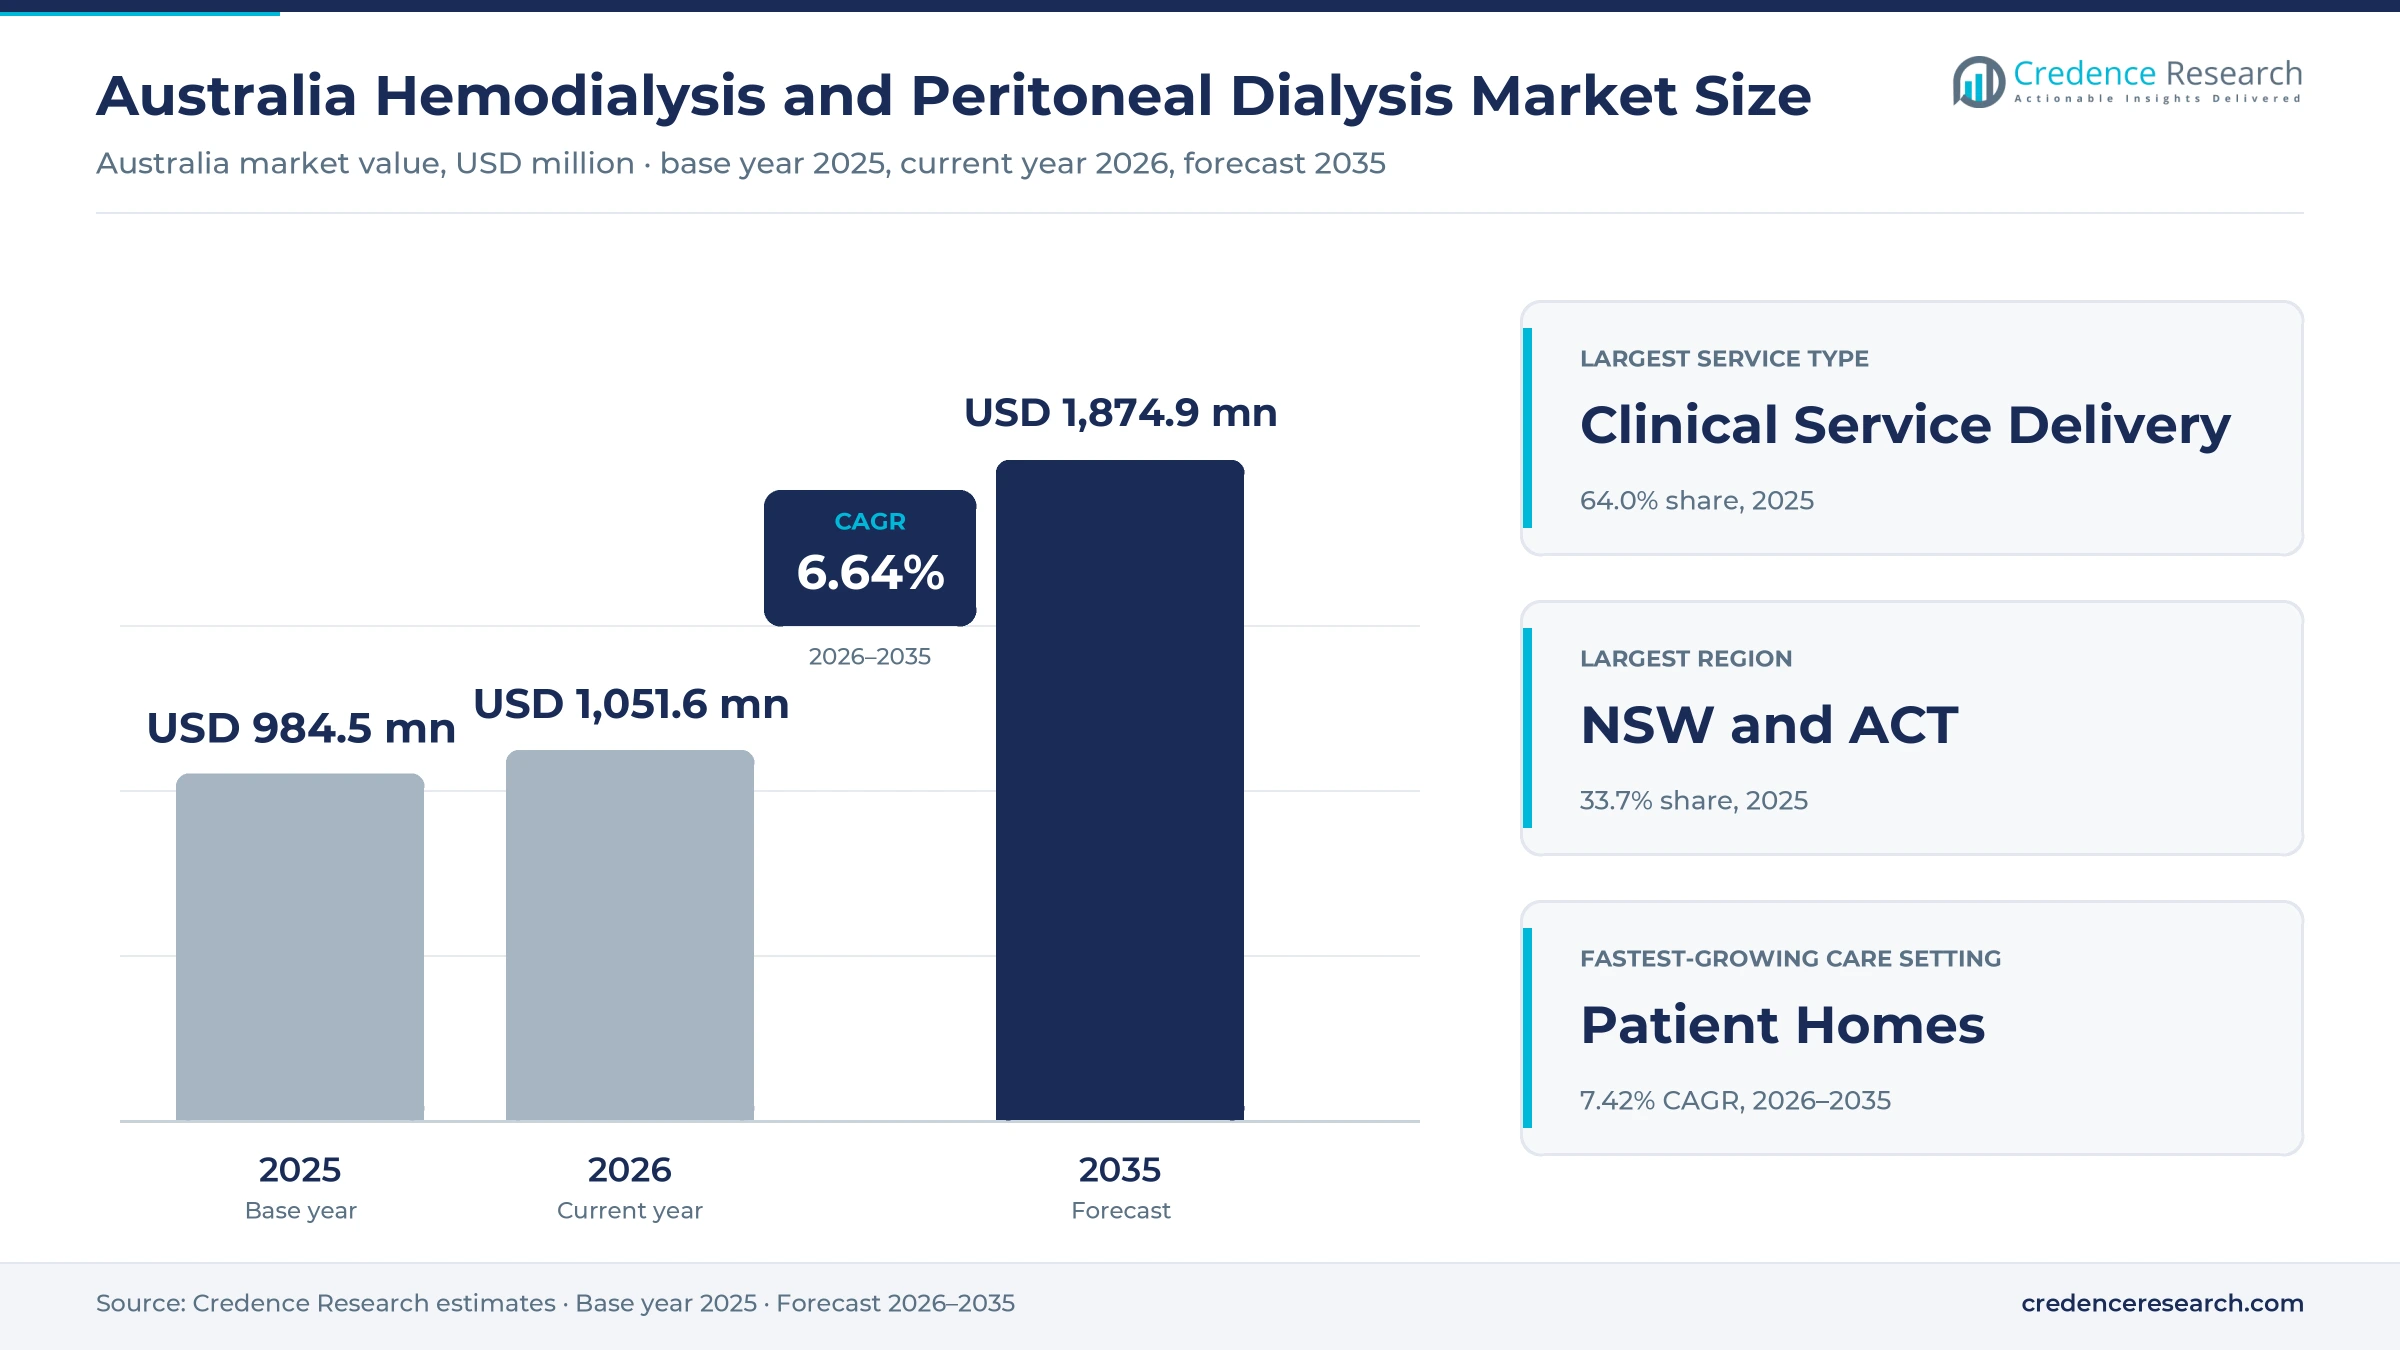
The Australia hemodialysis and peritoneal dialysis market was valued at USD 984.5 million in 2025 and is projected to increase from USD 1.05 billion in 2026 to USD 1.87 billion by 2035, registering a CAGR of 6.64% during 2026–2035. Demand comes from people with kidney failure who need treatment several times a week, funded mainly by state health networks, private hospitals and Medicare. New South Wales and Australian Capital Territory held the largest regional share, 33.7% in 2025, because the zone treats the most patients and runs large home therapy units. Queensland is the fastest-growing region at 6.90% a year, as state services open new satellite units in regional towns. In turn, national registry data released in September 2026 counted 16,011 Australians on treatment at the end of 2025, which keeps clinical services, consumables and new machines in steady demand.
Which kidney replacement services and supplies are counted?
The estimate measures spending in Australia on clinical service delivery, consumable supply and capital equipment provision for hemodialysis and peritoneal dialysis. It covers hospital renal units, satellite dialysis centres and patient homes, funded by state health networks, private care providers and community-controlled providers that run clinics in remote towns.
The estimate excludes kidney transplant surgery, acute kidney replacement in intensive care and medicines used to slow kidney disease. The value chain runs from machine, filter and fluid makers through tenders and distributors to renal units, nurses, patients and carers who treat at home.
Australia Hemodialysis and Peritoneal Dialysis Market Insights
- The Australia hemodialysis and peritoneal dialysis market was valued at USD 984.5 million in 2025 and is projected to reach USD 1.87 billion by 2035, at a 6.64% CAGR during 2026–2035.
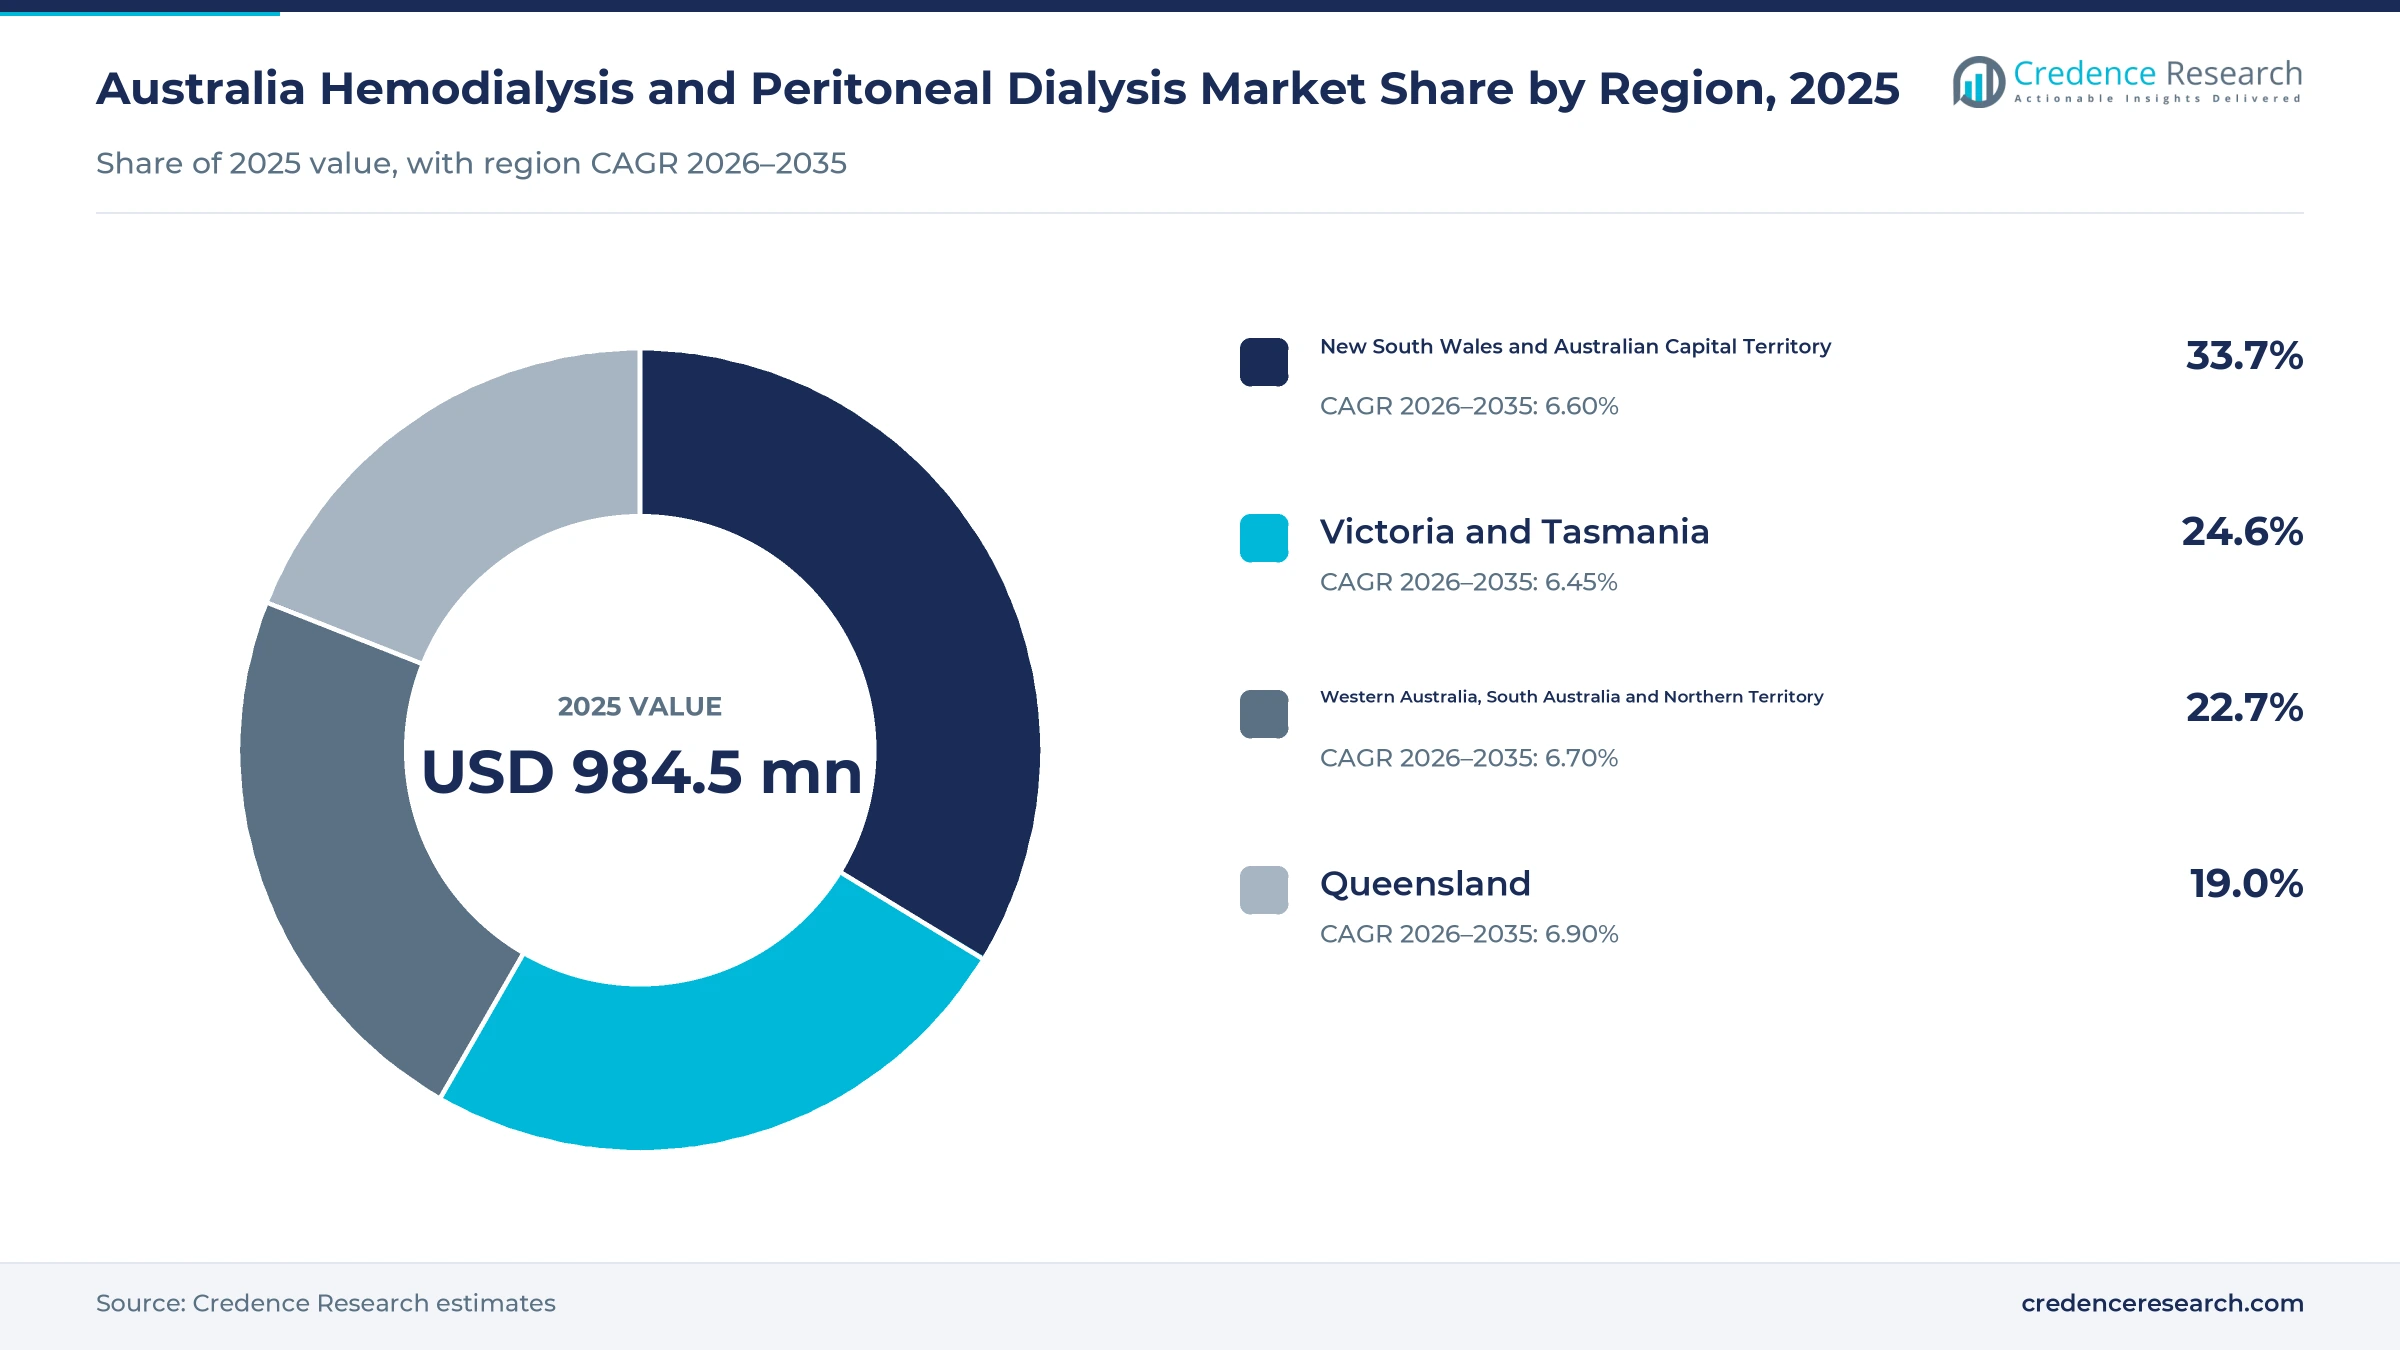
- New South Wales and Australian Capital Territory held 33.7% of 2025 value, as the zone treats the largest patient group in the country.
- Clinical service delivery led service types with 64.0% of 2025 value, because each patient needs nursing care, monitoring and facility time several times a week.
- In September 2026, the national kidney registry reported 16,011 Australians on treatment at Dec. 31, 2025, including 3,515 who treated at home.
- Patient homes grow fastest among care settings at 7.42% a year during 2026–2035, as renal units train more people for home therapy.
Clinical services lead as home therapies grow fastest
Why do clinical services hold most spending?
Based on service type, the market is categorized into clinical service delivery, consumable supply and capital equipment provision. Clinical Service Delivery led with 64.0% of 2025 value, because each patient needs nursing time, chair time and medical review about three times a week. Consumable Supply grows fastest at 6.96% a year, as more patients use filters, lines and fluids at home.
Where do Australians receive kidney replacement?
Based on care setting, the market is categorized into hospital renal units, satellite dialysis centres and patient homes. Satellite Dialysis Centres led with 47.0% of 2025 value, because most patients treat in community units close to where they live. Patient Homes grow fastest at 7.42% a year, as renal units train more patients and carers for home therapy.
Which treatment methods carry the most value?
Based on technology, the market is categorized into conventional hemodialysis, hemodiafiltration, automated peritoneal dialysis and continuous ambulatory peritoneal dialysis. Conventional Hemodialysis led with 58.0% of 2025 value, because it remains the standard in-center method. Hemodiafiltration grows fastest at 7.55% a year, as larger units adopt machines that clear more toxins per session and nephrologists gain more evidence on outcomes.
Why does diabetic kidney disease drive most demand?
Based on disease area, the market is categorized into diabetic kidney disease, glomerular disease, hypertensive kidney disease and remaining recorded kidney diagnoses. Diabetic Kidney Disease led with 38.0% of 2025 value, because diabetes is the most common cause of new kidney failure. Diabetic Kidney Disease grows fastest at 7.01% a year, as type 2 diabetes rises in older adults.
| Segment Group | Leading Sub-segment | Share, 2025 | Fastest-growing Sub-segment | CAGR, 2026–2035 |
|---|---|---|---|---|
| By Service Type | Clinical Service Delivery | 64.0% | Consumable Supply | 6.96% |
| By Care Setting | Satellite Dialysis Centres | 47.0% | Patient Homes | 7.42% |
| By Technology | Conventional Hemodialysis | 58.0% | Hemodiafiltration | 7.55% |
| By Disease Area | Diabetic Kidney Disease | 38.0% | Diabetic Kidney Disease | 7.01% |
Request a Free Sample
Fill in your details and we'll send you a free sample report.
- Sample data tables & charts
- Research methodology
Patient growth, new chairs and daily supplies drive demand
How does a growing kidney failure population lift demand?
A growing kidney failure population lifts demand, because most patients stay on treatment for years unless they receive a transplant. According to the national kidney registry, 16,011 Australians were on treatment at Dec. 31, 2025, or 580 per million people. Another 3,272 patients started treatment during 2025, a rate of 118 per million. Diabetic kidney disease caused 1,201 of these new cases, or 37%, ahead of glomerular disease with 599 cases. As a result, diabetic kidney disease leads disease areas with 38.0% of 2025 value, while long treatment periods keep service volumes rising each year across the country, especially in growing outer suburbs and regional cities with older populations.
Why does public capacity expansion add treatment chairs?
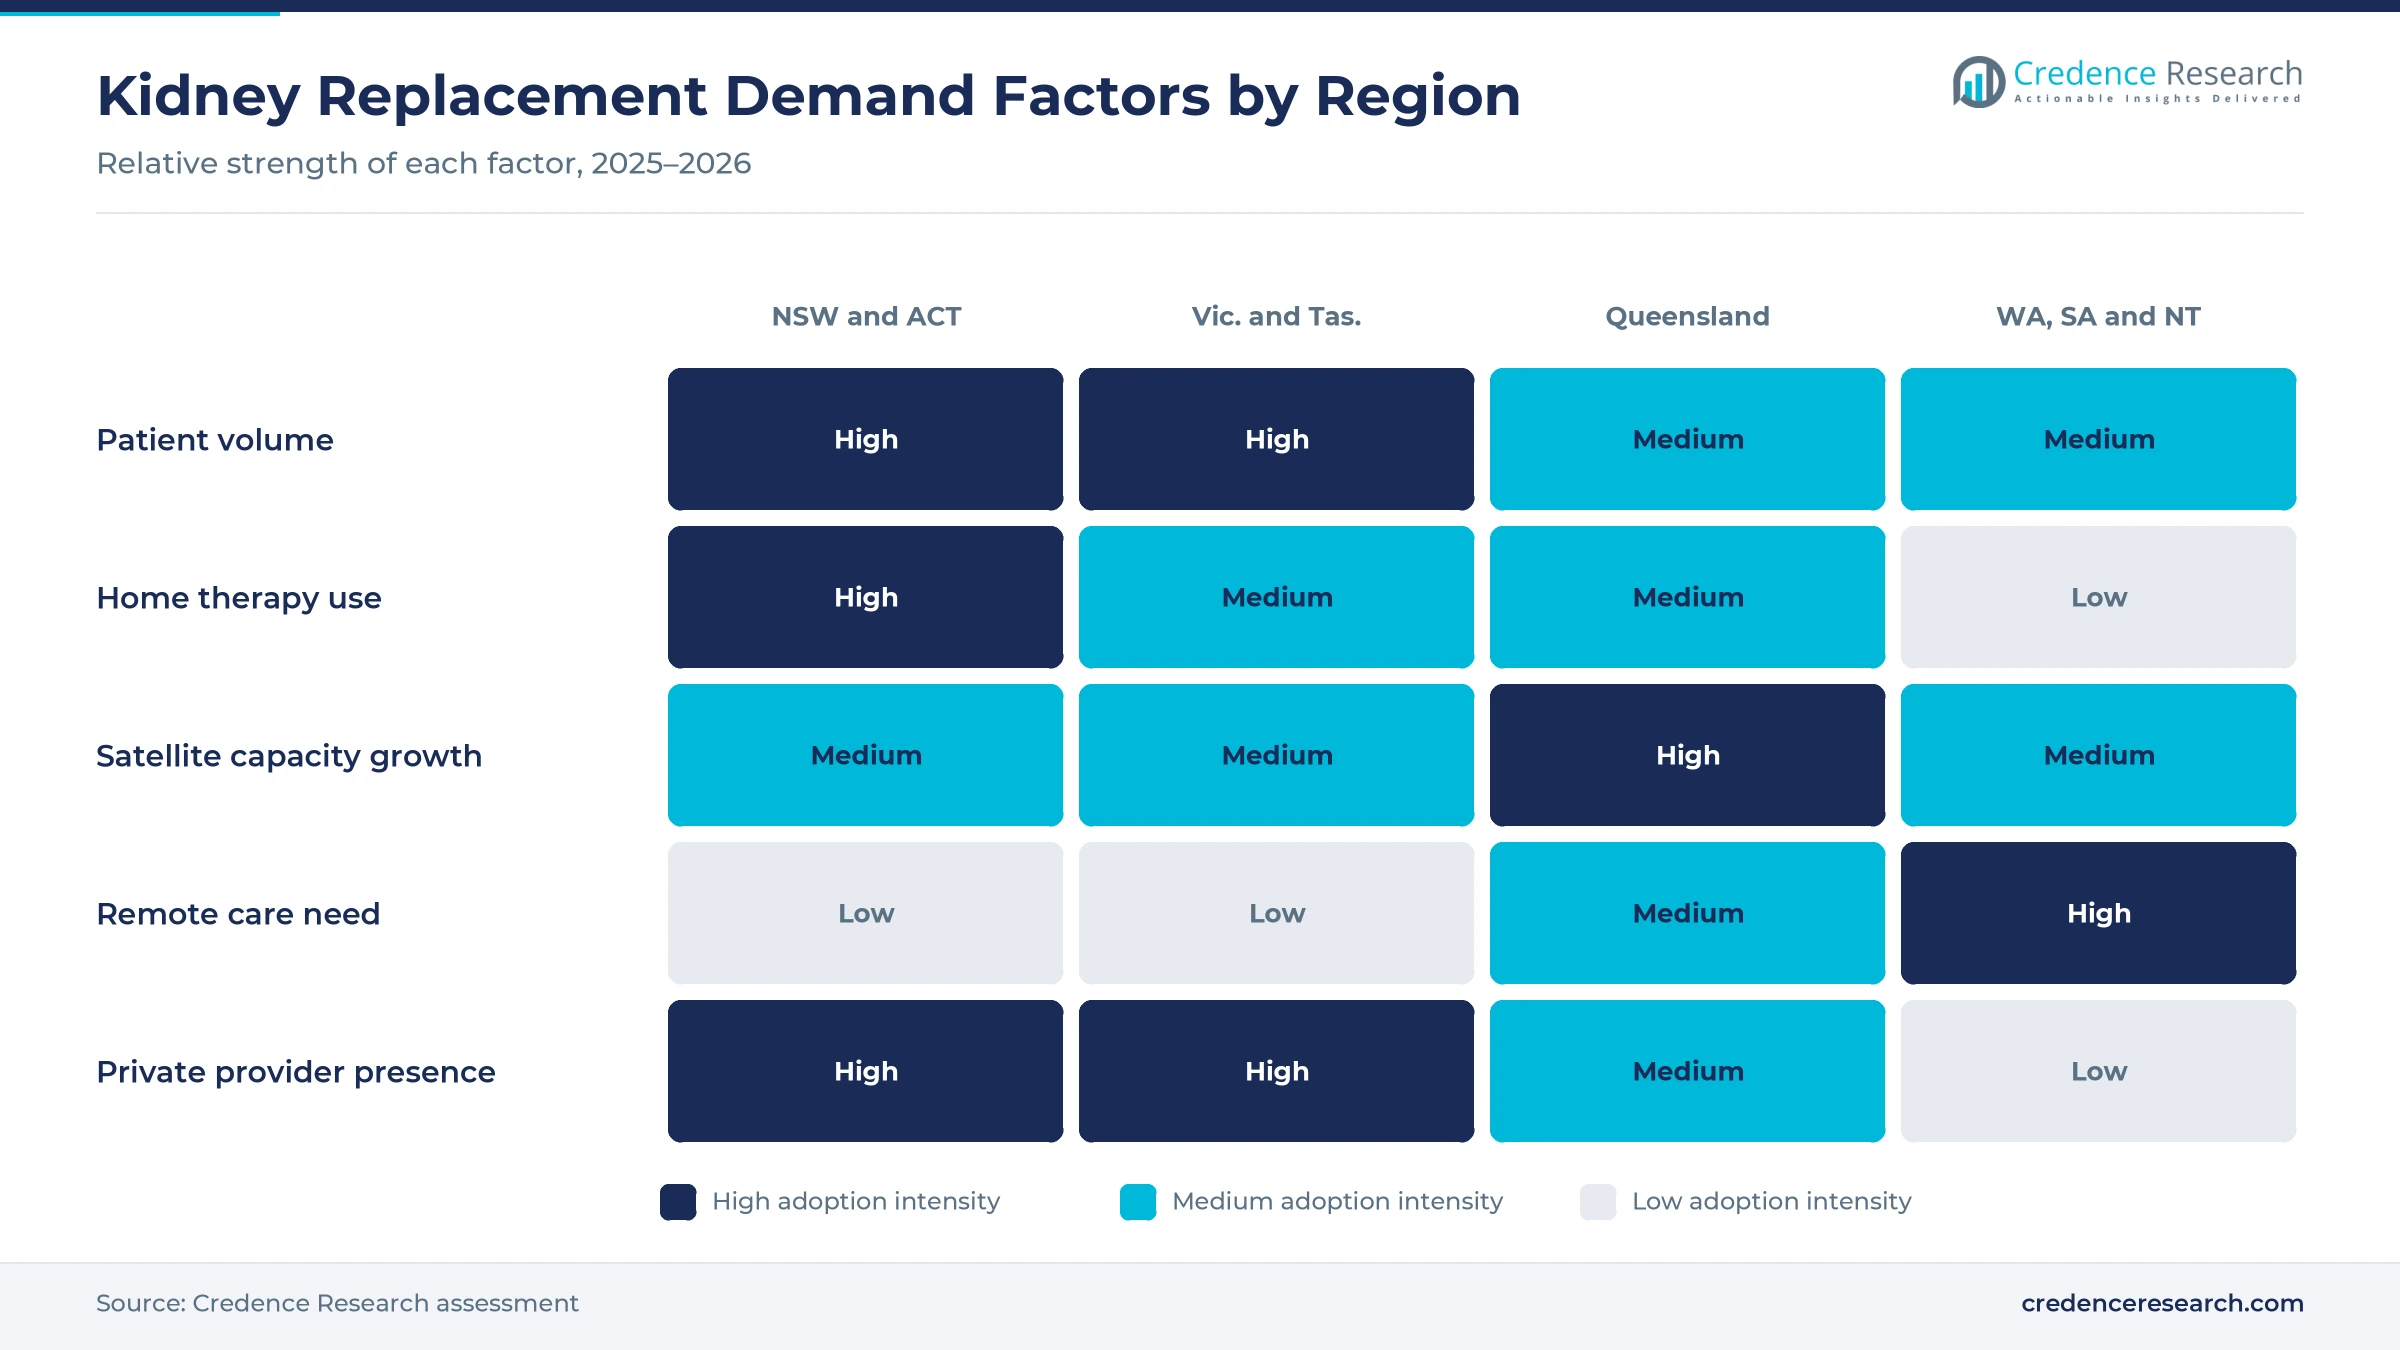
Public capacity expansion adds treatment chairs, because state health networks must meet rising local demand closer to home. In April 2025, the NSW Government committed AUD 5.2 million to a new unit at Camden Hospital and larger services at Campbelltown, Bowral and Liverpool. The project adds about 120 sessions per week and is expected to operate in 2026. In March 2025, Queensland reported an AUD 10.37 million, eight-chair satellite unit at Capricorn Coast Hospital, where about a dozen patients had traveled to Rockhampton. Consequently, satellite dialysis centres lead care settings with 47.0% of 2025 value, and new units keep opening in growing suburbs and regional towns.
How does recurring supply consumption sustain spending?
Recurring supply consumption sustains spending, because every session uses filters, blood lines, needles and fluids that cannot be reused. The registry counted 8,625 patients in satellite units, 3,871 in hospital units and 937 on home hemodialysis at the end of 2025. Another 1,811 patients used automated peritoneal dialysis and 718 used continuous ambulatory peritoneal dialysis, which both need daily fluid bags. In turn, consumable supply grows at 6.96% a year, while blood dialyzers and lines follow patient numbers closely. Contracted distribution then moves these goods to hundreds of treatment sites each week, so supply contracts grow as patient numbers climb year after year.
Why does remote funding support community-controlled care?
Remote funding supports community-controlled care, because Medicare now pays for nurse-led treatment in very remote towns. Under Medicare item 13105, each session delivered in Modified Monash 7 areas attracts a fee of AUD 708. A nephrologist must review the patient every 3 to six months, either in person or remotely. Purple House runs 20 remote clinics across the Northern Territory, Western Australia and South Australia. The Northern Territory had 821 patients on treatment in 2025, or 3,105 per million people, the highest rate nationally. As a result, community-controlled providers gain a stable funding base for local chairs, which lets more patients stay on country with family and community support.
Home therapy, filtration and remote care reshape delivery
How is home therapy rising across renal units?
The rise of home therapy is reshaping renal units, because it frees hospital chairs and lets patients treat around work and family. The registry counted 3,515 Australians on home treatment at the end of 2025, or 22% of all patients. New South Wales reached 28%, while the Northern Territory stood at 7%. Liverpool Renal Home Therapy Unit alone supported 303 home patients, including 175 on automated peritoneal dialysis. In turn, patient homes grow fastest among care settings at 7.42% a year, while renal units invest in training nurses and remote support teams in 2026. This shift also eases pressure on crowded hospital units in large cities, where chair space remains tight.
Why is hemodiafiltration gaining ground in large units?
An increasing shift toward hemodiafiltration is emerging in large units, because it removes more middle-sized toxins than conventional sessions. A registry study found that 3,339 of 23,194 Australians starting hemodialysis between 2000 and 2014, or 14.4%, received hemodiafiltration. Larger centers were far more likely to prescribe it, with an odds ratio of 26.75 for units starting 36 to 147 patients a year. In April 2026, an Australian and New Zealand study compared postoperative outcomes for the two methods. As a result, hemodiafiltration grows fastest among technologies at 7.55% a year, as more units replace older machines with models that support both methods in each session.
Can assisted home care cut hospital costs?
Assisted home care offers a clear opening, because nurse visits can replace long hospital stays for patients who cannot yet manage alone. A Western Australian program reviewed in a 2024 clinical study delivered 1,349 episodes of assisted automated peritoneal dialysis. The program cost AUD 242 per visit and AUD 7,260 per patient episode on average. By contrast, hospital stays averaged AUD 46,170 per episode and in-center hemodialysis cost AUD 9,667. The program saved AUD 1.497 million, and 73% of patients graduated to self-care. Consequently, automated peritoneal dialysis gains a clear cost case, and more health networks can fund nurse visits that keep patients out of hospital beds through 2035.
Is there room to grow through earlier kidney care?
Earlier kidney care offers room to grow, because better referral pathways bring patients to planned treatment instead of urgent starts. Glomerular disease caused 599 new cases in 2025, and hypertension or renal vascular disease caused 372 more. Familial and hereditary conditions added another 228 new patients during the same year. Specialists who manage chronic kidney disease drugs can plan access surgery and home training months ahead. In turn, providers that offer education, fistula planning and home starts can win referrals from 2026 onward, as transplant waiting lists stay long and planned starts cost less than urgent hospital admissions.
Workforce gaps, remote access and infection risk persist
How do nursing shortages limit capacity?
Nursing shortages limit capacity, because every in-center session needs trained renal nurses and technicians. Units in growing suburbs and regional towns struggle to staff extra shifts, even when chairs are available. As a result, some patients travel long distances or wait for a regular place. Training programs, home therapy and shared staffing between hospitals ease the gap, although they take years to scale. Meanwhile, agency staff raise costs for public renal units that must keep every chair running.
Why does remote access remain difficult?
Remote access remains difficult, because many patients with end-stage renal disease in central and northern Australia live far from renal units. The Northern Territory had the lowest home treatment rate at 7% in 2025. Consequently, many patients relocate to Darwin or Alice Springs, away from family and country. Remote clinics, truck services and Medicare funding help, although water quality, staffing and transport still limit expansion. Building a remote clinic also needs housing for nurses, which adds cost and delays openings.
How does infection risk affect home therapy?
Infection risk affects home therapy, because peritonitis can end peritoneal treatment and lead to hospital stays. The Western Australian assisted program recorded 0.8 episodes per patient-year, which its authors described as high. In turn, renal units must invest in training, home visits and follow-up. Strong infection control keeps patients at home, while poor results push them back to in-center care. Therefore, renal units track infection rates closely and retrain patients after every episode.
Will tender pricing squeeze supplier margins?
Tender pricing can squeeze supplier margins, because state health networks buy machines and consumables through large central contracts. Suppliers must meet strict price, service and delivery terms over several years. As a result, smaller suppliers find it hard to win share without local service teams. Bundled offers that combine machines, fluids, training and maintenance help suppliers protect their position. However, long contracts also make it harder for new technologies to enter public units quickly.
New South Wales leads as Queensland adds demand fastest
| Region | Value, 2025 (USD million) | Share, 2025 | CAGR, 2026–2035 |
|---|---|---|---|
| New South Wales and Australian Capital Territory | 331.8 | 33.7% | 6.60% |
| Victoria and Tasmania | 242.2 | 24.6% | 6.45% |
| Western Australia, South Australia and Northern Territory | 223.5 | 22.7% | 6.70% |
| Queensland | 187.1 | 19.0% | 6.90% |
Why do New South Wales and the ACT lead spending?
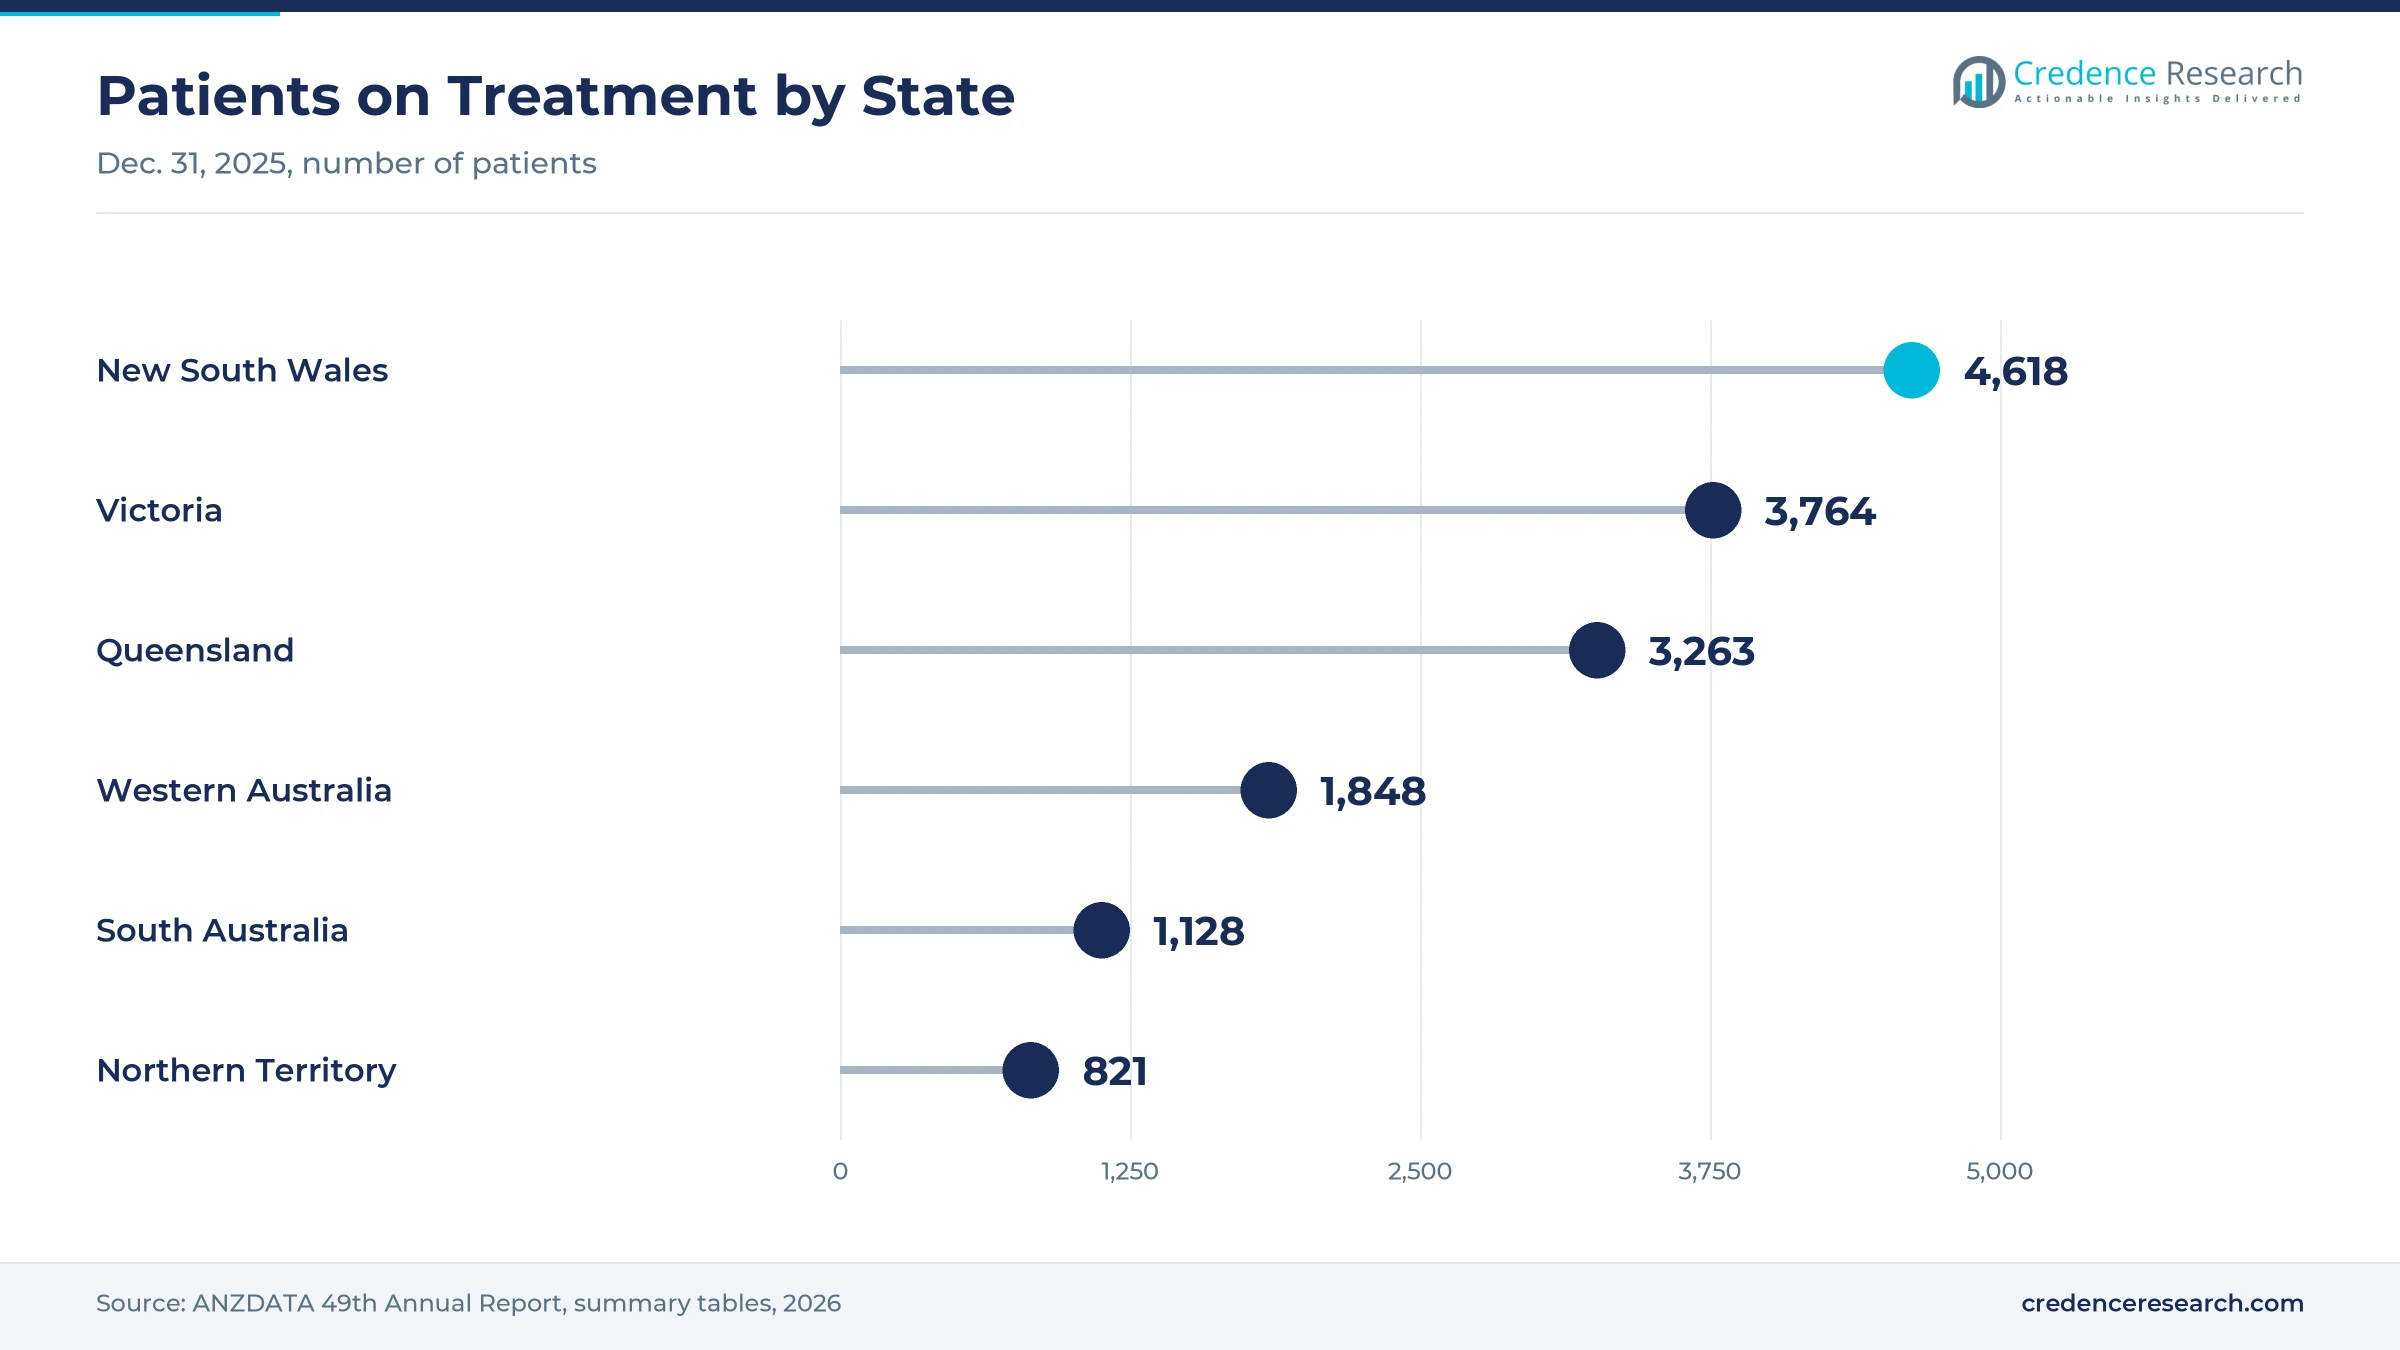
New South Wales and Australian Capital Territory held a 33.7% share of 2025 value and grow at 6.60% a year. New South Wales treated 4,618 patients and the capital territory treated 334 at the end of 2025. New South Wales also had the highest home treatment rate at 28%. As a result, large Sydney networks and strong home programs keep this zone in the lead, while Canberra Hospital serves patients from the capital territory and nearby New South Wales towns.
How do Victoria and Tasmania organize treatment?
Victoria and Tasmania held a 24.6% share of 2025 value and grow at 6.45% a year. Victoria treated 3,764 patients and Tasmania treated 235 at the end of 2025. Victoria relies heavily on satellite units, which served 2,471 patients across metropolitan and regional networks. In turn, steady chair demand and private units in Melbourne support stable growth through 2035, as networks in Melbourne and Geelong add chairs in growing outer suburbs.
Why is Queensland the fastest-growing region?
Queensland held a 19.0% share of 2025 value and grows fastest at 6.90% a year. The state treated 3,263 patients at the end of 2025, including 1,232 in satellite units. Queensland Health is building new chairs in regional towns, such as the eight-chair unit at Capricorn Coast Hospital. Consequently, regional expansion and population growth lift demand faster than in other zones, while private units in Brisbane and the Gold Coast add capacity for insured patients.
How do the western, southern and northern states compare?
Western Australia, South Australia and Northern Territory held a 22.7% share of 2025 value and grow at 6.70% a year. Western Australia treated 1,848 patients, South Australia 1,128 and the Northern Territory 821. As a result, remote care and community clinics shape demand across this zone.
Registry data, new units and ownership changes since 2024
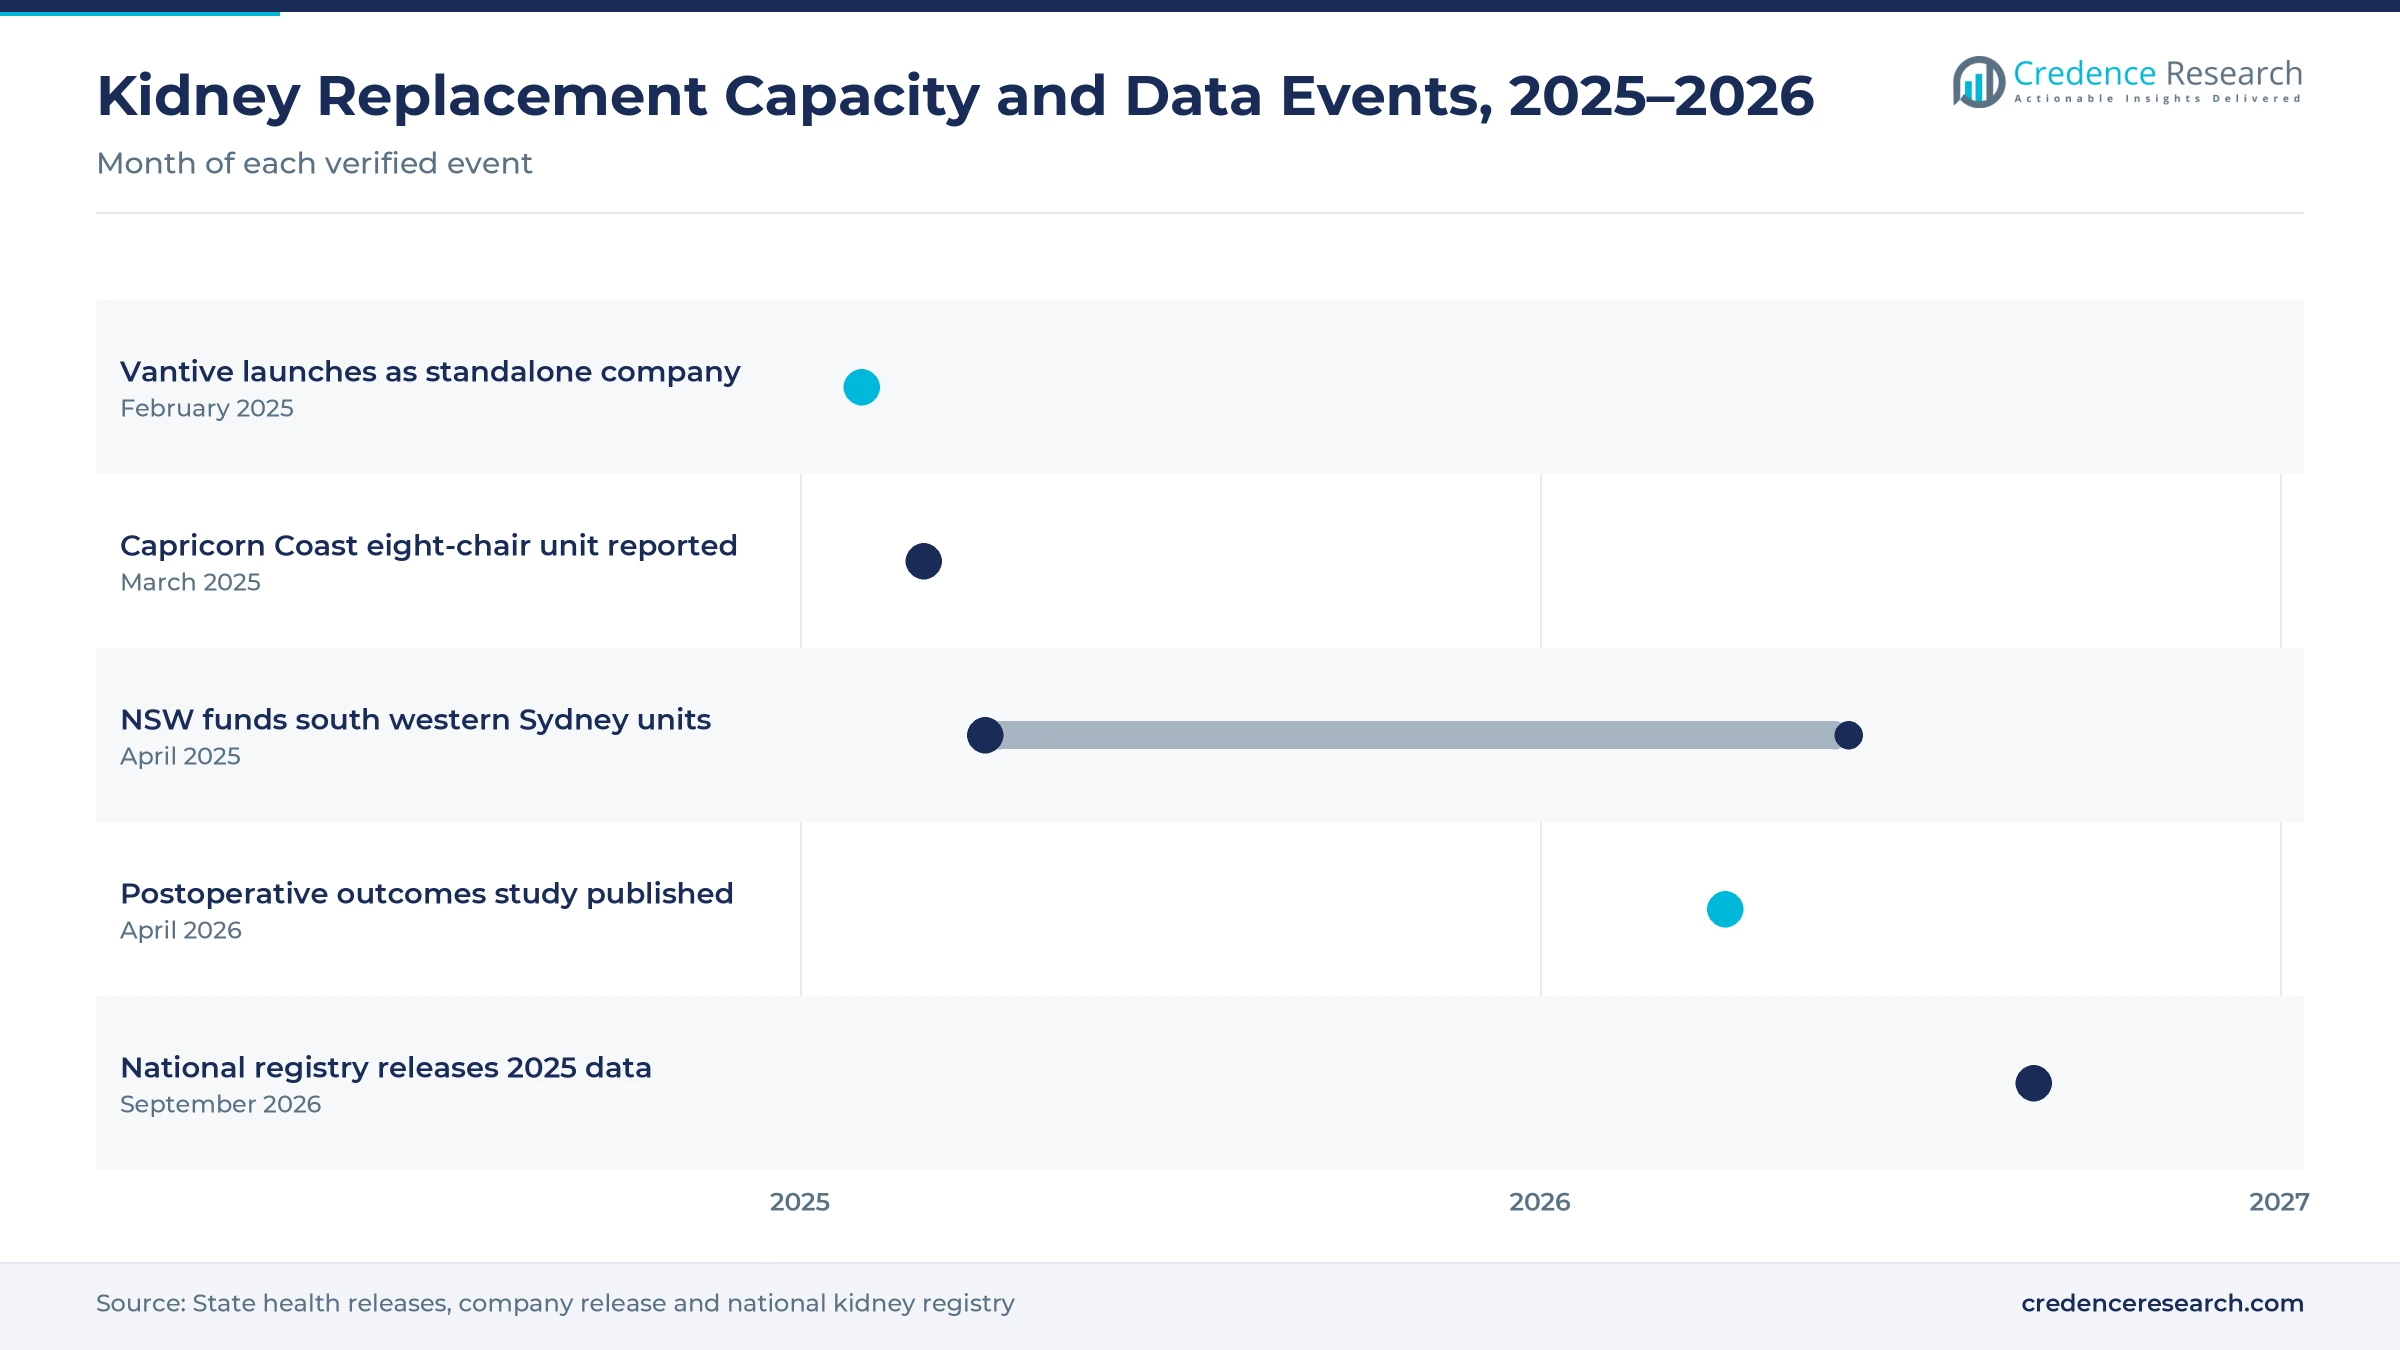
| Development | Status and market relevance |
|---|---|
| In February 2025, Baxter's kidney care business launched as Vantive, a standalone company owned by funds managed by Carlyle. | New ownership |
| In March 2025, Queensland reported an AUD 10.37 million, eight-chair satellite unit at Capricorn Coast Hospital. | Regional capacity |
| In April 2025, the NSW Government committed AUD 5.2 million to new and expanded units in south western Sydney. | About 120 sessions a week |
| In April 2026, an Australian and New Zealand registry study compared postoperative outcomes of hemodiafiltration and hemodialysis. | Clinical evidence |
| In September 2026, the national kidney registry released 2025 data showing 16,011 Australians on treatment. | 22% treated at home |
Filtration, automated home cycling and remote monitoring
- Hemodiafiltration machines combine diffusion and convection, which helps larger units clear more middle-sized toxins per session.
- Automated cyclers run peritoneal exchanges overnight at home, which lets patients work and study during the day.
- Remote monitoring software sends treatment data from home machines to renal nurses, which supports earlier action on problems.
- Vascular access tools such as vascular access catheters and fistula needles shape session quality and infection risk.
Need a Custom Version of This Report?
Tailor the scope, geography, or segments to your exact requirements.
- Custom geography or segment scope
- Direct access to our analyst team
Global suppliers and private operators share the field
Competition combines global machine and consumable makers, private treatment operators and public renal networks. Fresenius Medical Care supplies machines and consumables and runs private units, including a Sunshine center in Melbourne listed in national registry data. Vantive launched as a standalone company in February 2025 after Carlyle funds acquired the kidney care business of Baxter, and it runs an Australian website for clinicians and patients. B.Braun operates renal care centers in Queensland, New South Wales and Victoria, such as Gregory Hills, Lindfield and Diamond Valley. Suppliers compete on machine reliability, filter performance, home therapy support, training and service response, while state tenders reward lower lifetime cost. In turn, operators that link in-center care with home programs and remote monitoring are best placed to win long-term contracts.
Companies profiled and their roles in this market
| Company | Type | Role in the market |
|---|---|---|
| Fresenius Medical Care | Supplier and operator | Machines, consumables and private treatment centers |
| Vantive Health LLC | Supplier | Home and in-center kidney care products after its February 2025 launch |
| B. Braun Melsungen AG | Supplier and operator | Renal care centers in Queensland, New South Wales and Victoria |
Credence Research view on kidney replacement spending
Credence Research's view is that Australian spending on kidney replacement will grow steadily through 2035, as new patients outnumber those who leave treatment. Clinical services should keep the largest share, while home therapy, hemodiafiltration and consumables grow faster. Queensland will add demand fastest, although New South Wales and the capital territory keep the largest share. However, providers that solve nursing shortages and support remote patients will capture the most growth. Suppliers that combine machines, consumables and home support in one contract should also gain share in public tenders.
How the kidney replacement estimate was built
The report uses 2025 as the base year, with values in USD million at current prices. Market values come from the Credence Research model, which combines patient numbers, treatment methods, session counts, consumable use and equipment replacement. Regional shares follow the client zone split, and segment splits by service type, care setting, technology and disease area are Credence Research estimates. Sources used are national registry tables, state health releases, Medicare schedules, published clinical studies and company websites, and no interviews or surveys were used.
Capacity growth and home care shape demand to 2035
The market is expected to reach USD 1.87 billion by 2035, a 6.64% CAGR during 2026–2035, as new patients, more chairs and steady supply use lift spending. Growth should be strongest in home therapy, hemodiafiltration, consumables and Queensland, while New South Wales and the capital territory keep the largest share. Remote care funding should also support more community clinics in remote towns. In contrast, nursing shortages and slow home training could keep more patients in hospital units and limit growth.
Frequently Asked Questions
How big is the Australia hemodialysis and peritoneal dialysis market?
Which region leads kidney replacement spending?
Which region grows fastest?
Which service type holds the largest share?
How many Australians were on treatment in 2025?
How common is home treatment in Australia?
Who are the leading participants in this market?
What are the main risks to growth?
Table of Content
Chapter 1 Market Segmentation
- 1.1 Segmentation Framework
- 1.1.1 Product and Service Classification
- 1.1.2 Application and End-Use Classification
- 1.1.3 Technology and Solution Classification
- 1.1.4 Customer and Distribution Channel Classification
- 1.1.5 Geographic Segmentation
- 1.1.6 Market Segment Definitions and Boundaries
- 1.2 By Service Type
- 1.2.1 Clinical Service Delivery
- 1.2.2 Consumable Supply
- 1.2.3 Capital Equipment Provision
- 1.3 By Care Setting
- 1.3.1 Hospital Renal Units
- 1.3.2 Satellite Dialysis Centres
- 1.3.3 Patient Homes
- 1.4 By Technology
- 1.4.1 Conventional Hemodialysis
- 1.4.2 Hemodiafiltration
- 1.4.3 Automated Peritoneal Dialysis
- 1.4.4 Continuous Ambulatory Peritoneal Dialysis
- 1.5 By Disease Area
- 1.5.1 Diabetic Kidney Disease
- 1.5.2 Glomerular Disease
- 1.5.3 Hypertensive Kidney Disease
- 1.5.4 Remaining Recorded Kidney Diagnoses
Chapter 2 Introduction
- 2.1 Report Objectives and Scope
- 2.2 Product Definition and Industry Terminology
- 2.3 Market Inclusions and Exclusions
- 2.4 Research Process
- 2.4.1 Primary Research and Expert Interviews
- 2.4.2 Secondary Research and Source Review
- 2.4.3 Top-Down and Bottom-Up Estimation
- 2.4.4 Data Triangulation and Verification
- 2.5 Market Size Measurement Basis
- 2.5.1 2025: USD 984.5 million → 2035: USD 1.87 billion
- 2.6 Historical and Forecast Reference Periods
- 2.6.1 Historical Period: 2018-2025
- 2.6.2 Base Year: 2025
- 2.6.3 Forecast Period: 2025-2035
- 2.7 Research Assumptions and Limitations
Chapter 3 Executive Summary
- 3.1 Market Snapshot and Key Findings
- 3.2 Base-Year Market Size, 2025
- 3.3 Forecast Market Size, 2035
- 3.4 Revenue and Volume Growth Outlook
- 3.5 Key Demand and Supply Indicators
- 3.6 Leading Market Segments
- 3.7 Fastest-Growing Market Opportunities
- 3.8 Regional Performance Highlights
- 3.9 Technology and Industry Transformation
- 3.10 Competitive Landscape Summary
- 3.11 Analyst View and Strategic Implications
Chapter 4 Australia Hemodialysis and Peritoneal Dialysis Market Trends and Developments
- 4.1 Historical Industry Development, 2018-2025
- 4.2 Recent Market Trends and Developments
- 4.3 Demand and Customer Behavior Trends
- 4.4 Technology and Product Innovation
- 4.5 Artificial Intelligence, Automation and Digitalization
- 4.6 Local Manufacturing and Supply Chain Realignment
- 4.7 Industry Partnerships, Mergers and Acquisitions
- 4.8 Sustainability and Circular Economy Developments
- 4.9 Government and Private Sector Investment Trends
- 4.10 Emerging Business Models and Commercialization
- 4.11 Industry Developments and Announcements
Chapter 5 Australia Hemodialysis and Peritoneal Dialysis Market Production, Supply and Demand Analysis
- 5.1 Demand Trend and Consumption Analysis, 2018-2025
- 5.2 Demand Forecast, 2025-2035
- 5.3 Production and Output Trend, 2018-2025
- 5.4 Production and Output Forecast, 2025-2035
- 5.5 Installed Capacity and Capacity Utilization
- 5.6 Company-Wise Production Plants and Statistics
- 5.6.1 Installed Production Capacity
- 5.6.2 Actual Production
- 5.6.3 Planned Capacity and Expansion Targets
- 5.7 Supply Chain Structure and Procurement Trends
- 5.8 Supply-Demand Gap and Bottlenecks
- 5.9 Import Dependence and Sourcing Structure
- 5.10 Contract Manufacturing and Outsourcing
- 5.11 Regional Supply and Demand Concentration
Chapter 6 Australia Hemodialysis and Peritoneal Dialysis Market Pricing Analysis
- 6.1 Pricing Structure and Measurement
- 6.2 Historical Pricing Trends, 2018-2025
- 6.3 Pricing Outlook, 2025-2035
- 6.4 Average Selling Price and Unit Economics
- 6.5 Pricing by Product and Market Segment
- 6.6 Geographic Pricing Differences
- 6.7 Key Input, Energy, Labor and Logistics Costs
- 6.8 Contract Pricing and Purchasing Models
- 6.9 Pricing Sensitivity and Competitive Positioning
- 6.10 Price, Margin and Profitability Implications
Chapter 7 Australia Hemodialysis and Peritoneal Dialysis Market Dynamics
- 7.1 Market Growth Drivers
- 7.1.1 Demand-Side Drivers
- 7.1.2 Technology and Innovation Drivers
- 7.1.3 Infrastructure and Investment Drivers
- 7.1.4 Regulatory and Policy Drivers
- 7.2 Market Restraints
- 7.2.1 Cost and Affordability Constraints
- 7.2.2 Technology and Adoption Barriers
- 7.2.3 Supply Chain and Operational Constraints
- 7.3 Market Challenges
- 7.3.1 Competitive Pressure and Margin Erosion
- 7.3.2 Skills, Infrastructure and Implementation Gaps
- 7.4 Emerging Market Opportunities
- 7.5 Market Dynamics Impact and Time-Horizon Assessment
Chapter 8 Australia Hemodialysis and Peritoneal Dialysis Value Chain Analysis
- 8.1 Industry Value Chain Overview
- 8.2 Upstream Suppliers and Critical Inputs
- 8.3 Technology and Component Providers
- 8.4 Manufacturing or Service Delivery
- 8.5 Distribution, Channel Partners and Integrators
- 8.6 Downstream Applications and End Users
- 8.7 Value Addition and Profit Pools
- 8.8 Vertical Integration and Outsourcing
- 8.9 Supplier Concentration and Risk
- 8.10 Supply Chain Localization and Resilience
Chapter 9 Australia Hemodialysis and Peritoneal Dialysis Market Regulations and Policies
- 9.1 Relevant Laws, Standards and Compliance Frameworks
- 9.2 Product, Service, Safety and Quality Requirements
- 9.3 Government Policies, Incentives and Subsidies
- 9.4 Imports, Exports and Trade Barriers
- 9.5 Public Procurement and Local Content Requirements
- 9.6 Environmental and Sustainability Compliance
- 9.7 Upcoming Policy Changes and Market Implications
Chapter 10 Australia Hemodialysis and Peritoneal Dialysis Market Hotspots and Opportunities
- 10.1 Market Opportunity Mapping and Growth Hotspots
- 10.2 High-Growth Applications and Customer Groups
- 10.3 Underserved Markets and White-Space Opportunities
- 10.4 Emerging Technology and Product Opportunities
- 10.5 New Capacity and Investment Hotspots
- 10.6 Market Entry and Expansion Opportunities
- 10.7 Distribution and Partnership Opportunities
- 10.8 Near-Term and Long-Term Commercial Potential
- 10.9 Opportunity Attractiveness and Execution Risks
Chapter 11 Australia Hemodialysis and Peritoneal Dialysis Market Outlook, 2025-2035
- 11.1 Market Size and Analysis
- 11.1.1 Revenue (Market Measurement: 2025: USD 984.5 million → 2035: USD 1.87 billion)
- 11.1.2 Market Volume and Quantity Sold
- 11.1.3 Historical Market Size, 2018-2025
- 11.1.4 Base-Year Market Size, 2025
- 11.2 Market Forecast, 2025-2035
- 11.2.1 Revenue Forecast to 2035
- 11.2.2 Volume Forecast to 2035
- 11.2.3 CAGR and Year-on-Year Growth
- 11.2.4 Incremental Revenue Opportunity
- 11.3 Forecast Assumptions and Scenario Analysis
- 11.3.1 Base-Case Forecast
- 11.3.2 Optimistic and Conservative Scenarios
- 11.3.3 Technology, Pricing and Policy Sensitivities
- 11.4 Market Attractiveness and Growth Outlook
Chapter 12 Australia Hemodialysis and Peritoneal Dialysis Market Segmentation and Outlook
- 12.1 Segmentation Summary and Market Shares, 2025
- 12.2 Largest and Fastest-Growing Segments
- 12.3 By Service Type - Market Size and Forecast, 2025-2035
- 12.3.1 Segment Definition and Scope
- 12.3.2 Historical Market Size, 2018-2025
- 12.3.3 Revenue Forecast, 2025-2035
- 12.3.4 Volume Forecast, 2025-2035
- 12.3.5 Base-Year Market Share, 2025
- 12.3.6 Segment CAGR and Growth Drivers
- 12.3.7 Subsegment Market Size and Forecast
- 12.3.7.1 Clinical Service Delivery
- 12.3.7.2 Consumable Supply
- 12.3.7.3 Capital Equipment Provision
- 12.3.8 Subsegment Pricing and Adoption Trends
- 12.3.9 Leading Suppliers and Competition
- 12.3.10 Regional Demand and Opportunities
- 12.4 By Care Setting - Market Size and Forecast, 2025-2035
- 12.4.1 Segment Definition and Scope
- 12.4.2 Historical Market Size, 2018-2025
- 12.4.3 Revenue Forecast, 2025-2035
- 12.4.4 Volume Forecast, 2025-2035
- 12.4.5 Base-Year Market Share, 2025
- 12.4.6 Segment CAGR and Growth Drivers
- 12.4.7 Subsegment Market Size and Forecast
- 12.4.7.1 Hospital Renal Units
- 12.4.7.2 Satellite Dialysis Centres
- 12.4.7.3 Patient Homes
- 12.4.8 Subsegment Pricing and Adoption Trends
- 12.4.9 Leading Suppliers and Competition
- 12.4.10 Regional Demand and Opportunities
- 12.5 By Technology - Market Size and Forecast, 2025-2035
- 12.5.1 Segment Definition and Scope
- 12.5.2 Historical Market Size, 2018-2025
- 12.5.3 Revenue Forecast, 2025-2035
- 12.5.4 Volume Forecast, 2025-2035
- 12.5.5 Base-Year Market Share, 2025
- 12.5.6 Segment CAGR and Growth Drivers
- 12.5.7 Subsegment Market Size and Forecast
- 12.5.7.1 Conventional Hemodialysis
- 12.5.7.2 Hemodiafiltration
- 12.5.7.3 Automated Peritoneal Dialysis
- 12.5.7.4 Continuous Ambulatory Peritoneal Dialysis
- 12.5.8 Subsegment Pricing and Adoption Trends
- 12.5.9 Leading Suppliers and Competition
- 12.5.10 Regional Demand and Opportunities
- 12.6 By Disease Area - Market Size and Forecast, 2025-2035
- 12.6.1 Segment Definition and Scope
- 12.6.2 Historical Market Size, 2018-2025
- 12.6.3 Revenue Forecast, 2025-2035
- 12.6.4 Volume Forecast, 2025-2035
- 12.6.5 Base-Year Market Share, 2025
- 12.6.6 Segment CAGR and Growth Drivers
- 12.6.7 Subsegment Market Size and Forecast
- 12.6.7.1 Diabetic Kidney Disease
- 12.6.7.2 Glomerular Disease
- 12.6.7.3 Hypertensive Kidney Disease
- 12.6.7.4 Remaining Recorded Kidney Diagnoses
- 12.6.8 Subsegment Pricing and Adoption Trends
- 12.6.9 Leading Suppliers and Competition
- 12.6.10 Regional Demand and Opportunities
- 12.7 Segment Growth Comparison
- 12.8 Segment Attractiveness and Priority Matrix
Chapter 13 Australia Hemodialysis and Peritoneal Dialysis Geographic Market Outlook, 2025-2035
- 13.1 Domestic Market Distribution and Demand Clusters
- 13.2 State- or Province-Wise Market Size and Forecast, 2025-2035
- 13.3 City and Metropolitan Market Outlook
- 13.4 Industrial, Manufacturing and Commercial Clusters
- 13.5 Geographic Concentration of Key End Users
- 13.6 Local Pricing and Purchasing Differences
- 13.7 Domestic Production Facilities and Capacity Map
- 13.8 Local Infrastructure and Project Pipeline
- 13.9 State-Level Policy and Incentive Differences
- 13.10 Subnational Investment Hotspots and Opportunities
- 13.11 Distribution and Logistics Networks
- 13.12 Domestic Competitive Footprint
Chapter 14 Australia Hemodialysis and Peritoneal Dialysis Technology, Innovation and Sustainability Outlook
- 14.1 Technology Landscape and Maturity
- 14.2 Product, Process and Service Innovation
- 14.3 AI, Automation and Digital Tools in the Industry
- 14.4 Technology Adoption and Performance Benchmarking
- 14.5 Innovation Pipeline and R&D Investment
- 14.6 Patent and Intellectual Property Trends
- 14.7 Energy Efficiency and Resource Management
- 14.8 Sustainability, Recycling and Circularity
- 14.9 Technology Roadmap, 2025-2035
- 14.10 Risks of Obsolescence and Technology Substitution
Chapter 15 Australia Hemodialysis and Peritoneal Dialysis Market Key Strategic Imperatives
- 15.1 Growth and Market Entry Priorities
- 15.2 High-Return Products and Segments
- 15.3 Pricing, Profitability and Cost Optimization
- 15.4 Technology Investment and Product Differentiation
- 15.5 Supply Chain Localization and Resilience
- 15.6 Distribution and Customer Acquisition
- 15.7 Partnership, Acquisition and Capacity Strategy
- 15.8 Regional Expansion Priorities
- 15.9 Short-, Medium- and Long-Term Actions
Chapter 16 Competition Outlook
- 16.1 Industry Competition Characteristics
- 16.2 Market Structure and Concentration
- 16.3 Market Share and Competitive Positioning, 2025
- 16.4 Company-Wise Revenue and Product Benchmarking
- 16.5 Production and Service Capacity Benchmarking
- 16.6 Technology, Pricing and Differentiation
- 16.7 Regional Footprint and Distribution Strength
- 16.8 Mergers, Acquisitions and Strategic Alliances
- 16.9 New Entrants and Competitive Threats
- 16.10 Porter's Five Forces and Industry Attractiveness
- 16.11 Competitive Outlook, 2025-2035
Chapter 17 Company Profiles
- 17.1 Company Coverage and Selection Criteria
- 17.2 Fresenius Medical Care
- 17.2.1 Business Description
- 17.2.2 Company Ownership and Geographic Presence
- 17.2.3 Product and Service Portfolio
- 17.2.4 Manufacturing and Operating Footprint
- 17.2.5 Production Capacity and Expansion Plans
- 17.2.6 Financial Performance and Investment
- 17.2.7 Market Share and Competitive Position
- 17.2.8 Technology and Innovation Capabilities
- 17.2.9 Strategic Alliances or Partnerships
- 17.2.10 Recent Developments
- 17.2.11 Growth Strategy and Outlook
- 17.3 Vantive Health LLC
- 17.4 B. Braun Melsungen AG
- 17.5 Nipro Corporation
- 17.6 Asahi Kasei Medical Co., Ltd.
- 17.7 Nikkiso Co., Ltd.
- 17.8 Becton, Dickinson and Company
- 17.9 Toray Medical Co., Ltd.
- 17.10 Teleflex Incorporated
- 17.11 Merit Medical Systems, Inc.
- 17.12 Other Relevant Market Participants
Note: Every listed company is profiled on the structure shown under the first company. The company list is preliminary and may change based on research findings, market developments, data availability and client requirements.
Chapter 18 Disclaimer
- 18.1 Research and Forecast Disclaimer
- 18.2 Data Source and Estimation Limitations
Note: The depth of individual sections depends on data availability for this market. Volume, capacity, trade and other unit-based metrics are included where applicable.

